
A Review of Odd-Chain Fatty Acid Metabolism and the Role of Pentadecanoic Acid (C15:0) and Heptadecanoic Acid (C17:0) in Health and Disease


Abstract
:
1. Introduction
2. Discussion
2.1. A Quantitative Internal Standard (Q-Int. Std.)

| (A) | NEFA | PL | |||||||||
|---|---|---|---|---|---|---|---|---|---|---|---|
| Saturated Fatty Acid | n = 14, [21] | n = 15, [22] | n = 27, [23] | n = 200, [24] | n = *, [25] | n = 1224, [26] | n = 15164, [27] | n = 4930, [12] | n = 195, [28] | n = 178, [29] | n = 2657, [3] |
| 12:0 | * | 0.65 | 0.31 | 0.02 | 0.33 | 0.07 | * | * | * | * | * |
| 12:1 | * | * | 0.065 | * | * | * | * | * | * | * | * |
| 13:0 | * | * | * | * | * | * | * | * | * | * | * |
| 14:0 | 3.5 | 2.96 | 1.93 | 0.74 | 2.79 | 0.69 | 0.36 | * | 0.27 | 0.32 | * |
| 14:1 | * | * | 0.23 | 0.04 | * | * | * | * | * | * | * |
| 15:0 | * | 0.88 | 0.4 | 0.17 | 0.30 | 0.23 | 0.21 | * | 0.15 | 0.15 | * |
| 15:1 | * | * | * | * | * | * | * | * | * | * | * |
| 16:0 | 35.2 | 35.38 | 26.66 | 22.78 | 29.39 | 30.54 | 29.93 | * | 25.34 | 26.3 | 25.3 |
| 16:1 | 2.7 | 2.01 | 5.5 | 2.64 | 6.77 | 0.95 | * | * | 0.65 | 0.79 | 0.63 |
| 16:2 | * | * | 0.05 | * | * | * | * | * | * | * | * |
| 17:0 | * | 1.25 | 0.45 | 0.28 | 0.55 | * | 0.41 | * | 0.33 | 0.41 | * |
| 17:1 | * | 0.3 | 0.38 | * | 0.47 | * | * | * | * | * | * |
| 17:2 | * | * | 0.009 | * | * | * | * | * | * | * | * |
| 18:0 | 40.7 | 31.57 | 7.82 | 6.76 | 10.18 | 13.11 | 14.05 | * | 14.1 | 11.6 | 13.2 |
| 18:1 | 8.7 | * | 40.37 | 22.45 | 36.99 | 10.44 | * | * | 12.31 | 9.7 | 8.66 |
| 18:2 | 9.2 | 7.53 | 9.96 | * | 7.00 | 20.91 | * | * | 23.09 | 27.3 | 22.1 |
| 18:3 | * | 0.64 | 1.39 | 0.49 | 0.53 | 0.30 | * | * | 0.09 | 0.24 | 0.26 |
| 18:4 | * | * | 0.017 | * | 0.0074 | * | * | * | * | * | * |
| 19:0 | * | * | 0.04 | * | * | * | * | * | * | * | * |
| 19:1 | * | * | 0.17 | * | * | * | * | * | * | * | * |
| 19:2 | * | * | 0.014 | * | * | * | * | * | * | * | * |
| 20:0 | * | 0.89 | 0.044 | 0.19 | 0.11 | 0.24 | 0.13 | * | 0.03 | * | * |
| 20:1 | * | * | 0.48 | 0.14 | * | 0.08 | * | * | 0.28 | * | * |
| 20:2 | * | * | 0.22 | * | 0.16 | 0.40 | * | * | 0.37 | * | * |
| 20:3 | * | 0.6 | 0.23 | 0.01 | 0.45 | 3.25 | * | * | 3.4 | 4.09 | 3.28 |
| 20:4 | * | 0.36 | 0.68 | * | 1.35 | 10.97 | * | * | 10.61 | 8.98 | 11.4 |
| 20:5 | * | 0.66 | 0.107 | 0.34 | 0.20 | 0.84 | * | * | 1.65 | 1.03 | 0.56 |
| 22:0 | * | * | 0.015 | 0.48 | 0.074 | 0.64 | 0.23 | * | * | * | * |
| 22:1 | * | * | 0.042 | * | 0.013 | * | * | * | * | * | * |
| 22:2 | * | * | 0.008 | * | 0.0051 | * | * | * | * | * | * |
| 22:3 | * | * | 0.01 | * | 0.0018 | * | * | * | * | * | * |
| 22:4 | * | 1.74 | 0.12 | * | 0.17 | 0.41 | * | * | 0.33 | * | * |
| 22:5 | * | * | 0.22 | 0.41 | 0.18 | 1.18 | * | * | 1.45 | 1.25 | * |
| 22:6 | * | * | 0.50 | 1.49 | 0.46 | 3.37 | * | * | 5.41 | 4.03 | 2.76 |
| 23:0 | * | * | * | * | 0.015 | * | 0.10 | * | * | * | * |
| 24:0 | * | * | 0.02 | * | 0.12 | 0.46 | 0.22 | * | * | * | * |
| 24:1 | * | * | 0.045 | * | 0.032 | 0.78 | * | * | * | * | * |
| Total MUFA | * | * | 47.41 | 25.91 | * | * | * | 11.61 | 13.25 | * | 10 |
| Total PUFA | * | * | 13.70 | * | * | * | * | * | * | * | 42.7 |
| n6-PUFA | * | 7.77 | 11.3 | * | * | * | * | 38.24 | 38.06 | * | * |
| n3-PUFA | * | 1.01 | 2.24 | 2.62 | * | * | * | 7.81 | * | * | * |
| Trans FA | * | * | * | * | * | * | * | 0.1 | * | * | * |
| Total OCFA | * | * | 0.22 | 0.45 | 1.34 | * | * | 0.6 | 0.49 | * | * |
| Total SFA | * | * | * | 31.85 | * | * | * | 39.95 | 40.19 | * | 40.5 |
| UNITS | % of total free fatty acids | % total phospholipid fatty acid | |||||||||
| (B) | CE | GL (TAG’s) | ||||||||
|---|---|---|---|---|---|---|---|---|---|---|
| Saturated Fatty Acid | n = 2657, [3] | n = 29, [31] | n = 3570, [32] | n = *, [25] | n = 25, [30] | n = 25, [30] | n = 7, [33] | n = 22, [35] | n = 8, [34] | n = 19, [36] |
| 12:0 | * | 0 | * | * | * | * | * | * | 0.17 | * |
| 12:1 | * | * | * | * | * | * | * | * | * | * |
| 13:0 | * | 0 | * | * | * | * | * | * | * | * |
| 14:0 | * | 0.43 | * | 2.17 | 1.03 | 1.62 | 1.9 | 1.07 | 2.03 | 4.27 |
| 14:1 | * | 0.04 | * | 0.81 | * | * | * | * | * | * |
| 15:0 | * | 0 | * | 0.81 | * | * | * | * | * | 0.67 |
| 15:1 | * | * | * | 0.81 | * | * | * | * | * | * |
| 16:0 | 9.95 | 12.41 | 10.04 | 5.15 | 10.71 | 21.73 | 26.7 | 24.37 | 25.08 | 30.59 |
| 16:1 | 2.51 | 4.06 | * | 3.01 | 3.16 | 4.51 | 3.2 | 3.42 | * | 8.38 |
| 16:2 | * | * | * | 0.84 | * | * | * | * | * | * |
| 17:0 | * | 0.04 | * | 0.87 | * | * | 0.8 | * | * | * |
| 17:1 | * | 0.2 | * | 0.84 | * | * | * | * | * | * |
| 17:2 | * | * | * | * | * | * | * | * | * | * |
| 18:0 | 0.9 | 0.96 | * | 1.60 | 2.39 | 3.29 | 5.9 | 2.52 | 2.52 | 3.15 |
| 18:1 | 16 | 22.78 | 15.99 | 14.46 | 18.33 | 42.66 | 43.9 | 44.83 | 35.73 | 34.71 |
| 18:2 | 54.3 | 47.81 | 54.16 | 49.36 | 53.59 | 20.03 | 14.4 | 20.36 | 23.3 | 10.96 |
| 18:3 | 1.43 | 0.47 | * | 3.99 | 1.52 | 2.13 | * | 0.48 | 1.74 | 1.13 |
| 18:4 | * | * | * | * | * | * | * | 0 | * | * |
| 19:0 | * | 0 | * | * | * | * | * | * | * | * |
| 19:1 | * | * | * | * | * | * | * | * | * | * |
| 19:2 | * | * | * | * | * | * | * | * | * | * |
| 20:0 | * | 0.5 | * | 0.87 | * | * | 0.2 | 0.16 | * | * |
| 20:1 | * | * | * | 0.81 | 0.06 | 0.33 | * | 0.35 | * | * |
| 20:2 | * | * | * | 0.92 | 0.15 | 0.36 | * | 0 | * | * |
| 20:3 | 0.75 | * | * | 0.87 | 0.61 | 0.31 | 0.2 | 0 | * | * |
| 20:4 | 8.16 | * | * | 6.43 | 6.93 | 1.46 | 0.7 | 1.04 | 1.45 | 0.75 |
| 20:5 | 0.54 | * | 0.53 | * | 0.68 | 0.23 | * | 0 | 0.17 | 0.27 |
| 22:0 | * | * | * | 0.62 | * | * | 0.7 | * | * | * |
| 22:1 | * | * | * | 0.27 | * | * | * | 0 | * | * |
| 22:2 | * | * | * | 0.27 | * | * | * | * | * | * |
| 22:3 | * | * | * | * | * | * | * | * | * | * |
| 22:4 | * | * | * | * | 0.01 | 0.18 | * | * | * | * |
| 22:5 | * | * | * | * | 0.21 | 0.53 | * | 0.21 | 0.32 | 0.28 |
| 22:6 | 0.43 | * | 0.44 | 0.87 | 0.66 | 0.56 | 0.5 | 0.67 | 0.68 | 0.7 |
| 23:0 | * | * | * | * | * | * | * | * | * | * |
| 24:0 | * | * | * | * | * | * | * | * | * | * |
| 24:1 | * | * | * | * | * | * | * | 0.11 | * | * |
| Total MUFA | 18.6 | * | 18.59 | * | * | * | * | 48.71 | 40.99 | * |
| Total PUFA | 65.8 | * | 65.67 | * | * | * | 15.6 | 22.87 | 28.66 | * |
| n6-PUFA | * | * | * | * | * | * | * | 21.4 | 26.37 | * |
| n3-PUFA | * | * | * | * | * | * | * | 1.47 | 2.19 | * |
| Trans FA | * | * | * | * | * | * | * | * | * | * |
| Total OCFA | * | * | * | 3.34 | * | * | * | * | * | * |
| Total SFA | 11.6 | * | 11.69 | * | * | * | 37.5 | 28.12 | 30.27 | * |
| UNITS | % of total cholesterol ester fatty acid | % of total glycerolipid fatty acid | ||||||||
| Fatty Acid Internal Standard | Internal Standard and Sample Preparation | Int.Std Concentration in Sample | Sample Concentration of Fatty Acid | Sample Compound Error | References | |
|---|---|---|---|---|---|---|
| 1 | 15:0 | 50 µL of plasma was mixed with 25 µL of internal standard solution containing 3.01 µg of C15:0 in methanol, 1 mL of DMP, and 20 µL of concentrated aqueous HCL. Capped and kept at room temperature for 15 min. Pyridine, 10 µL, was added, then concentrated to 100 µL. Diluted with 0.5 mL of water. Aqueous mixture extracted with 0.5 mL of isooctane. After centrifugation, isooctane layer was transferred to a 1-mL serum, and evaporated to dryness. Then capped. Isooctane (30–50 µL) was added through the cap. An aliquot (0.5 µL) was injected into the gas chromatograph instrument. | 60.2 µg/mL | ≈0.158 µg/mL | 0.26% | [37] |
| 2 | 15:0 | Blood is collected into a heparinized tube and centrifuged immediately at 4 °C in a refrigerated centrifuge. The plasma is removed and stored at −15 °C. Internal standard of 150 nMol C15:0 is added to 1.0 mL plasma. The FFA are extracted into 20 mL of extraction solvent by shaking for 30 s. The plasma and extraction solvent is left at room temperature for 15 min then mixed for 10 s. After centrifugation, the organic phase removed and evaporated to dryness. The dry residue contains the FFA and is stable for at least 24 h at 4 °C. The residue is dissolved in 100 µL n-heptane and 2 µL injected into the gas chromatograph instrument. | 36.35 µg/mL | ≈0.158 µg/mL | 0.43% | [21] |
| 3 | 17:0 | Aliquots of 250 µL plasma were also placed into extraction tubes. A quantity of 50 µL of the C17:0 internal standard solution was spiked to each concentration standard and each plasma sample. The standards and plasma samples were extracted with freshly prepared Dole solution. The extracts were taken to dryness and were analyzed on the LC-MS. One tenth of the volume of each concentration standard and each plasma sample were re-suspended in 400 µL of buffer A (80% acetonitrile, 0.5 mM ammonium acetate) prior to injecting 10 µL onto the LC-MS. | 12 µg/mL | ≈0.323 µg/mL | 2.69% | [38] |
2.2. Biomarkers for Dietary Food Intake

2.3. Predictor Biomarkers for Coronary Heart Disease (CHD) and Type II Diabetes (T2D)
| Study Disease | Number of Participants | Country | Outcome | Study | |
|---|---|---|---|---|---|
| 1 | Disorders of propionate, methylmalonate and biotin metabolism | 24 diseased 12 control | Netherlands | OCS-FAs—disease treatment marker | [13] |
| 2 | Atherosclerosis | 2837 cohort | USA | OCS-FAs—inverse relationship with disease development | [70] |
| 3 | Type II diabetes | 346 diseased 3391 control | Australia | OCS-FAs—inverse relationship with disease development | [71] |
| 4 | Coronary Heart Disease | 1595 diseased 2246 control | UK | OCS-FAs—inverse relationship with disease development | [12] |
| 5 | Prediabetes and Type II Diabetes | 181 diseased 170 control | Australia | OCS-FAs—inverse relationship with disease development | [60] |
| 6 | Biotin Deficiency | 3 diseased | USA | OCS-FAs—increased in diseased cases | [72] |
| 7 | Peroxisomal Disorders | 86 diseased 84 control | USA | OCS-FAs—increased in diseased cases | [73] |
| 8 | Insulin sensitivity | 86 diseased | Australia | OCS-FAs—inverse relationship with disease development | [20] |
| 9 | Cardiomyopathy and rhabdomyolysis in long-chain fat oxidation disorders | 107 disease 50 control | USA | OCS-FAs—improve disease prognosis | [74] |
| 10 | Anorexia Nervosa | 8 diseased 19 control | USA | OCS-FAs—improves cell membrane fluidity | [62] |
2.4. Evidence for Alternative Metabolic Pathways


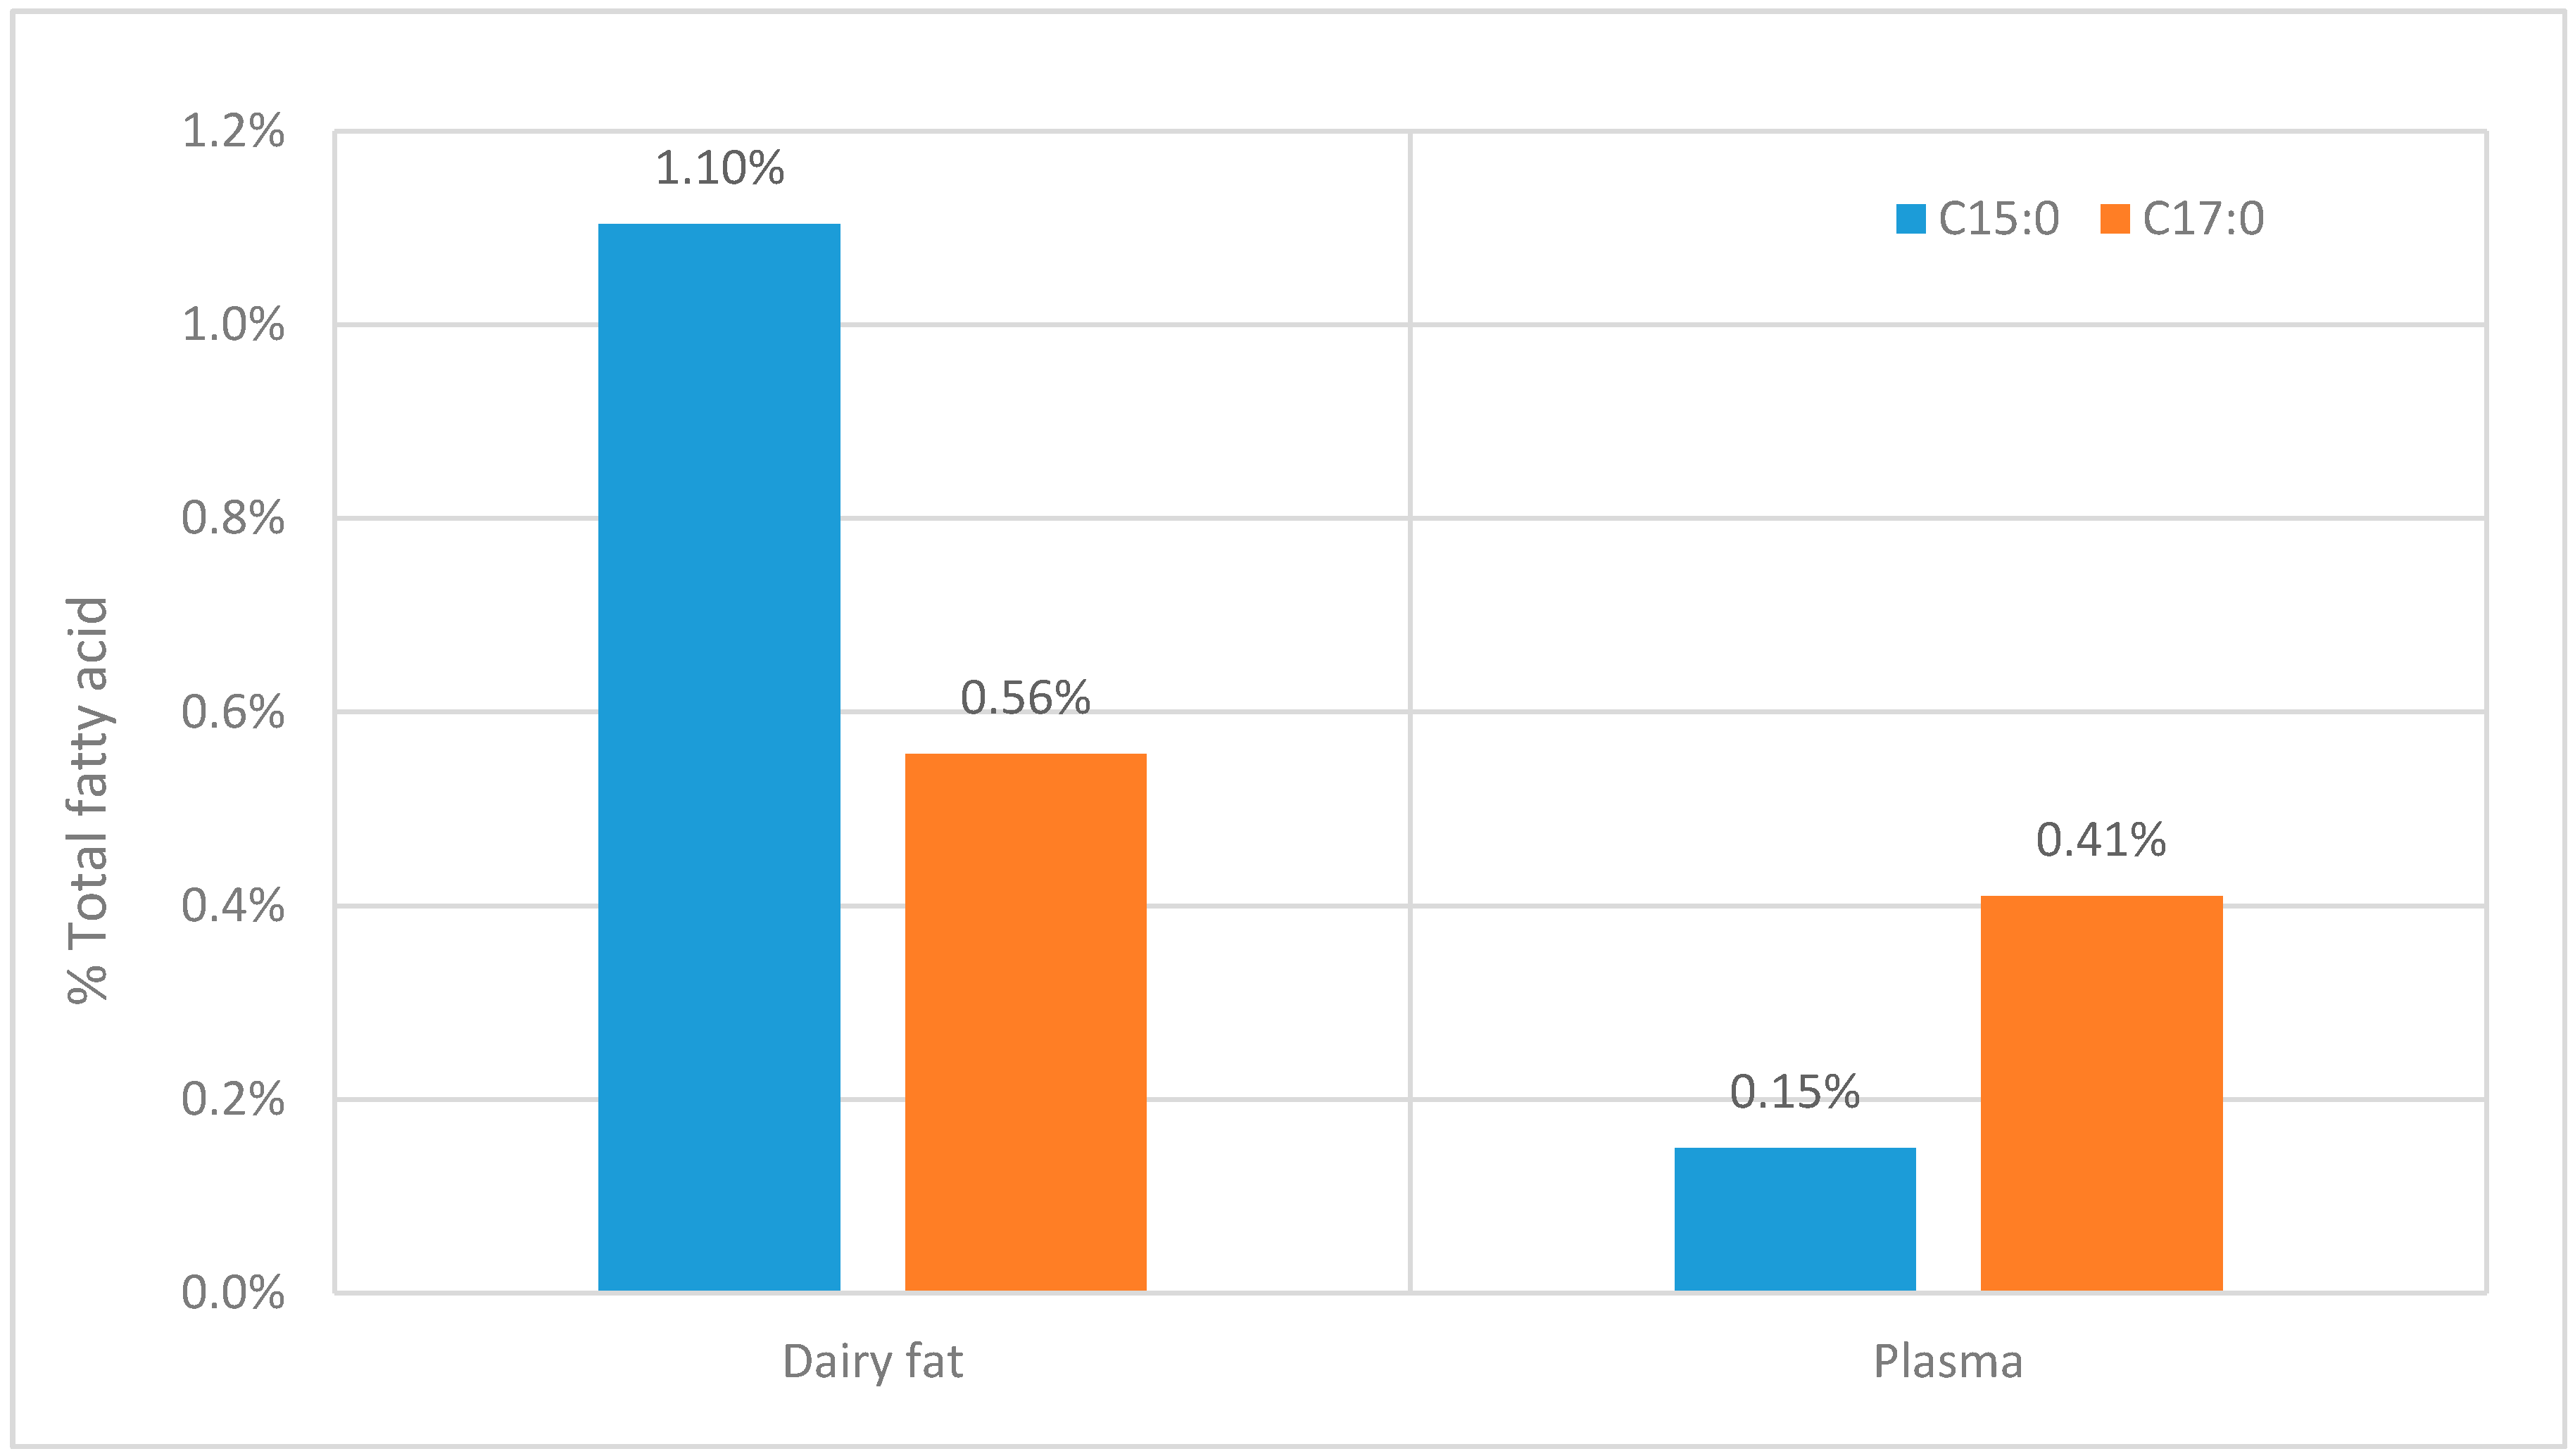
2.4.1. Inconsistent Ratios of C15:0 to C17:0 when Comparing Lipid Consumption with Measured Plasma Levels

2.4.2. Bio-Synthesized Odd Chain Fatty Acids in Adipocyte Differentiation
3. Conclusions
Acknowledgments
Author Contributions
Conflicts of Interest
References
- Miettinen, T.A.; Railo, M.; Lepäntalo, M.; Gylling, H. Plant sterols in serum and in atherosclerotic plaques of patients undergoing carotid endarterectomy. J. Am. Coll. Cardiol. 2005, 45, 1794–1801. [Google Scholar] [CrossRef] [PubMed]
- Manninen, V.; Tenkanen, L.; Koskinen, P.; Huttunen, J.K.; Mänttäri, M.; Heinonen, O.P.; Frick, M.H. Joint effects of serum triglyceride and LDL cholesterol and HDL cholesterol concentrations on coronary heart disease risk in the helsinki heart study. Implications for treatment. Circulation 1992, 85, 37–45. [Google Scholar] [CrossRef] [PubMed]
- Wang, L.; Folsom, A.R.; Zheng, Z.J.; Pankow, J.S.; Eckfeldt, J.H. ARIC study investigators. Plasma fatty acid composition and incidence of diabetes in middle-aged adults: The atherosclerosis risk in communities (ARIC) study. Am. J. Clin. Nutr. 2003, 78, 91–98. [Google Scholar]
- Vlaeminck, B.; Fievez, V.; Cabrita, A.R.J.; Fonseca, A.J.M.; Dewhurst, R.J. Factors affecting odd- and branched-chain fatty acids in milk: A review. Anim. Feed Sci. Technol. 2006, 131, 389–417. [Google Scholar] [CrossRef]
- Reitz, C.; Tang, M.; Luchsinger, J.; Mayeux, R. Relation of plasma lipids to alzheimer disease and vascular dementia. Arch. Neurol. 2004, 61, 705–714. [Google Scholar] [CrossRef] [PubMed]
- LIPID Maps. Available online: http://www.lipidmaps.org/ (accessed on 28 January 2015).
- Ulbricht, T.L.V.; Southgate, D.A.T. Coronary heart disease: Seven dietary factors. Lancet 1991, 338, 985–992. [Google Scholar] [CrossRef] [PubMed]
- Simopoulos, A.P. Omega-3 fatty acids in health and disease and in growth and development. Am. J. Clin. Nutr. 1991, 54, 438–463. [Google Scholar] [PubMed]
- Izai, K.; Uchida, Y.; Orii, T.; Yamamoto, S.; Hashimoto, T. Novel fatty acid beta-oxidation enzymes in rat liver mitochondria. I. Purification and properties of very-long-chain acyl-coenzyme a dehydrogenase. J. Biol. Chem. 1992, 267, 1027–1033. [Google Scholar] [PubMed]
- Poulos, A.; Sharp, P.; Fellenberg, A.J.; Danks, D.M. Cerebro-hepato-renal (zellweger) syndrome, adrenoleukodystrophy, and refsum’s disease: plasma changes and skin fibroblast phytanic acid oxidase. Hum. Genet. 1985, 70, 172–177. [Google Scholar] [CrossRef] [PubMed]
- Hodson, L.; Skeaff, C.M.; Fielding, B.A. Fatty acid composition of adipose tissue and blood in humans and its use as a biomarker of dietary intake. Prog. Lipid Res. 2008, 47, 348–380. [Google Scholar] [CrossRef] [PubMed]
- Khaw, K.T.; Friesen, M.D.; Riboli, E.; Luben, R.; Wareham, N. Plasma phospholipid fatty acid concentration and incident coronary heart disease in men and women: The EPIC-norfolk prospective study. PLoS Med. 2012, 9, e1001255. [Google Scholar] [CrossRef] [PubMed]
- Çoker, M.; de Klerk, J.B.C.; Poll-The, B.T.; Huijmans, J.G.M.; Duran, M. Plasma total odd-chain fatty acids in the monitoring of disorders of propionate, methylmalonate and biotin metabolism. J. Inherit. Metab. Dis. 1996, 19, 743–751. [Google Scholar] [CrossRef] [PubMed]
- Phillips, G.B.; Dodge, J.T. Composition of phospholipids and of phospholipid fatty acids of human plasma. J. Lipid Res. 1967, 8, 676–681. [Google Scholar] [PubMed]
- Horning, M.G.; Martin, D.B.; Karmen, A.; Vagelos, P.R. Fatty acid synthesis in adipose tissue II. Enzymatic synthesis of branched chain and odd-numbered fatty acids. J. Biol. Chem. 1961, 236, 669–672. [Google Scholar] [PubMed]
- Mead, J.F.; Gabriel, M. Levis. A 1 Carbon degradation of the long chain fatty acids of brain sphingolipids. J. Biol. Chem. 1963, 238, 1634–1636. [Google Scholar] [PubMed]
- Vanitallie, T.B.; Khachadurian, A.K. Rats enriched with odd-carbon fatty acids: Maintenance of liver glycogen during starvation. Science 1969, 165, 811–813. [Google Scholar] [CrossRef] [PubMed]
- Jansen, G.A.; Ronald, J.A. Wanders. Alpha-oxidation. Biochim. Biophys. Acta (BBA) Mol. Cell Res. 2006, 1763, 1403–1412. [Google Scholar] [CrossRef]
- Ferrannini, E.; Barrett, E.J.; Bevilacqua, S.; DeFronzo, R.A. Effect of fatty acids on glucose production and utilization in man. J. Clin. Investig. 1983, 72, 1737–1747. [Google Scholar] [CrossRef] [PubMed]
- Nestel, P.J.; Straznicky, N.; Mellett, N.A.; Wong, G.; De Souza, D.P.; Tull, D.L.; Barlow, C.K.; Grima, M.T.; Meikle, P.J. Specific plasma lipid classes and phospholipid fatty acids indicative of dairy food consumption associate with insulin sensitivity. Am. J. Clin. Nutr. 2014, 99, 46–53. [Google Scholar] [CrossRef] [PubMed]
- Sampson, D.; Hensley, W.J. A rapid gas chromatographic method for the quantitation of underivatised individual free fatty acids in plasma. Clin. Chim. Acta 1975, 61, 1–8. [Google Scholar] [CrossRef] [PubMed]
- Novgorodtseva, T.P.; Karaman, Y.K.; Zhukova, N.V.; Lobanova, E.G.; Antonyuk, M.V.; Kantur, T.A. Composition of fatty acids in plasma and erythrocytes and eicosanoids level in patients with metabolic syndrome. Lipids Health Dis. 2011, 10, 82. [Google Scholar] [CrossRef] [PubMed]
- Hellmuth, C.; Demmelmair, H.; Schmitt, I.; Peissner, W.; Blüher, M.; Koletzko, B. Association between plasma nonesterified fatty acids species and adipose tissue fatty acid composition. PLoS One 2013, 8, e74927. [Google Scholar] [CrossRef] [PubMed]
- Baylin, A.; Kim, M.K.; Donovan-Palmer, A.; Siles, X.; Dougherty, L.; Tocco, P.; Campos, H. Fasting whole blood as a biomarker of essential fatty acid intake in epidemiologic studies: comparison with adipose tissue and plasma. Am. J. Epidemiol. 2005, 162, 373–381. [Google Scholar] [CrossRef] [PubMed]
- Quehenberger, O.; Armando, A.M.; Brown, A.H.; Milne, S.B.; Myers, D.S.; Merrill, A.H.; Bandyopadhyay, S.; Jones, K.N.; Kelly, S.; Shaner, R.L.; et al. Lipidomics reveals a remarkable diversity of lipids in human plasma. J. Lipid Res. 2010, 51, 3299–3305. [Google Scholar] [CrossRef]
- Matthan, N.R.; Ooi, E.M.; van Horn, L.; Neuhouser, M.L.; Woodman, R.; Lichtenstein, A.H. Plasma phospholipid fatty acid biomarkers of dietary fat quality and endogenous metabolism predict coronary heart disease risk: A nested case-control study within the women’s health initiative observational study. J. Am. Heart Assoc. 2014, 3, E000764. [Google Scholar] [CrossRef] [PubMed]
- Forouhi, N.G.; Koulman, A.; Sharp, S.J.; Imamura, F.; Kröger, J.; Schulze, M.B.; Crowe, F.L.; Huerta, J.M.; Guevara, M.; Beulens, J.W.; et al. Differences in the prospective association between individual plasma phospholipid saturated fatty acids and incident type 2 diabetes: The EPIC-InterAct case-cohort study. Lancet Diabetes Endocrinol. 2014. [Google Scholar] [CrossRef]
- Saadatian-Elahi, M.; Slimani, N.; Chajès, V.; Jenab, M.; Goudable, J.; Biessy, C.; Ferrari, P.; Byrnes, G.; Autier, P.; Peeters, P.H.; et al. Plasma phospholipid fatty acid profiles and their association with food intakes: Results from a cross-sectional study within the European prospective investigation into cancer and nutrition. Am. J. Clin. Nutr. 2009, 89, 331–346. [Google Scholar] [CrossRef]
- Crowe, F.L.; Allen, N.E.; Appleby, P.N.; Overvad, K.; Aardestrup, I.V.; Johnsen, N.F.; Tjønneland, A.; Linseisen, J.; Kaaks, R.; Boeing, H.; et al. Fatty acid composition of plasma phospholipids and risk of prostate cancer in a case-control analysis nested within the European prospective investigation into cancer and nutrition. Am. J. Clin. Nutr. 2008, 88, 1353–1363. [Google Scholar]
- Zák, A.; Vecka, M. Composition of plasma fatty acids and non-cholesterol sterols in anorexia nervosa. Physiol. Res. Acad. Sci. Bohemoslov. 2005, 54, 443–451. [Google Scholar]
- Dyerberg, J.; Bang, H.O.; Hjorne, N. Fatty acid composition of the plasma lipids in Greenland Eskimos. Am. J. Clin. Nutr. 1975, 28, 958–966. [Google Scholar] [PubMed]
- Ma, J.; Folsom, A.R.; Shahar, E.; Eckfeldt, J.H. Plasma fatty acid composition as an indicator of habitual dietary fat intake in middle-aged adults. The atherosclerosis risk in communities (ARIC) study investigators. Am. J. Clin. Nutr. 1995, 62, 564–571. [Google Scholar] [PubMed]
- Caramia, G.; Cocchi, M. Fatty acids composition of plasma phospholipids and triglycerides in children with cystic fibrosis. The effect of dietary supplementation with an olive and soybean oils mixture. Pediatr. Med. E Chir. Med. Surg. Pediatr. 2007, 25, 42–49. [Google Scholar]
- Raatz, S.K.; Bibus, D.; Thomas, W.; Kris-Etherton, P. Total fat intake modifies plasma fatty acid composition in humans. J. Nutr. 2001, 131, 231–234. [Google Scholar] [PubMed]
- Ruíz-Gutiérrez, V.; Prada, J.L.; Pérez-Jiménez, F. Determination of fatty acid and triacylglycerol composition of human very-low-density lipoproteins. J. Chromatogr. B Biomed. Sci. Appl. 1993, 622, 117–124. [Google Scholar] [CrossRef]
- Skeaff, C.M.; Hodson, L.; McKenzie, J.E. Dietary-induced changes in fatty acid composition of human plasma, platelet, and erythrocyte lipids follow a similar time course. J. Nutr. 2006, 136, 565–569. [Google Scholar] [PubMed]
- Tserng, K.Y.; Kliegman, R.M.; Miettinen, E.L.; Kalhan, S.C. A rapid, simple, and sensitive procedure for the determination of free fatty acids in plasma using glass capillary column gas-liquid chromatography. J. Lipid Res. 1981, 22, 852–858. [Google Scholar] [PubMed]
- Persson, X.M.; Blachnio-Zabielska, A.U.; Jensen, M.D. Rapid measurement of plasma free fatty acid concentration and isotopic enrichment using LC/MS. J. Lipid Res. 2010, 51, 2761–2765. [Google Scholar] [CrossRef] [PubMed]
- Kagan, M.L.; West, A.L.; Zante, C.; Calder, P.C. Acute appearance of fatty acids in human plasma—A comparative study between polar-lipid rich oil from the microalgae nannochloropsis oculata and krill oil in healthy young males. Lipids Health Dis. 2013, 12, 102. [Google Scholar] [CrossRef] [PubMed]
- Moser, A.B.; Kreiter, N.; Bezman, L.; Lu, S.; Raymond, G.V.; Naidu, S.; Moser, H.W. Plasma very long chain fatty acids in 3000 peroxisome disease patients and 29,000 controls. Ann. Neurol. 1999, 45, 100–110. [Google Scholar] [CrossRef] [PubMed]
- Astrup, A. A changing view on saturated fatty acids and dairy: From enemy to friend. Am. J. Clin. Nutr. 2014, 100, 1407–1408. [Google Scholar] [CrossRef] [PubMed]
- Seppänen-Laakso, T.; Oresic, M. How to study lipidomes. J. Mol. Endocrinol. 2009, 42, 185–190. [Google Scholar] [CrossRef] [PubMed]
- Emmanuel, B. The relative contribution of propionate, and long-chain even-numbered fatty acids to the production of long-chain odd-numbered fatty acids in rumen bacteria. Biochim. Biophys. Acta (BBA) Lipids Lipid Metab. 1978, 528, 239–246. [Google Scholar] [CrossRef]
- Hughes, R. Definitions for public health nutrition: A developing consensus. Public Health Nutr. 2003, 6, 615–620. [Google Scholar] [PubMed]
- Jeremiah, S. Diet and Coronary Heart Disease. Proceedings of “Current Topics in Biostatistics and Epidemiology”. A Memorial Symposium in Honor of Jerome Cornfield. Biometrics 1982, 38, 95–114. [Google Scholar] [CrossRef] [PubMed]
- Smedman, A.E.; Gustafsson, I.B.; Berglund, L.G.; Vessby, B.O. Pentadecanoic acid in serum as a marker for intake of milk fat: Relations between intake of milk fat and metabolic risk factors. Am. J. Clin. Nutr. 1999, 69, 22–29. [Google Scholar] [PubMed]
- Brevik, A.; Veierød, M.B.; Drevon, C.A.; Andersen, L.F. Evaluation of the odd fatty acids 15:0 and 17:0 in serum and adipose tissue as markers of intake of milk and dairy fat. Eur. J. Clin. Nutr. 2005, 59, 1417–1422. [Google Scholar] [CrossRef] [PubMed]
- Laliotis, G.P.; Bizelis, I.; Rogdakis, E. Comparative approach of the de novo fatty acid synthesis (lipogenesis) between ruminant and non-ruminant mammalian species: From biochemical level to the main regulatory lipogenic genes. Curr. Genomics 2010, 11, 168–183. [Google Scholar] [CrossRef] [PubMed]
- Or-Rashid, M.M.; Odongo, N.E.; McBride, B.W. Fatty acid composition of ruminal bacteria and protozoa, with emphasis on conjugated linoleic acid, vaccenic acid, and odd-chain and branched-chain fatty acids. J. Anim. Sci. 2007, 85, 1228–1234. [Google Scholar] [CrossRef] [PubMed]
- Dijkstra, J.; van Zijderveld, S.M.; Apajalahti, J.A.; Bannink, A.; Gerrits, W.J.J.; Newbold, J.R.; Perdok, H.B.; Berends, H. Relationships between methane production and milk fatty acid profiles in dairy cattle. Anim. Feed Sci. Technol. 2011, 166–167, 590–595. [Google Scholar] [CrossRef]
- French, E.A.; Bertics, S.J.; Armentano, L.E. Rumen and milk odd- and branched-chain fatty acid proportions are minimally influenced by ruminal volatile fatty acid infusions. J. Dairy Sci. 2012, 95, 2015–2026. [Google Scholar] [CrossRef] [PubMed]
- Heck, J.M.; van Valenberg, H.J.; Bovenhuis, H.; Dijkstra, J.; van Hooijdonk, T. Characterization of milk fatty acids based on genetic and herd parameters. J. Dairy Res. 2012, 79, 39–46. [Google Scholar] [CrossRef] [PubMed]
- Berthelot, V.; Bas, P.; Pottier, E.; Normand, J. The effect of maternal linseed supplementation and/or lamb linseed supplementation on muscle and subcutaneous adipose tissue fatty acid composition of indoor lambs. Meat Sci. 2012, 90, 548–557. [Google Scholar] [CrossRef] [PubMed]
- Dohme-Meier, F.; Bee, G. Feeding unprotected cla methyl esters compared to sunflower seeds increased milk CLA level but inhibited milk fat synthesis in cows. Asian Australas J. Anim. Sci. 2012, 25, 75–85. [Google Scholar] [CrossRef] [PubMed]
- Stefanov, I.; Baeten, V.; Abbas, O.; Vlaeminck, B.; De Baets, B.; Fievez, V. Evaluation of FT-NIR and ATR-FTIR spectroscopy techniques for determination of minor odd- and branched-chain saturated and trans unsaturated milk fatty acids. J. Agric. Food Chem. 2013, 61, 3403–3413. [Google Scholar] [CrossRef] [PubMed]
- Dewhurst, R.J.; Moorby, J.M.; Vlaeminck, B.; Fievez, V. Apparent recovery of duodenal odd- and branched-chain fatty acids in milk of dairy cows. J. Dairy Sci. 2007, 90, 1775–1780. [Google Scholar] [CrossRef] [PubMed] [Green Version]
- Fievez, V.; Colman, E.; Castro-Montoya, J.M.; Stefanov, I.; Vlaeminck, B. Milk odd- and branched-chain fatty acids as biomarkers of rumen function—An update. Anim. Feed Sci. Technol. 2012, 172, 51–65. [Google Scholar] [CrossRef]
- James, P.D.; Windhauser, M.M.; Champagne, C.M.; Bray, G.A. Differential oxidation of individual dietary fatty acids in humans. Am. J. Clin. Nutr. 2000, 72, 905–911. [Google Scholar] [PubMed]
- Sun, Q.; Ma, J.; Campos, H.; Hu, F.B. Plasma and erythrocyte biomarkers of dairy fat intake and risk of ischemic heart disease. Am. J. Clin. Nutr. 2007, 86, 929–937. [Google Scholar] [PubMed]
- Meikle, P.J.; Wong, G.; Barlow, C.K.; Weir, J.M.; Greeve, M.A.; MacIntosh, G.L.; Almasy, L.; Comuzzie, A.G.; Mahaney, M.C.; Kowalczyk, A.; et al. Plasma lipid profiling shows similar associations with prediabetes and type 2 diabetes. PLoS One 2013, 8. [Google Scholar] [CrossRef] [PubMed]
- Holman, R.T.; Johnson, S.B.; Kokmen, E. Deficiencies of polyunsaturated fatty acids and replacement by nonessential fatty acids in plasma lipids in multiple sclerosis. Proc. Natl. Acad. Sci. USA 1989, 86, 4720–4724. [Google Scholar] [CrossRef] [PubMed]
- Holman, R.T.; Adams, C.E.; Nelson, R.A.; Grater, S.J.; Jaskiewicz, J.A.; Johnson, S.B.; Erdman, J.W., Jr. Patients with anorexia nervosa demonstrate deficiencies of selected essential fatty acids, compensatory changes in nonessential fatty acids and decreased fluidity of plasma lipids. J. Nutr. 1995, 125, 901–907. [Google Scholar] [PubMed]
- Bazinet, R.P.; Layé, S. Polyunsaturated fatty acids and their metabolites in brain function and disease. Nat. Rev. Neurosci. 2014. [Google Scholar] [CrossRef]
- Tan, Z.S.; Harris, W.S.; Beiser, A.S.; Au, R.; Himali, J.J.; Debette, S.; Pikula, A.; DeCarli, C.; Wolf, P.A.; Vasan, R.S.; et al. Red blood cell omega-3 fatty acid levels and markers of accelerated brain aging. Neurology 2012, 78, 658–664. [Google Scholar] [CrossRef] [PubMed]
- Torres, M.; Price, S.L.; Fiol-deRoque, M.A.; Marcilla-Etxenike, A.; Ahyayauch, H.; Barceló-Coblijn, G.; Terés, S.; Katsouri, L.; Ordinas, M.; López, D.J.; et al. Membrane lipid modifications and therapeutic effects mediated by hydroxydocosahexaenoic acid on Alzheimer’s disease. Biochim. Biophys. Acta (BBA) Biomembr. 2014, 1838, 1680–1692. [Google Scholar] [CrossRef]
- Haag, M. Essential fatty acids and the brain. Can. J. Psychiatry 2003, 48, 195–203. [Google Scholar] [PubMed]
- Yang, X.; Sun, G.Y.; Eckert, G.P.; Lee, J.C.-M. Cellular membrane fluidity in amyloid precursor protein processing. Mol. Neurobiol. 2014, 50, 119–129. [Google Scholar] [CrossRef] [PubMed]
- Fonteh, A.N.; Cipolla, M.; Chiang, J.; Arakaki, X.; Harrington, M.G. Human cerebrospinal fluid fatty acid levels differ between supernatant fluid and brain-derived nanoparticle fractions, and are altered in Alzheimer’s disease. PLoS One 2014, 9, e100519. [Google Scholar] [CrossRef] [PubMed]
- Shibata, R.; Gotoh, N.; Kubo, A.; Kanda, J.; Nagai, T.; Mizobe, H.; Yoshinaga, K.; Kojima, K.; Watanabe, H.; Wada, S. Comparison of catabolism rate of fatty acids to carbon dioxide in mice. Eur. J. Lipid Sci. Technol. 2012, 114, 1340–1344. [Google Scholar] [CrossRef]
- De Oliveira Otto, M.C.; Nettleton, J.A.; Lemaitre, R.N.; Steffen, L.M.; Kromhout, D.; Rich, S.S.; Tsai, M.Y.; Jacobs, D.R.; Mozaffarian, D. Biomarkers of dairy fatty acids and risk of cardiovascular disease in the multi-ethnic study of atherosclerosis. J. Am. Heart Assoc. Cardiovasc. Cerebrovasc. Dis. 2013, 2. [Google Scholar] [CrossRef]
- Hodge, A.M.; English, D.R.; O’Dea, K.; Sinclair, A.J.; Makrides, M.; Gibson, R.A.; Giles, G.G. Plasma phospholipid and dietary fatty acids as predictors of type 2 diabetes: Interpreting the role of linoleic acid. Am. J. Clin. Nutr. 2007, 86, 189–197. [Google Scholar] [PubMed]
- Mock, D.M.; Johnson, S.B.; Holman, R.T. Effects of biotin deficiency on serum fatty acid composition: evidence for abnormalities in humans. J. Nutr. 1988, 118, 342–348. [Google Scholar] [PubMed]
- Moser, H.W.; Moser, A.B.; Frayer, K.K.; Chen, W.; Schulman, J.D.; O’Neill, B.P.; Kishimoto, Y. Adrenoleukodystrophy increased plasma content of saturated very long chain fatty acids. Neurology 1981, 31, 1241–1249. [Google Scholar] [CrossRef] [PubMed]
- Roe, C.R.; Sweetman, L.; Roe, D.S.; David, F.; Brunengraber, H. Treatment of cardiomyopathy and rhabdomyolysis in long-chain fat oxidation disorders using an anaplerotic odd-chain triglyceride. J. Clin. Investig. 2002, 110, 259–269. [Google Scholar] [CrossRef] [PubMed]
- Mannaerts, G.P.; Van Veldhoven, P.P.; Casteels, M. Peroxisomal lipid degradation via beta- and alpha-oxidation in mammals. Cell Biochem. Biophys. 2000, 32, 73–87. [Google Scholar] [CrossRef] [PubMed]
- Eaton, S.; Bartlett, K.; Pourfarzam, M. Mammalian mitochondrial beta-oxidation. Biochem. J. 1996. Available online: http://0-www-biochemj-org.brum.beds.ac.uk/bj/320/bj3200345.htm (accessed on 29 January 2014).
- Wierzbicki, A.S.; Lloyd, M.D.; Schofield, C.J.; Feher, M.D.; Gibberd, F.B. Refsum’s disease: A peroxisomal disorder affecting phytanic acid α-oxidation. J. Neurochem. 2002, 80, 727–735. [Google Scholar] [CrossRef] [PubMed]
- Wanders, R.J.; Jansen, G.A.; Lloyd, M.D. Phytanic acid alpha-oxidation, new insights into an old problem: A review. Biochim. Biophys. Acta (BBA) Mol. Cell Biol. Lipids 2003, 1631, 119–135. [Google Scholar] [CrossRef]
- Foulon, V.; Sniekers, M.; Huysmans, E.; Asselberghs, S.; Mahieu, V.; Mannaerts, G.P.; Veldhoven, P.P.V.; Casteels, M. Breakdown of 2-hydroxylated straight chain fatty acids via peroxisomal 2-hydroxyphytanoyl-coa lyase a revised pathway for the α-oxidation of straight chain fatty acids. J. Biol. Chem. 2005, 280, 9802–9812. [Google Scholar] [CrossRef] [PubMed]
- Guo, L.; Zhou, D.; Pryse, K.M.; Okunade, A.L.; Su, X. Fatty acid 2-hydroxylase mediates diffusional mobility of raft-associated lipids, glut4 level, and lipogenesis in 3t3-l1 adipocytes. J. Biol. Chem. 2010, 285, 25438–25447. [Google Scholar] [CrossRef] [PubMed]
- Kondo, N.; Ohno, Y.; Yamagata, M.; Obara, T.; Seki, N.; Kitamura, T.; Naganuma, T.; Kihara, A. Identification of the phytosphingosine metabolic pathway leading to odd-numbered fatty acids. Nat. Commun. 2014, 5. [Google Scholar] [CrossRef] [PubMed]
- Nagy, K.; Brahmbhatt, V.V.; Berdeaux, O.; Bretillon, L.; Destaillats, F.; Acar, N. Comparative study of serine-plasmalogens in human retina and optic nerve: Identification of atypical species with odd carbon chains. J. Lipid Res. 2012, 53, 776–783. [Google Scholar] [CrossRef] [PubMed]
- Su, X.; Han, X.; Yang, J.; Mancuso, D.J.; Chen, J.; Bickel, P.E.; Gross, R.W. Sequential ordered fatty acid α oxidation and δ9 desaturation are major determinants of lipid storage and utilization in differentiating adipocytes. Biochemistry 2004, 43, 5033–5044. [Google Scholar] [CrossRef] [PubMed]
- Veldhoven, P.P.V. Biochemistry and genetics of inherited disorders of peroxisomal fatty acid metabolism. J. Lipid Res. 2010, 51, 2863–2895. [Google Scholar] [CrossRef] [PubMed]
- Yuki, D.; Sugiura, Y.; Zaima, N.; Akatsu, H.; Hashizume, Y.; Yamamoto, T.; Fujiwara, M.; Sugiyama, K.; Setou, M. Hydroxylated and non-hydroxylated sulfatide are distinctly distributed in the human cerebral cortex. Neuroscience 2011, 193, 44–53. [Google Scholar] [CrossRef] [PubMed]
- Valentine, N.H.; Richard, S. Hindmilk Improves Weight Gain in Low-Birth-Weight Infants Fe: Journal of Pediatric Gastroenterology and Nutrition. J. Pediatr. Gastr. Nutr. 1994. Available online: http://journals.lww.com/jpgn/Fulltext/1994/05000/Hindmilk_Improves_Weight_Gain_in_Low_Birth_Weight.13.aspx (accessed on 31 January 2014).
- Roberts, L.D.; Virtue, S.; Vidal-Puig, A.; Nicholls, A.W.; Griffin, J.L. Metabolic phenotyping of a model of adipocyte differentiation. Physiol. Genomics 2009, 39, 109–119. [Google Scholar] [CrossRef] [PubMed]
- Labarthe, F.; Gélinas, R.; Rosiers, C.D. Medium-chain fatty acids as metabolic therapy in cardiac disease. Cardiovasc. Drugs Ther. 2008, 22, 97–106. [Google Scholar] [CrossRef] [PubMed]
- Jacobs, S.; Schiller, K.; Jansen, E.; Fritsche, A.; Weikert, C.; di Giuseppe, R.; Boeing, H.; Schulze, M.B.; Kröger, J. Association between erythrocyte membrane fatty acids and biomarkers of dyslipidemia in the EPIC-Potsdam study. Eur. J. Clin. Nutr. 2014, 68, 517–525. [Google Scholar] [CrossRef] [PubMed]
- Mozaffarian, D. Saturated fatty acids and type 2 diabetes: More evidence to re-invent dietary guidelines. Lancet Diabetes Endocrinol. 2014, 2, 770–772. [Google Scholar] [CrossRef] [PubMed]
- Sbaï, D.; Narcy, C.; Thompson, G.N.; Mariotti, A.; Poggi, F.; Saudubray, J.M.; Bresson, J.L. Contribution of odd-chain fatty acid oxidation to propionate production in disorders of propionate metabolism. Am. J. Clin. Nutr. 1994, 59, 1332–1337. [Google Scholar] [PubMed]
- Gozzo, S.; Oliverio, A.; Salvati, S.; Serlupi-Crescenzi, G.; Tagliamonte, B.; Tomassi, G. Effects of dietary phospholipids and odd-chain fatty acids on the behavioural maturation of mice. Food Chem. Toxicol. 1982, 20, 153–157. [Google Scholar] [CrossRef] [PubMed]
- Brass, E.P.; Beyerinck, R.A. Effects of propionate and carnitine on the hepatic oxidation of short- and medium-chain-length fatty acids. Biochem. J. 1988. Available online: http://0-www-biochemj-org.brum.beds.ac.uk/bj/250/bj2500819.htm (accessed on 15 January 2014).
© 2015 by the authors. Licensee MDPI, Basel, Switzerland. This article is an open access article distributed under the terms and conditions of the Creative Commons Attribution license ( http://creativecommons.org/licenses/by/4.0/).
Share and Cite
Jenkins, B.; West, J.A.; Koulman, A. A Review of Odd-Chain Fatty Acid Metabolism and the Role of Pentadecanoic Acid (C15:0) and Heptadecanoic Acid (C17:0) in Health and Disease. Molecules 2015, 20, 2425-2444. https://0-doi-org.brum.beds.ac.uk/10.3390/molecules20022425
Jenkins B, West JA, Koulman A. A Review of Odd-Chain Fatty Acid Metabolism and the Role of Pentadecanoic Acid (C15:0) and Heptadecanoic Acid (C17:0) in Health and Disease. Molecules. 2015; 20(2):2425-2444. https://0-doi-org.brum.beds.ac.uk/10.3390/molecules20022425
Chicago/Turabian StyleJenkins, Benjamin, James A. West, and Albert Koulman. 2015. "A Review of Odd-Chain Fatty Acid Metabolism and the Role of Pentadecanoic Acid (C15:0) and Heptadecanoic Acid (C17:0) in Health and Disease" Molecules 20, no. 2: 2425-2444. https://0-doi-org.brum.beds.ac.uk/10.3390/molecules20022425