Article

Flow and Thixotropic Parameters for Rheological Characterization of Hydrogels

by
Mihaela Violeta Ghica
1,
Mircea Hîrjău
2,*,
Dumitru Lupuleasa
2 and
Cristina-Elena Dinu-Pîrvu
1
1
Department of Physical and Colloidal Chemistry, Faculty of Pharmacy, University of Medicine and Pharmacy “Carol Davila”, Bucharest 020956, Romania
2
Department of Pharmaceutical Technology and Biopharmacy, Faculty of Pharmacy, University of Medicine and Pharmacy “Carol Davila”, Bucharest 020956, Romania
*
Author to whom correspondence should be addressed.
Submission received: 21 April 2016 / Revised: 6 June 2016 / Accepted: 13 June 2016 / Published: 16 June 2016
(This article belongs to the Special Issue Transdermal Delivery Systems: Current Landscape and Trends)

Abstract

:
The goal of this paper was to design several sodium carboxymethylcellulose hydrogels containing a BCS class II model drug and to evaluate their flow and thixotropic properties. The rheological measurements were performed at two temperatures (23 °C and 37 °C), using a rotational viscometer. The hydrogels were stirred at different time intervals (10 s, 2, 5, 10 and 20 min at 23 °C, and 10 s, 2 and 5 min at 37 °C), with a maximum rotational speed of 60 rpm, and the corresponding forward and backward rheograms were recorded as shear stress vs. shear rate. For all hydrogels, the rheological data obtained at both temperatures showed a decrease of viscosity with the increase of the shear rate, highlighting a pseudoplastic behaviour. The flow profiles viscosity vs. shear rate were quantified through power law model, meanwhile the flow curves shear stress vs. shear rate were assessed by applying the Herschel-Bulkley model. The thixotropic character was evaluated through different descriptors: thixotropic area, thixotropic index, thixotropic constant and destructuration thixotropic coefficient. The gel-forming polymer concentration and the rheological experiments temperature significantly influence the flow and thixotropic parameters values of the designed hydrogels. The rheological characteristics described have an impact on the drug release microenvironment and determine the stasis time at the application site.

Graphical Abstract

1. Introduction

Hydrogels are semisolid dosage forms, consisting of three-dimensional networks of water-soluble materials of polymeric, protein, peptidic, colloidal, surfactant, or lipid origin, with a cross-linked structure. They can be formulated in a variety of physical forms, ranging from micro- or nanoparticles to coatings and films applied on solid dosage forms [1,2].
Their applications also cover a vast array, both in clinical practice and experimental medicine. Due to the advanced degree of hydration, their porous structure and low interfacial tension with water or biological fluids, hydrogels have the potential to be used for encapsulation of active pharmaceutical ingredients or therapeutic entities, such as cells [3,4,5], proteins and peptides [6,7,8] and active substances [9,10,11,12,13].
Many of the recently discovered active substances which might be suitable candidates for therapeutic use have a poor bioavailability due to their low water solubility. Therefore, one of the major challenges in developing new medicinal products was to improve the aqueous solubility of these poorly water-soluble drugs, especially of Biopharmaceutical Classification System (BCS) class II active ingredients (high permeability, low solubility) with low molecular weight (MW < 1000 Da) [14,15,16]. By incorporating poorly water-soluble drugs into hydrogels, their aqueous solubility can be enhanced or an extended release can be achieved, thereby increasing the chances of reaching a high drug concentration in a specific organ [17].
Sodium carboxymethylcellulose (NaCMC) is one of the most used polymers in the formulation of hydrogels. Its popularity as a gel-forming polymer is the result of high water absorbent properties, low-immunogenicity and excellent biocompatibility with the skin and mucous membranes. NaCMC primarily maintains an optimal moist environment at lesions level, stimulating extracellular matrix formation and re-epithelialization [18,19,20,21]. It is a derivative of cellulose substituted with carboxymethyl functional groups. Its molecular weight can vary between 90,000 and 2,000,000 g/mol, and has an ether substitution degree varying from 0.6 to 1.0 [22]. NaCMC- based hydrogels are also highly compatible with most drugs. The pH value of the semisolid dosage form can be easily adjusted to ensure the best conditions for the chemical stability of the incorporated drug [23,24].
The therapeutic effects, reabsorption and penetration of the drug are usually improved, compared to hydrophobic ointments. By losing water through evaporation subsequent to their application, NaCMC hydrogels also provide a cooling effect, while maintaining an uniform film on the skin surface [25,26,27].
The study of topical dosage forms flow properties is important from the manufacturers’ standpoint for simple liquids, ointments, creams and pastes. The flow behaviour of semisolids under an applied stress is highly relevant as a quality control tool, helping in maintaining product quality and reducing batch-to-batch variations [28]. Furthermore, it is well known that rheological properties of pharmaceutical systems for topical use influence the release rate of the active pharmaceutical ingredients contained [29,30].
The primary task of mathematical modeling applied in rheology is to reliably predict the rheological properties observed in the laboratories for diluted or concentrated polymeric liquids [31]. By applying mathematical models in the assessment of hydrogel networks and their rheological characteristics, key process and formulation parameters and mechanisms of drug delivery can be identified. Thus, a thorough mathematical understanding of the gel-forming material properties, of the way in which the formulation and process parameters interact, is facilitating the intelligent design of the hydrogel network [32].
The aim of this study was the design of some sodium carboxymethylcellulose hydrogels containing a BCS class II drug model, and the investigation of the rheological behaviour of the resulting experimental hydrogels, in correlation with the formulation variables. The assessment of the flow properties was aimed at the identification of the rheological model that best fit experimental data, as well as at the quantification of the hydrogels thixotropic properties through specific descriptors with biopharmaceutical and technological implications.

2. Results

The forward and backward rheograms were recorded for eight experimental hydrogels, prepared according to the formulas presented in Section “4.2.1. Preparation of the Hydrogels” and coded H1–H8.
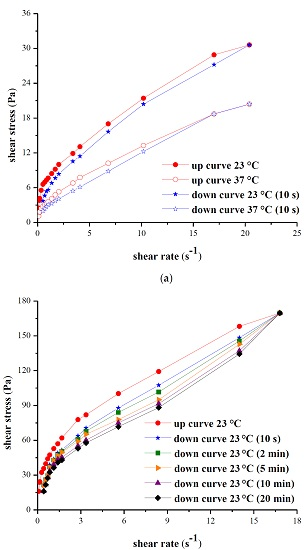
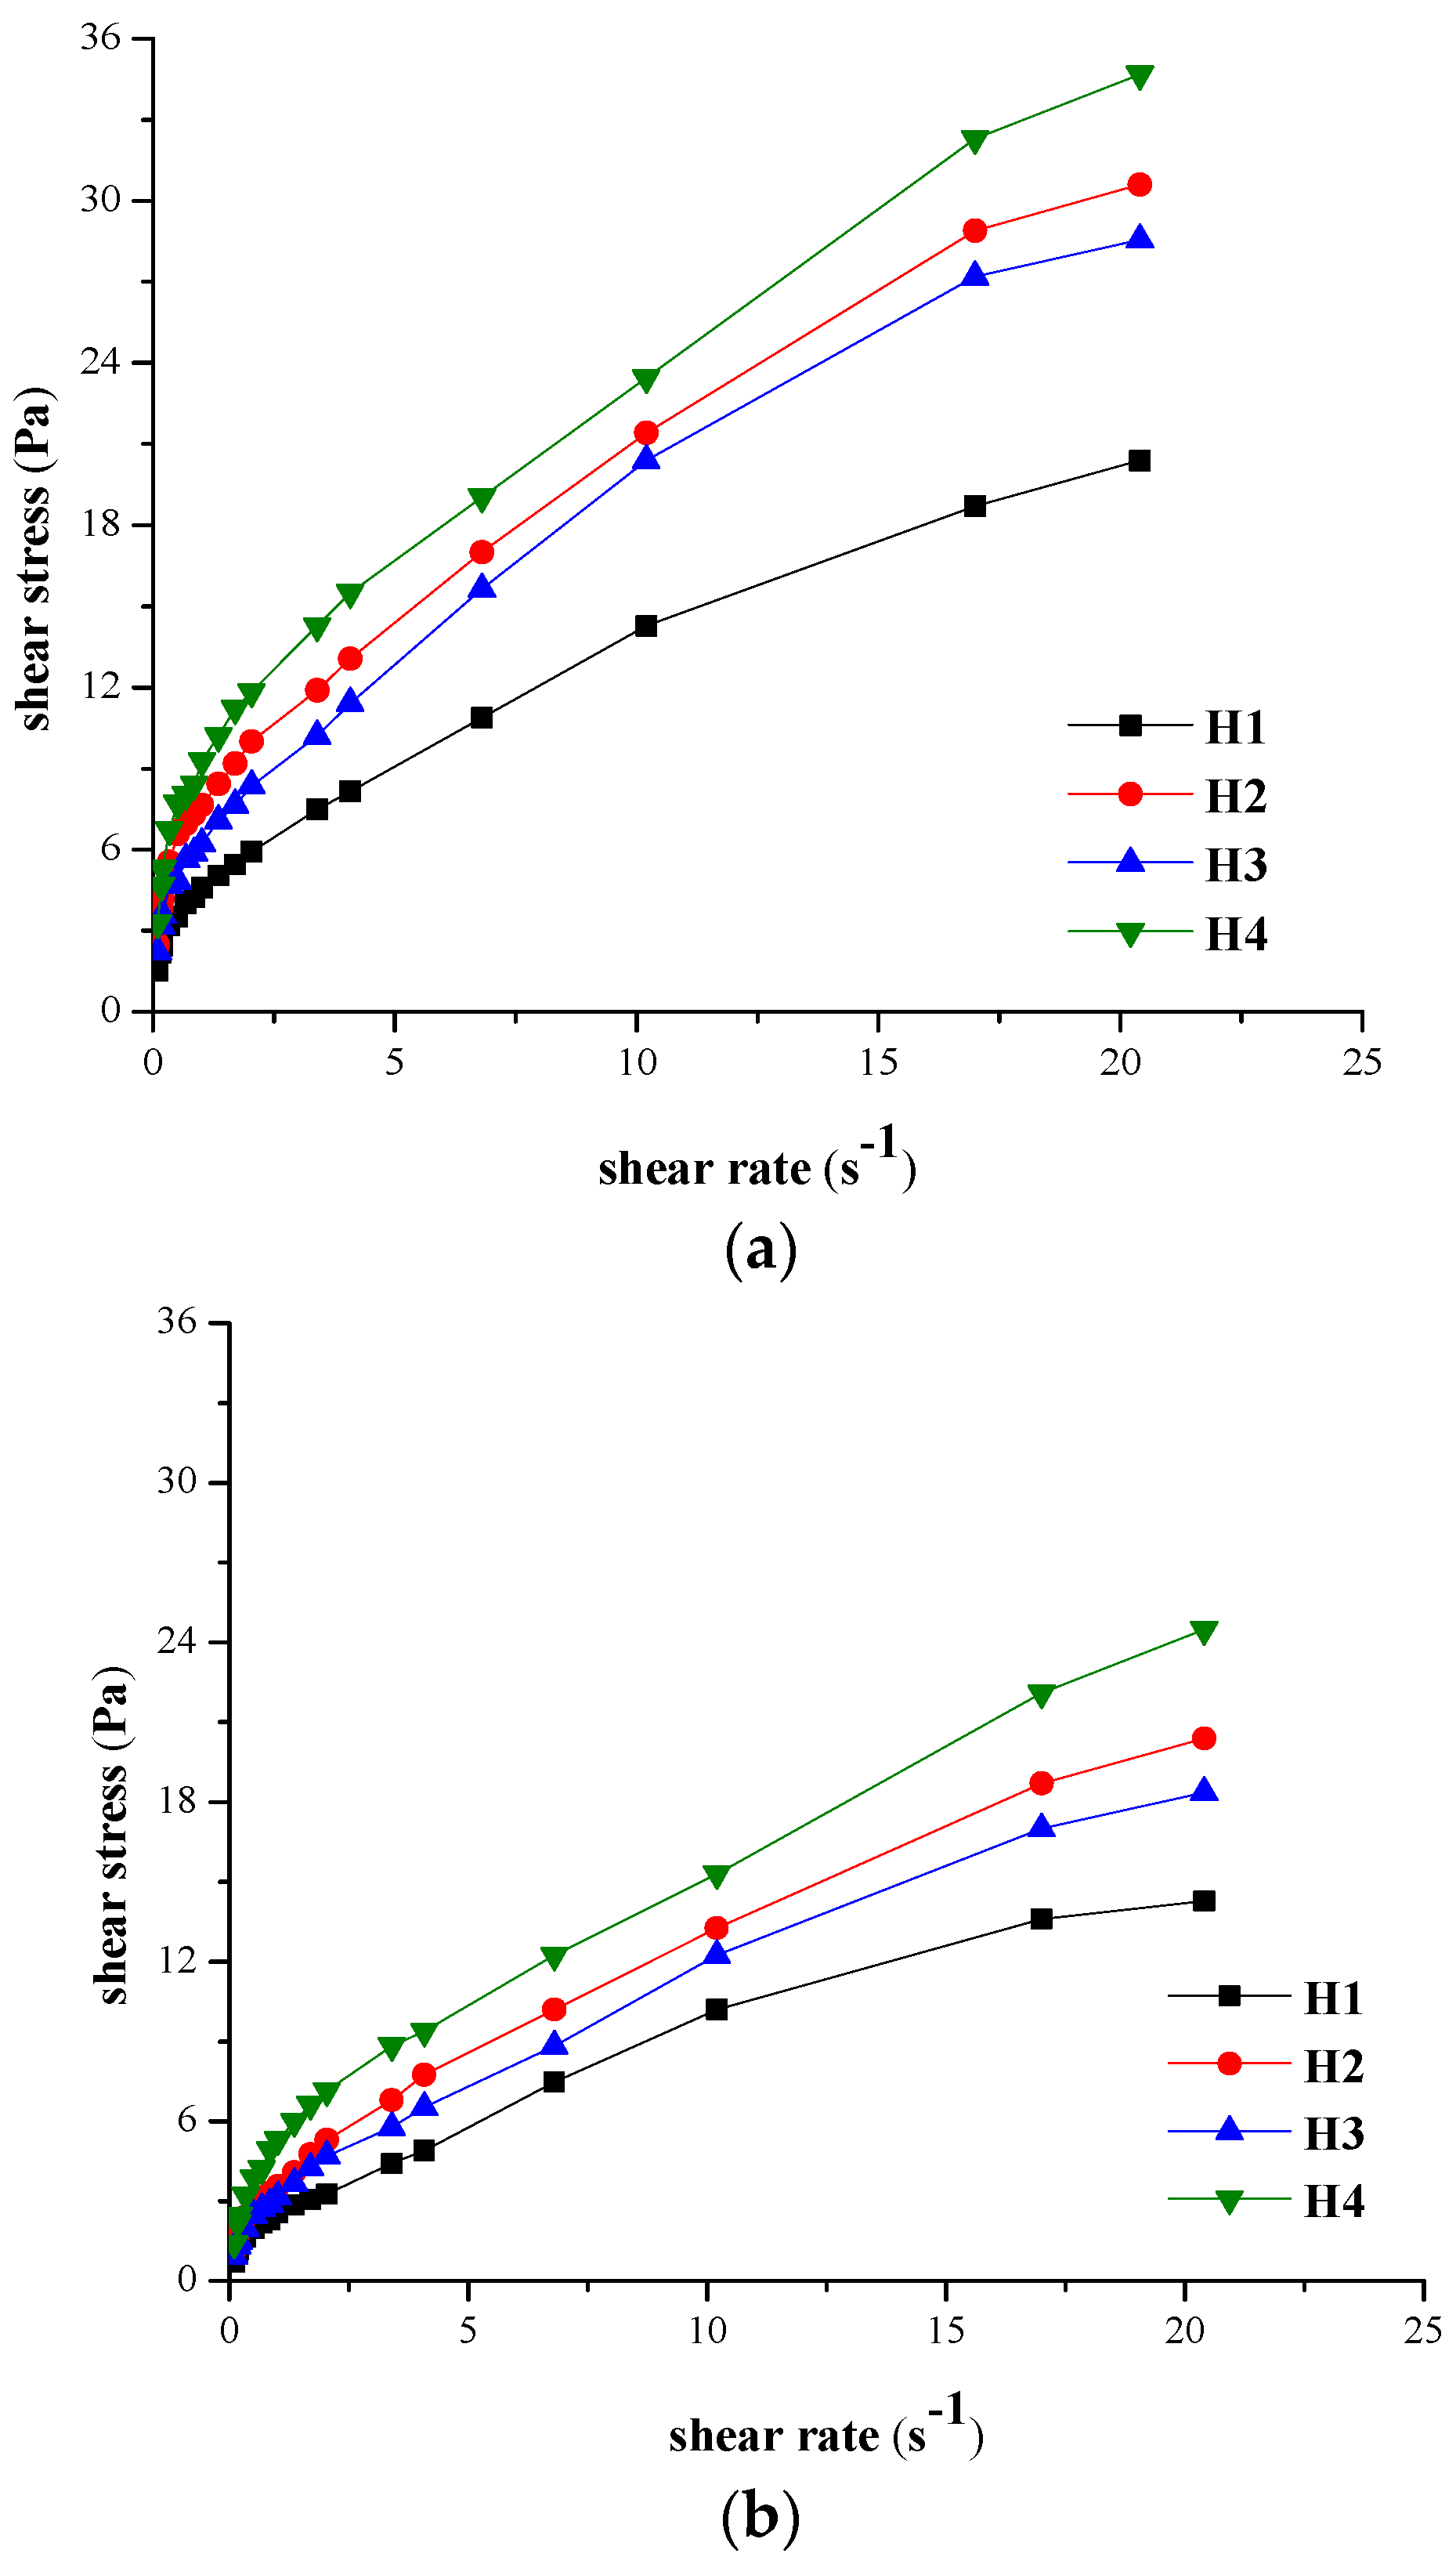
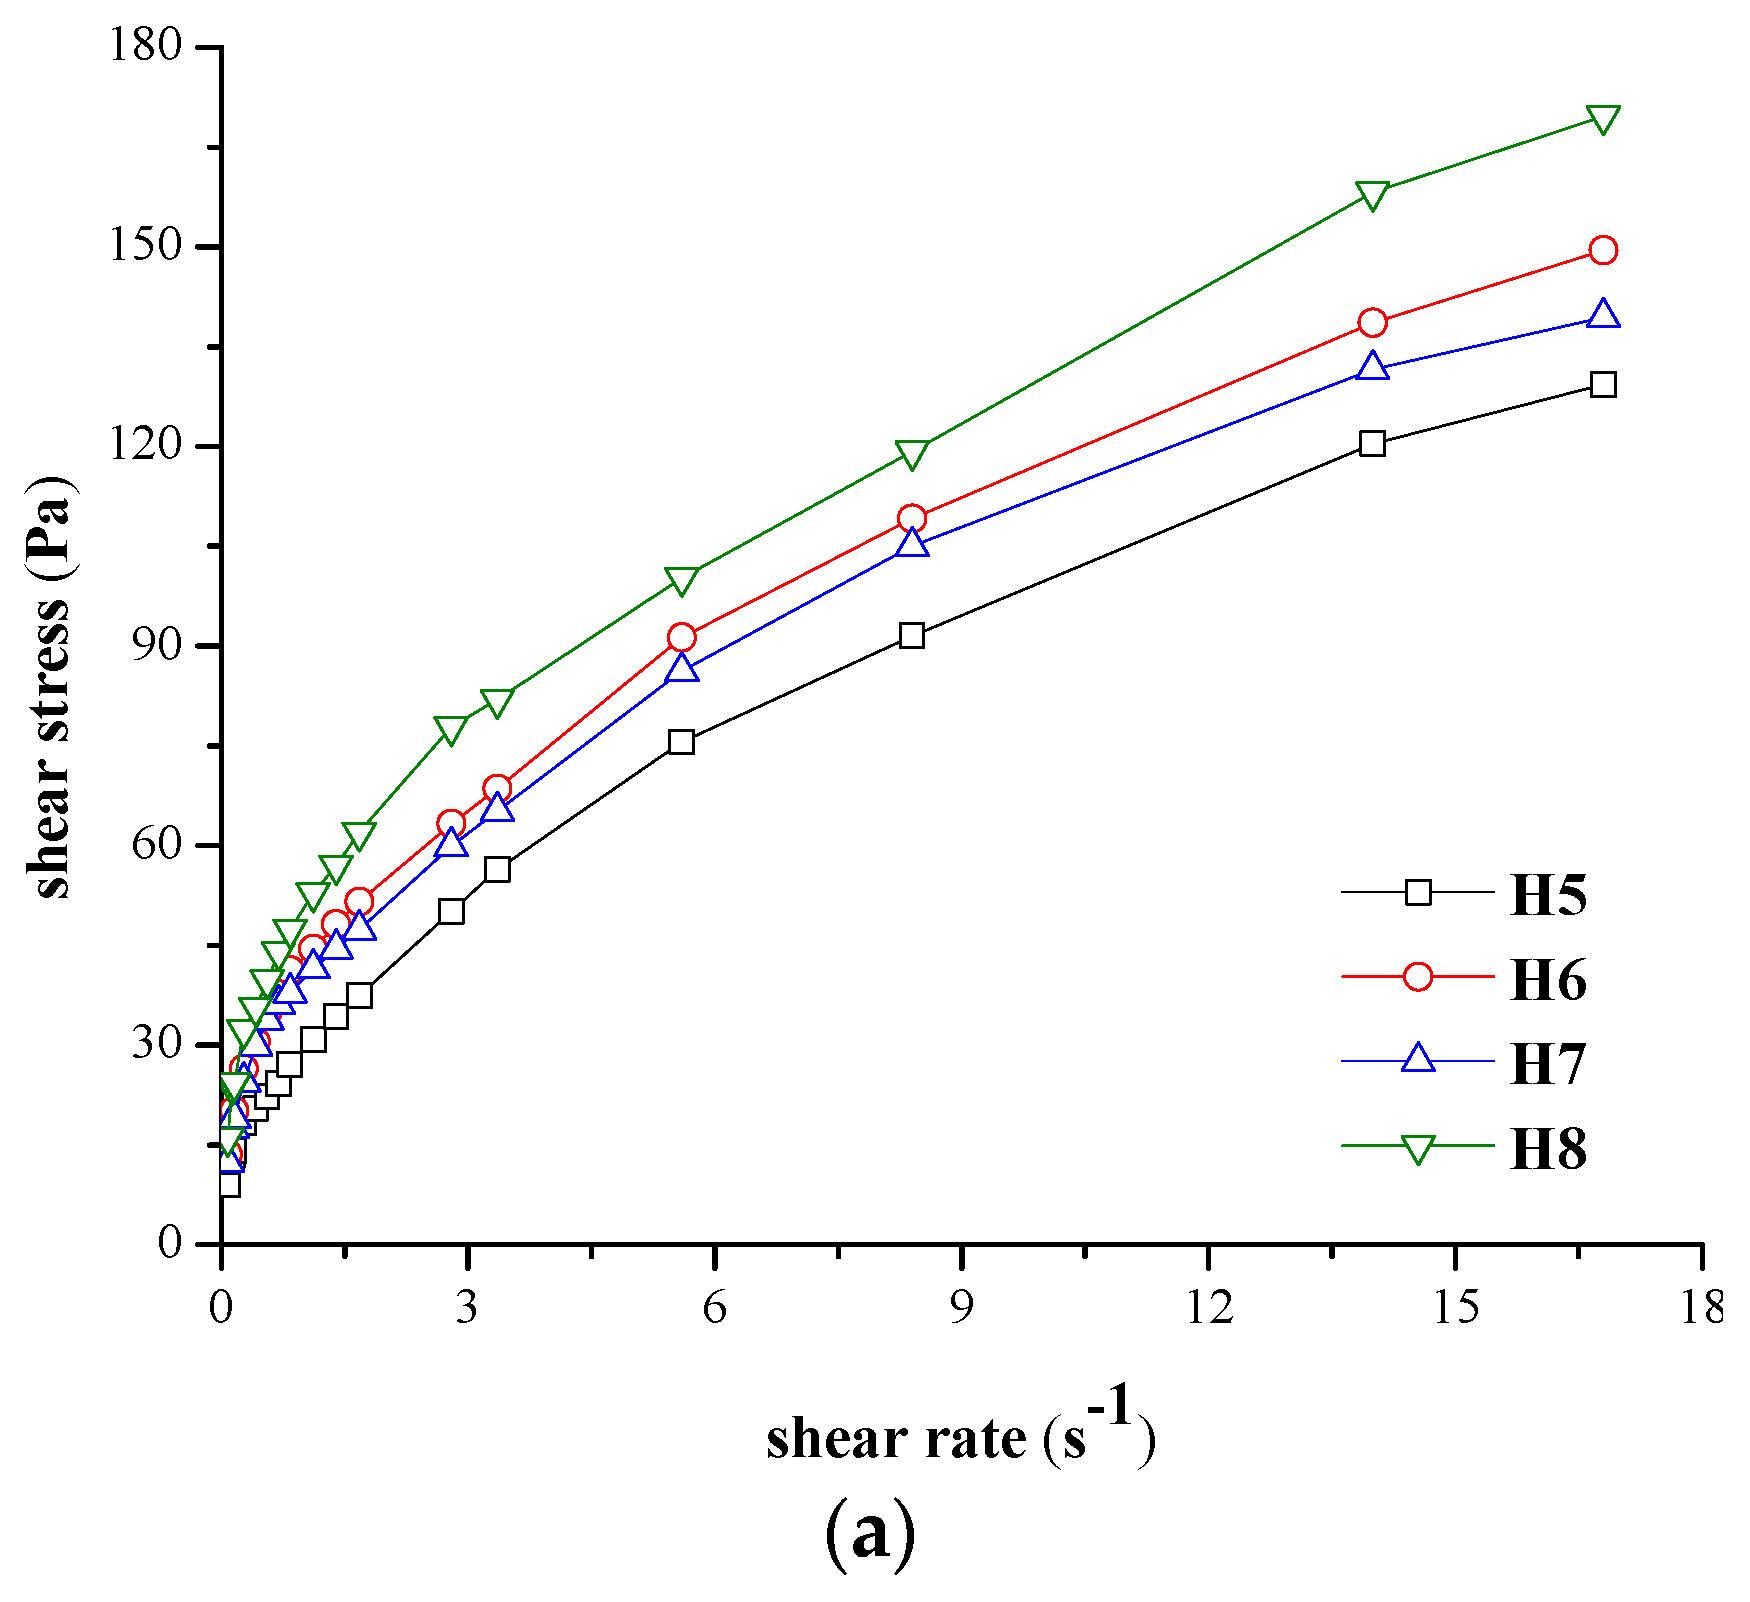
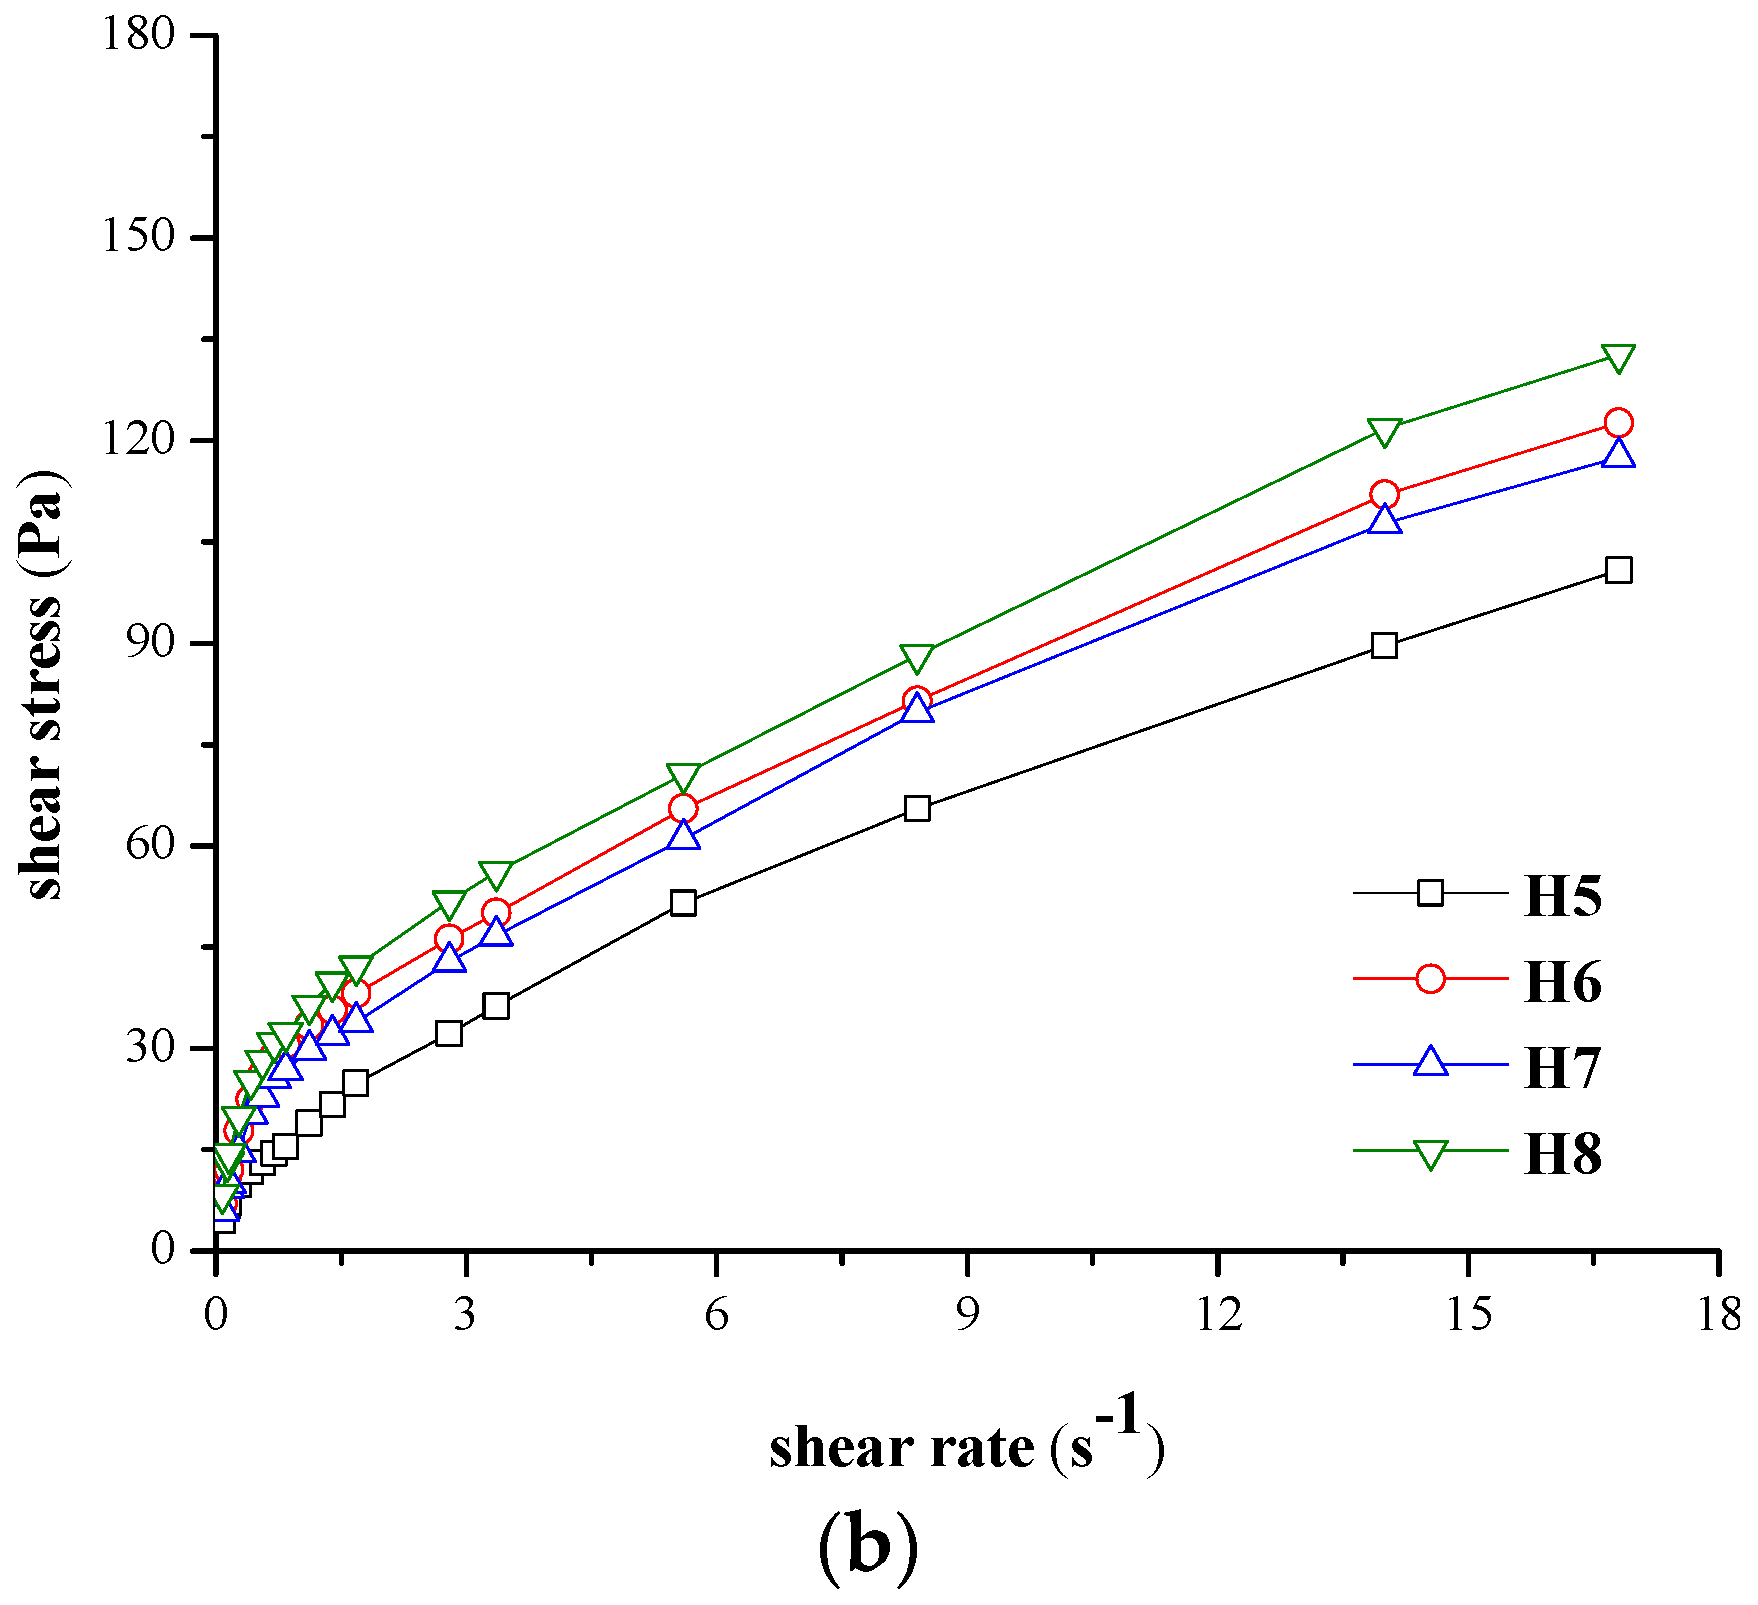
 Figure 1 and Figure 2 illustrate the forward rheograms according to the protocol described in Section “4.2.2. Rheological Measurements”, both at 23 °C and at 37 °C.
The relation between shear stress and shear rate was further analyzed with different rheological models: Ostwald-de Waele (Equation (1)), Herschel-Bulkley (Equation (2)), Bingham (Equation (3)), and Casson (Equation (4)):
τ = K · γ ˙ n
τ = τ 0 + K · γ ˙ n
τ = τ 0 + η · γ ˙
τ 0.5 = τ 0 0.5 + η 0.5 · γ ˙ 0.5
The significance of the terms from the Equations (1)–(4) is as follows: τ is the shear stress (Pa), γ ˙ is the Shear rate (s−1), η is the Plastic viscosity (Pa·s), τ0 is the Yield stress (Pa) associated with the critical stress applied for determining the start of hydrogel flow, K is the consistency index (Pa·sn) related to the hydrogel viscosity, n is the Flow behaviour index (dimensionless) indicating the non-Newtonian or Newtonian character (n < 1 for a Non-Newtonian pseudoplastic system, n > 1 for a Non-Newtonian dilatant system, and n = 1for a Newtonian system) [33,34,35].
The determination coefficients (”R2”) values (Table 1) were used as an indicator to select the hydrogel that best fitted the forward flow profiles.
The values of ”R2” specific to Ostwald-de Waele, Herschel-Bulkley, Bingham and Casson models, listed in Table 1, show that the best fit is obtained for Herschel-Bulkley model for all the prepared hydrogels, in this case “R2” ranging between 0.9955 and 0.9987 at 23 °C and from 0.9941 to 0.9996 at 37 °C. The descriptors specific to this model are summarized in Table 2 for all systems tested at both temperatures, their significance being previously mentioned.
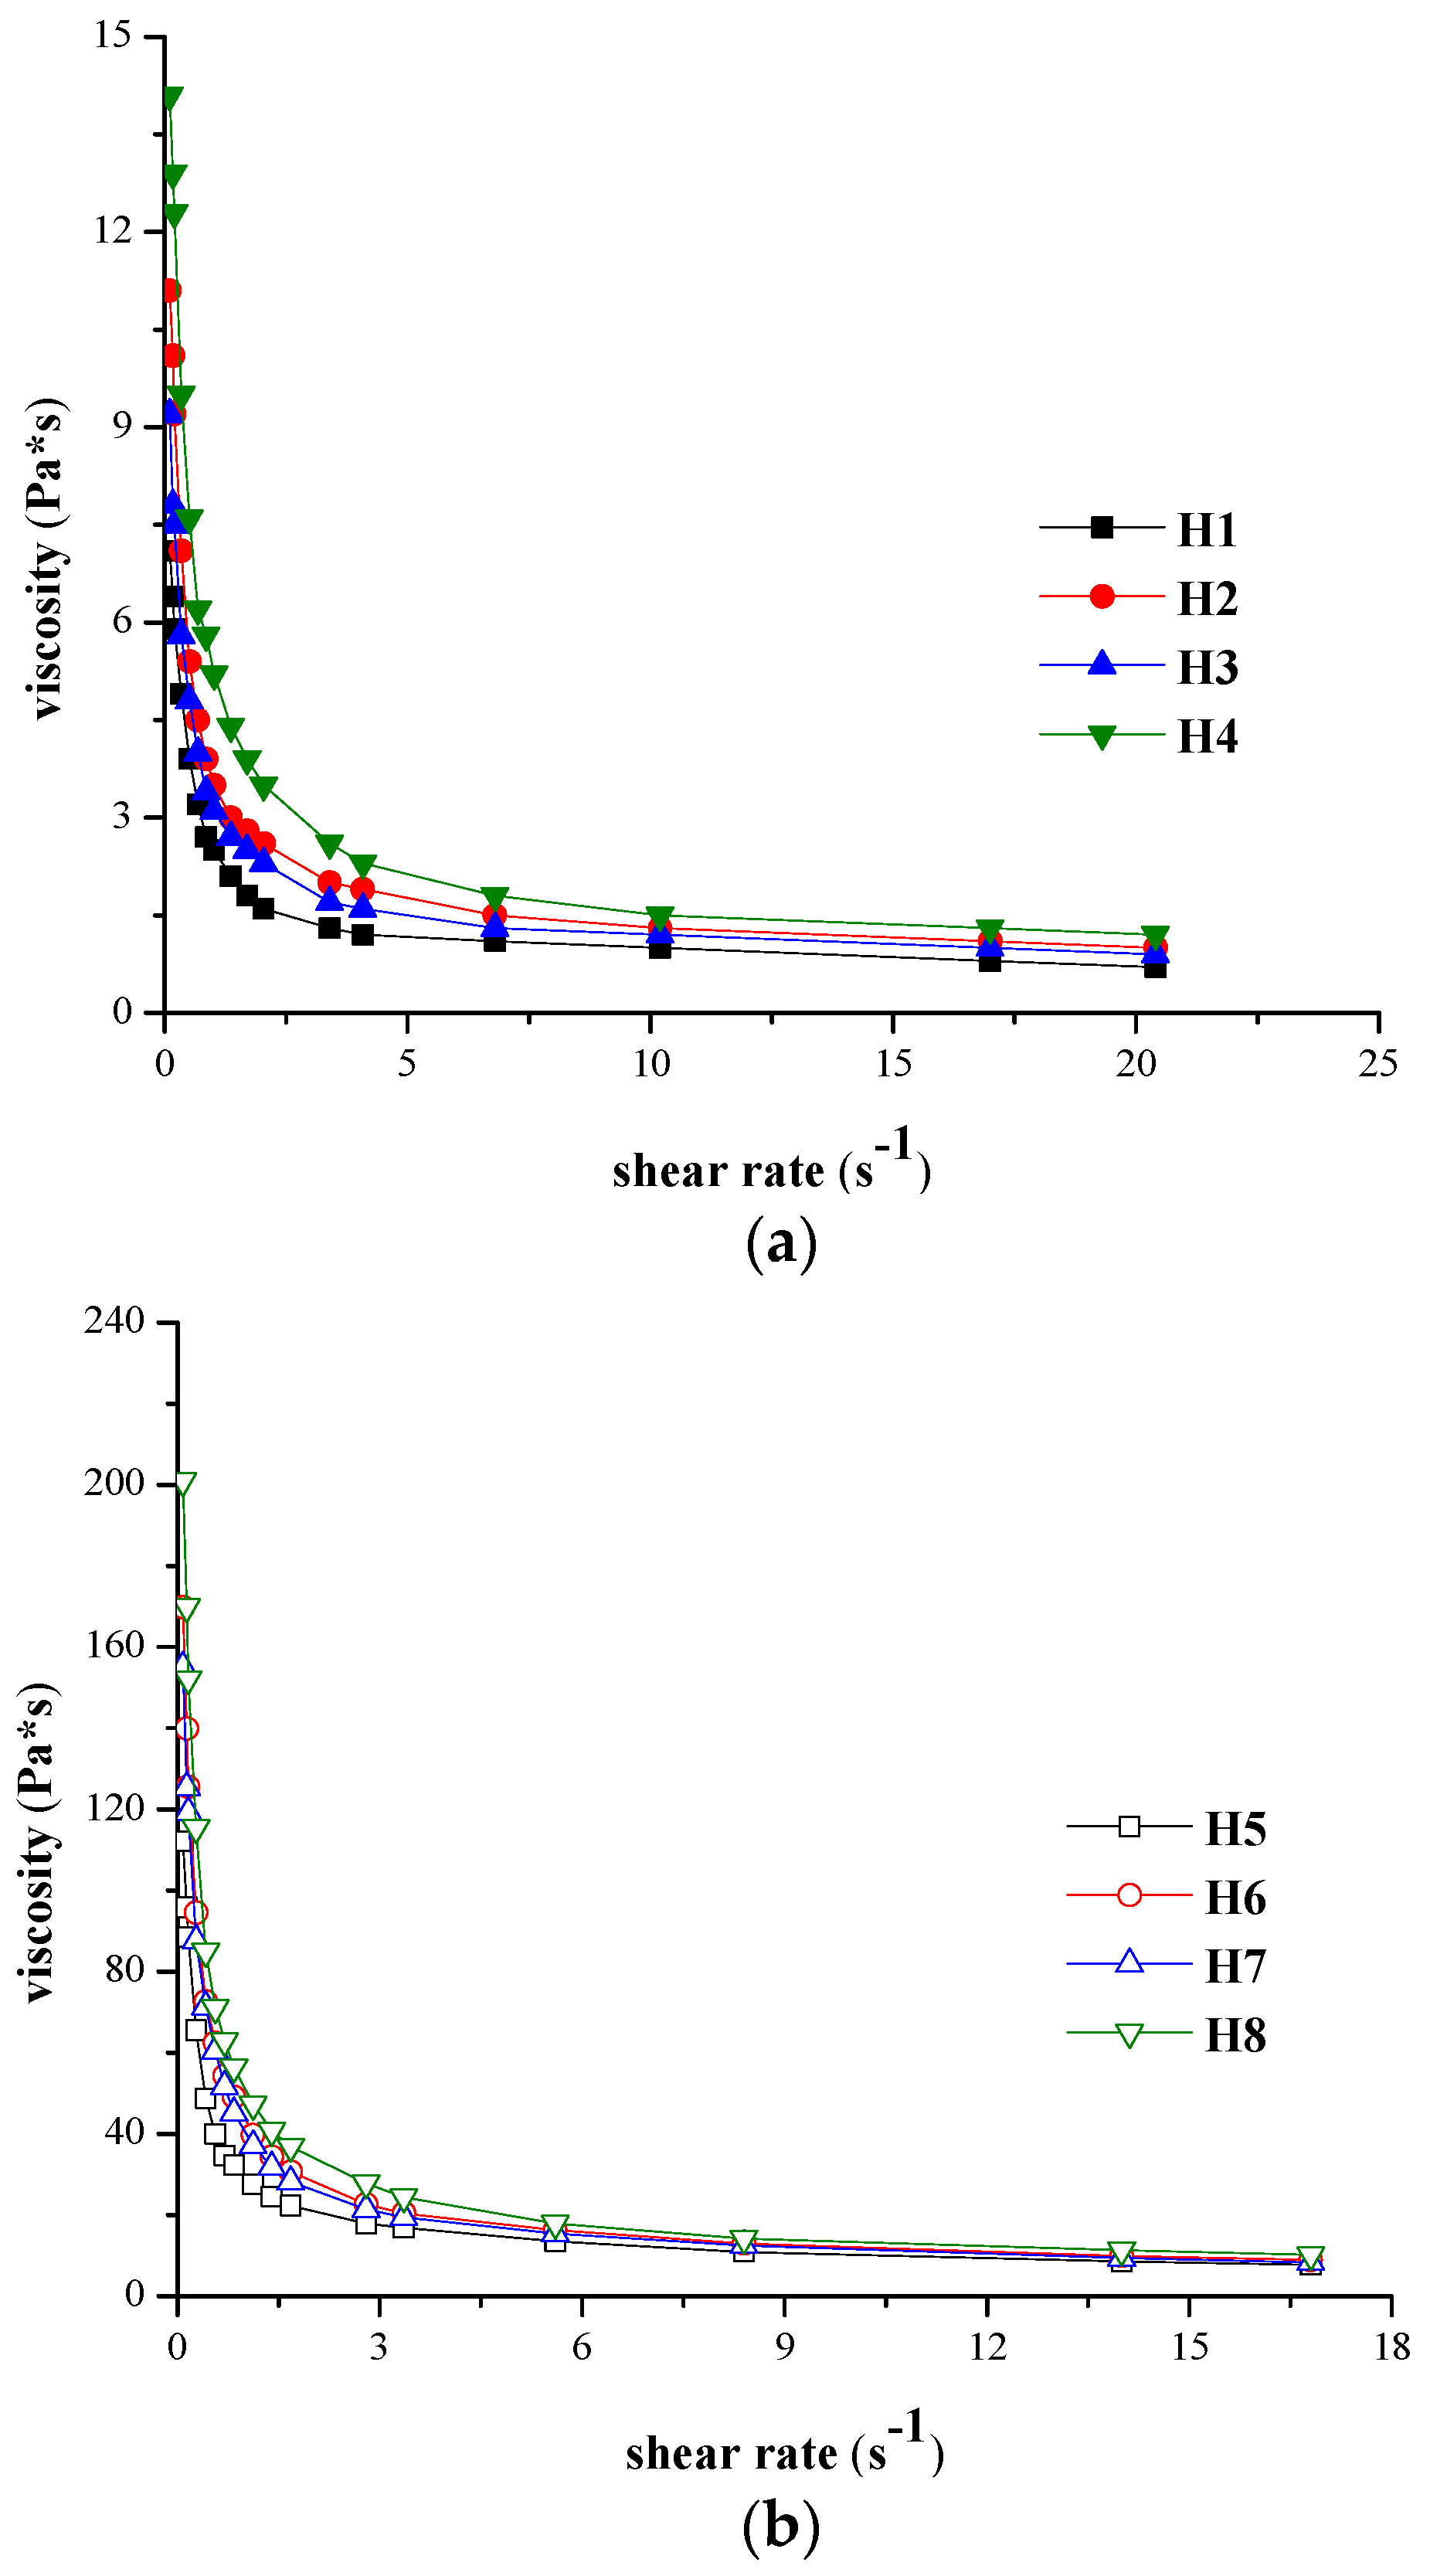
The hydrogels pseudoplasticity can also be expressed through the forward curves viscosity vs. shear rate, presented for exemplification in Figure 3a,b.
In this case, the flow profiles were investigated by fitting the Power law model to the rheological data (Equation (5)):
η = m · γ ˙ n
where “m” and “n” parameters are assessed through the linearization of Equation (5) by double logarithmic method. The “m” parameter is associated with the viscosity obtained for the shear rate of 1 s−1 [36].
The power law parameters “m”, “n” and the determination coefficient ”R2”, specific to forward and backward rheological measurements (recorded at different stirring times at a maximum rotational speed of 60 rpm) [37] are given for all samples in Table 3 and at both temperatures in Table 4.
Another important issue in the hydrogel rheological characterization is their thixotropic behaviour. The return of the hydrogel to its initial structure is called thixotropy and was assessed by monitoring the viscosity change during the recovery process after shearing [34,37,38,39].
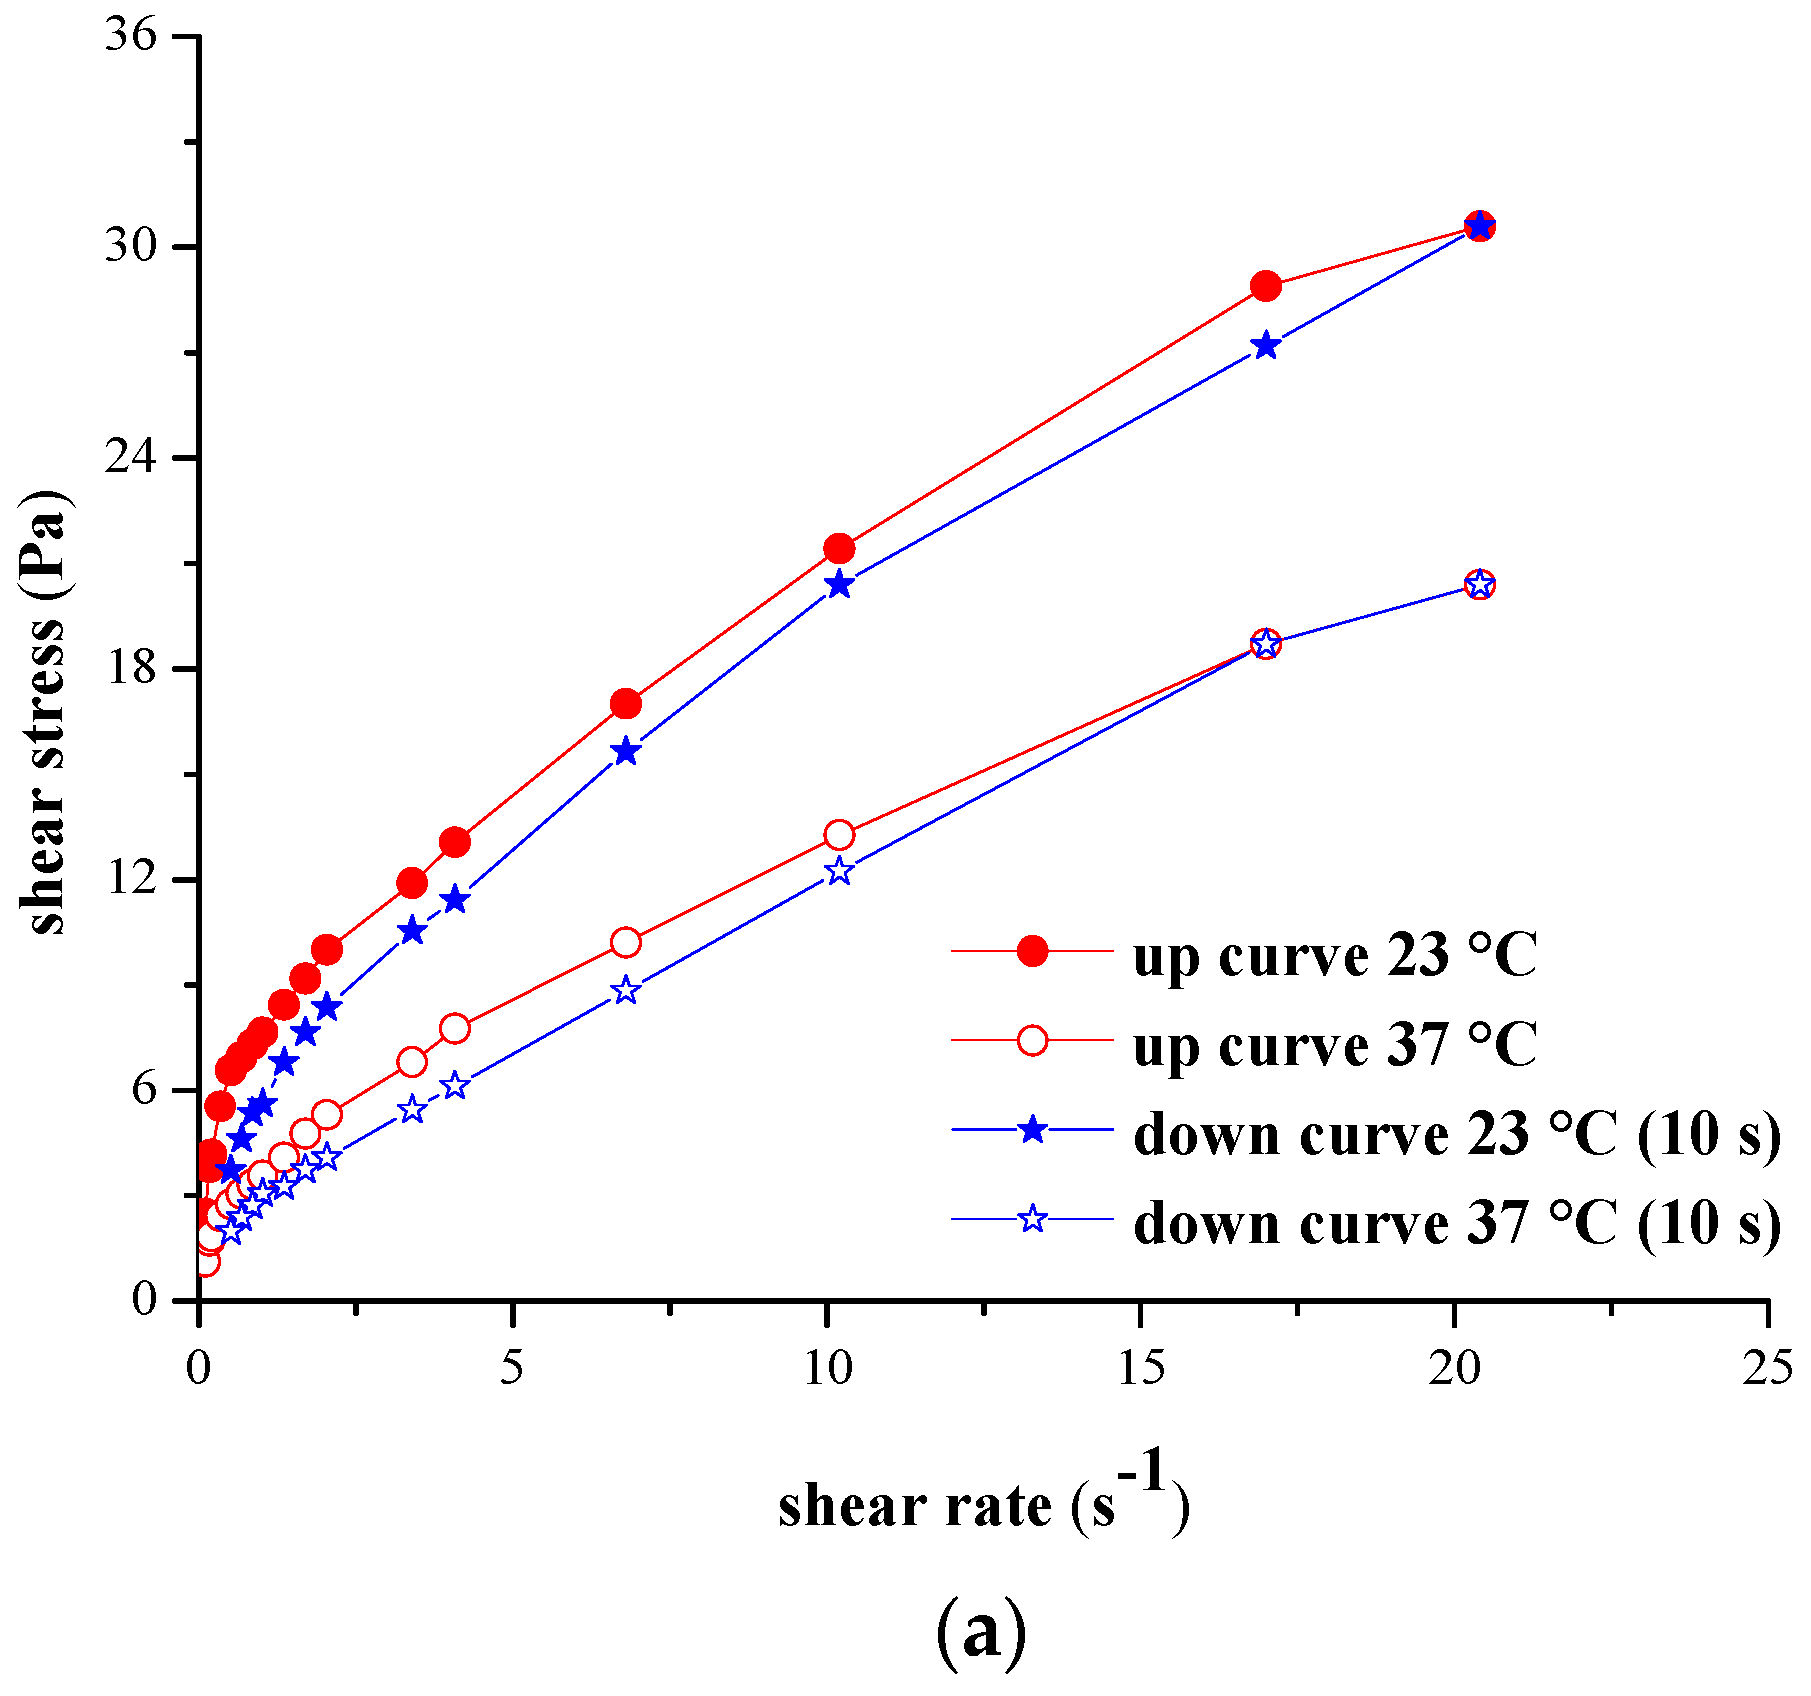
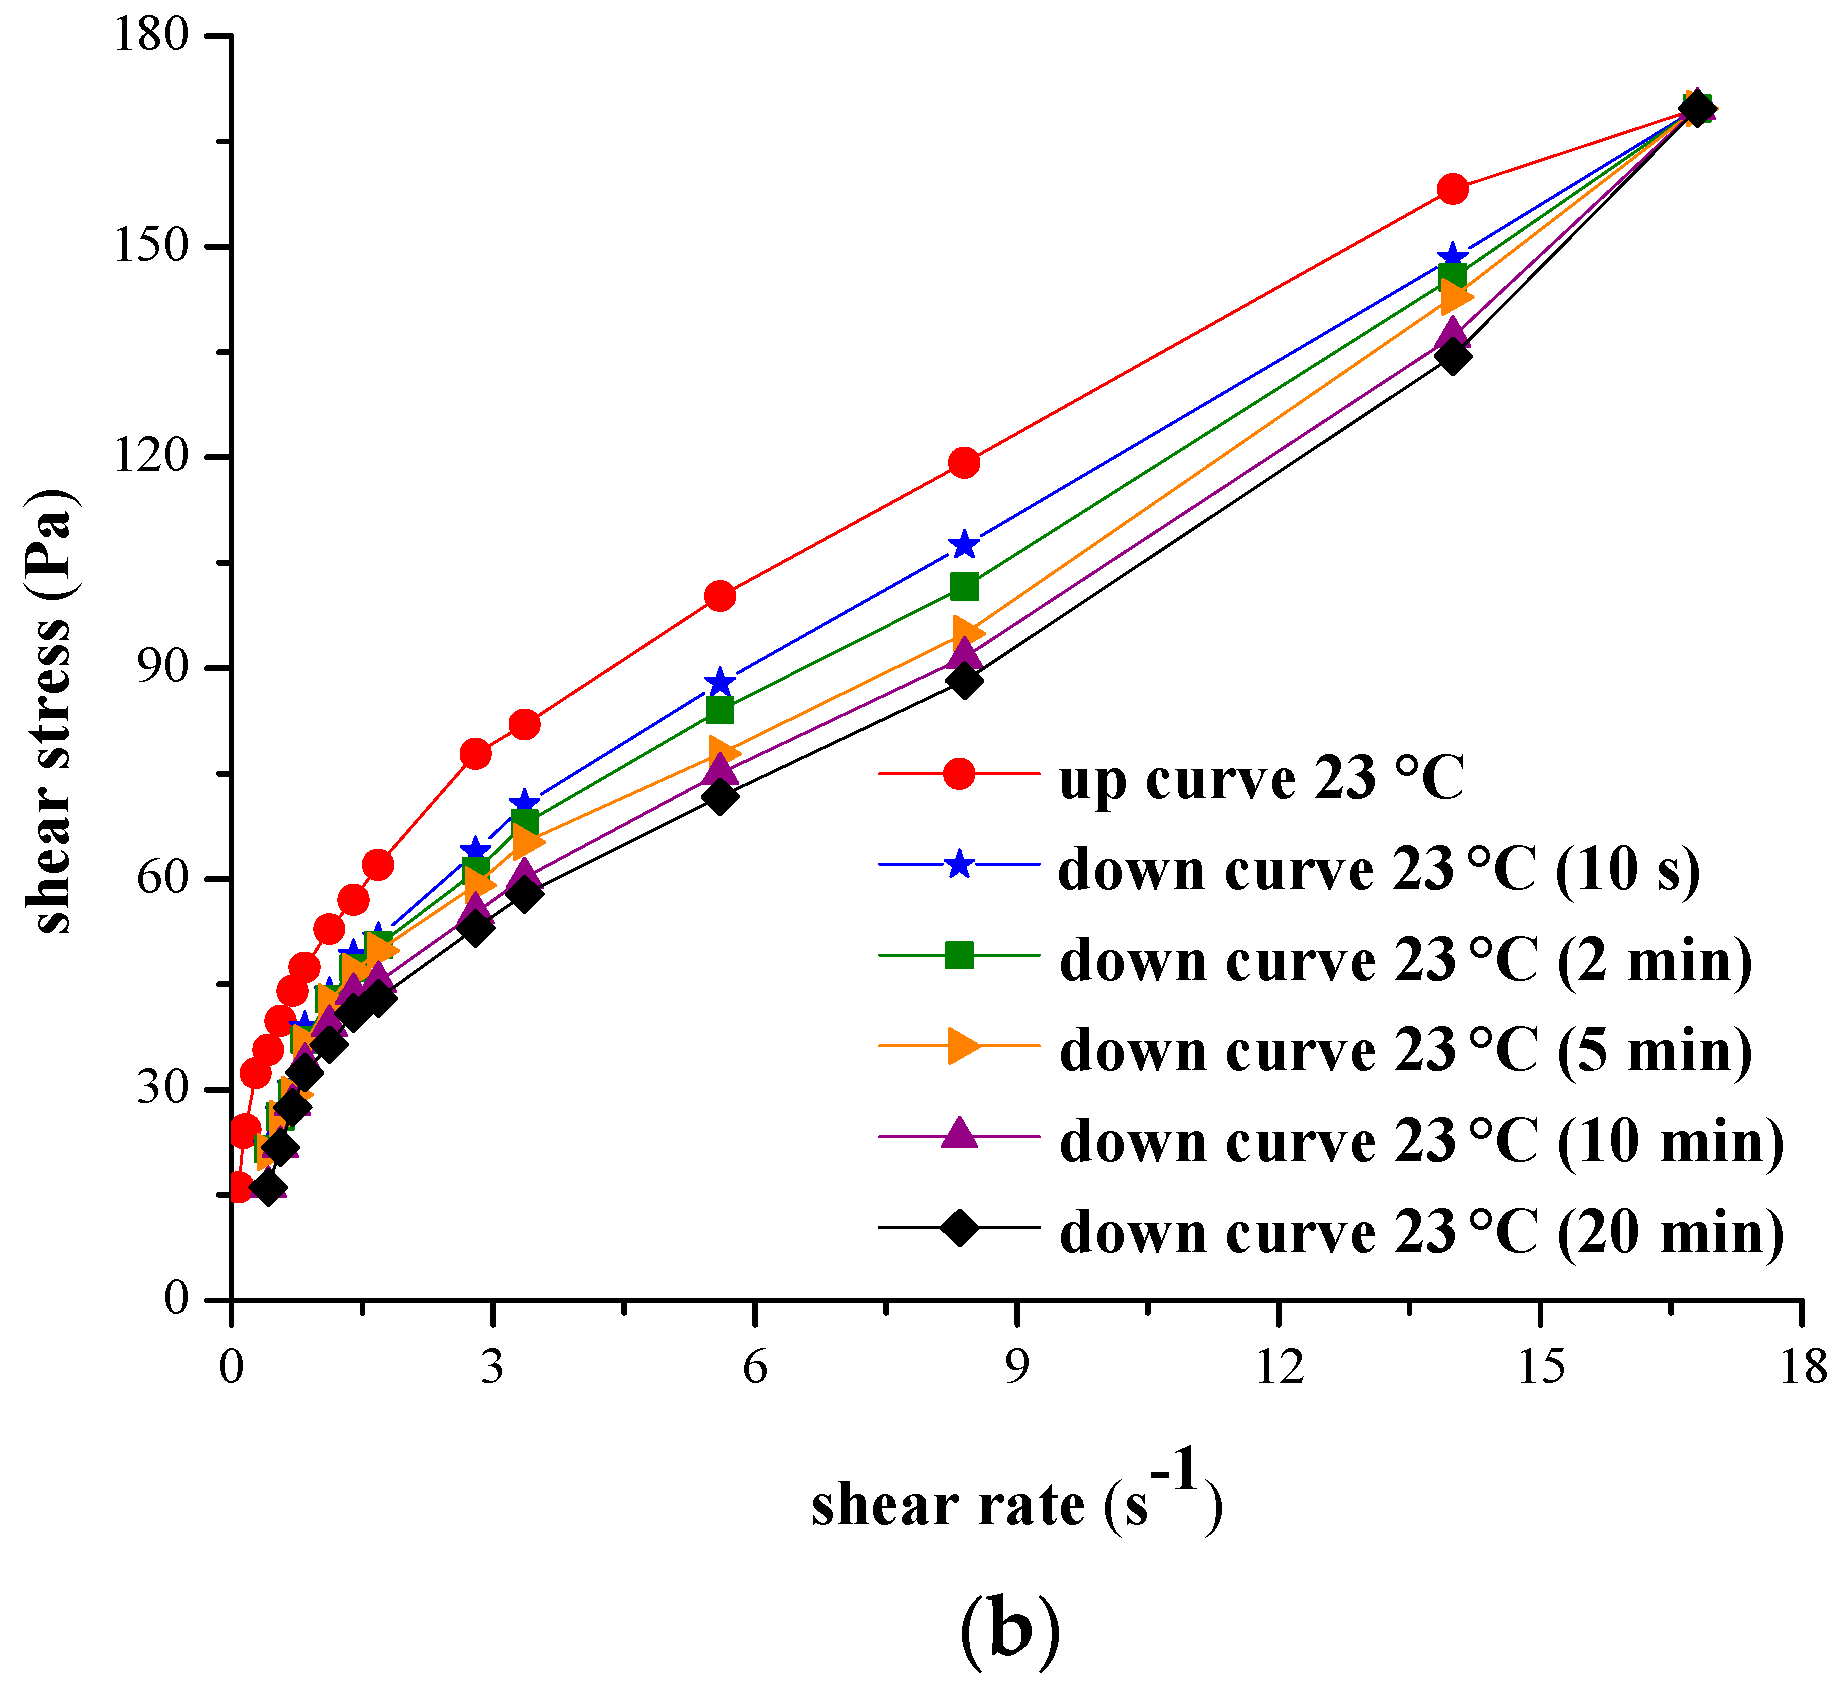
The thixotropic character of the designed hydrogels, determined at both temperatures, was emphasized by the recorded forward and backward rheograms, exemplified for hydrogel H2 analyzed at 23 °C and 37 °C, and hydrogel H8 investigated at 23 °C at different stirring times (10 s, 2 min, 5 min, 10 min, 20 min) for the maximum rotational speed selected for the rheological analysis.
The quantification of thixotropy was accomplished through specific descriptors as thixotropic area, thixotropic constant, thixotropic index and destructuration thixotropic coefficient [34,40,41,42,43,44]:
  • Thixotropy area (hysteresis loop area, Sthix) is the surface between the forward curve (Sfwd) and the backward curve (Sbw) (Equation (6)):
    S thix = S fwd S bw
    where Sfwd corresponds to a complete hydrogel rheodestruction being correlated to the hydrogel normal manipulation time to expose the drugs incorporated in such formulations to the absorption at the application site, and Sbw refers to the recovery of the initial structure by the sheared hydrogel.
The hysteresis area value is an indicator for the degree of system destructuration, higher values for thixotropic area indicating a higher thixotropy.
But backward curve position, in comparison with the forward curve, is depending on the stirring time (t) at the maximum rotational speed that was selected. Thus, Equation (6) can be written as follows:
S thix ( t ) = S fwd S bw ( t )
Different mathematical relations have been suggested to quantitatively describe the variation of the area included by the backward curve rheogram as a function of the stirring time at the maximum rotational speed selected for the experiment. The equation proposed by Dolz et al. has been verified for a series of polymers (Equation (8)):
S bw ( t ) = S bw ( min ) + ( S fwd S bw ( min ) ) · e f ( t )
Taking into consideration Equation (8), the relation for determining the thixotropy area becomes:
S thix ( t ) = ( S fwd S bw ( min ) ) · [ 1 e f ( t ) ]
where Sthix(t) is the area of the hysteresis loop at a certain stirring moment and Sfwd is the area corresponding to the maximum forward or backward curve at the theoretical stirring moment t = 0, Sbw(min) is the area under the backward curve at maximum stirring time applied in the experiments, Sbw(t) is the area under the backward curve at moment “t” of stirring and f(t) is a function depending on the rheological behaviour of the semisolid system studied. This last equation proves the dependency of the thixotropic area on the stirring time at maximum rotational speed. It can be stated that an ideal (minimum) thixotropy area corresponds to a zero stirring time.
2.
For different gel-forming polymers used in various concentrations or in various combinations with other components (sodium salt of carboxymethylcelulose, aerosil, sodium carboxymethylcelulose mixed with bentonite), Dolz et al. [40,41,42] have found that f(t) becomes:
f ( t ) = c · t
where “c” is the thixotropy constant, a parameter linked to the rate for which the backward area Sbw(t) reaches its minimum, characterizing the variation in time of the backward area. If the system has a thixotropic behaviour, the value of this constant is higher than 0, as the backward area must decrease with the stirring time increase. Furthermore, only when the thixotropy constant value is finite, the area depends on the stirring time. The more the “c” constant value increases, the faster the system reaches maximum destructuration.
3.
The thixotropy index (Thyst%) is the relative thixotropy area, expressed as a percentage of the area rheodestroyed by stirring at maximum rotational speed, compared to the backward area (Equation (11)):
T hyst % = [ ( S fwd S bw ( t ) ) S fwd ] × 100
The higher the value of the thixotropy index, the system becomes more thixotropic. Due to measuring errors in the determination of the shear stress (maximum 5%), during the determination of Sfwd and Sbw(t) areas, only the Thyst% values larger than 5% will be considered. For any result under this value, it can be safely assumed that the gels were non-thixotropic.
4.
Another thixotropic parameter, which can be linked to the stirring time at the maximum rotational speed selected is the tixotropic destructuration coefficient (B), determined according to Equation (12):
B = τ ( t 1 ) τ ( t 2 ) ln ( t 2 t 1 )
where τ(t1) and τ(t2) are the shear stress at stirring times t1 and t2, at maximum rotational speed.
The values for the aforementioned thixotropic descriptors, as well as for the forward and backward areas recorded at different moments during hydrogels stirring at maximum rotational speed and at 23 °C and 37 °C respectively are shown in Table 5 and Table 6.
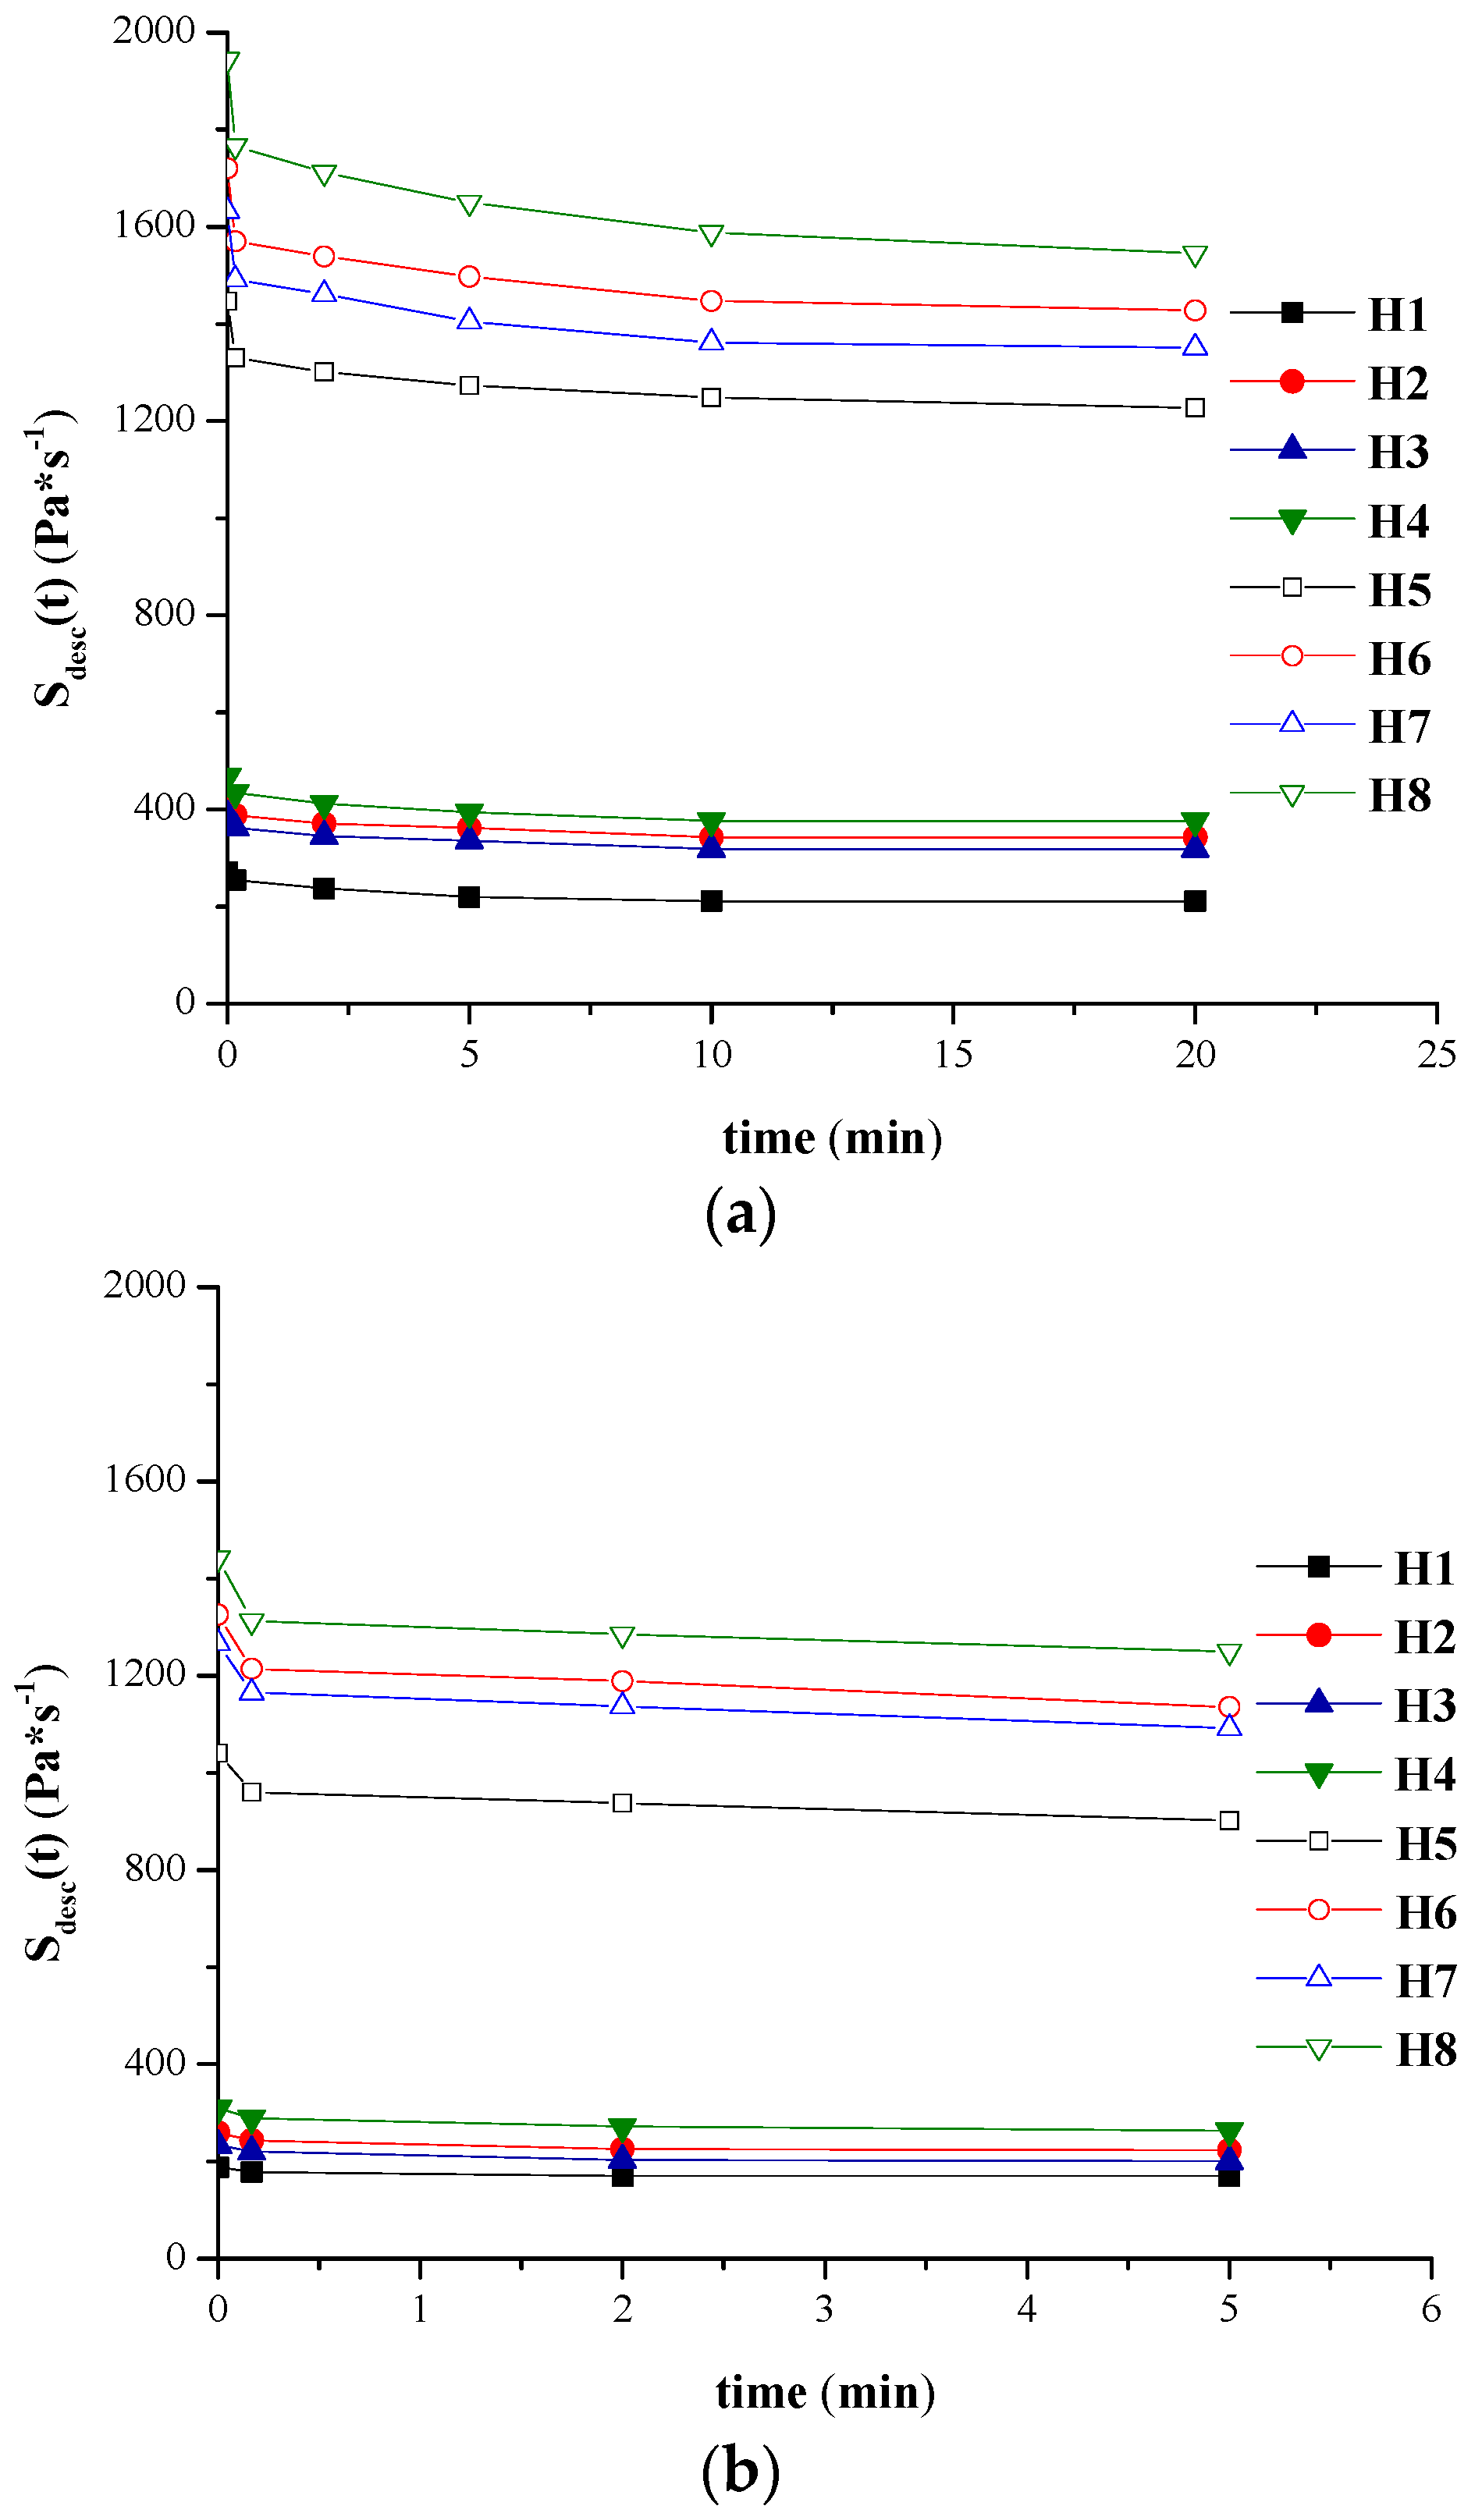
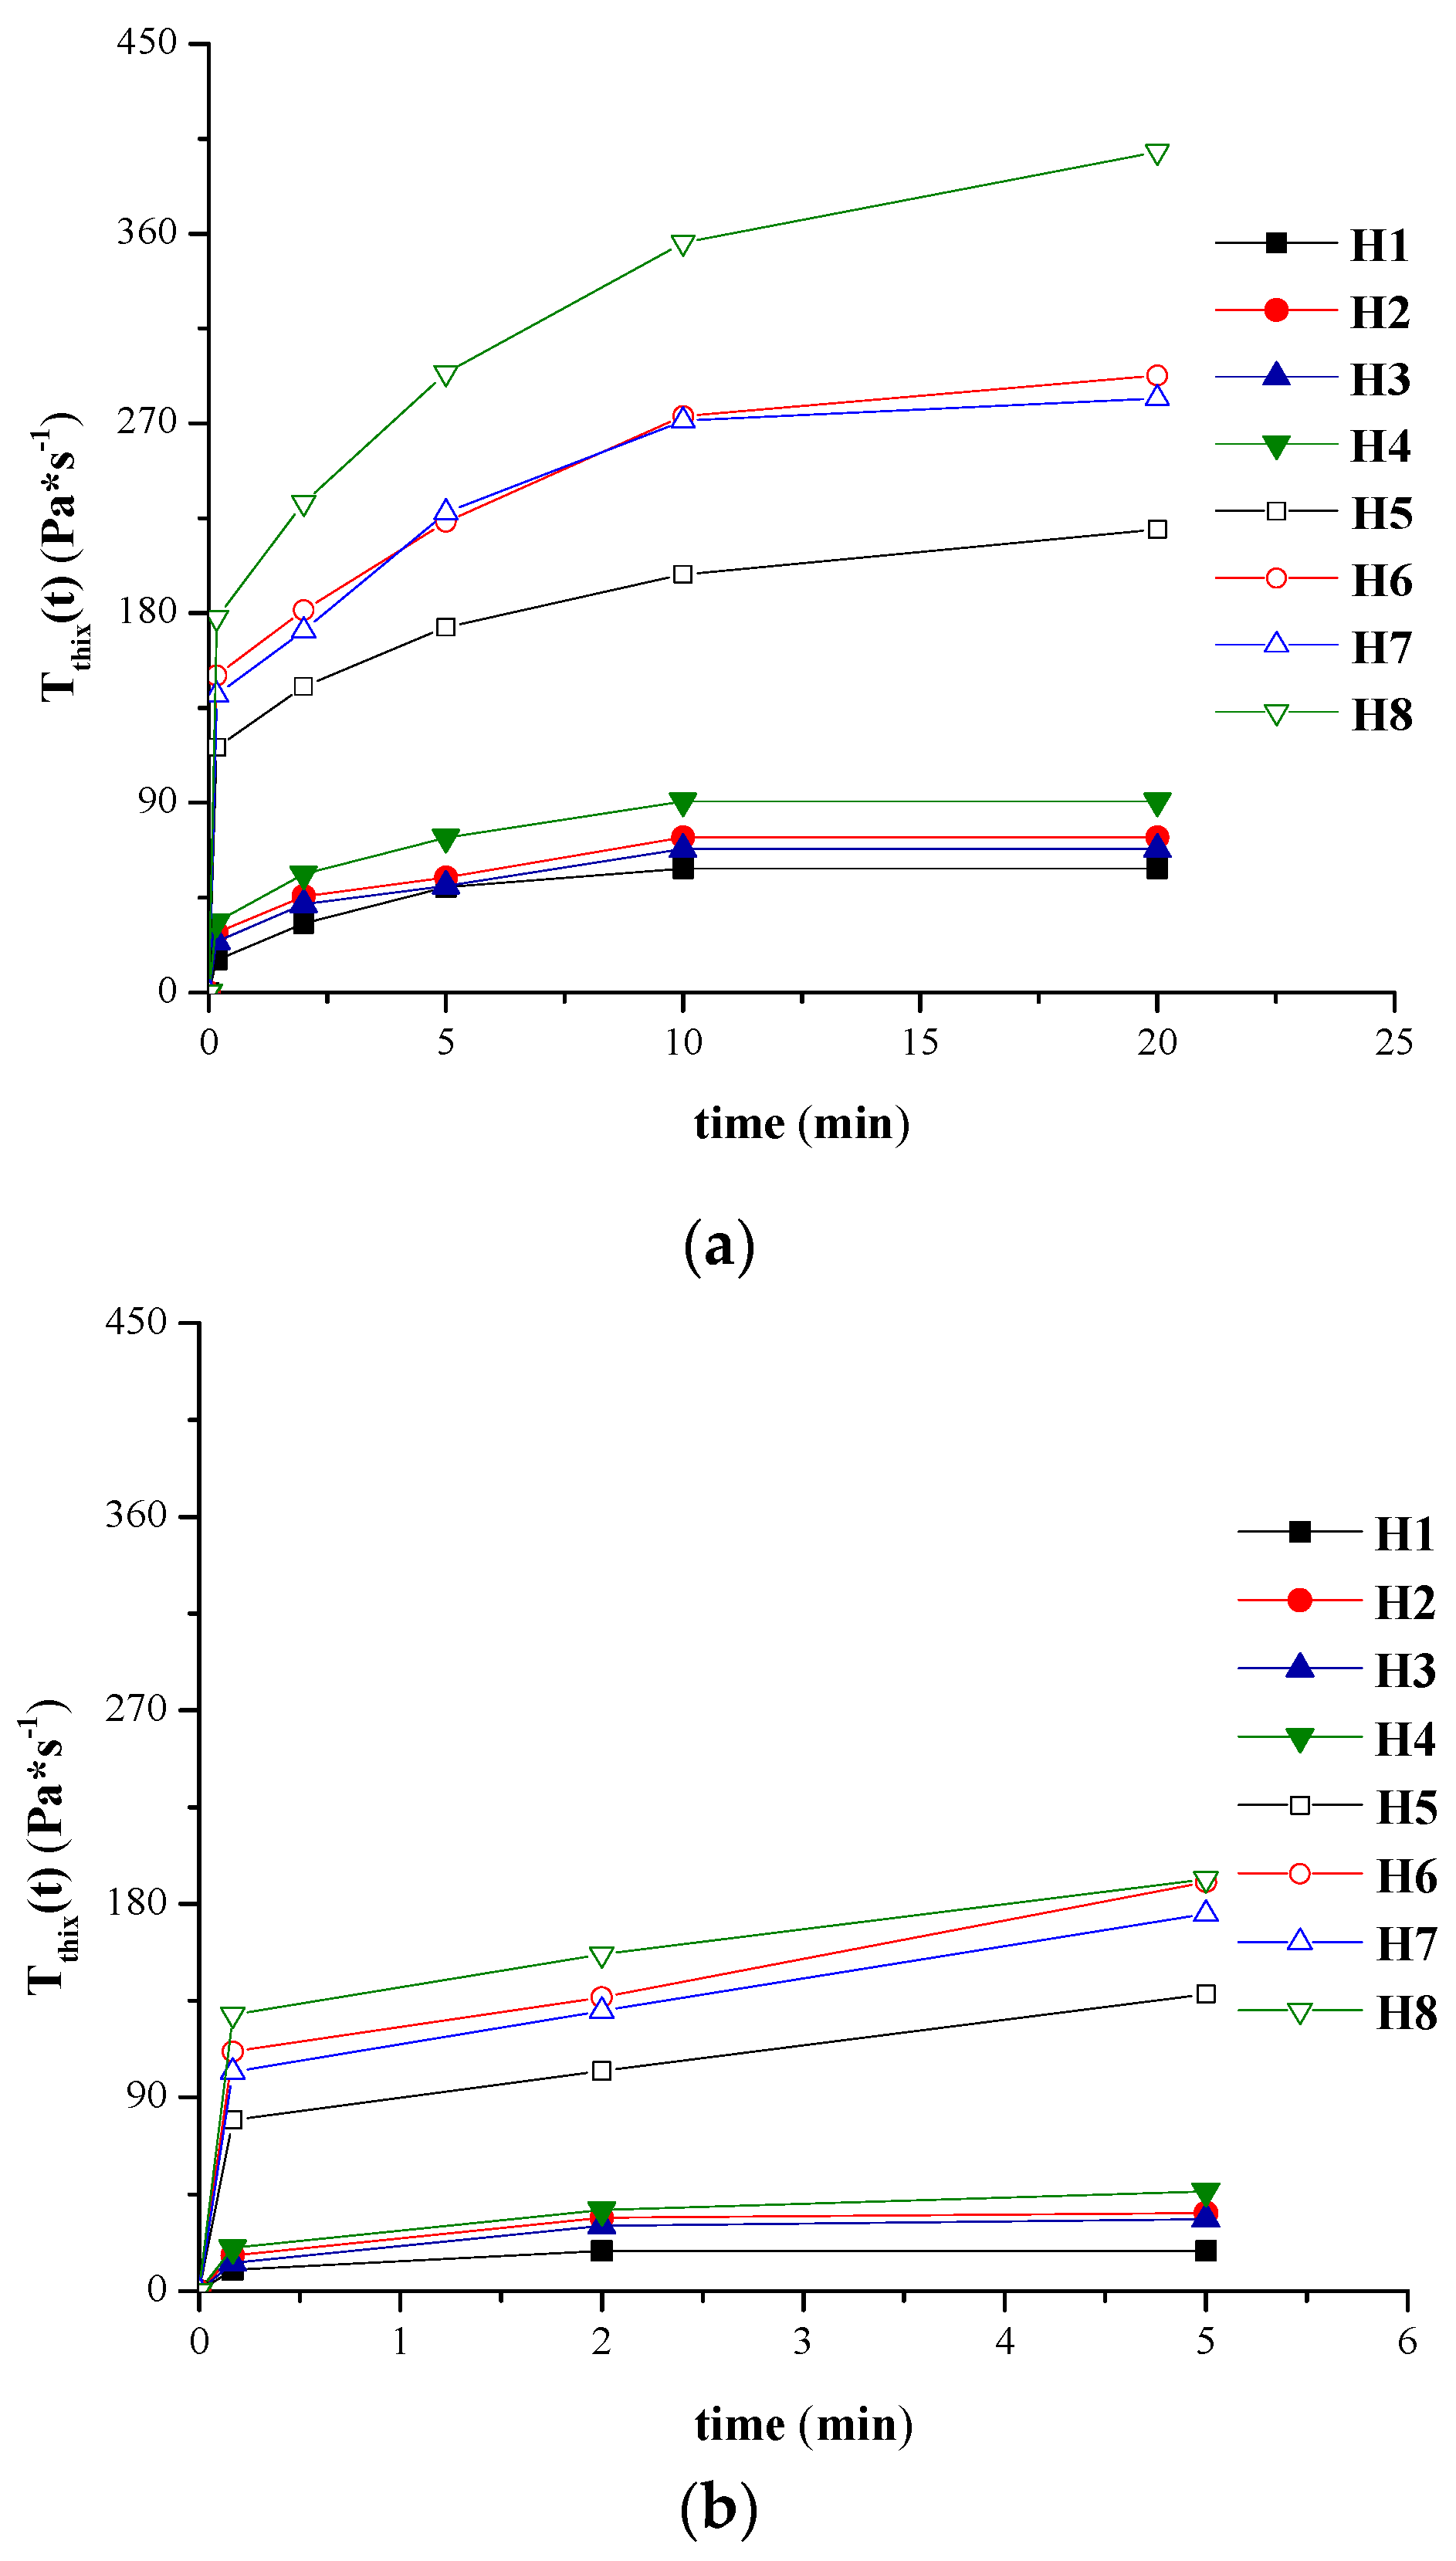
The graphical conversion of the variation of areas corresponding to the backward curve and of the thixotropy area respectively vs. different stirring times at the maximum rotational speed are presented in Figure 4a,b and Figure 5a,b for H1–H8 hydrogels tested at both temperatures.

3. Discussion

The influence of formulation factors as well as of the work temperature on different flow parameters and thixotropic descriptors for different NaCMC hydrogels was further discussed. These rheological properties of the prepared hydrogels are strongly influenced by the gelation mechanism. Initially, the water uptake by the NaCMC leads to chain entanglements and solvent entrapment in the spaces formed in the 3D networked structure. As the formation of final NaCMC hydrogels is a consequence of the physical interactions between gel-forming polymer, non-gelling polymer, water and indomethacin as sodium salt, the application of an increased shear stress conducts to an easier partial destruction of the gel network compared to chemically cross-linked hydrogels.
The shapes of the forward rheograms for all the hydrogels, shown in Figure 1 and Figure 2, have similar appearance on the shear rate range applied in the experiments, regardless the concentration of the hydrogels in NaCMC, PEG 400 or PEG 1000. In all cases, the shear stress increased with the shear rate.
The data presented in Table 2 show that the hydrogels exhibit pseudoplastic properties, the value of flow index “n” being less than 1. The flow index values are correlated with the degree of pseudoplasticity, smaller values leading to a marked degree of shear thinning. This behaviour is more pronounced at 23 °C compared to 37 °C, the temperature decrease determining an increase of shear thinning, highlighted by the decrease of ”n” value.
Also, yield stress and consistency index decreased with the temperature increase. Thus, for the hydrogel with minimum concentration of NaCMC, τ0 decreases about 2.47 times and K about 1.73 times at 37 °C, meanwhile for the hydrogel with maximum concentration of NaCMC, the above parameters decrease about 1.25 times and 1.58 times respectively. This behaviour is explained by the increased mobility of the polymeric chains and the decrease of polymeric chains clusters life-time.
At a certain temperature, the formulation factor concerning the amount in gel-forming polymer (NaCMC) markedly influences the values of the aforementioned rheological descriptors and determines significant differences corresponding to the two variation levels (1% and 2%). Thus, at the lower temperature, an increase of about 2.42 times for τ0 was recorded, respectively of about 3.39–5.84 times at a higher temperature. The consistency index was obviously higher for the hydrogels with a high concentration in NaCMC, at 23 °C the increase being about 7.25–8.80 times, and about 7.65–9.77 times at 37 °C.
As it can be seen from Figure 3, the viscosity decreases with shear stress highlighting also in this way the shear thinning behaviour of the designed hydrogels.
As presented in Table 3 and Table 4, the values recorded for ”R2” parameter for the power law model, ranging between 0.9615 and 0.9985, indicate that this rheological model has a good fit with the experimental data obtained at both temperatures and different stirring times at maximum rotational speed.
It can be noticed that for longer stirring times (10 min, 20 min), the “m” parameter remains constant for the hydrogels wth a minimum concentration of NaCMC and various amount of PEG 400 and PEG 1000 (H1–H4), while for the experimental formulations H5–H8, with a double concentration in NaCMC, the polymeric matrix is stronger and has a higher resistance to shear-induced destructuration, which leads to different values of the viscosity for longer stirring duration at maximum rotational speed.
The values of “m” parameter are also strongly influenced by the concentration of the hydrogels in gel-forming polymer and by the temperature at which shearing takes place.
In both representations, shear stress vs. shear rate and viscosity vs. shear rate respectively, the pseudoplastic properties of all the designed hydrogels is confirmed. The pseudoplastic behaviour with yield stress is a desirable property for the semisolid dosage forms because at high shear rates (e.g., a semisolid product is exposed to when it is taken out of its immediate package, i.e., tube), the gel will flow readily, facilitating the topical administration; in case of low shear rates (when the hydrogel is spread on the site of administration), the material will adopt a higher consistency, recovering its original rheological properties before administration [29,34,36].
The flow patterns recorded in Figure 6a,b indicate that the hydrogels are thixotropic at both temperatures, for the same shear rate, the point on the backward profile corresponding to lower shear stress in comparison with the forward one, obtaining the corresponding hysteresis loops [29].
The shapes of the rheograms illustrated in Figure 6b show that for the maximum rotational speed selected, the increase of the stirring time induces a viscosity decrease, and the backward curve corresponds to decreasing values of the shear stress for the same shear rate.
As expected, for the same stirring period, the values obtained at 37 °C for the areas corresponding to the forward curves, backward curves and thixotropy area are smaller compared to those obtained at 23 °C. Thus, Sfwd decreased with 1.43–1.65 times for the formulation with minimum concentration of NaCMC, and 1.28–1.39 times for the hydrogels with maximum concentration of NaCMC. Sbw decreased with about 1.27–1.69 times for 10 s, 2 min and 5 min stirring time respectively. Similar to the flow parameters, characteristic both for Herschel-Bulkley and power law model, the formulation factor with a significant impact on the thixotropy characteristics is the concentration in gel-forming polymer. Relevant differences between the values of different area determined for 2% NaCMC hydrogels and those recorded for the 1% experimental formulations were observed. At 23 °C, the thixotropy area for H1–H4 formulations reaches a maximum after 10 min of stirring while at 37 °C maximum destructuration is achieved after 2 min, the thixotropy area remaining constant after this interval; however, for the H5–H8 formulations, a stirring time longer than 20 min (at 23 °C), respectively of 5 min (at 37 °C) is required in order for the systems to destructurate completely.
The values obtained at 23 °C and 37 °C for the thixotropic index (higher than 5%) and those obtained at 23 °C for the thixotropy constant (higher than zero) confirm that hydrogels have a thixotropic behaviour at both working temperatures.
By applying the empiric relationship (Equation (10)) [40,41,42] in the evaluation of the thixotropy constant, values of the “R” correlation coefficient ranging from 0.9598 to 0.9931 were obtained, indicating a good fit of this equation for hydrogels with a complex composition, prepared in this study.
High levels of the thixotropic constant correlated with a fast maximum destructuration were obtained for H5–H7 formulations, for which the NaCMC concentration was the highest. The lower value of “c” obtained for H8 hydrogel, with the same content in gel-forming polymer but maximum concentrations of non-gelling polymers, could be attributed to its considerable higher viscosity (Table 3 and Table 4) compared to H5 hydrogel (“c” max—1.209 min−½), requiring a stirring time superior to 20 min for the total destructuration induced by stirring. Comparatively, for H1–H4 formulations, with a minimum concentration of NaCMC, the impact of the stirring period is lower, this being the most obvious for the H1 hydrogel (“c” value is the smallest—0.573 min−½).
The thixotropic parameters recorded show that for the hydrogels incorporating a smaller amount of NaCMC, the destructuration takes place for shorter stirring times, compared to the systems including a double amount of gel-forming polymer. This could be explained by the fact that the polymeric matrix is more resistant to the destructuration induced by agitation.
The thixotropic feature is also a quality control parameter, relevant in view of transforming an initially viscous hydrogel into a thin product, easy to spread at the site of administration.
Both the parameters specific to different flow models and the thixotropic descriptors assessed were markedly influenced by the concentration of the gel-forming polymer. The non-gellifying polymers, included in various concentrations in the experimental formulations, influenced the rheological behaviour of hydrogels only in the same batch of systems presenting the same concentration in NaCMC. Their functional role was to modulate the rheological properties of the gel base through their own viscosity, but also through the molecular interactions occuring between these ingredients and the gelling polymer chains.

4. Materials and Methods

4.1. Materials

Indomethacin (IND) and sodium carboxymethylcellulose (NaCMC) were purchased from Fluka Chemicals Ltd. (Gillingham, UK). Polyethylene glycol 400 (PEG 400), polyethylene glycol 1000 (PEG 1000) and sodium hydroxide (NaOH) were obtained from Merck KGaA (Darmstadt, Germany). Distilled water was used in the preparation of the experimental formulations. All chemical reagents were of analytical grade.

4.2. Methods

4.2.1. Preparation of the Hydrogels

The experimental hydrogels were prepared in accordance with the composition presented in Table 7.
The following manufacturing steps were applied for all the formulations: NaCMC was dispersed in an adequate amount of distilled water and left unstirred for two hours to ensure wetting and swelling of the gellyfing polymer. After that, part of the distilled water was gradually added under continuous stirring until an uniform and homogeneous viscous consistency was obtained. PEG 400 was afterwards added under continuous mechanical stirring, followed by PEG 1000 adding, previously dissolved in water. Indomethacin, a non-steroidal anti-inflammatory drug model belonging to BCS class II, was separately dissolved in an appropriate amount of 10% NaOH solution, obtaining the soluble sodium salt, and then it was gently incorporated in the previously prepared hydrogel basis. Using this preparation method, several NaCMC physical hydrogels were obtained, coded as shown in Table 7.
The selection of the non-gelling polymers (polyethylene glycols) in the composition of the experimental hydrogels was based on their good solublility in water and compatibility with NaCMC. Also, polyethylene glycols are excipients widely used in a variety of formulations (topical, parenteral, oral). They are non-irritating and non-toxic in contact with skin. Another rationale for their inclusion in the formulations was the potential to increase the solubility of the poorly water-soluble model drug [45]. Aqueous solutions of PEG adjust the viscosity and consistency of a topical/transdermal formulation. In addition, it is known that PEG 400 is a skin penetration enhancer for indomethacin and other anti-inflammatory drugs [46,47].
Different studies mention NaOH being used as a solubilizing agent for some non-steroidal anti-inflamatory drugs such as piroxicam, for antiviral drugs (acyclovir) or for the antineoplastic agent 5-fluorouracil [48,49,50,51]. The functional role of the 10% sodium hydroxide solution was to solubilize indomethacin by converting it into its sodium salt. In contact with the liquid on the skin surface (with a pH value of 5.5), the drug exists both as sodium salt and acid forms [52]. In these conditions, the thermodynamic activity of the active pharmaceutical ingredient is maximum and allows a maximum absorption rate due to a high concentration gradient.
After preparation at laboratory scale, the experimental hydrogels were diluted with distilled water, resulting in 100 g of hydrogels for each formulation with a final concentration of 1% IND. The appearance of all the experimental hydrogels was homogeneous, clear, yellow in colour, and their pH value was between 7 and 7.5. The hydrogels were equilibrated at room temperature (23 °C) for 24 h to remove the eventual air bubbles incorporated, prior to their characterization by rheological analysis.

4.2.2. Rheological Measurements

The stationary shear flow analysis was conducted with a rotational viscometer Multi-Visc Rheometer (Fungilab, Barcelona, Spain) at 23 °C ± 0.1 °C and 37 °C ± 0.1 °C, and a ThermoHaake P5 Ultrathermostat was attached to the measuring system to keep constant the work temperature [33,34]. After mechanical and thermal equilibration, the hydrogels were sheared at a shear rate specific to TR 9 and TR 10 standard spindles, from 0.1 to 20.4 s−1 and from 0.08 to 16.8 s−1 respectively, in order to obtain the flow patterns. The shear stress and apparent viscosity were recorded as a function of shear rate. Each hydrogel was stirred for different time intervals (10 s, 2, 5, 10 and 20 min at 23 °C, and 10 s, 2 and 5 min at 37 °C, respectively), at a maximum rotational speed of 60 rpm, and the corresponding forward and backward rheograms were recorded. The rotational speeds varied between 0.3 and 60 rpm for the forward curves, these values being similar to some conditions with biopharmaceutical implications (i.e., the application of the hydrogel at the administration site), and allowed the examination of flow curves with hysteresis loops, as shear rates from the upper ranges are more representative for mixing processes during manufacturing of hydrogels and during administration by spreading the hydrogels on the skin [34]. The rheological parameters were evaluated using Table Curve 2D and Microcal Origin softwares.

5. Conclusions

A detailed stationary shear rheometry study was presented, highlighting the influence of formulation factors and work temperature on different flow parameters and thixotropic descriptors for different NaCMC hydrogels. All the designed formulations presented a non-Newtonian behaviour, with shear-thinning and time-dependent properties. The pseudoplasticity and thixotropic character are two properties targeted in the design of semisolid dosage forms, important from biopharmaceutical and tehcnological point of view. The rheology plays an important role in the design, evaluation and optimization of topical/transdermal pharmaceutical products, complementing the complex issue of drug delivery. By correlating the rheological results with the kinetic characteristics, the composition of the gel base can be modulated, designing hydrogels with optimal drug release characteristics and an adequate consistency and stasis time at the administration site.
The rheological analysis applied for the gels with NaCMC, PEG 400, PEG 1000 and Indomethacin, could be generalized to serve as a model for more complex heterogels as well as for other types of topical/trandermal formulations with various aplication sites.

Acknowledgments

Part of this study was financially supported by the University of Medicine and Pharmcy “Carol Davila” through the research grant “Tineri Cercetători” Programme 2013–2015, contract No. 28326/04.11.2013.

Author Contributions

M.V. Ghica and C.-E. Dinu-Pîrvu conceived and designed the experiments; M.V. Ghica performed the experiments; M.V. Ghica, C.-E. Dinu-Pîrvu and M. Hîrjău analyzed the data; D. Lupuleasa contributed reagents/materials/analysis tools; M.V. Ghica and M. Hîrjău wrote the paper.

Conflicts of Interest

The authors declare no conflict of interest.

Abbreviations

The following abbreviations are used in this manuscript:
BCSBiopharmaceutical Classification System
INDIndomethacin
NaCMCSodium carboxymethylcellulose
PEGPolyethylene glycol

References

  1. Hoare, T.R.; Kohane, D.S. Hydrogels in drug delivery: Progress and challenges. Polymer 2008, 49, 1993–2007. [Google Scholar] [CrossRef]
  2. Wu, Y.L.; Chen, X.; Wang, W.; Loh, X.J. Engineering bioresponsive hydrogels toward healthcare applications. Macromol. Chem. Phys. 2016, 217, 175–188. [Google Scholar] [CrossRef]
  3. Kloxin, A.M.; Kasko, A.M.; Salinas, C.N.; Anseth, K.S. Photodegradable hydrogels for dynamic tuning of physical and chemical properties. Science 2009, 324, 59–63. [Google Scholar] [CrossRef] [PubMed]
  4. Godier-Furnemont, A.F.G.; Martens, T.P.; Koeckert, M.S.; Wan, L.; Parks, J.; Arai, K.; Zhang, G.; Hudson, B.; Homma, S.; Vunjak-Novakovic, G. Composite scaffold provides a cell delivery platform for cardiovascular repair. Proc. Natl. Acad. Sci. USA 2011, 108, 7974–7979. [Google Scholar] [CrossRef] [PubMed]
  5. Su, J.; Hu, B.-H.; Lowe, W.L., Jr.; Kaufman, D.B.; Messersmith, P.B. Anti-inflammatory peptide-functionalized hydrogels for insulin-secreting cell encapsulation. Biomaterials 2010, 31, 308–314. [Google Scholar] [CrossRef] [PubMed]
  6. Bakota, E.L.; Wang, Y.; Danesh, F.R.; Hartgerink, J.D. Injectable multidomain peptide nanofiber hydrogel as a delivery agent for stem cell secretome. Biomacromolecules 2011, 12, 1651–1657. [Google Scholar] [CrossRef] [PubMed]
  7. Branco, M.C.; Pochan, D.J.; Wagner, N.J.; Schneider, J.P. The effect of protein structure on their controlled release from an injectable peptide hydrogel. Biomaterials 2010, 31, 9527–9534. [Google Scholar] [CrossRef] [PubMed]
  8. Aimetti, A.A.; Machen, A.J.; Anseth, K.S. Poly(ethylene glycol) hydrogels formed by thiol-ene photopolymerization for enzyme-responsive protein delivery. Biomaterials 2009, 30, 6048–6054. [Google Scholar] [CrossRef] [PubMed]
  9. Altunbas, A.; Lee, S.J.; Rajasekaran, S.A.; Schneider, J.P.; Pochan, D.J. Encapsulation of curcumin in self-assembling peptide hydrogels as injectable drug delivery vehicles. Biomaterials 2011, 32, 5906–5914. [Google Scholar] [CrossRef] [PubMed]
  10. Branco, M.C.; Schneider, J.P. Self-assembling materials for therapeutic delivery. Acta Biomater. 2009, 5, 817–831. [Google Scholar] [CrossRef] [PubMed]
  11. Hudson, S.P.; Langer, R.; Fink, G.R.; Kohane, D.S. Injectable in situ cross-linking hydrogels for local antifungal therapy. Biomaterials 2010, 31, 1444–1452. [Google Scholar] [CrossRef] [PubMed]
  12. Sivakumaran, D.; Maitland, D.; Hoare, T. Injectable microgel-hydrogel composites for prolonged small-molecule drug delivery. Biomacromolecules 2011, 12, 4112–4120. [Google Scholar] [CrossRef] [PubMed]
  13. Ye, H.; Owh, C.; Jiang, S.; Ng, C.Z.Q.; Wirawan, D.; Loh, X.J. A thixotropic polyglycerol sebacate-based supramolecular hydrogel as an injectable drug delivery matrix. Polymers 2016, 8, 130. [Google Scholar] [CrossRef]
  14. Alonzo, D.E.; Gao, Y.; Zhou, D.; Mo, H.; Zhang, G.G.; Taylor, L.S. Dissolution and precipitation behavior of amorphous solid dispersions. J. Pharm. Sci. 2011, 100, 3316–3331. [Google Scholar] [CrossRef] [PubMed]
  15. Amidon, G.L.; Lennernas, H.; Shah, V.P.; Crison, J.R. A theoretical basis for a biopharmaceutic drug classification: The correlation of in vitro drug product dissolution and in vivo bioavailability. Pharm. Res. 1995, 12, 413–420. [Google Scholar] [CrossRef] [PubMed]
  16. Amidon, G.L.; Lennernäs, H.; Shah, V.P.; Crison, J.R. A theoretical basis for a biopharmaceutic drug classification: The correlation of in vitro drug product dissolution and in vivo bioavailability. Pharm. Res. 1995, 12, 413–420. [Google Scholar] [CrossRef] [PubMed]
  17. McKenzie, M.; Betts, D.; Suh, A.; Bui, K.; Kim, L.D.; Cho, H. Hydrogel-based drug delivery systems for poorly water-soluble drugs. Molecules 2015, 20, 20397–20408. [Google Scholar] [CrossRef] [PubMed]
  18. Hebeish, A.; Hashem, M.; El-Hady, M.M.A.; Sharaf, S. Development of CMC hydrogels loaded with silver nano-particles for medical applications. Carbohydr. Polym. 2013, 92, 407–413. [Google Scholar] [CrossRef] [PubMed]
  19. Wong, T.W.; Ramli, N.A. Carboxymethylcellulose film for bacterial wound infection control and healing. Carbohydr. Polym. 2014, 112, 367–375. [Google Scholar] [CrossRef] [PubMed]
  20. Yadollahi, M.; Namazi, H. Synthesis and characterization of carboxymethylcellulose/layered double hydroxide nanocomposites. J. Nanopart. Res. 2013, 15, 1–9. [Google Scholar] [CrossRef]
  21. Sarabahi, S. Recent advances in topical wound care. Indian J. Plast. Surg. 2012, 45, 379–387. [Google Scholar] [CrossRef] [PubMed]
  22. Bo-Ram, L.; Eun-Suok, O. Effect of molecular weight and degree of substitution of a sodium-carboxymethyl cellulose binder on Li4Ti5O12 anodic performance. J. Phys. Chem. C 2013, 117, 4404–4409. [Google Scholar]
  23. Bigucci, F.; Abruzzo, A.; Vitali, B.; Saladini, B.; Cerchiara, T.; Gallucci, M.C.; Luppi, B. Vaginal inserts based on chitosan and carboxymethylcellulose complexes forlocal delivery of chlorhexidine: Preparation, characterization and antimicrobial activity. Int. J. Pharm. 2015, 478, 456–463. [Google Scholar] [CrossRef] [PubMed]
  24. Agarwal, T.; Narayana, S.N.G.H.; Pal, K.; Pramanik, K.; Giri, S.; Banerjee, I. Calcium alginate-carboxymethyl cellulose beads for colon-targeted drug delivery. Int. J. Biol. Macromol. 2015, 75, 409–417. [Google Scholar] [CrossRef] [PubMed]
  25. Zatz, J.L.; Berry, J.J.; Alderman, D.A. Viscosity-Imparting Agents in Disperse Systems. In Pharmaceutical Dosage Forms: Disperse Systems; Lieberman, H.A., Rieger, M.M., Banker, C.S., Eds.; Marcel Dekker: New York, NY, USA, 1989; Volume 2, pp. 142–155. [Google Scholar]
  26. Mohammed, F.A. Topical permeation characteristics of diclofenac sodium from NaCMC gels in comparison with conventional gel formulations. Drug Dev. Ind. Pharm. 2001, 27, 1083–1097. [Google Scholar] [CrossRef] [PubMed]
  27. Rossi, S.; Bonferoni, M.C.; Ferrari, F.; Caramella, C. Drug release and washability of mucoadhesive gels based on sodium carboxymethylcellulose and polyacrylic acid. Pharm. Dev. Technol. 1999, 4, 55–63. [Google Scholar] [CrossRef] [PubMed]
  28. Korhonen, M.; Hellen, L.; Hirvonen, J.; Yliruusi, J. Rheological properties of creams with four different surfactant combinations-effect of storage time and conditions. Int. J. Pharm. 2001, 221, 187–196. [Google Scholar] [CrossRef]
  29. Orţan, A.; Dinu-Pîrvu, C.; Ghica, M.V.; Popescu, L.M.; Ioniţă, L. Rheological study of a liposomal hydrogel based on carbopol. Rom. Biotechnol. Lett. 2011, 16 (Suppl.), 47–54. [Google Scholar]
  30. Omidian, H.; Park, K. Hydrogels. In Fundamentals and Applications of Controlled Release Drug Delivery; Siepmann, J., Siegel, R.A., Rathbone, M.J., Eds.; Springer Science + Business Media, LLC: New York, NY, USA, 2012; Chapter 4; pp. 75–105. [Google Scholar]
  31. Owens, R.G.; Phillips, T.N. Computational Rheology, 2nd ed.; Imperial College Press Korea: Singapore, 2002; pp. 327–330. [Google Scholar]
  32. Lin, C.-C.; Metters, A.T. Hydrogels in controlled release formulations: Network design and mathematical modeling. Adv. Drug Deliv. Rev. 2006, 58, 1379–1408. [Google Scholar] [CrossRef] [PubMed]
  33. Paunica-Panea, G.; Ficai, A.; Marin, M.M.; Marin, S.; Albu, M.G.; Constantin, V.D.; Dinu-Pîrvu, C.; Vuluga, Z.; Corobea, M.C.; Ghica, M.V. New collagen-dextran-zinc oxide composites for wound dressing. J. Nanomater. 2016, 2016, 7. [Google Scholar] [CrossRef]
  34. Ghica, M.V.; Popa, L.; Moisescu, Ş. Evaluation of some rheological parameters for sodium carboxymethylcellulose topical hydrogels with indomethacin. Farmacia 2007, 55, 671–679. [Google Scholar]
  35. Cespi, M.; Bonacucina, G.; Pucciarelli, S.; Cocci, P.; Perinelli, D.R.; Casettari, L.; Illum, L.; Palmieri, G.F.; Palermo, F.A.; Mosconi, G. Evaluation of thermosensitive poloxamer 407 gel systems for the sustained release of estradiol in a fish model. Eur. J. Pharm. Biopharm. 2014, 88, 954–961. [Google Scholar] [CrossRef] [PubMed]
  36. Ghica, M.V.; Albu, M.G.; Coară, G.; Dinu-Pîrvu, C. The influence of crosslinking agent on kinetic release and rheological behaviour of some collagen-niflumic acid hydrogels. In Proceedings of the 4th International Conference on Advanced Materials Systems (ICAMS), Bucharest, Romania, 27–29 September 2012; pp. 267–272.
  37. Razavi, S.M.A.; Karazhiyan, H. Flow properties and tixotropy of selected hydrocolloids: Experimental and modeling studies. Food Hydrocoll. 2009, 23, 908–912. [Google Scholar] [CrossRef]
  38. Hoshizawa, H.; Minemura, Y.; Yoshikawa, K.; Suzuki, M.; Hanabusa, K. Thixotropic hydrogelators based on a cyclo(dipeptide) derivative. Langmuir 2013, 29, 14666–14673. [Google Scholar] [CrossRef] [PubMed]
  39. Ohsedo, Y.; Oono, M.; Tanaka, A.; Watanabe, H. Mixing induced thixotropy of a two-component system of alkylurea organogelators having different alkyl chains. New J. Chem. 2013, 37, 2250–2253. [Google Scholar] [CrossRef]
  40. Dolz, M.; Gonzales, F.; Delegido, J.; Hernandez, M.J.; Pellicer, J. A time-dependent expression for thixotropic areas. Application to aerosil 200 hydrogels. J. Pharm. Sci. 2000, 89, 790–797. [Google Scholar] [CrossRef]
  41. Dolz, M.; Bugaj, J.; Pellicer, J.; Hernández, M.J.; Górecki, M. Thixotropy of highly viscous sodium (carboxymethyl)cellulose hydrogels. J. Pharm. Sci. 1997, 86, 1283–1287. [Google Scholar] [CrossRef] [PubMed]
  42. Dolz, M.; Jimenez, J.; Jesus Hernandez, M.; Delegido, J.; Casanovas, A. Flow and thixotropy of non-contaminating oil drilling fluids formulated with bentonite and sodium carboxymethyl cellulose. J. Petrol. Sci. Eng. 2007, 57, 294–302. [Google Scholar] [CrossRef]
  43. Lund, W. The Pharmaceutical Codex, Principle and Practice of Pharmaceutics, 12th ed.; The Pharmaceutical Press: London, UK, 1994; pp. 260–276. [Google Scholar]
  44. Lardy, F.; Vennat, B.; Pouget, M.P.; Pourrat, A. Functionalization of hydrocolloids: Principal component analysis applied to the study of correlations between parameters describing the consistency of hydrogels. Drug Dev. Ind. Pharm. 2000, 26, 715–721. [Google Scholar] [CrossRef] [PubMed]
  45. Wade, A.; Weller, P.W. Handbook of Pharmaceutical Excipients, 2nd ed.; The Pharmaceutical Press: London, UK, 1994; pp. 7–9, 78–81, 204–206, 241–242, 355–361, 407–408. [Google Scholar]
  46. Singh, S.K.; Durrani, M.J.; Reddy, I.K.; Khan, M.A. Effect of permeation enhancers on the release of ketoprofen through transdermal drug delivery systems. Pharmazie 1996, 51, 741–744. [Google Scholar] [PubMed]
  47. Singh, S.K.; Roane, D.S.; Reddy, I.K.; Durrani, M.J.; Khan, M.A. Effect of additives on the diffusion of ketoprofen through human skin. Drug. Dev. Ind. Pharm. 1996, 22, 471–474. [Google Scholar] [CrossRef]
  48. Díez-Sales, O.; Garrigues, T.M.; Herráez, J.V.; Belda, R.; Martín-Villodre, A.; Herráez, M. In vitro percutaneous penetration of acyclovir from solvent systems and carbopol 971-P hydrogels: Influence of propylene glycol. J. Pharm. Sci. 2005, 94, 1039–1047. [Google Scholar] [CrossRef] [PubMed]
  49. Dolz, M.; Gonzáles, F.; Herráez, M.; Díez, O. The influence of polymer concentration on the 5-fluorouracil release rate from carbopol hydrogels. J. Pharm. Belg. 1994, 49, 509–513. [Google Scholar] [PubMed]
  50. Babar, A.; Solanki, U.D.; Cutie, A.J.; Plakogiannis, F. Piroxicam release from dermatological bases: In vitro studies using cellulose membrane and hairless mouse skin. Drug Dev. Ind. Pharm. 1990, 16, 523–540. [Google Scholar] [CrossRef]
  51. Rafiee-Tehrani, M.; Mehramizi, A. In vitro release studies of piroxicam from oil-in-water creams and hydroalcoholic gel topical formulations. Drug Dev. Ind. Pharm. 2000, 26, 409–414. [Google Scholar] [CrossRef] [PubMed]
  52. De Vos, A.; Vervoort, L.; Kinget, R. Release of indomethacin from transparent oil-waters gels. J. Pharm. Sci. 1994, 83, 641–643. [Google Scholar] [CrossRef] [PubMed]
  • Sample Availability: No samples of the compounds are available from the authors.
Figure 1. Forward rheograms for hydrogels with minimum concentration of NaCMC analyzed at: (a) 23 °C; (b) 37 °C.
Molecules 21 00786 g001
Figure 2. Forward rheograms for hydrogels with maximum concentration of NaCMC analyzed at: (a) 23 °C; (b) 37 °C.
Molecules 21 00786 g002aMolecules 21 00786 g002b
Figure 3. Viscosity vs. shear rate for: (a) hydrogels with minimum concentration of NaCMC analyzed at 37 °C; (b) hydrogels with maximum concentration of NaCMC analyzed at 23 °C.
Molecules 21 00786 g003
Figure 4. (a) Sbw(t) values vs. different stirring times at maximum rotational speed for hydrogels H1-H8 analyzed at: (a) 23 °C; (b) 37 °C.
Molecules 21 00786 g004
Figure 5. (a) Thixotropy area values vs. different stirring times at maximum rotational speed for hydrogels H1–H8 analyzed at: (a) 23 °C; (b) 37 °C.
Molecules 21 00786 g005
Figure 6. (a) Forward and backward (10 s) rheograms for hydrogel H2 tested at 23 °C and 37 °C; (b) forward and backward rheograms for hydrogel H8 tested at 23 °C (10 s, 2 min, 5 min, 10 min, 20 min).
Molecules 21 00786 g006aMolecules 21 00786 g006b
Table 1. Determination coefficients (”R2”) values specific to different rheological models obtained in relation with forward rheograms for hydrogels tested at 23 °C and 37 °C.
HydrogelH1H2H3H4H5H6H7H8
Temperature 23 °C
Ostwald-de Waele0.99390.99100.99190.98990.99810.99760.99690.9973
Herschel-Bulkley0.99780.99560.99640.99550.99870.99850.99760.9981
Bingham0.96670.95930.96670.95770.95290.93860.93450.9354
Casson0.99310.99030.99200.99050.98940.98270.98010.9816
Temperature 37 °C
Ostwald-de Waele0.99230.99680.99570.99250.99900.99290.99470.9937
Herschel-Bulkley0.99410.99910.99790.99570.99960.99420.99560.9953
Bingham0.97200.97600.97750.96910.97400.95430.95870.9544
Casson0.98980.99560.99500.98270.99390.98620.98790.9872
Table 2. Herschel-Bulkley parameters obtained in relation with forward rheograms for hydrogels tested at 23 °C and 37 °C.
HydrogelH1H2H3H4H5H6H7H8
Temperature 23 °C
τ0 (Pa)1.2992.3541.9353.0493.3365.8894.5976.850
K (Pa·sn)3.0454.9884.1725.72926.80536.20235.13142.701
n0.6120.5790.6240.5650.5550.4900.4820.472
Temperature 37 °C
τ0 (Pa)0.5390.8810.7531.3672.1155.1513.9766.114
K (Pa·sn)1.8712.6892.3213.47815.84624.49422.56726.632
n0.6750.6600.6780.6230.6480.5510.5720.548
Table 3. Power law model parameters obtained in relation with forward and backward rheograms for hydrogels tested at 23 °C.
HydrogelH1H2H3H4H5H6H7H8
Forward rheogram
m4.7798.2216.8979.76731.34044.77742.38152.903
n0.5310.5240.5380.5590.5290.5470.5340.553
R20.98710.97720.98520.98530.98880.99410.99290.9908
Backward rheogram (10 s)
m3.1385.6084.4326.58324.39134.43832.88137.856
n0.4380.4480.3740.4570.4410.5210.5030.444
R20.97180.99470.99560.99710.99490.99270.98710.9739
Backward rheogram (2 min)
m2.9745.4564.2816.34224.00533.90229.31636.747
n0.4420.4500.3800.4660.4460.5280.4620.449
R20.97010.99430.99380.99530.99460.99230.99850.9777
Backward rheogram (5 min)
m2.8415.3254.1606.20723.54833.30527.27936.137
n0.4550.4600.3810.4710.4560.5380.4570.456
R20.96640.99350.99080.99440.99010.99170.99470.9732
Backward rheogram (10 min)
m2.7395.1224.0836.12423.36432.59326.66732.099
n0.4710.4910.4060.4790.4660.5490.4620.399
R20.96150.97300.99120.99230.98860.99020.99400.9722
Backward rheogram (20 min)
m2.7395.1224.0836.12422.98032.22526.41531.097
n0.4710.4910.4060.4790.4660.5520.4610.411
R20.96150.97300.99120.99230.98580.99060.99320.9783
Table 4. Power law model parameters obtained in relation with forward and backward rheograms for hydrogels tested at 37 °C.
HydrogelH1H2H3H4H5H6H7H8
Forward rheogram
m2.6463.8703.3304.83218.78232.68328.82236.119
n0.4640.4920.4640.5270.4480.4310.4140.459
R20.98110.98410.99170.99250.99170.97080.97370.9780
Backward rheogram (10 s)
m2.1062.9102.4683.56315.57621.53320.01524.273
n0.4240.4210.3830.4060.4170.4340.4190.435
R20.97540.98140.98450.98190.98040.99410.99360.9892
Backward rheogram (2 min)
m1.9942.7322.3663.41214.97620.85619.52523.582
n0.4440.4310.4010.4170.4230.4340.4320.446
R20.96390.97210.98230.97610.97090.99110.98880.9867
Backward rheogram (5 min)
m1.9942.7022.2013.26614.52320.33018.98022.859
n0.4440.4320.3650.4180.4370.4420.4430.440
R20.96390.96720.98200.97180.96490.98730.98520.983
Table 5. Thixotropic parameters for hydrogels H1–H8 tested at 23 °C.
HydrogelH1H2H3H4H5H6H7H8
Sfwd a,*270.299416.471386.745468.1701446.6891720.4491632.6621943.896
Sbw b,* (10 s)254.957388.275362.508434.6861330.4071570.0591491.4341766.209
Sthix c,* (10 s)15.34228.19624.23733.484116.282150.390141.228177.687
Thyst% d (10 s)5.6766.7706.2677.1528.0388.7418.6509.141
Sbw e,* (2 min)237.573370.918344.931412.0381301.5551539.0711461.1011711.646
Sthix f,* (2 min)32.72645.55341.81456.132145.134181.378171.561232.250
Thyst% g (2 min)12.10710.93710.81111.98910.03210.54210.50811.947
Sbw h,* (5 min)220.221362.004336.270394.6811273.4751497.1241404.8791649.921
Sthix i,* (5 min)50.07854.46750.475873.489173.214223.325227.783293.975
Thyst% j (5 min)18.52713.07813.05115.69711.97312.98113.95115.123
Sbw k,* (10 min)211.563342.839318.686377.4261248.3421447.0251361.3981588.079
Sthix l,* (10 min)58.73673.63268.05990.744198.347273.424271.264355.817
Thyst% m (10 min)21.73017.67917.59819.38213.71015.89216.61418.304
Sbw n,* (20 min)211.563342.839318.686377.4261226.8981427.6151350.7891545.026
Sthix o,* (20 min)58.73673.63268.05990.744219.791292.834281.873398.870
Thyst% p (20 min)21.73017.67917.59819.38215.19217.02117.26420.519
C r,**0.5730.6190.5990.6761.2090.8190.8010.616
R s0.99310.98280.98650.99000.96430.95980.96620.9714
B t (2 min)0.6840.6840.6840.6841.1270.5630.5631.127
B u (5 min)0.9990.4990.4990.9991.6461.2351.6461.646
B v (10 min)0.8300.8300.8301.2451.7092.3932.3932.735
B z (20 min)0.7100.7100.7101.0651.7542.3392.3392.924
Symbol key: a—The area under forward curve; b—The area under backward curve (10 s of stirring at maximum rotational speed of 60 rpm); c—The thixotropy area (10 s); d—The thixotropy index (10 s), e—The area under backward curve (2 min of stirring); f—The thixotropy area (2 min); g—The thixotropy index (2 min), h—The area under backward curve (5 min of stirring); i—Thixotropy area (5 min); j—The thixotropy index (5 min); k—Area under backward curve (10 min of stirring); l—The thixotropy area (10 min); m—The thixotropy index (10 min), n—the area under backward curve (20 min of stirring); o—The thixotropy area (20 min); p—The thixotropy index (20 min); r—The thixotropy constant; s—The correlation coefficient; t, u, v, z—The thixotropic destructuration coefficients computed for a rotational speed of 50 rpm (the first step on the backward curve following the one corresponding to the maximum rotational speed of 60 rpm) after 2 min, 5 min, 10 min and 20 min respectively; *—Measuring unit for forward, backward and thixotropy areas (Pa∙s−1); **—Measuring unit for thixotropy constant “c” (min−1/2).
Table 6. Thixotropic parameters for hydrogels H1–H8 tested at 37 °C.
HydrogelH1H2H3H4H5H6H7H8
Sfwd a,*188.348259.634233.769309.5721040.0311325.4051267.2561441.454
Sbw b,* (10 s)178.495243.143220.748289.547960.4401214.0521165.3781312.957
Sthix c,* (10 s)9.85316.49113.02120.02579.591111.353101.878128.497
Thyst% d (10 s)5.2316.3525.5706.4687.6538.4018.0398.914
Sbw e,* (2 min)169.791225.508203.421271.959937.6691188.8921137.0271284.903
Sthix f,* (2 min)18.55734.12630.34837.613102.362136.513130.229156.551
Thyst% g (2 min)9.85213.14412.98212.1509.84210.29910.27610.860
Sbw h,* (5 min)169.791223.365200.343263.257902.0301135.2461091.8701249.791
Sthix i,* (5 min)18.55736.26933.42646.315138.001190.159175.386191.663
Thyst% j (5 min)9.85213.96914.29814.96113.26814.34713.83913.296
B t (2 min)0.0000.6840.6840.6840.5631.1271.1270.563
B u (5 min)0.0000.4990.4990.4991.2352.0582.0581.235
Symbol key: See footnotes of Table 5.
Table 7. Composition of the designed hydrogels.
Hydrogel 1H1H2H3H4H5H6H7H8
IND11111111
NaCMC11112222
PEG 4001010202010102020
PEG 10001020102010201020
1 The amounts of all components are reported with respect to 100 g hydrogel.

