The Complete Chloroplast Genome of Heimia myrtifolia and Comparative Analysis within Myrtales
by
 and
and
Cuihua Gu
1,†, 
Bin Dong
1,†,
Liang Xu
2,†,
Luke R. Tembrock
3,
Shaoyu Zheng
1 and
Zhiqiang Wu
3,4,* 1
School of Landscape and Architecture, Zhejiang Agriculture and Forestry University, Hangzhou 311300, China
2
Zhejiang Academy of Forestry, Hangzhou 310023, China
3
Department of Biology, Colorado State University, Fort Collins, CO 80523, USA
4
Department of Ecology, Evolution and Organismal Biology, Iowa State University, Ames, IA 5011, USA
*
Author to whom correspondence should be addressed.
†
These authors contributed equally to this work.
Molecules 2018, 23(4), 846; https://0-doi-org.brum.beds.ac.uk/10.3390/molecules23040846
Submission received: 8 March 2018
/
Revised: 3 April 2018
/
Accepted: 5 April 2018
/
Published: 8 April 2018
Abstract
:Heimia myrtifolia is an important medicinal plant with several pharmacologically active alkaloids and is also used as an ornamental landscape plant. The purpose of this study is to complete and characterize the chloroplast (cp) genome of H. myrtifolia and compare genomic features to other Myrtales species’ cp genomes. The analysis showed that H. myrtifolia has a total length of 159,219 bp with a typical quadripartite structure containing two identical inverted repeats (IRs) of 25,643 bp isolated by one large single copy (LSC) of 88,571 bp and one small single copy (SSC) of 18,822 bp. The H. myrtifolia cp genome contains 129 genes with eight ribosomal RNAs, 30 transfer RNAs, and 78 protein coding genes, in which 17 genes are duplicated in two IR regions. The genome organization including gene type and number and guanine-cytosine (GC) content is analyzed among the 12 cp genomes in this study. Approximately 255 simple sequence repeats (SSRs) and 16 forward, two reverses, and two palindromic repeats were identified in the H. myrtifolia cp genome. By comparing the whole H. myrtifolia cp genome with 11 other Myrtales species, the results showed that the sequence similarity was high between coding regions while sequence divergence was high between intergenic regions. By employing the full cp genomes for phylogenetic analysis, structural and sequence differences were characterized between H. myrtifolia and 11 Myrtales species illustrating what patterns are common in the evolution of cp genomes within the Myrtales. The first entire cp genome in the genus Heimia provides a valuable resource for further studies in these medicinally and ornamentally important taxa.
1. Introduction
Heimia is a genus of flowering plants in the loosestrife family, Lythraceae (Order Myrtales), named in honor of German physician Ernst Ludwig Heim [1]. The genus Heimia is comprised of three woody shrub species with five-petaled yellow flowers and a bell-shaped or hemispherical calyx tube, and is commonly known as “sun opener” or “shrubby yellowcrest”. The Heimia species are distributed from west Texas and northern Mexico in the north to Argentina in the southern part of the range. Heimia species have a history of medicinal use in native American cultures, in which several pharmacologically active alkaloids have been found, chief among them being cryogenine [2,3]. Heimia myrtifolia has been reported to have hallucinogenic properties wherewith objects appear yellow accompanied with auditory hallucinations [3]. Anti-inflammatory properties have also been attributed to the alkaloid cryogenine in Heimia [4]. Given the attractive yellow flowers that Heimia species produce and its shrubby form, it is highly valued as ornamental plant.
Chloroplasts (cp), are essential organelles that convert light energy to chemical energy in chlorophytes and possess their own genomes for biosynthesis of pigments, starch, amino acids, and fatty acids, encoding proteins for photosynthesis and nitrogen fixation [5]. Compared with nuclear genomes, cp genomes have highly conserved gene order, number, and content, and are uniparentally inherited [6]. Most angiosperms’ cp genomes are typically circular with a quadripartite structure ranging from 115 to 165 kb in length and include two inverted repeated regions (IRs) which are separated by the small single copy region (SSC) and the large single copy region (LSC) [7]. Because of their conserved structure, uniparental inheritance, and similar gene content, DNA sequences from cp genomes have been important in systematic, population genetic, and phylogenetic studies. Previously, phylogenetic trees have been reconstructed from one or a few genes from the cp [8]. However, in recent years, complete cp genomes have been increasingly used as an informative resource for resolving lower taxonomic level phylogenetic relationships [9,10,11,12,13,14,15].
By comparing entire cp genomes, the ability to detect reliable DNA barcodes for precise plant identification is improved. As next-generation sequencing costs fall, cp genomes are more routinely integrated into phylogenetic, population genetics, and DNA barcoding for identification of numerous species and families [9,10,13,16,17,18,19,20,21]. The over 2300 cp genomes that have been deposited in the National Center for Biotechnology Information (NCBI) database illustrates the importance and utility of whole cp genomes for the study of plant evolution.
Herein, we present the first whole cp genome sequence generated from Illumina sequencing in the genus Heimia. This complete cp genome will be a valuable genetic resource for comprehensively understanding the organization of the H. myrtifolia cp genome and studying phylogenetic relationships within the Lythraceae family and Myrtales generally. Our study objectives were as follows: to enhance our understanding of the structural diversity of the H. myrtifolia genome and detect highly informative hotspot markers from comparative analyses with other cp genomes in Lythraceae and Myrtales.
2. Results and Discussion
2.1. Chloroplast Genome Structure and Content
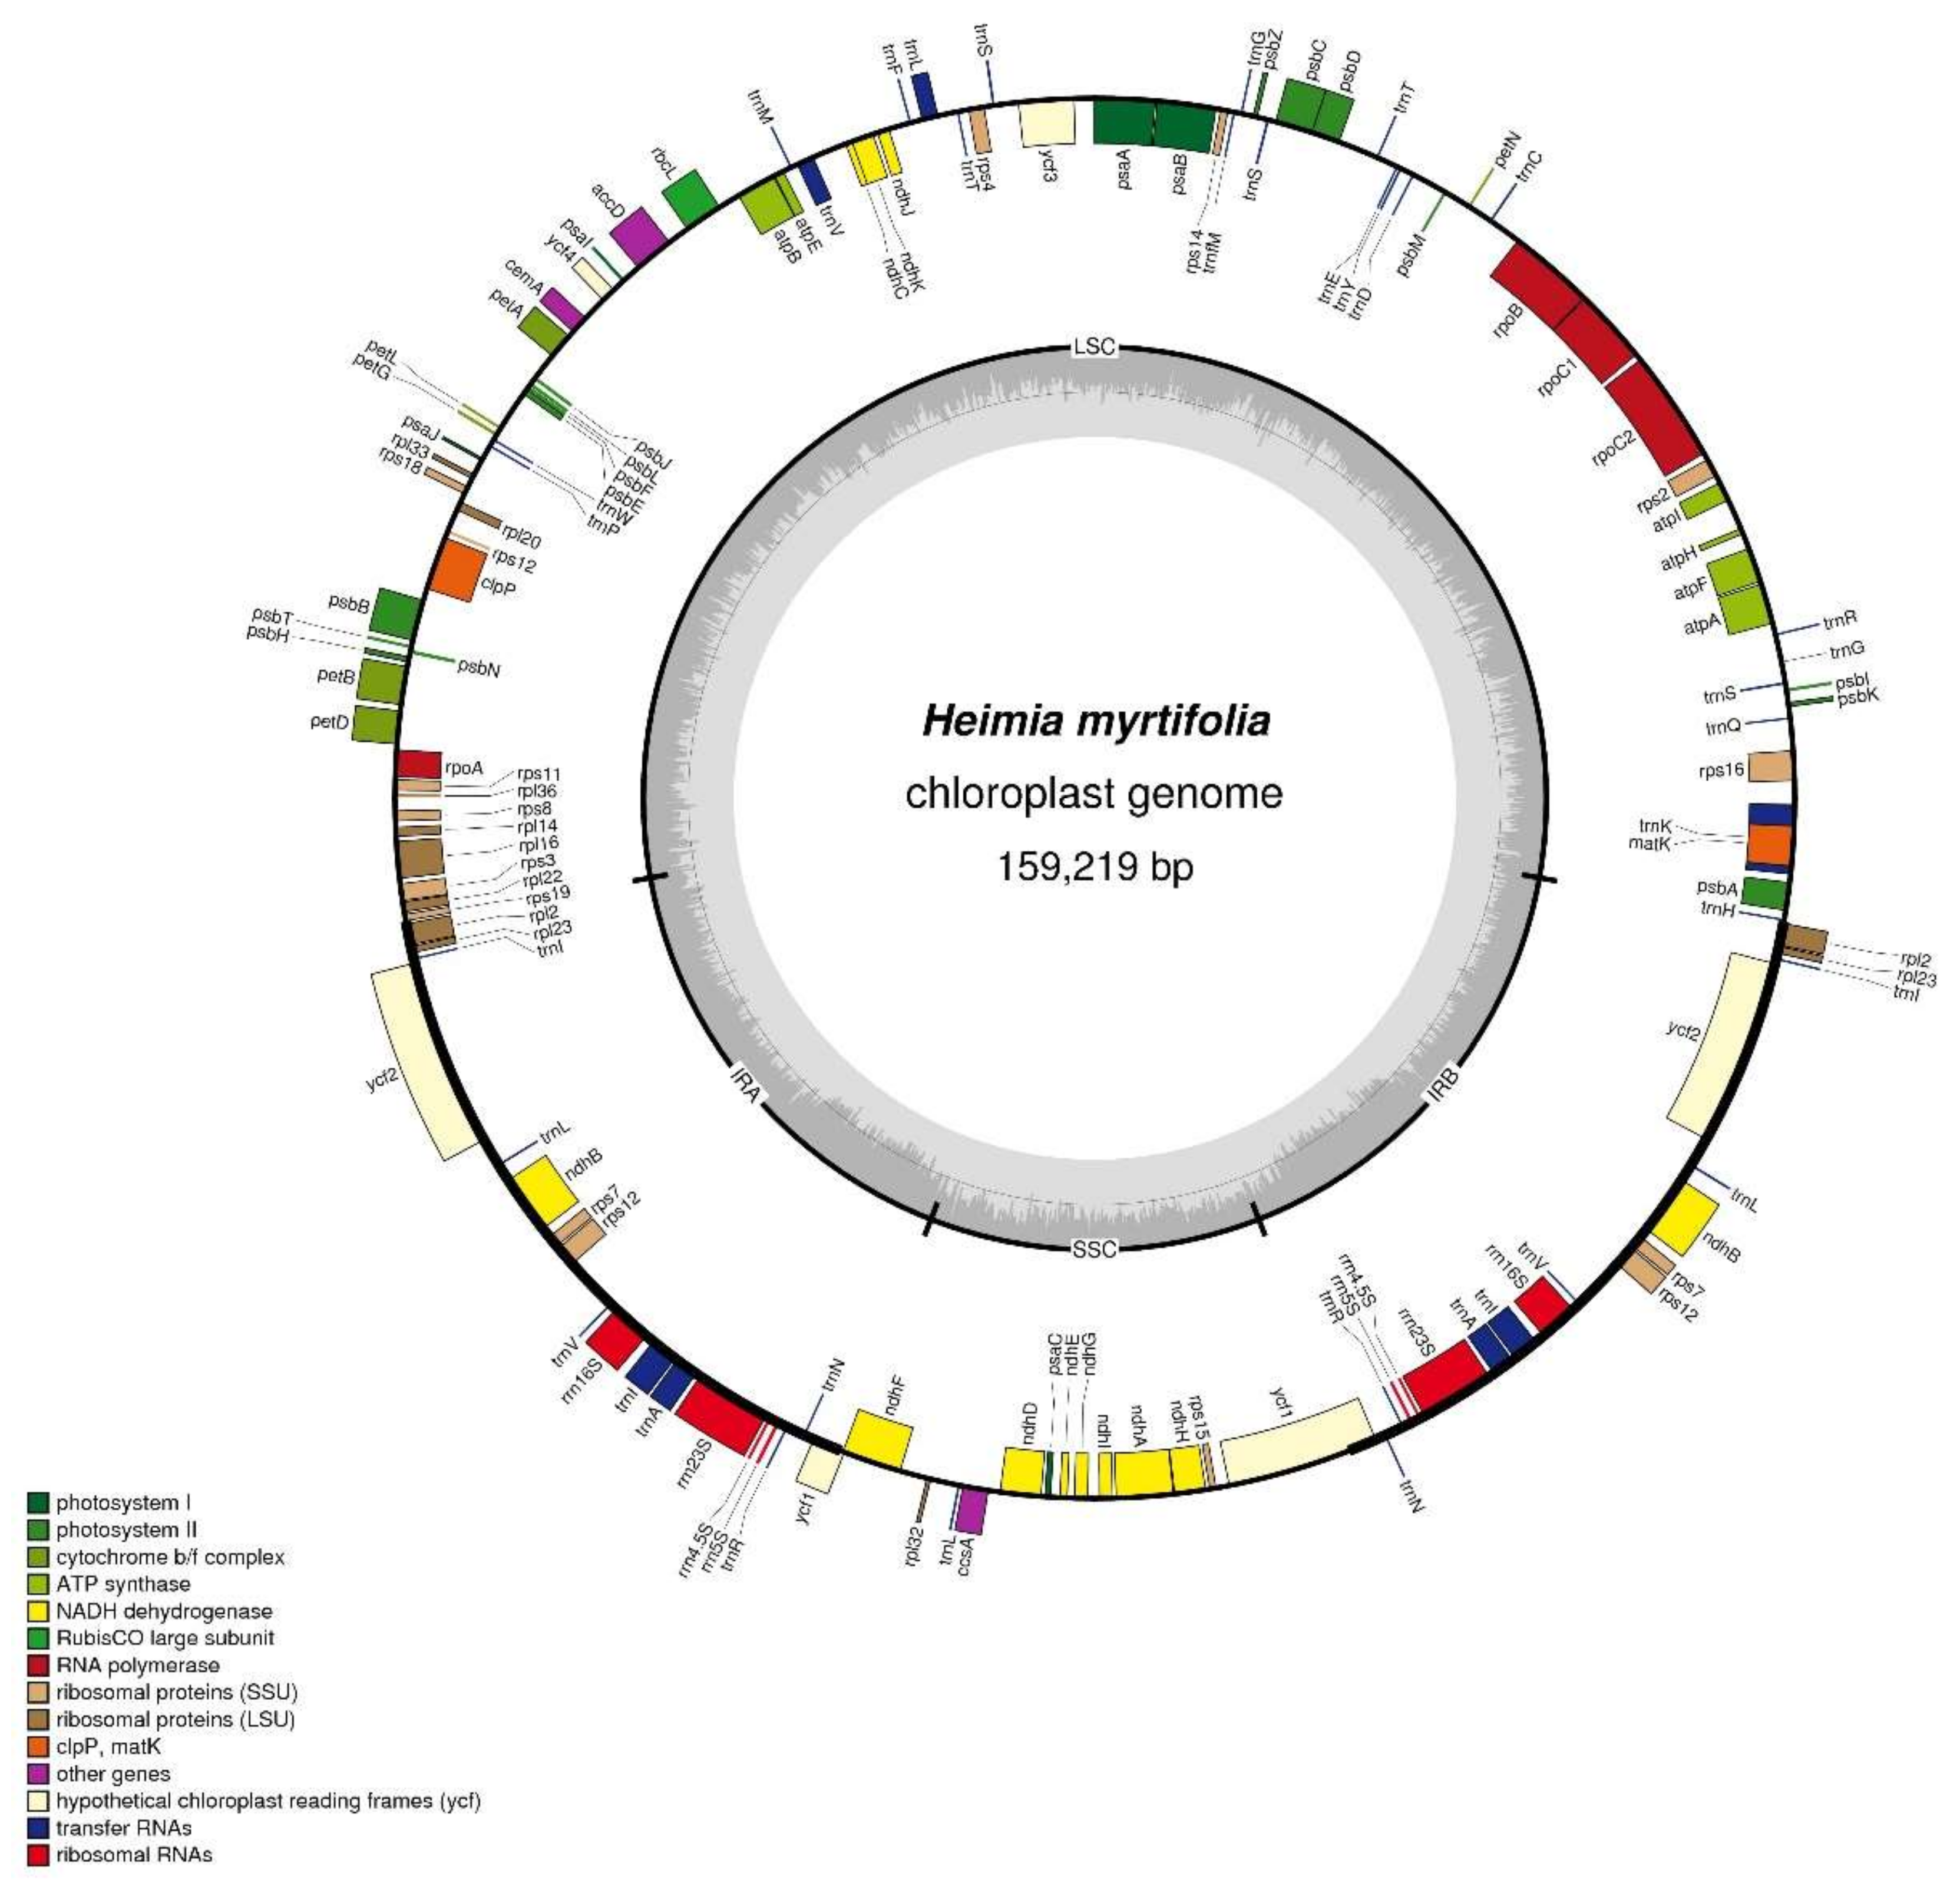
The H. myrtifolia cp genome is 159,219 bp (Figure 1) in length and similar to other Myrtales cp genomes (Table 1 and Table 2), which vary in length from 152 to 165 Kb [20,22]. Unsurprisingly, the cp DNA of H. myrtifolia is the typical quadripartite and circular structure that contains two IRs divided by LSC and SSC regions (Figure 1). The guanine-cytosine (GC) content percentage of the intact H. myrtifolia cp genome was 37.0% (Table 1), which is lower than that of L. intermedia (37.6%) and Oenothera argillicola (39.1%).
In the H. myrtifolia cp genome, 112 total unique genes were detected, of which 17 are duplicated in the IRs (Table 3). The 112 genes are divided into 30 tRNA genes, four rRNA genes, and 78 protein-coding genes. Among these 112 unique genes, three (clpP, rps12, and ycf3) contain two introns and 14 contain one intron (eight protein-coding genes and six tRNA genes) (Table 4). The Rps12 gene is a trans-spliced with two C-terminal exons and one N-terminal downstream exon. The trnK-UUU gene in which the matK gene is located has the largest intron at 2497 bp.
By proportion, tRNAs, rRNAs, and proteins are encoded by 2.0, 3.0, and 51.0% of the H. myrtifolia cp genome, respectively (Table 2). The remaining 49.0% of the H. myrtifolia cp genome belongs to non-coding regions, comprised of pseudo-genes, introns, and intergenic spacers (Table 2). Protein-coding sequences account for 74,088 bp possessing 78 protein-coding genes coding for 27,453 codons (Table 3 and Table S1). Moreover, the AT content within protein-coding regions was 66.1%, 61.9%, and 58.7% at the first, second, and third codon positions, respectively (Table 5). At the third codon position, G and C nucleotides are enriched over A and T; a result consistent with those widely obtained in many other terrestrial plant cp genomes [23].
2.2. Codon Usage
Codon usage biases can have important ramifications for cellular function and reflect lineage specific translational systems thus providing additional means for studying speciation and evolution at the molecular level [24,25]. However, cp genomes, unlike nuclear genomes, do not appear to have synonymous codon usage bias associated with intron number or evolutionary specialization [26]; therefore, we examined codon usage to confirm this.
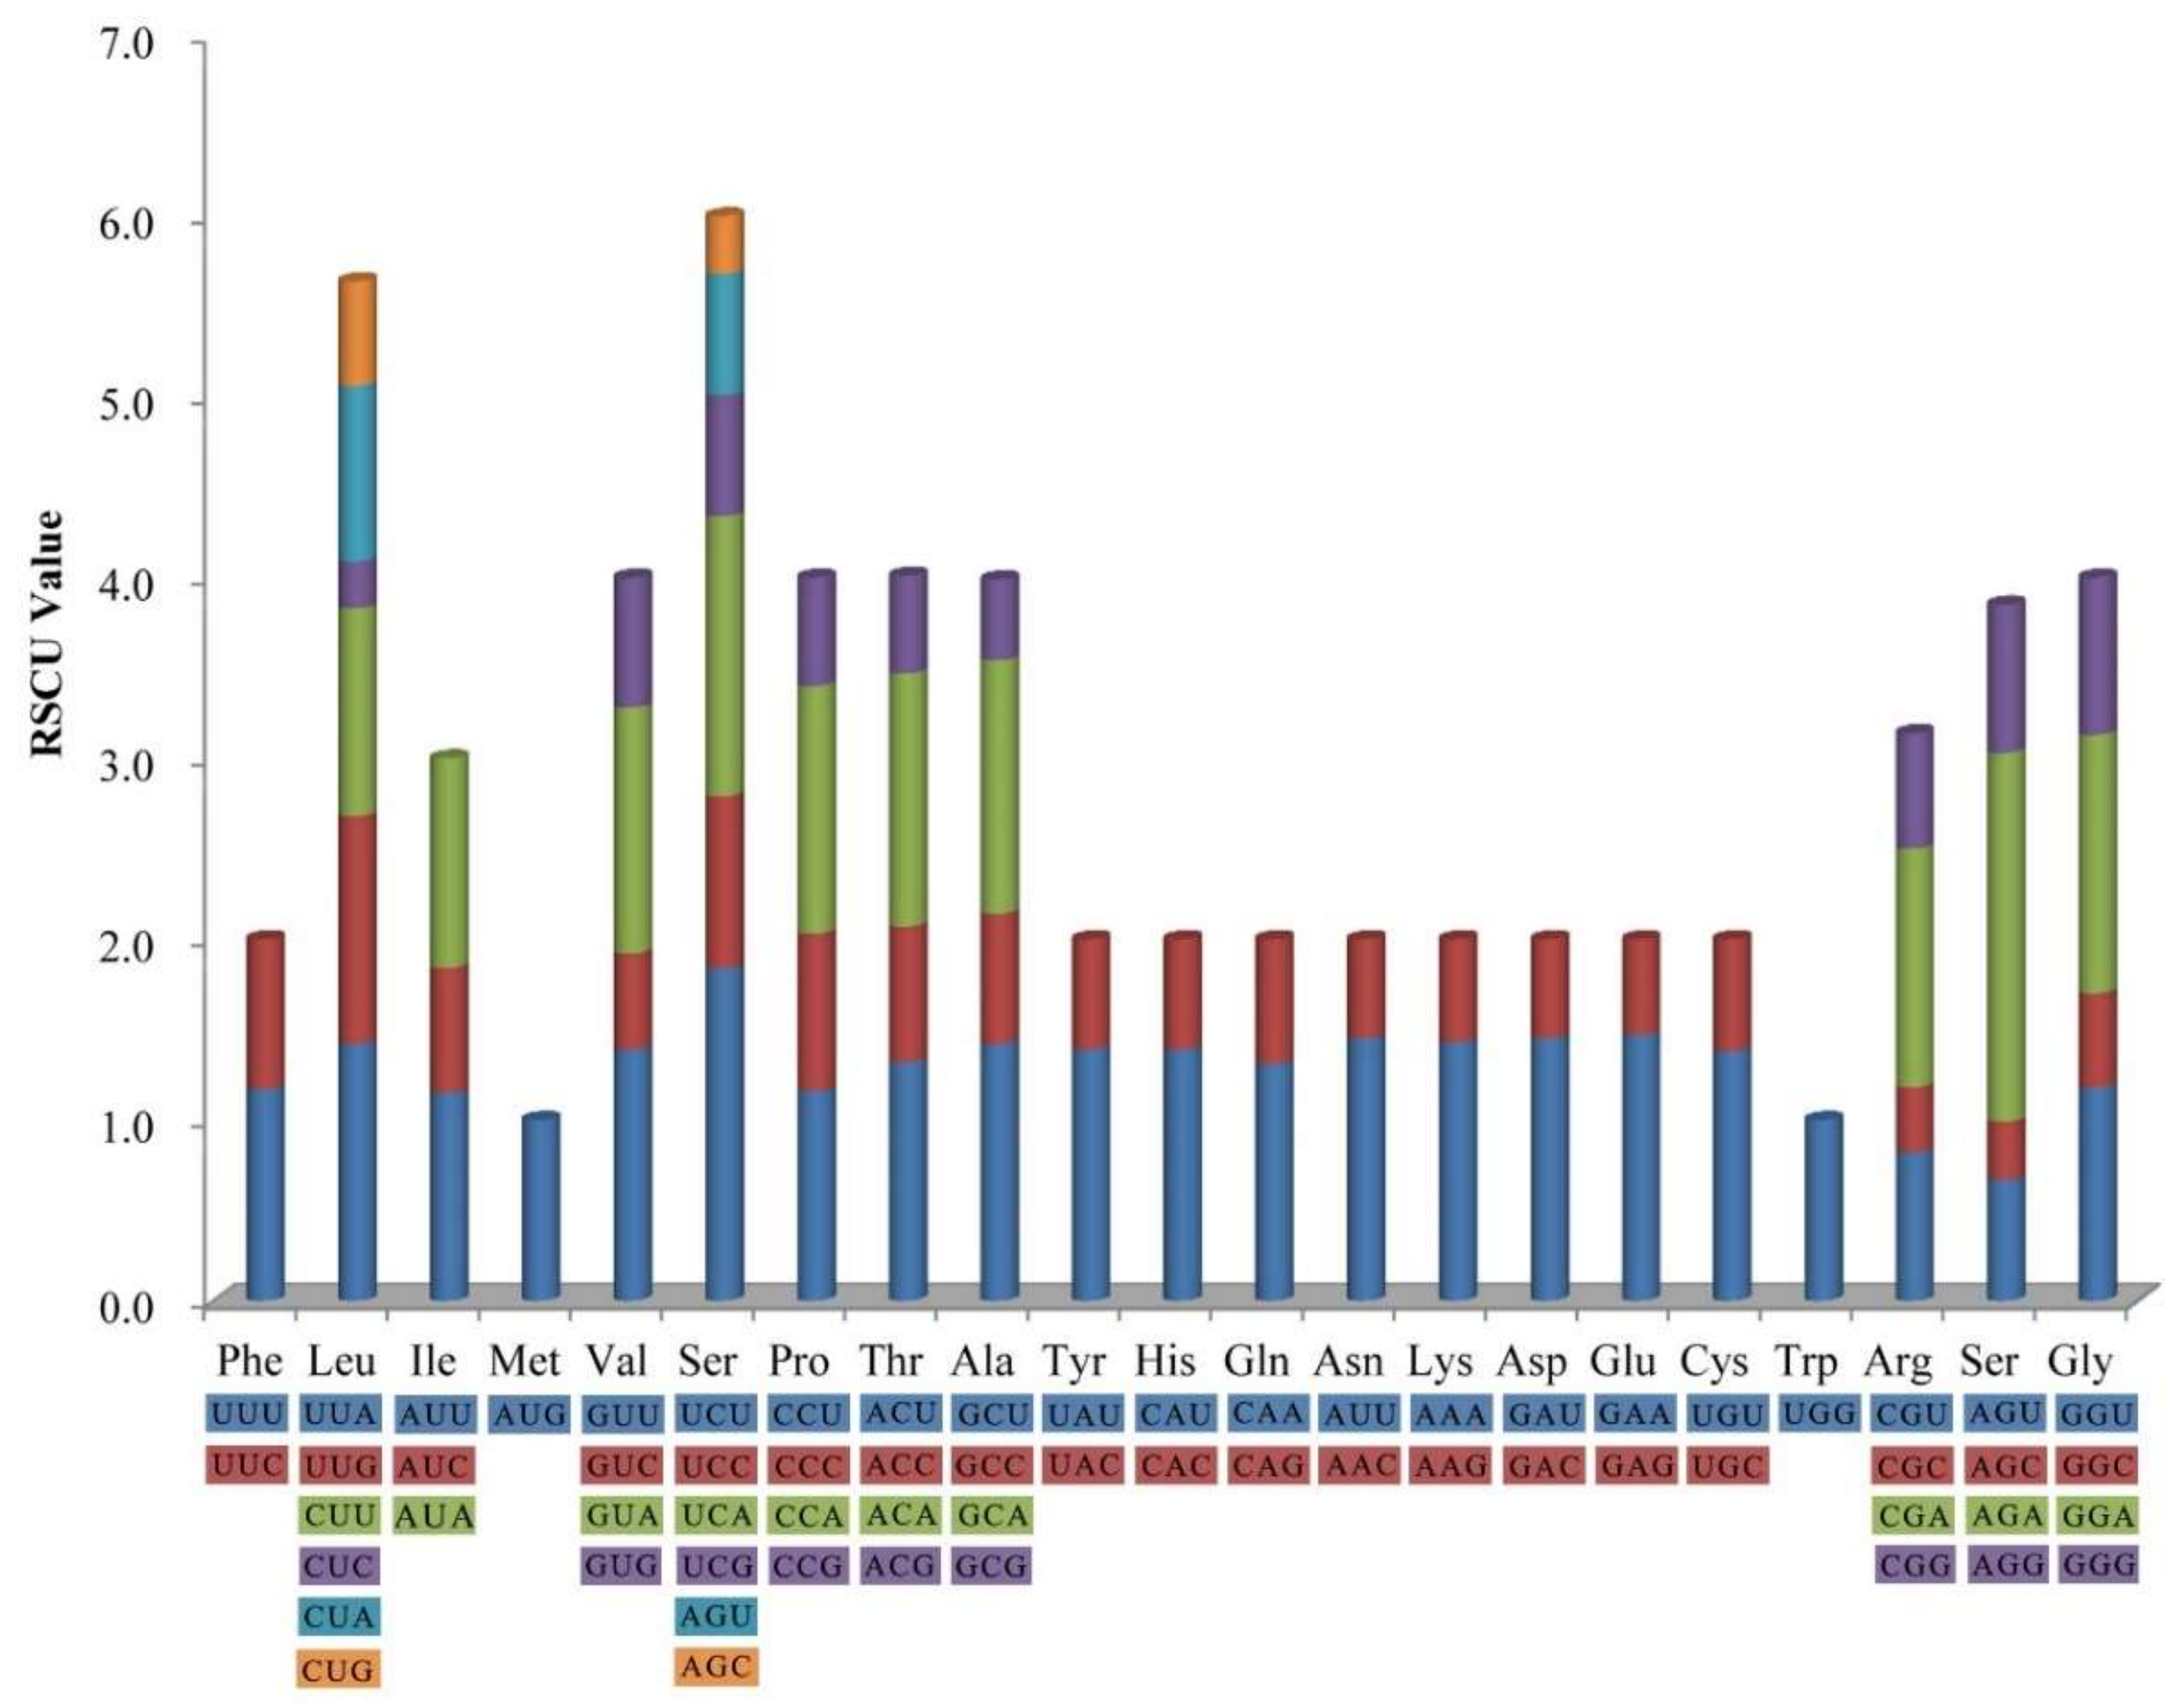
The frequency of codon usage was calculated for the H. myrtifolia cp genome based on the tRNAs and protein-coding genes. Tryptophan (1.5%) and leucine (11.6%) were the least-frequency and highest-frequency amino acids, respectively (Figure 2). Among which, the least and most used were CGC (99) encoded arginine and AAA (1137) encoded lysine, respectively (Table S1). Significantly, as a synonym, almost each amino acid contains half of the codons, which ended with A or T (U) at high relative synonymous codon usage (RSCU) values and low RSCU values ended with G or C (Table S1). The composition bias with high A/T proportion codon usage patterns is generally semblable to those reported from other cp genomes [27].
2.3. Comparative Genomic Analysis of the cp Genomes in Myrtales
From the pairwise comparison of cp genomes, a high level of sequence similarity was found between H. myrtifolia and the 11 other Myrtales cp genomes. By using mVISTA, H. myrtifolia annotation was used as a reference to characterize differences between the 11 Myrtales species’ cp genomes (Figure 3). The results showed that the LSC and SSC regions are more divergent than the two IR regions. In addition, within the LSC and SSC regions, the non-coding regions are more divergent than the coding regions. The most highly differentiated regions including atpB, matK, ndhD, ndhF, ndhH, rpl22, rps15, ycf2, and trnH-psbA. Similar levels of divergence have been previously measured for these gene regions [28,29]. IR regions of all 12 cp genomes were highly conserved, including gene order and number, however, they showed significant differences at the junction of the single-copy regions. Neither inversions nor translocations were detected among these compared genomes. Variations of genome size, IR expansion, and contraction were the main structural differences detected within these 12 cp genomes.
2.3.1. Genome Size Differences between the 12 Myrtales cp Genomes
For genome size of the 12 Myrtales species examined, L. intermedia has the smallest cp genome size (152,330 bp) and Oenothera argillicola the largest (165,055 bp). The genome size variation is largely caused by differences in the intergenic regions (IGS), similar to other angiosperm cp genomes.
2.3.2. Contraction and Expansion of All Inverted Repeats (IRs)
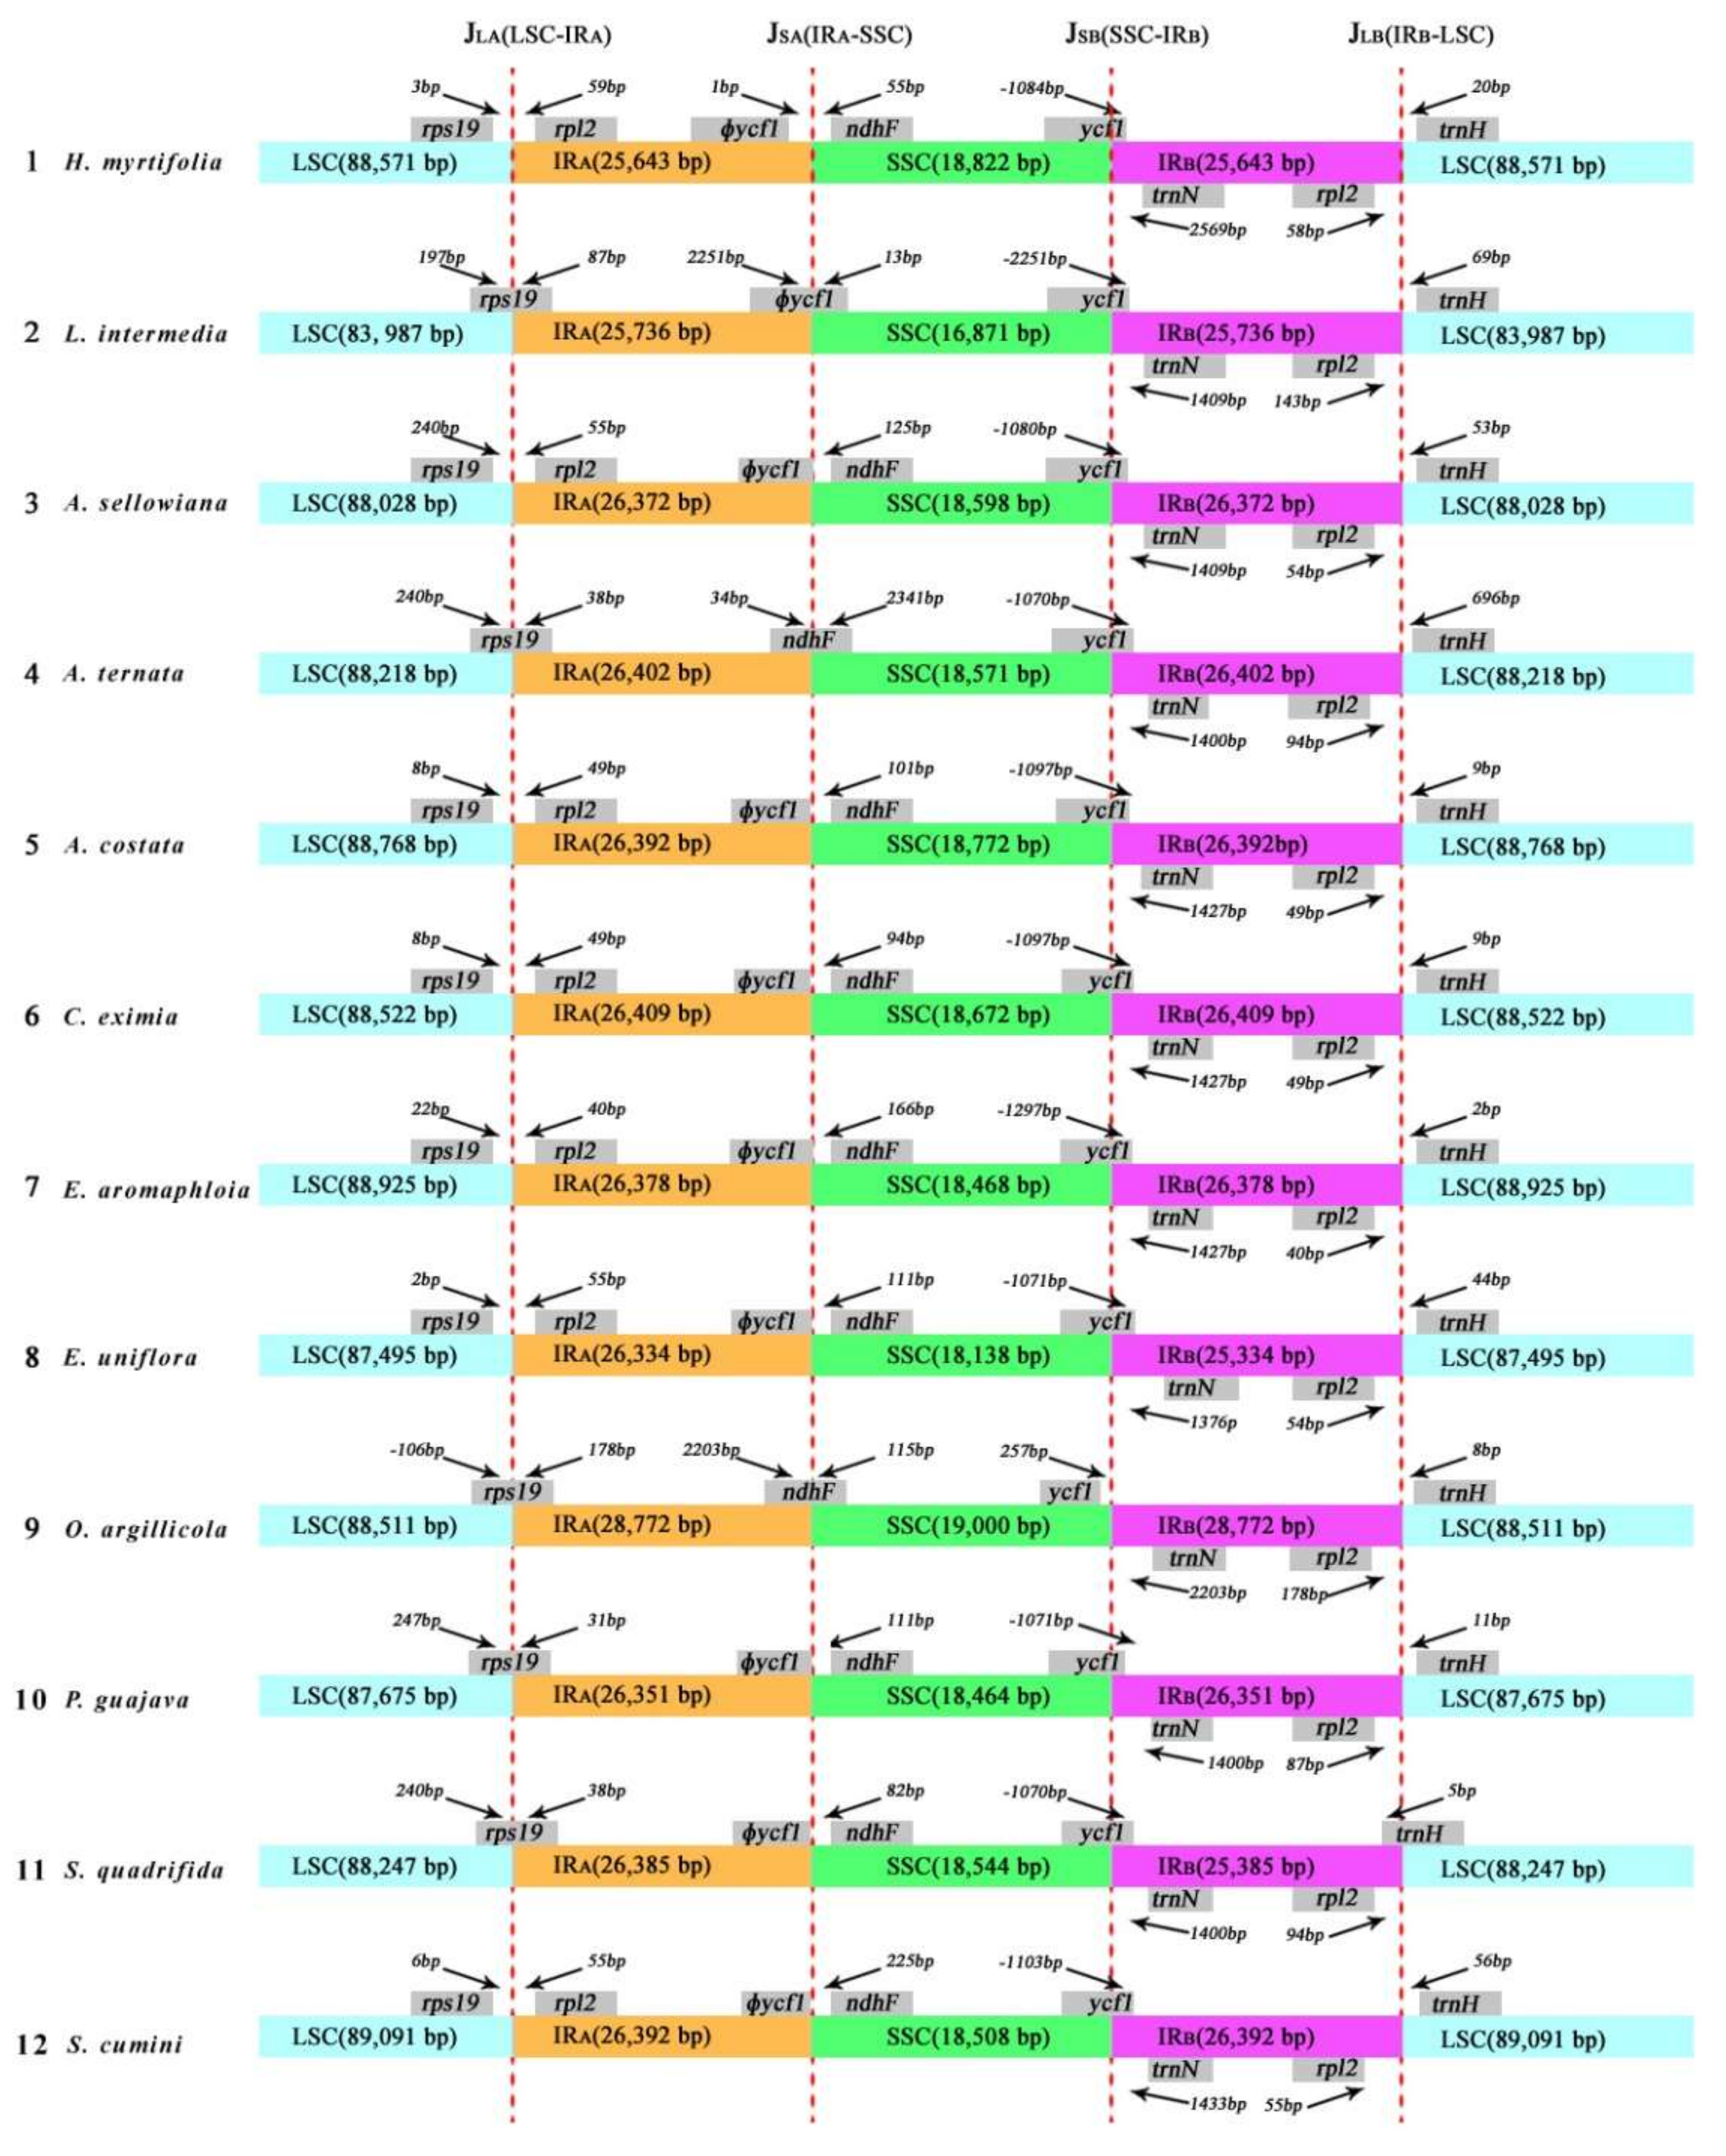
In general, the sizes of IR regions differ between species (Table 1). The expansion and contraction between the two inverted repeats, LSC, and SSC boundary regions usually generates length variation of plant cp genomes [30]. Accurate SC–IR boundaries and their neighboring genes were compared among the 12 Myrtales cp genomes (Figure 4). Although the overall genomic structure was conserved, the 12 Myrtales cp genomes possessed differences at the SC–IR junction regions (Figure 4).
The size of two IRs varied from 25,736 bp (L. intermedia) to 28,772 bp (O. argillicola), as did the four IR boundaries (JLA, JLB, JSA, and JSB) [13] (Figure 4). The IRA–LSC boundary (JLA) is nested in the rps19 coding gene in L. intermedia, A. ternata, O. argillicola, P. guajava, and S. quadrifida by 87 bp, 38 bp, 178 bp, 31 bp, and 38 bp, respectively, into the IRA region. However, in the remaining seven species, the JLA boundary nested in the intergenic region between rps19 and rpl2, in which the distances from rps19 to the JLA ranged from 2 to 240 bp. The IRA–SSC junction (JSA)is nested in the pseudogene ycf1 (ϕycf1) in L. intermedia (Figure 4). The JSA junction for eight of the 12 species (A. sellowiana, A. costata, C. eximia, E. aromaphloia, E. uniflora, Psidium guajava, S. quadrifida, and S. cumini) is located on the edge of ϕycf1. The JSA junction of A. ternata and O. argillicola was located in the range of ndhF, and JSA of H. myrtifolia is situated 1 bp from the end of ϕycf1.
The IRB–SSC boundary (JSB) in 11 of the 12 species is nested in the ycf1 gene, which extended into IRB region, while in O. argillicola, the distance between JSB and the end edge of ycf1 was 257 bp. The IRB–LSC boundary (JLB) was situated in the region between rpl2 and trnH in all of the species except S. quadrifida. In S. quadrifida, the trnH gene extends 5 bp into IRB (Figure 4). The IR-LSC boundary variation is likely the result of a series of two short direct repeats that are mediated by intramolecular recombination within the genes located at the borders [31]. As such, the IR–LSC boundary could be a highly informative region for population or phylogenetic studies.
2.3.3. Long Repeat Structure Analysis
Previous studies have shown that the genome rearrangement can occur from sliding and inappropriate combinations of repetitive sequences [32]. Long repetitive sequences have been highly valuable markers in the study of plant evolution, genome recombination studies, comparative genomics, and phylogenetics [33].
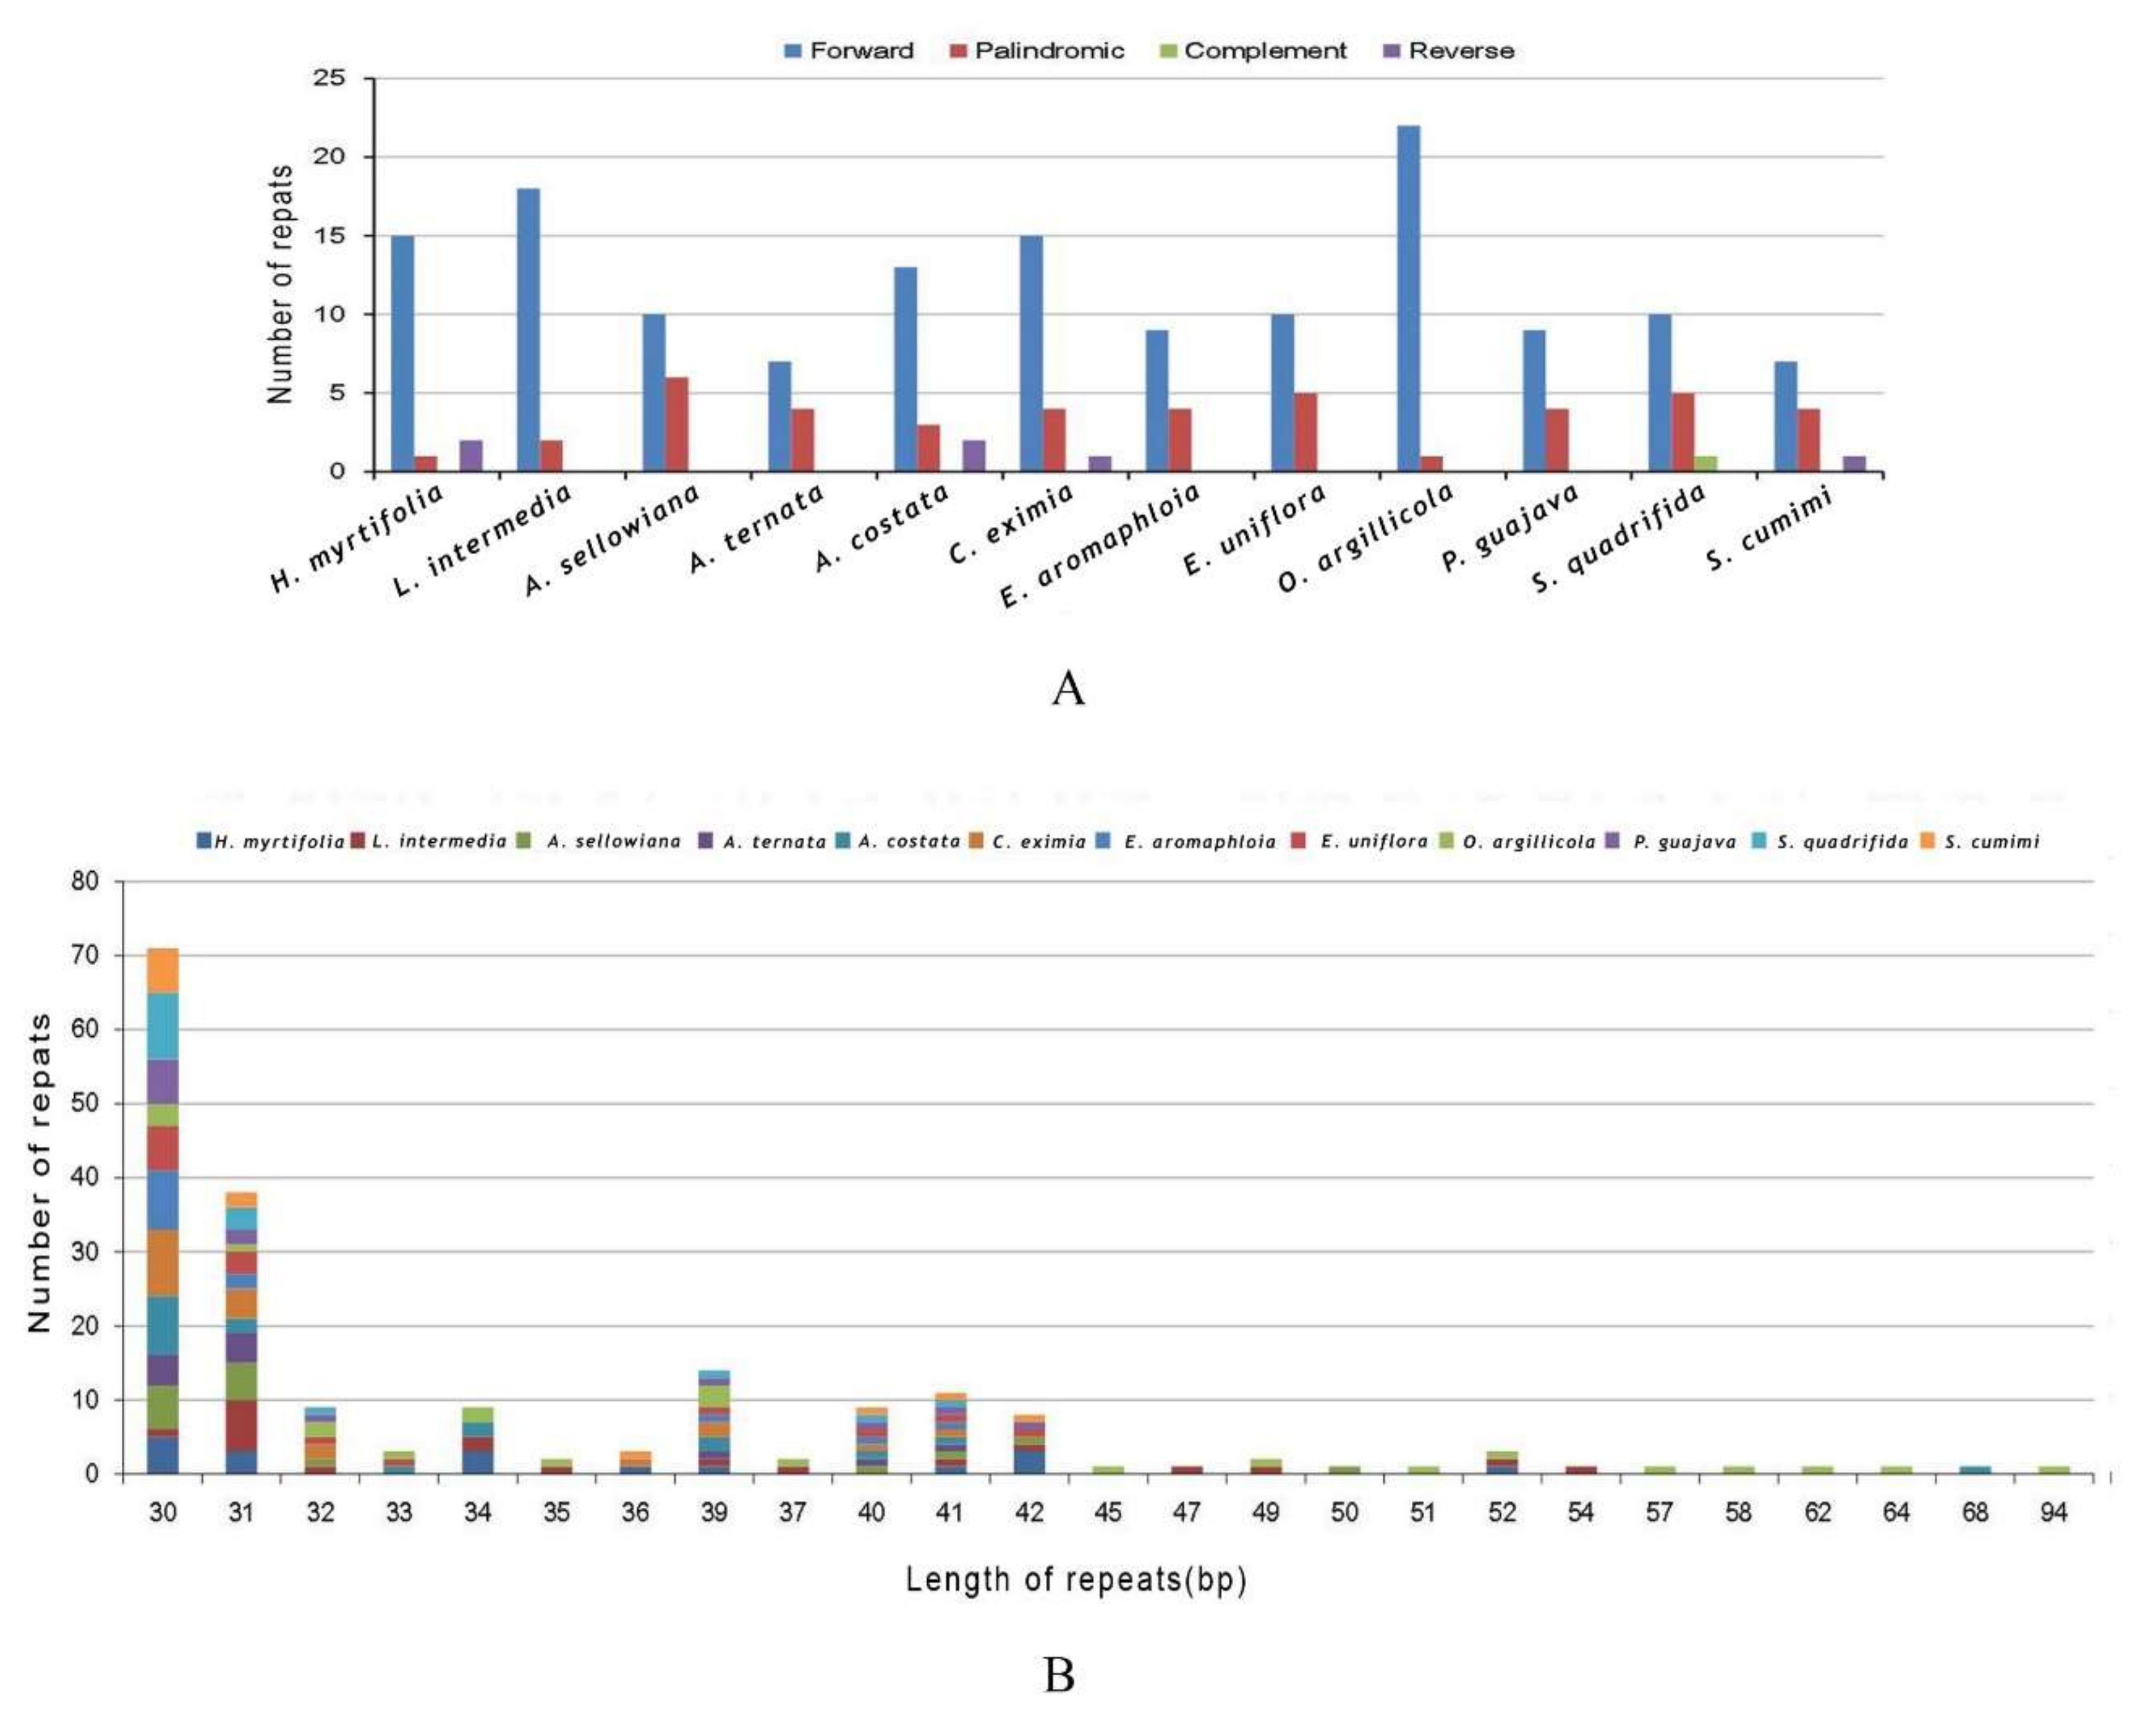
Comparison of forward, reverse, complement, and palindromic repeats (≥30 bp) were made among H. myrtifolia and 11 species using REPuter. In H. myrtifolia, 18 repeats including 15 forward, one palindromic, and two reverse type were found. A. ternata had the fewest (11) repeats with shortest genome size of 159,593 bp, which is inconsistent strictly with the rule of larger genome size possessing more repetitive repeats [34].
In total, 195 repeats in all 12 species were found (Figure 5A). O. argillicola possessed the greatest number of repeats consisting of 22 forward repeats and one palindromic repeat as well as possessing the largest genome of those in this study (Figure 5A and Table S2). In L. intermedia, A. sellowiana, A. costata, C. eximia, E. aromaphloia, E. uniflora, P. guajava, S. quadrifida, and S. cumini cp genomes, 20, 16, 18, 20, 13, 15, 13, 16, and 12 long repeats were identified, respectively (Figure 5A). The largest proportion of repeats (82.1%) varied from 30 bp to 40 bp in length (Figure 5B and Table S2), while the range of repeats was from 94 bp to 30 bp per unit. Forward repeats are usually caused by transposon activity [35], which can correlate with enhanced cellular stress [36]. Forward repeats can cause variation in genome structure and consequently can be employed as markers in population genetic and phylogenetic studies [20].
2.3.4. Simple Sequence Repeat (SSR) Analysis
Simple sequence repeats (SSRs) in cp genomes have high copy number diversity and are thus very useful molecular markers for plant population genetics, breeding studies at the intraspecific level and evolutionary research [37]. In this study, the type, distribution, and number of SSRs were identified using the search criteria as follows: 10 repeats for mononucleotide, three repeats for dinucleotide, trinucleotide, tetranucleotide, pentanucleotide, and hexanucleotide among the cp genomes of 12 species.
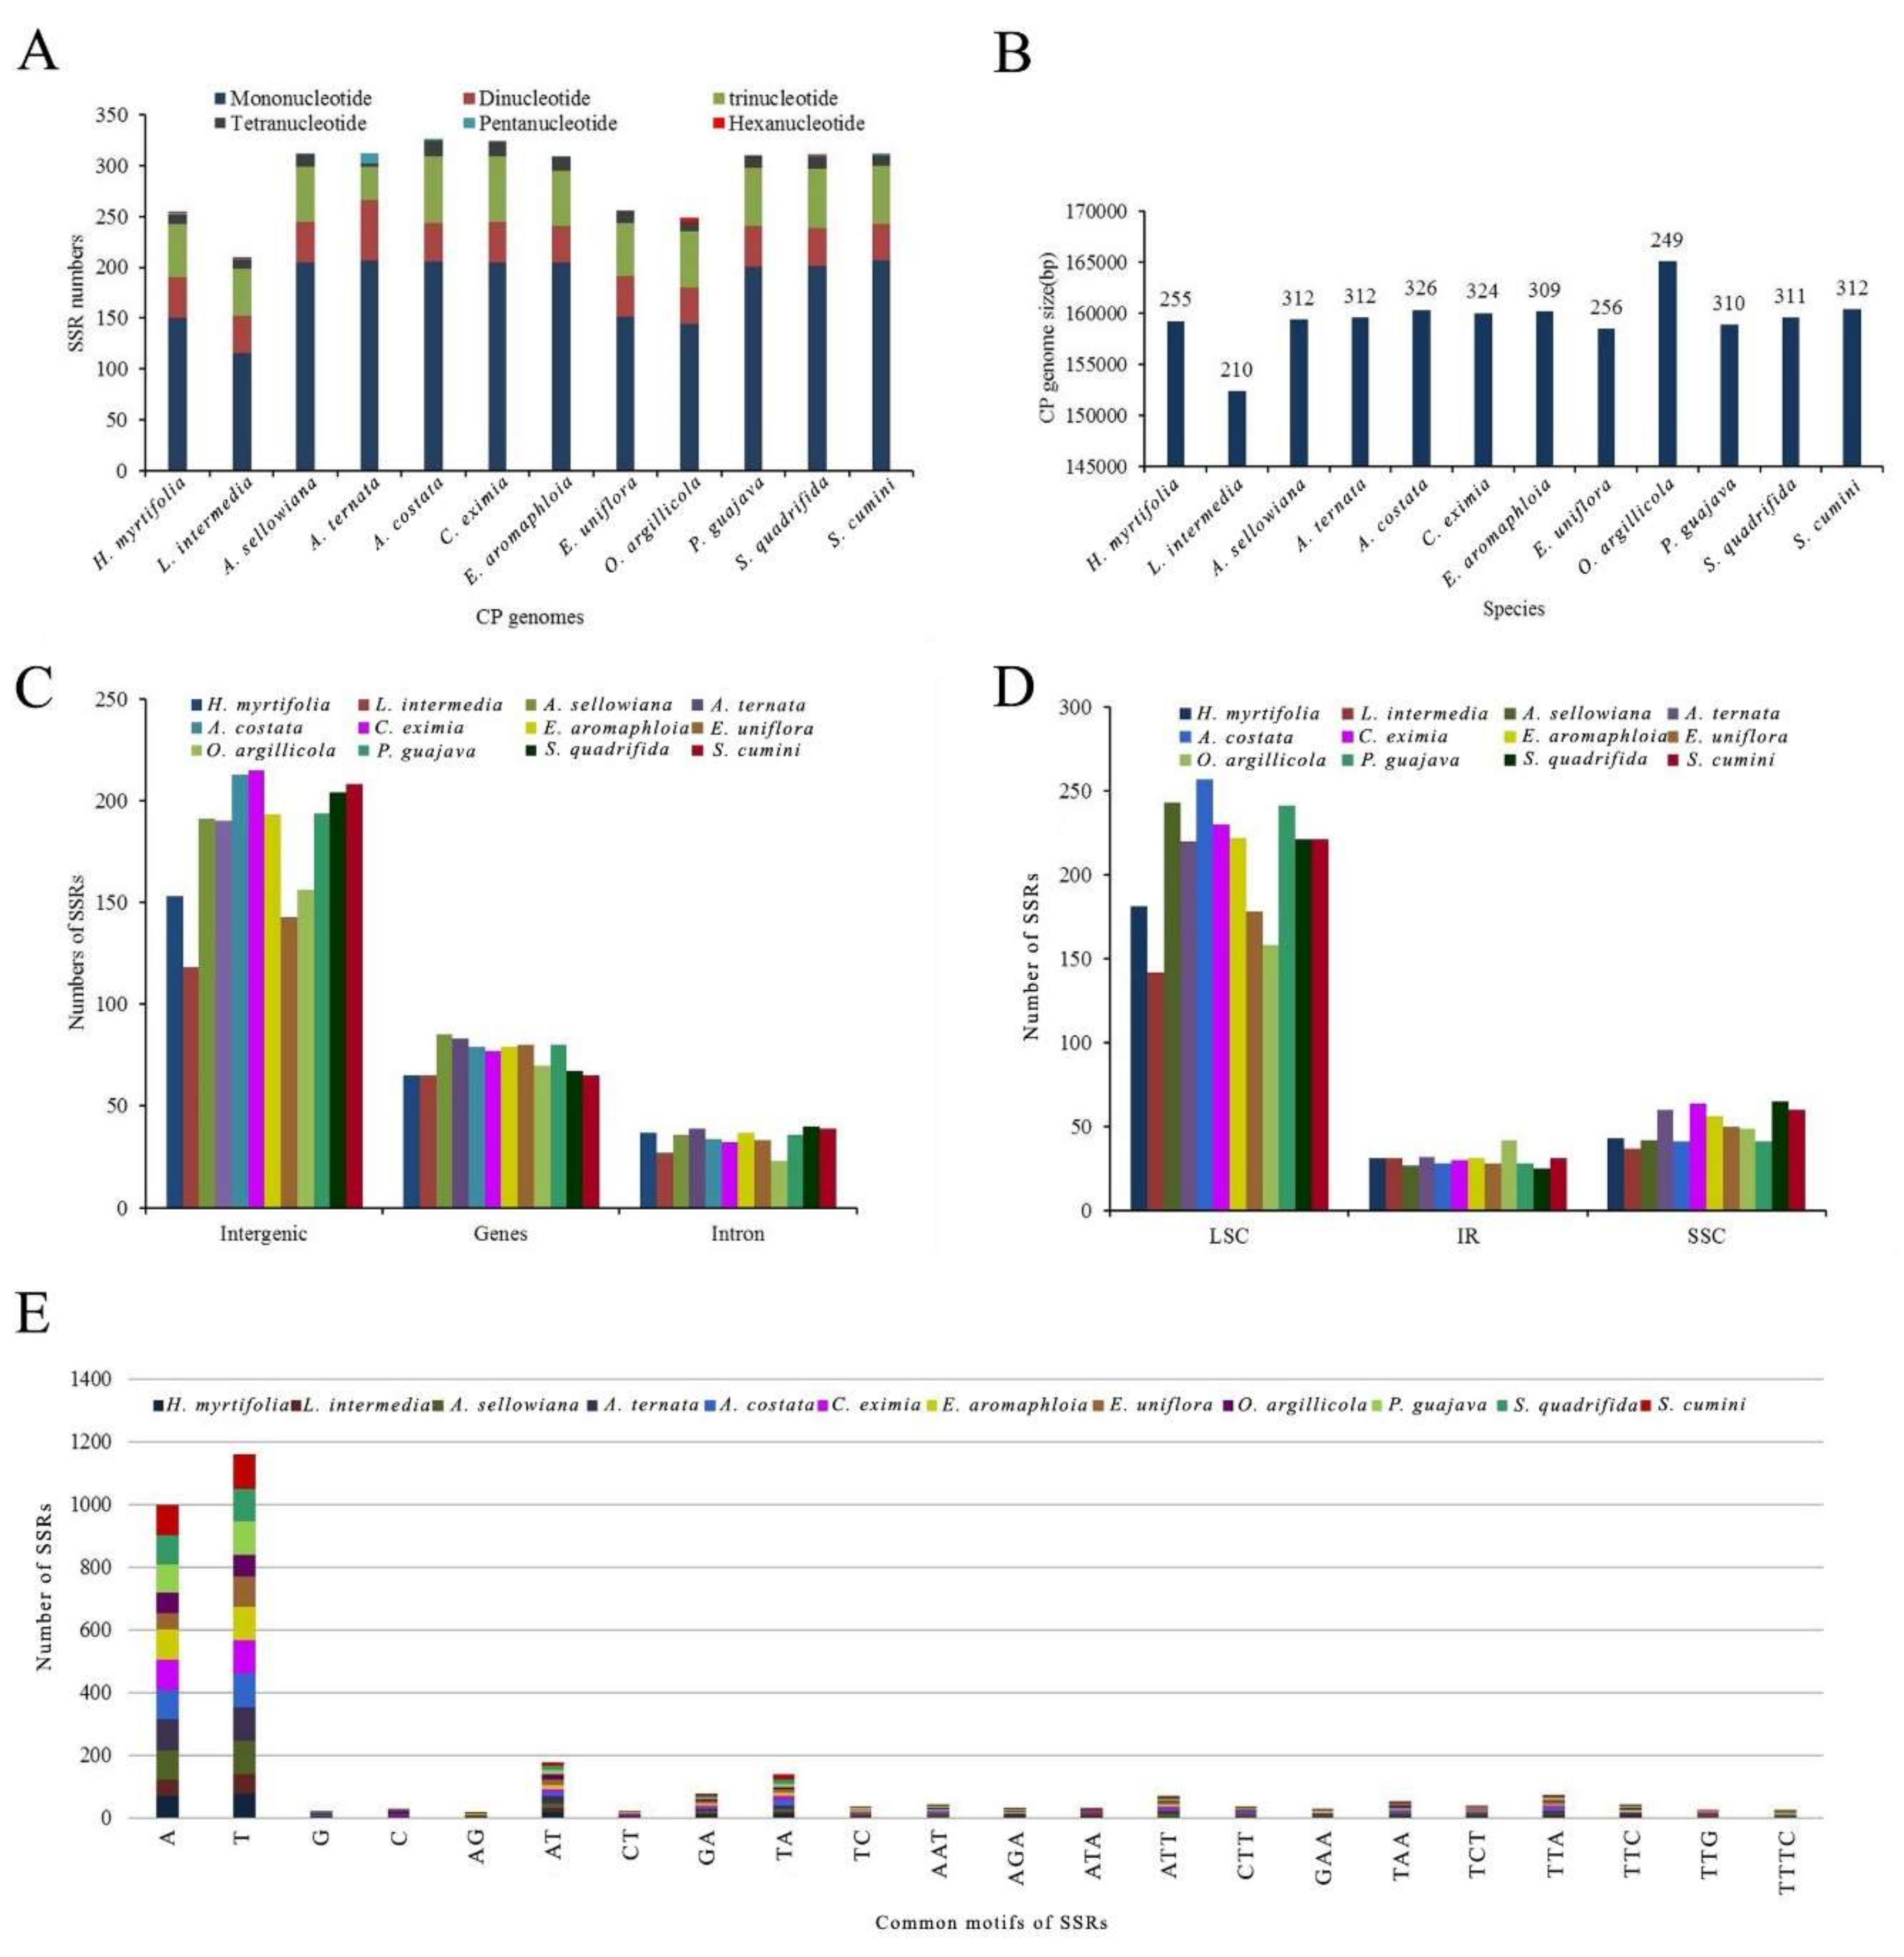
Through SSRHunter analysis, 12 cp genomes were found to contain 210–326 SSRs (H. myrtifolia: 255, L. intermedia: 210, A. sellowiana: 312, A. ternata: 312, A. costata: 326, C. eximia: 324, E. aromaphloia: 309, E. uniflora: 256, O. argillicola: 249, P. guajava: 310, S. quadrifida: 311, and S. cumini: 312) (Figure 6A,B and Table S3). Among the 12 species, L. intermedia had the fewest 210 SSRs (Figure 6A) as well as the shortest cp genome (152,330 bp) among those studied. This suggests that the number of SSRs in these species may have some correlation with the genome size.
Among SSRs found herein, the mononucleotide repeat units A/T and G/C with repeat number from eight to 18 accounted for the largest proportion with 66.4% in A. ternata and S. cumini, 66.3% in E. aromaphloia, 65.7% in A. sellowiana, 64.9% in S. quadrifida, 64.8% in P. guajava, 63.2% in C. eximia, 63.1% in A. costata, 59.4% in E. uniflora, 59.2% in H. myrtifolia, 57.8% in O. argillicola, and 55.2% in L. intermedia (Figure 6A and Table S3). Among the 255 SSRs in H. myrtifolia, 153 SSRs were found in intergenic regions (IGS), 65 SSRs in protein-coding regions, and 37 SSRs in introns (Figure 6C,D). The higher number of SSRs in the IGS regions might be contributing to the increased mutation rates in these regions over coding regions, given the higher rate of SSR mutation. In the H. myrtifolia cp genome, 65 SSRs were situated in 28 protein-coding genes (ycf1 (10), ycf2 (14), ndhD, petA, psbB, psbE, rbcL, rpoC2 (4), ndhF (3), atpB, atpI, ccsA, cemA, matK, ndhA, ndhB, ndhK, psaA, psaB, psaJ, rpl2, rpl22, rpl32, rpoA, rpoB, rpoC1, rps19 (2), ycf4). In general, the cp genomes examined had an abundant diversity of SSRs for use in future studies.
2.3.5. Divergence Hotspots among Myrtales Species
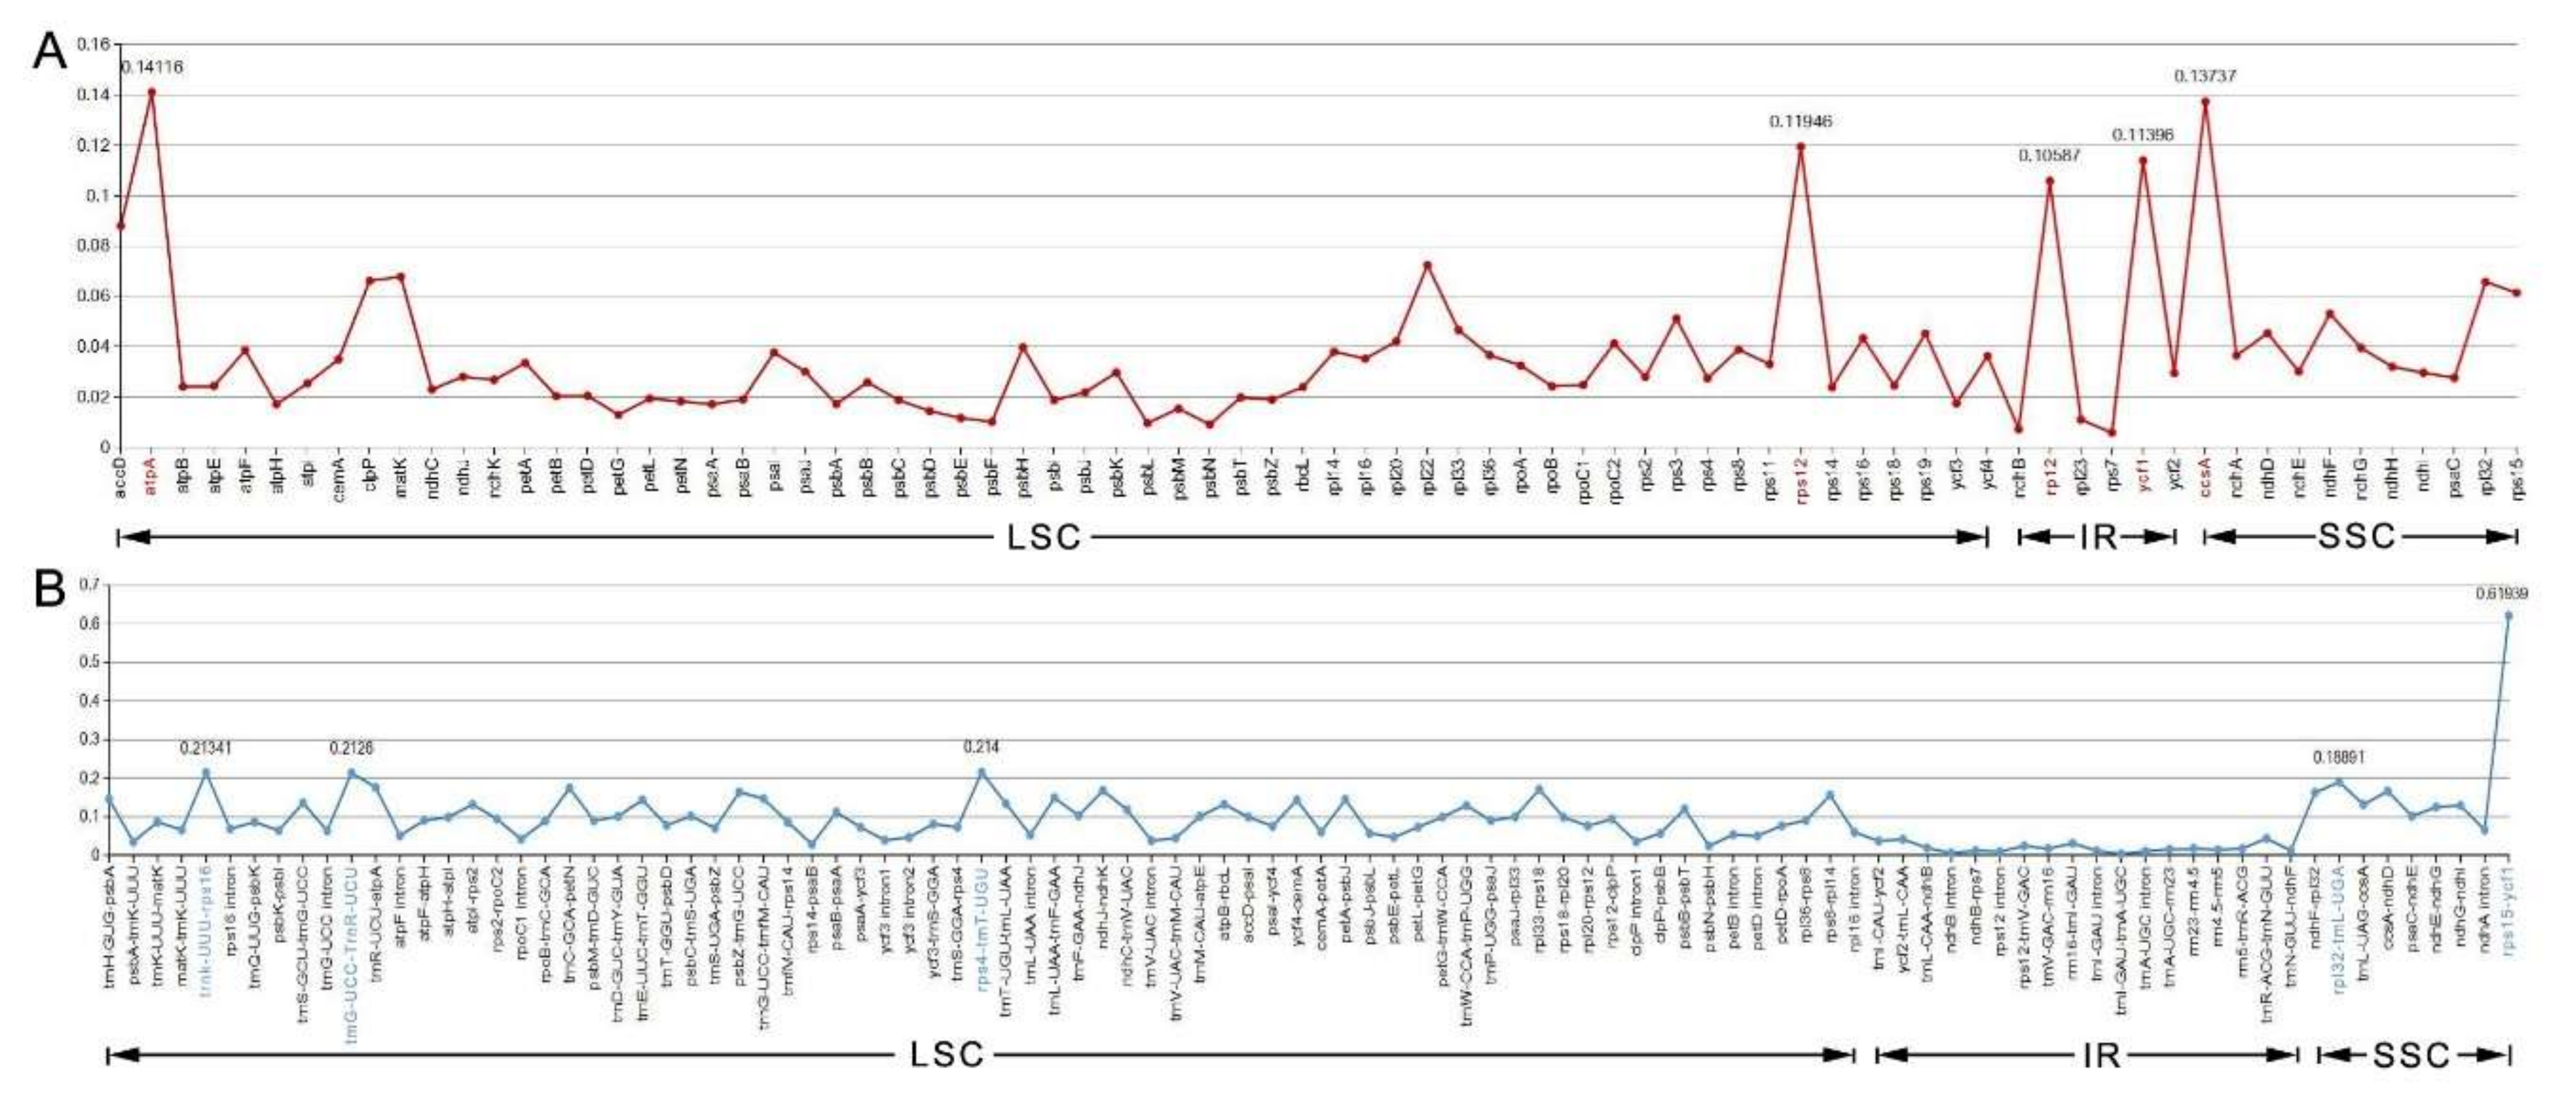
The nucleotide diversity (Pi) values of the 12 species’ cp genomes were computed separately for the IRs, LSC, SSC regions, and protein-coding genes including introns (Figure 7A,B). The IGS regions were far more divergent than the protein-coding regions (CDS). In regard to the quadripartite subdivisions, the LSC and SSC are less divergent than IRs regions. Within the CDS regions, Pi values varied from 0.09 to 0.141 with an average value of 0.033 in the LSC region, the SSC region ranged from 0.028 to 0.137, with an average value of 0.051, and the IR region had values from 0.005 to 0.114 with an average value of 0.046.
The five genes with the largest variability in CDS region were atpA, ccsA, rps12, ycf1, and rpl2 (Figure 7A), and for the IGS regions, rps15-ycf1, rps4-trnT-UGU, trnK-UUU-rps16, trnG-UCC-trnR-UCU, and rpl32-trnL-UAG were the most variable (Figure 7B). Some regions were uncharacteristically conserved with IGS regions trnI-GAU-trnA-UGC and the ndhB intron showing less variation than that of genes situated in the CDS region (Figure 7B).
2.3.6. Phylogenetic Analysis of H. myrtifolia and Related Myrtales cp Genomes
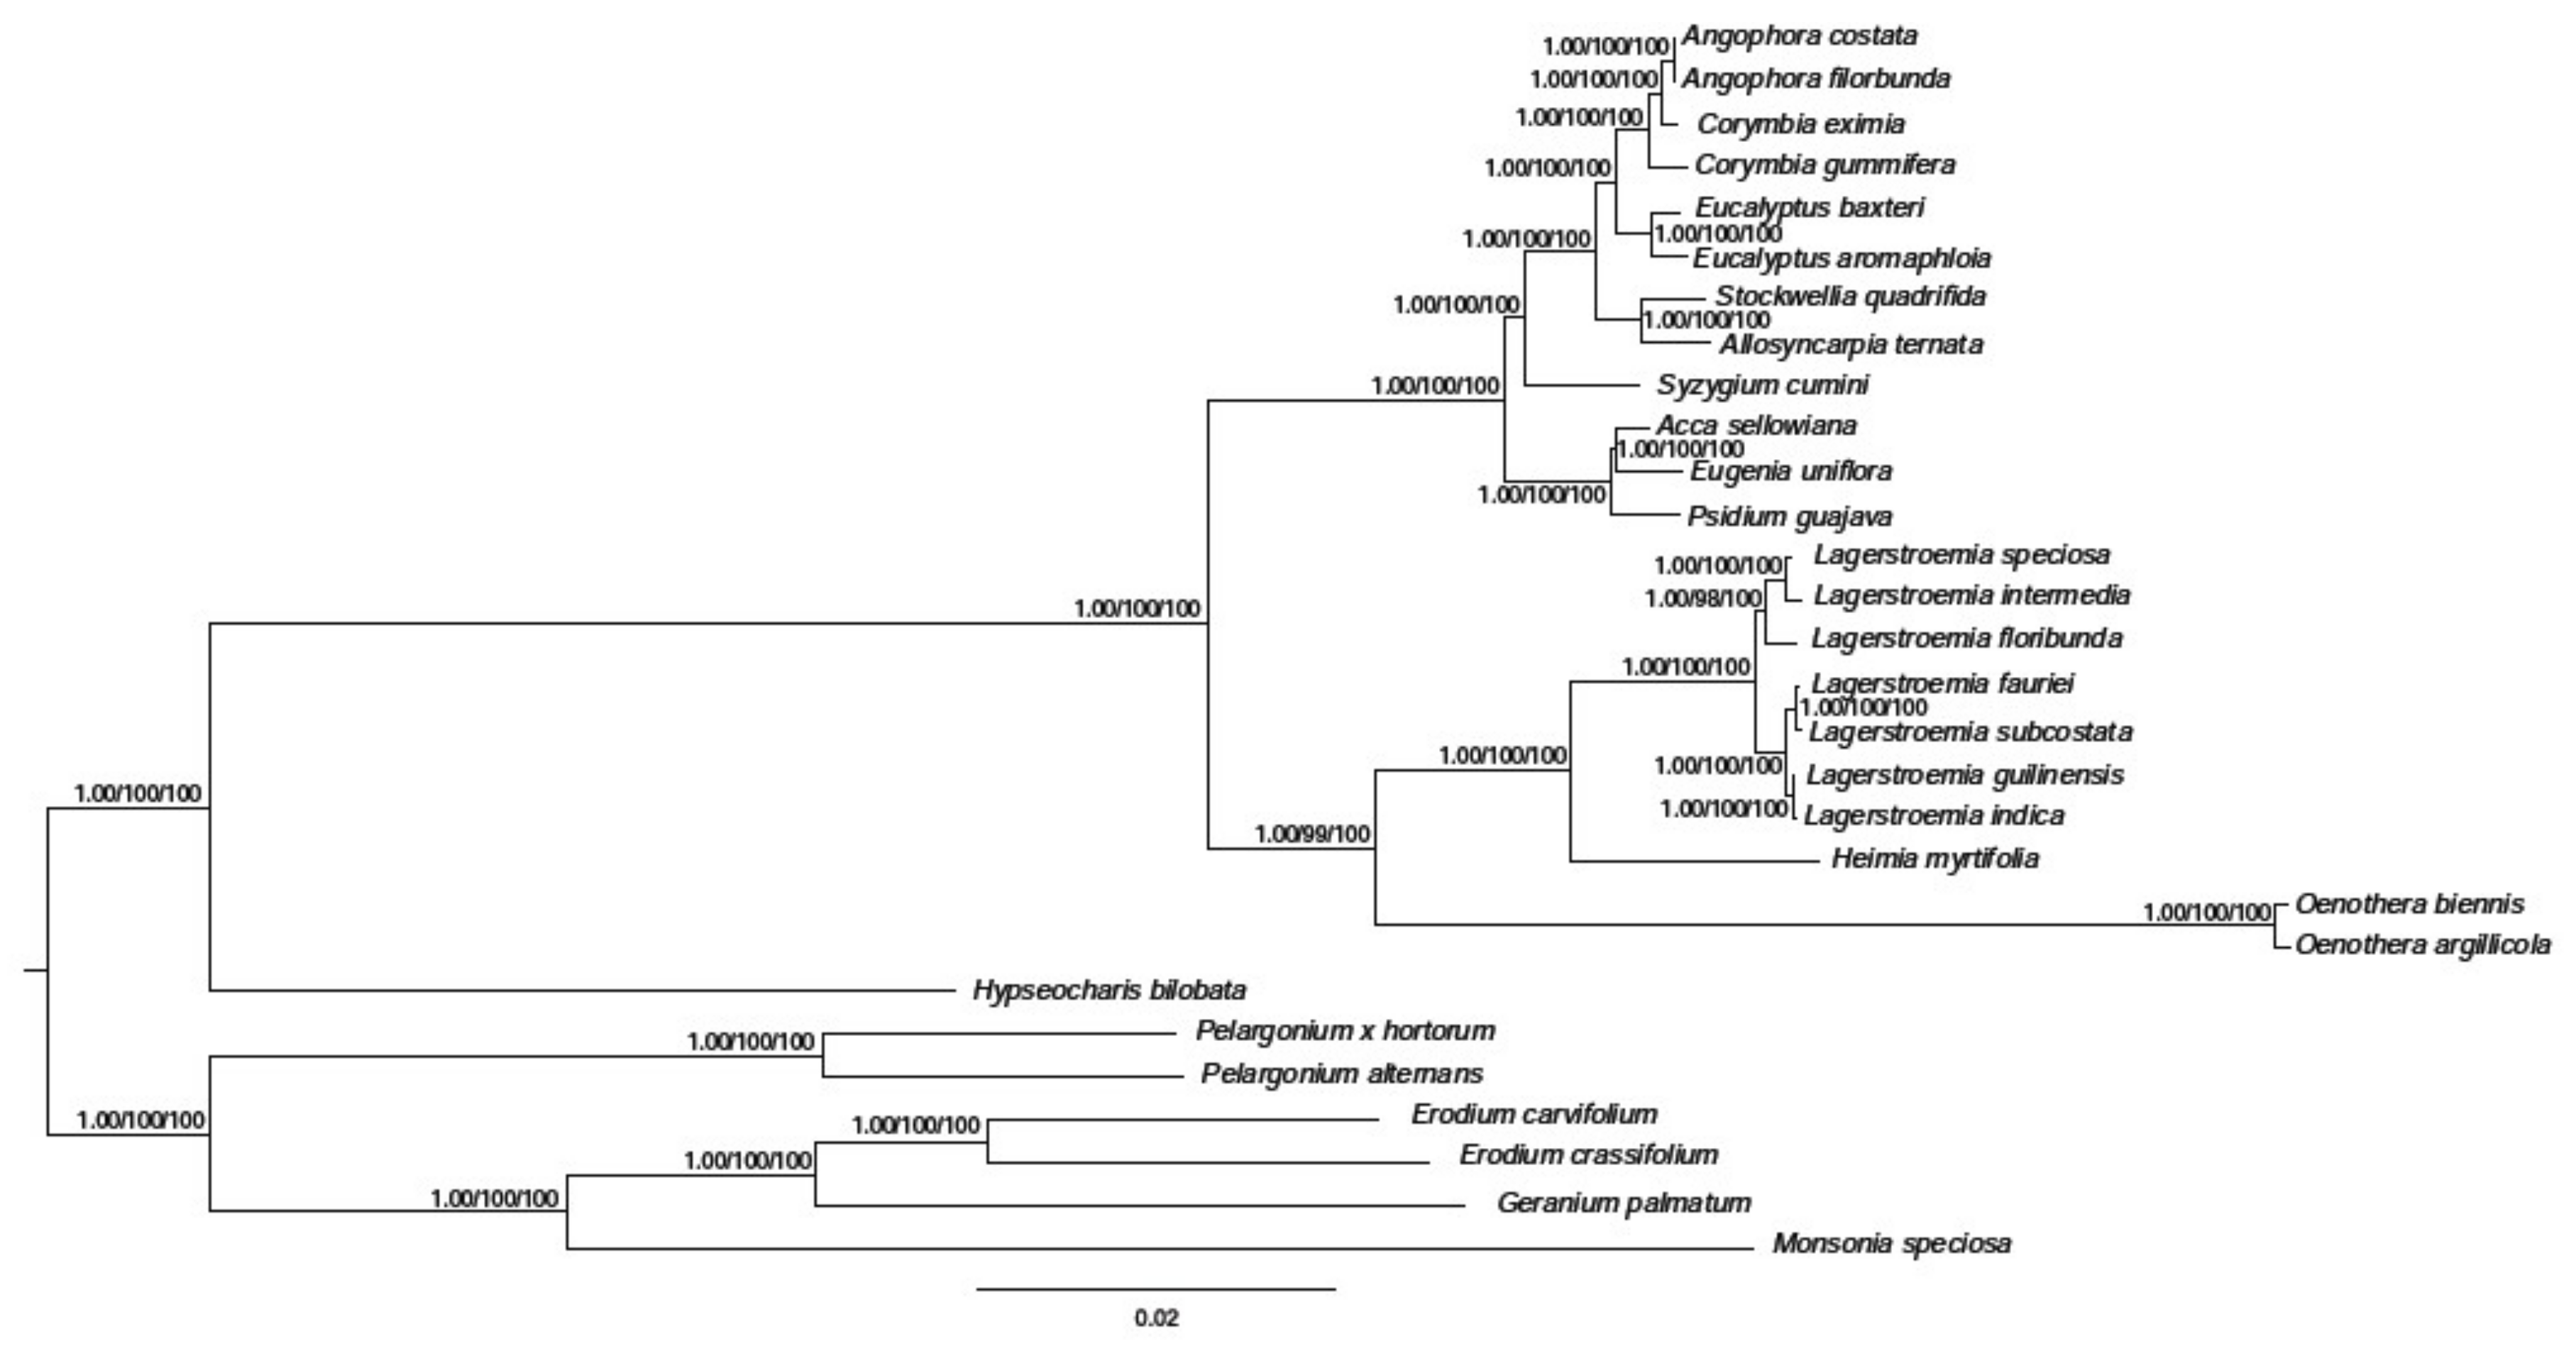
In the past few decades, the method of constructing phylogenetic trees has been based on one or a few relatively short sequences [38]. However, due to lateral gene transfer, paralogy, and genetic evolution rate differences between groups, the phylogenetic tree based on a single or few genes cannot sufficiently represent phylogenetic relationships. The entire cp genome is being used more and more in plant phylogenetic and population genetics as large-scale DNA sequencing becomes more main stream and less expensive. Our phylogenetic tree showed that H. myrtifolia is most closely related to Lagerstroemia species based on the 68 shared protein-coding genes in the matrix (Figure 8). Through all three methods, the phylogenetic tree had very high bootstrap support for most branches. These results suggested that entire cp genome information may be useful when resolving phylogenetic relationship conflicts. However, phylogenetic analyses with many closely related species and populations are needed to thoroughly examine the resolving power of cp coding genes [13,39].
3. Materials and Methods
3.1. DNA Extraction of Plant Materials and Sequencing
Fresh leaves of H. myrtifolia (Lythraceae, Myrtales) were attained from Hangzhou Botanic Garden, Zhejiang Province (China), and were preserved immediately in silica gel. Genomic DNA was extracted employing a standard Cetyl trimethyl ammonium bromide (CTAB) protocol [40]. The concentration and quality of extracted DNA was evaluated using a NanoDrop 2000 Micro spectrophotometer and an Agilent 2100 Bioanalyzer (Agilent Technologies, Santa Clara, CA, USA).
A sequence library was constructed using purified DNA following the manufacturer’s instructions. Using an Illumina HiSeq 2000 sequencer (Illumina Biotechnology company, San Diego, CA, USA), approximately 41,103,536 raw reads were obtained with paired-end (PE) 150 bp length reads.
3.2. Chloroplast Genome Assembly, Annotation, and Structure
Using Trimmomatic v0.3, raw reads with a Phred Quality Score of 20 or less were trimmed and filtered [41] using the following settings: sliding window: 4:15, trailing: 3, leading: 3, and minlen: 50. First, the CLC Genomics Workbench v7.0 (Qiagen Company, Hilden, Germany) was employed to carry out de novo assembly with the default parameters [13]. Second, using the Lagerstroemia fauriei cp genome as a reference, all contigs were aligned using BLAST software on the NCBI website to generate the complete cp genome.
Genome annotation was performed for the ribosomal RNAs (rRNAs), transfer RNAs (tRNAs), and protein-coding genes using DOGMA v1.2 [42]. The start and stop codons and the exon–intron boundaries of genes were precisely manually confirmed using published cp genomes [39]. Draft annotations were subsequently examined and manual adjustments were made with alignments to related species L. fauriei [13]. BLASTN searches in the NCBI website were used to identify and confirm both tRNA and rRNA genes. Lastly, further verification of the tRNA genes was carried out with tRNAscan-SE v1.21 [43]. The final cp genome physical map was drawn using OGDraw software [44].
3.3. Codon Usage
In order to detect the deviation in the use of synonymous codons, the relative synonymous codon usage (RSCU) was used to examine the effect of amino acid composition as calculated by MEGA 6 [45]. The RSCU is a simple method to determine synonymous codon inconsistencies in coding sequences. The RSCU value is the relative probability for a specific codon when translating the corresponding amino acid and it removes the effect of the amino acid composition on the use of the codon. An RSCU of >1.00 denotes codons are used more frequently than expected, while an RSCU of <1.00 denotes a codon is being applied less frequently than expected.
3.4. Genome Comparative Analysis and Molecular Marker Identification
We downloaded Lagerstroemia intermedia, Acca sellowiana, Angophora costata, Allosyncarpia ternata, Corymbia eximia, Eucalyptus aromaphloia, Eugenia uniflora, Oenothera argillicola, Psidium guajava, Syzygium cumini, and Stockwellia quadrifida cp genomes from GenBank (GenBank accession numbers in Table 1 and Table 2), as a set to compare cp genomes in the Myrtales. Using the annotation of H. myrtifolia as the reference, pairwise alignments among 12 cp genomes in the Myrtales were conducted using LAGAN mode in the mVISTA program [46].
In order to assess the different evolutionary patterns in Myrtales and detect the highly informative regions, we extracted both intergenic regions and protein-coding regions after alignment using MEGA 6. The two-standard cutoff was used wherein at least one mutation site must be present and the aligned length is >200 bp. The nucleotide diversity (Pi) of these regions was calculated using DNaSP V5.10 [47].
3.5. IR Expansion and Contraction of cp Boundaries
Genome differences between species are often found at the LSC and SSC junctions with the two reverse duplicate regions (IRA and IRB). There are four boundaries (JLA, JLB, JSA, and JSB) in the cp genome between the two IRs and the LSC and SSC regions [30]. The precise IR expansion and contraction with the boundary genes among H. myrtifolia and the 11 other Myrtales species were compared in this study.
3.6. Identification of Long Repetitive Sequences and Simple Sequence Repeats (SSRs)
Long repetitive repeat sequences, including forward, reverse, palindromic, and complement repeats, were identified by employing REPuter [48]. The settings for identifying long repetitive repeats were used as follows: (1) a minimum repeat size of 30 bp; (2) 90% or greater sequence identity; (3) a Hamming distance of 3 [49]. To find SSRs within the cp genome, SSRHunter was employed using the following parameter settings for each motif type: mononucleotides ≥ 8; dinucleotides ≥ 4; trinucleotides, tetranucleotides, pentanucleotide, and hexanucleotide SSRs ≥ 3.
3.7. Phylogenetic Analysis
To analyze the phylogenetic placement of H. myrtifolia, 68 common protein-coding genes of the cp genomes from 29 species were employed including 6 outgroup species from Geraniaceae (Erodium carvifolium, Erodium crassifolium, Monsonia speciosa, Pelargonium alternans, Pelargonium x hortorum, and Geranium palmatum (GenBank accession numbers of species in Table S5). With the Clustal X default parameters, alignments were conducted to retain the reading frames accompanied by manual correction [50]. The data matrix used in the phylogenetic analyses is attached as supplemental data (Supplementary Materials). The phylogenetic tree based on these 68 concatenated genes was constructed using three phylogenetic-inference methods: maximum-likelihood (ML) using PHYML v 2.4.5 [51], Bayesian inference (BI) using MrBayes 3.1.2 [52] and parsimony analysis using PAUP* 4.0b10 [53] employing the settings from [13].
4. Conclusions
By adopting high coverage Illumina sequencing, we completed the H. myrtifolia cp genome and deposited the sequence into GenBank (Accession number: MG921615). The general genome structure, gene number, and gene content of H. myrtifolia were similar with all other cp genomes from Myrtales. However, numerous differences were found between the 12 species examined that are useful markers for studies in molecular evolution of cp genomes. The cp genome information of H. myrtifolia is a useful genetic resource that could be applied to population genomic studies for Lythraceae species and help elucidate genomic patterns and the evolutionary history in the group more broadly.
Supplementary Materials
Supplementary materials will be available online.
Acknowledgments
This research was sponsored by Zhejiang Provincial Natural Science Foundation of China under Grant No. LY17C160003. We also appreciate the editors and the constructive comments of the reviewers who have helped us improve the manuscript.
Author Contributions
C.H.G, B.D., L.X., and Z.Q.W. did materials collection, sequenced and analyzed the data, designed the experiments, wrote the paper, combined figures and tables, and revised drafts of this paper. S.Y.Z. and L.R.T. reviewed figures, tables, and drafts of this paper.
Conflicts of Interest
The authors declare no conflict of interest.
References
- Gledhill, D. The Names of Plants; Cambridge University Press: Oxford, UK, 1989. [Google Scholar]
- Hegnauer, R.; Herfst, A. Over Heimia salicfolia Link et Otto. Pharm. Weekbl. 1958, 93, 849–865. [Google Scholar] [PubMed]
- Malone, M.H.; Rother, A. Heimia salicifolia: A phytochemical and phytopharmacologic review. J. Ethnopharmacol. 1994, 42, 135–159. [Google Scholar] [CrossRef]
- Lema, W.L.; Blankenship, J.W.; Malone, M.H. Prostaglandin synthetase inhibition by alkaloids of Heimia salicifolia. J. Ethnopharmacol. 1986, 15, 161–167. [Google Scholar] [CrossRef]
- Liu, J.; Qi, Z.; Zhao, Y.; Fu, C.; Xiang, Q.J. Molecular phylogenetics and evolution complete cpDNA genome sequence of Smilax china and phylogenetic placement of Liliales–Influences of gene partitions and taxon sampling. Mol. Phylogenet. Evol. 2012, 64, 545–562. [Google Scholar] [CrossRef] [PubMed]
- Jansen, R.K.; Cai, Z.; Raubeson, L.A.; Daniell, H.; Depamphilis, C.W.; Leebens-Mack, J.; Müller, K.F.; Guisinger-Bellian, M.; Haberle, R.C.; Hansen, A.K.; et al. Analysis of 81 genes from 64 plastid genomes resolves relationships in angiosperms and identifies genome-scale evolutionary patterns. Proc. Natl. Acad. Sci. USA 2007, 104, 19369–19374. [Google Scholar] [CrossRef] [PubMed]
- Wicke, S.; Schneeweiss, G.M.; DePamphilis, C.W.; Müller, K.F.; Quandt, D. The evolution of the plastid chromosome in land plants: Gene content, gene order, gene function. Plant Mol. Biol. 2011, 76, 273–297. [Google Scholar] [CrossRef] [PubMed]
- Asaf, S.; Waqas, M.; Khan, A.L.; Khan, M.A.; Kang, S.M.; Imran, Q.M.; Shahzad, R.; Bilal, S.; Yun, B.W.; Lee, I.J. The complete chloroplast genome of wild rice (Oryza minuta) and its comparison to related species. Front. Plant Sci. 2017, 8, 304. [Google Scholar] [CrossRef] [PubMed]
- Wang, L.; Wu, Z.Q.; Bystriakova, N.; Ansell, S.W.; Xiang, Q.P.; Heinrichs, J.; Scheider, H.; Zhang, X.C. Phylogeography of the Sino-Himalayan Fern Lepisorus clathratus on “The Roof of the World”. PLoS ONE 2011, 6, e25896. [Google Scholar] [CrossRef] [PubMed]
- Wang, L.; Scheider, H.; Wu, Z.Q.; He, L.J.; Zhang, X.C.; Xiang, Q.P. Indehiscent sporangia enable the accumulation of local fern diversity at the Qinghai-Tibetan Plateau. BMC Evol. Biol. 2012, 12, 158. [Google Scholar] [CrossRef] [PubMed]
- Wu, Z.Q. The completed eight chloroplast genomes of tomato from Solanum genus. Mitochondrial DNA Part A 2016, 27, 4155–4157. [Google Scholar] [CrossRef] [PubMed]
- Wu, Z.Q. The whole chloroplast genome of shrub willows (Salix suchowensis). Mitochondrial DNA Part A 2016, 27, 2153–2154. [Google Scholar] [CrossRef] [PubMed]
- Gu, C.H.; Tembrock, L.R.; Ohnson, N.G.; Simmons, M.P.; Wu, Z.Q. The complete plastid genome of Lagerstroemia fauriei and loss of rpl2 Intron from Lagerstroemia (Lythraceae). PLoS ONE 2016, 11, e0150752. [Google Scholar] [CrossRef] [PubMed]
- Li, P.; Zhang, S.; Li, F.; Zhang, S.; Zhang, H.; Wang, X.; Sun, R.; Bonnema, G.; Borm, T.J. A phylogenetic analysis of chloroplast genomes elucidates the relationships of the six economically important Brassica species comprising the triangle of U. Front. Plant Sci. 2017, 8, 111. [Google Scholar] [CrossRef] [PubMed]
- Niu, Z.; Xue, Q.; Zhu, S.; Sun, J.; Liu, W.; Ding, X. The complete plastome sequences of four Orchid species: Insights into the evolution of the Orchidaceae and the utility of plastomic mutational hotspots. Front. Plant Sci. 2017, 8, 1–11. [Google Scholar] [CrossRef] [PubMed]
- Wang, Y.; Zhan, D.F.; Jia, X.; Mei, W.L.; Dai, H.F.; Chen, X.T.; Peng, S.Q. Complete chloroplast genome sequence of Aquilaria sinensis (Lour) Gilg and evolution analysis within the Malvales order. Front. Plant Sci. 2016, 7, 1–13. [Google Scholar] [CrossRef] [PubMed]
- Yang, Y.; Zhou, T.; Yang, J.; Meng, X.; Zhu, J.; Zhao, G. The complete chloroplast genome of Quercus baronii (Quercus L.). Mitochondrial DNA 2015, 1736, 1–2. [Google Scholar] [CrossRef] [PubMed]
- Chaney, L.; Mangelson, R.; Ramaraj, T.; Jellen, E.N.; Maughan, P.J. The complete chloroplast genome sequences for four Amaranthus species (Amaranthaceae). Appl. Plant Sci. 2016, 4, 404–411. [Google Scholar] [CrossRef] [PubMed]
- Mallo, D.; Posada, D. Multilocus inference of species trees and DNA barcoding. Philos. Trans. R. Soc. Lond. B Biol. Sci. 2016, 371. [Google Scholar] [CrossRef] [PubMed]
- Wu, Z.Q.; Tembrock, L.R.; Ge, S. Are differences in genomic data sets due to true biological variants or errors in genome assembly: An example from two chloroplast genomes. PLoS ONE 2015, 10, 1–14. [Google Scholar] [CrossRef] [PubMed]
- Cauz-Santos, L.A.; Munhoz, C.F.; Rodde, N.; Cauet, S.; Santos, A.A.; Penha, H.A.; Dornelas, M.C.; Varani, A.M.; Oliveira, G.C.; Bergès, H.; et al. The chloroplast genome of Passiflora edulis (Passifloraceae) sssembled from long sequence reads: Structural organization and phylogenomic studies in Malpighiales. Front. Plant Sci. 2017, 8, 1–17. [Google Scholar] [CrossRef] [PubMed]
- Chen, J.; Hao, Z.; Xu, H.; Yang, L.; Liu, G.; Sheng, Y.; Zheng, C.; Zheng, W.; Cheng, T.; Shi, J. The complete chloroplast genome sequence of the relict woody plant Metasequoia glyptostroboides Hu et Cheng. Front. Plant Sci. 2015, 6, 1–11. [Google Scholar] [CrossRef] [PubMed]
- Nie, X.; Lv, S.; Zhang, Y.; Du, X.; Wang, L.; Biradar, S.S.; Tan, X.; Wan, F.; Weining, S. Complete chloroplast genome sequence of a major invasive species, crofton weed (Ageratina adenophora). PLoS ONE 2012, 7, e36869. [Google Scholar] [CrossRef] [PubMed]
- Ikemura, T. Correlation between the abundance of Escherichia coli transfer RNAs and the occurrence of the respective codons in its protein genes: A proposal for a synonymous codon choice that is optimal for the E. coli translational system. J. Mol. Biol. 1981, 151, 389–409. [Google Scholar] [CrossRef]
- Plotkin, J.B.; Kudla, G. Synonymous but not the same: The causes and consequences of codon bias. Nat. Rev. Genet. 2011, 12, 32–42. [Google Scholar] [CrossRef] [PubMed]
- Qi, Y.Y.; Xu, W.; Xing, T.; Zhao, M.M.; Li, Y.L.; Xia, G.M.; Wang, M.C. Synonymous codon usage bias in the plastid genome is unrelated to gene structure and shows evolutionary heterogeneity. Evol. Bioinform. 2015, 11, 65–77. [Google Scholar] [CrossRef] [PubMed]
- Raubeson, L.A.; Peery, R.; Chumley, T.W.; Dziubek, C.; Fourcade, H.M.; Boore, J.L.; Jansen, R.K. Comparative chloroplast genomics: Analyses including new sequences from the angiosperms Nuphar advena and Ranunculus macranthus. BMC Genom. 2007, 8, 174. [Google Scholar] [CrossRef] [PubMed]
- Qian, J.; Song, J.; Gao, H.; Zhu, Y.; Xu, J.; Pang, X.; Yao, H.; Sun, C.; Li, X.; Li, C.; et al. The complete chloroplast genome sequence of the medicinal plant Salvia miltiorrhiza. PLoS ONE 2013, 8, e57607. [Google Scholar] [CrossRef] [PubMed]
- Redwan, R.M.; Saidin, A.; Kumar, S.V. Complete chloroplast genome sequence of MD-2 pineapple and its comparative analysis among nine other plants from the subclass Commelinidae. BMC Plant Biol. 2015, 15, 294. [Google Scholar] [CrossRef] [PubMed]
- Kasiborski, B.A.; Bennett, M.S.; Linton, E.W. The chloroplast genome of Phacus orbicularis (Euglenophyceae): An initial datum point for the phacaceae. J. Phycol. 2016, 52, 404–411. [Google Scholar] [CrossRef] [PubMed]
- Kim, K.J.; Lee, H.L. Complete chloroplast genome sequences from Korean ginseng (Panax ginseng Nees) and comparative analysis of sequence evolution among 17 vascular plants. DNA Res. 2004, 11, 247–261. [Google Scholar] [CrossRef] [PubMed]
- Lu, R.S.; Li, P.; Qiu, Y.X. The complete chloroplast genomes of three Cardiocrinum (Liliaceae) species: Comparative genomic and phylogenetic analyses. Front. Plant Sci. 2017, 7, 1–12. [Google Scholar] [CrossRef] [PubMed]
- Ivanova, Z.; Sablok, G.; Daskalova, E.; Zahmanova, G.; Apostolova, E.; Yahubyan, G.; Baev, V. Chloroplast genome analysis of resurrection tertiary relict Haberlea rhodopensis highlights genes important for desiccation stress response. Front. Plant Sci. 2017, 8, 1–15. [Google Scholar] [CrossRef] [PubMed]
- Rubinsztein, D.C.; Amos, W.; Leggo, J.; Goodburn, S.; Jain, S.; Li, S.H.; Margolis, R.L.; Ross, C.A.; Ferguson-Smith, M.A. Microsatellite evolution—Evidence for directionality and variation in rate between species. Nat. Genet. 1995, 10, 337–343. [Google Scholar] [CrossRef] [PubMed]
- Gemayel, R.; Cho, J.; Boeynaems, S.; Verstrepen, K.J. Beyond junk-variable tandem repeats as facilitators of rapid evolution of regulatory and coding sequences. Genes 2012, 3, 461–480. [Google Scholar] [CrossRef] [PubMed]
- Voronova, A.; Belevich, V.; Jansons, A.; Rungis, D. Stress-induced transcriptional activation of retrotransposon-like sequences in the Scots pine (Pinus sylvestris L.) genome. Tree Genet. Genomes 2014, 10, 937–951. [Google Scholar] [CrossRef]
- Zhang, Y.; Du, L.; Liu, A.; Chen, J.; Wu, L.; Hu, W.; Zhang, W.; Lee, S.C.; Yang, T.J.; Wang, Y. The complete chloroplast genome sequences of five Epimedium species: Lights into phylogenetic and taxonomic analyses. Front. Plant Sci. 2016, 7, 306. [Google Scholar] [CrossRef] [PubMed]
- Zhuang, Y.; Tripp, E.A. The draft genome of Ruellia speciosa (Beautiful Wild Petunia: Acanthaceae). DNA Res. 2017, 24, 179–192. [Google Scholar] [PubMed]
- Gu, C.H.; Tembrock, L.R.; Zheng, S.Y.; Wu, Z.Q. The complete chloroplast genome of Catha edulis: A comparative analysis of genome features with related species. Int. J. Mol. Sci. 2018, 19, 525. [Google Scholar] [CrossRef] [PubMed]
- Doyle, J.J.; Doyle, J. A rapid DNA isolation procedure for small quantities of fresh leaf tissue. Phytochem. Bull. 1987, 19, 11–15. [Google Scholar]
- Bolger, A.M.; Lohse, M.; Usadel, B. Trimmomatic: A flexible trimmer for Illumina sequence data. Bioinformatics 2014, 30, 2114–2120. [Google Scholar] [CrossRef] [PubMed]
- Wyman, S.K.; Jansen, R.K.; Boore, J.L. Automatic annotation of organellar genomes with DOGMA. Bioinformatics 2004, 20, 3252–3255. [Google Scholar] [CrossRef] [PubMed]
- Schattner, P.; Brooks, A.N.; Lowe, T.M. The tRNAscan-SE, snoscan and snoGPS web servers for the detection of tRNAs and snoRNAs. Nucleic Acids Res. 2005, 33, 686–689. [Google Scholar] [CrossRef] [PubMed]
- Lohse, M.; Drechsel, O.; Bock, R. OrganellarGenomeDRAW (OGDRAW): A tool for the easy generation of high-quality custom graphical maps of plastid and mitochondrial genomes. Curr. Genet. 2007, 52, 267–274. [Google Scholar] [CrossRef] [PubMed]
- Tamura, K.; Stecher, G.; Peterson, D.; Filipski, A.; Kumar, S. MEGA6: Molecular evolutionary genetics analysis version 6.0. Mol. Biol. Evol. 2013, 33, 649–653. [Google Scholar] [CrossRef] [PubMed]
- Frazer, K.A.; Pachter, L.; Poliakov, A.; Rubin, E.M.; Dubchak, I. VISTA: Computational tools for comparative genomics. Nucleic Acids Res. 2004, 32, 273–279. [Google Scholar] [CrossRef] [PubMed]
- Rozas, J.; Sánchez-DelBarrio, J.C.; Messeguer, X.; Rozas, R. DnaSP, DNA polymorphism analyses by the coalescent and other methods. Bioinformatics 2003, 19, 2496–2497. [Google Scholar] [CrossRef] [PubMed]
- Kurtz, S.; Choudhuri, J.V.; Ohlebusch, E.; Schleiermacher, C.; Stoye, J.; Giegerich, R. REPuter: The manifold applications of repeat analysis on a genomic scale. Nucleic Acids Res. 2001, 29, 4633–4642. [Google Scholar] [CrossRef] [PubMed]
- Li, Q.; Wan, J.M. SSRHunter: Development of a local searching software for SSR sites. Yi Chuan 2005, 27, 808–810. [Google Scholar] [PubMed]
- Simmons, M.P.; Cappa, J.J.; Archer, R.H.; Ford, A.J.; Eichstedt, D.; Clevinger, C.C. Phylogeny of the Celastreae (Celastraceae) and the relationships of Catha edulis (qat) inferred from morphological characters and nuclear and plastid genes. Mol. Phylogenet. Evol. 2008, 48, 745–757. [Google Scholar] [CrossRef] [PubMed]
- Guindon, S.; Dufayard, J.F.; Lefort, V.; Anisimova, M. New algorithms and methods to estimate maximum-likelihoods phylogenies: Assessing the performance of PhyML 3.0. Syst. Biol. 2010, 59, 307–321. [Google Scholar] [CrossRef] [PubMed]
- Ronquist, F.; Teslenko, M.; Van Der Mark, P.; Ayres, D.L.; Darling, A.; Höhna, S.; Larget, B.; Liu, L.; Suchard, M.A.; Huelsenbeck, J.P. Mrbayes 3.2: Efficient bayesian phylogenetic inference and model choice across a large model space. Syst. Biol. 2012, 61, 539–542. [Google Scholar] [CrossRef] [PubMed]
- Swofford, D.L. Paup*: Phylogenetic analysis using parsimony (and other methods); Version 4.0b10; 2002; pp. 1–142. [Google Scholar]
Sample Availability: Sample of Heimia myrtifolia is available from the authors. |
Figure 1.
Structural map of the Heimia myrtifolia cp (chloroplast) genome. The map is a quadripartite and circular structure which was drawn by OGDRAW. Genes of different functional groups are separated by color. The innermost grey region inside the inner circle refers to percent GC content in this cp genome. Genes shown outside and inside of the outer circle are transcribed counterclockwise and clockwise, respectively (LSC: Large single-copy region; IR: Inverted repeat; SSC: Small single-copy region).

Figure 2.
Codon content of 20 amino acids and stop codon including all 78 protein-coding genes in H. myrtifolia cp genome. The color of codons corresponds to color of the histogram.
Figure 2.
Codon content of 20 amino acids and stop codon including all 78 protein-coding genes in H. myrtifolia cp genome. The color of codons corresponds to color of the histogram.

Figure 3.
Visualization alignments among the 12 Myrtales cp genomes. VISTA-based identity plot showing sequence identity using H. myrtifolia as reference. The y-axis indicates % identity ranging from 50 to 100% to the reference. Protein-coding genes and intergenic regions are marked in purple and pink, respectively.

Figure 4.
The comparison of the LSC, IRs, and SSC junction boundaries among 12 species cp genomes. Boxes above or below the main line indicate the adjacent border genes. Number in bp marked above indicates the gap between the ends of the boundaries and adjacent genes (these features are not to scale). The ψ notation indicates pseudogene.

Figure 5.
Number of long repetitive repeats in 12 Myrtales complete cp genomes. (A) Frequency of repeat types; (B) Frequency of the repeats more than 30 bp long.
Figure 5.
Number of long repetitive repeats in 12 Myrtales complete cp genomes. (A) Frequency of repeat types; (B) Frequency of the repeats more than 30 bp long.

Figure 6.
The comparison of simple sequence repeats (SSRs) distribution in 12 cp genomes. (A) Number of different SSR types detected in 12 chloroplast genomes; (B) Relationship between total SSRs number and the length of 12 cp genomes; (C) Frequency of SSRs in the intergenic regions, protein-coding genes and introns; (D) Frequency of SSRs in the LSC, IR, and SSC regions; (E) Frequency of common motifs in the 12 cp genomes.

Figure 7.
The nucleotide variability (Pi) value in the 12 aligned Myrtales chloroplast genomes. (A) Protein-coding genes (the five genes marked in red are the highest five in all genes). (B) Intergenic regions. These regions are oriented according to their locations in the chloroplast genome (the five regions marked in blue are the highest five in intergenic regions).

Figure 8.
Phylogenetic tree based on 68 shared protein-coding genes was constructed for 29 species using three different methods, including Bayesian inference (BI), Parsimony analysis (MP), and Maximum likelihood (ML). The posterior probability or bootstrap values as 1.0 or 100 were not shown on the nodes of tree, only the values lower than 1.0 or 100 were shown for each method respectively.


Table 1.
Summary of complete chloroplast genomes for Heimia myrtifolia and 11 other species in Myrtales.
Table 1.
Summary of complete chloroplast genomes for Heimia myrtifolia and 11 other species in Myrtales.
| H. myrtifolia | L. intermedia | A. sellowiana | A. ternata | A. costata | C. eximia | E. aromaphloia | E. uniflora | O. argillicola | P. guajava | S. quadrifida | S. cumini | |
|---|---|---|---|---|---|---|---|---|---|---|---|---|
| Accession Number | MG921615 | NC034662 | KX289887 | KC180806 | NC022412 | NC022409 | NC022396 | NC027744 | EU262887 | NC033355 | NC022414 | GQ870669 |
| Family | Lythraceae | Lythraceae | Myrtaceae | Myrtaceae | Myrtaceae | Myrtaceae | Myrtaceae | Myrtaceae | Onagraceae | Myrtaceae | Myrtaceae | Myrtaceae |
| Total length (bp) | 159,219 | 152,330 | 159,370 | 159,593 | 160,326 | 160,012 | 160,149 | 158,445 | 165,055 | 158,841 | 159,561 | 160,373 |
| guanine-cytosine (GC) (%) | 37.0 | 37.6 | 37.0 | 37.0 | 37.0 | 37.0 | 37.0 | 37.0 | 37.0 | 39.1 | 37.0 | 37.0 |
| LSC | ||||||||||||
| Length (bp) | 88,571 | 83,987 | 88,028 | 88,218 | 88,768 | 88,522 | 88,925 | 87,459 | 88,511 | 87,675 | 88,247 | 89,091 |
| GC (%) | 35.0 | 36.0 | 35.0 | 35.0 | 35.0 | 35.0 | 35.0 | 35.0 | 37.0 | 35.0 | 35.0 | 35.0 |
| Length (%) | 55.6 | 55.1 | 55.2 | 55.3 | 55.4 | 55.3 | 55.5 | 55.2 | 53.6 | 55.2 | 55.3 | 55.6 |
| SSC | ||||||||||||
| Length (bp) | 18,822 | 16,871 | 18,598 | 18,571 | 18,772 | 18,672 | 18,468 | 18,138 | 19,000 | 18,464 | 18,544 | 18,508 |
| GC (%) | 30.6 | 30.9 | 31.0 | 31.0 | 30.0 | 31.0 | 31.0 | 31.0 | 35.0 | 31.0 | 31.0 | 31.0 |
| Length (%) | 11.8 | 11.1 | 11.7 | 11.6 | 11.7 | 11.7 | 11.5 | 11.4 | 12.0 | 12.0 | 12.0 | 12.0 |
| IRs | ||||||||||||
| Length (bp) | 25,643 | 25,736 | 26,372 | 26,402 | 26,392 | 26,409 | 26,378 | 26,334 | 28,772 | 26,351 | 26,385 | 26,392 |
| GC (%) | 42.6 | 42.5 | 43.0 | 43.0 | 43.0 | 43.0 | 43.0 | 43.0 | 43.0 | 43.0 | 43.0 | 43.0 |
| Length (%) | 16.1 | 16.9 | 16.5 | 16.5 | 16.5 | 16.5 | 16.5 | 16.6 | 35.0 | 35.0 | 33.0 | 33.0 |
LSC, large single-copy region; SSC, short single-copy region; IRs, inverted repeats.
Table 2.
Distribution of genes and Intergenic regions for Heimia myrtifolia and 11 other species in Myrtales.
Table 2.
Distribution of genes and Intergenic regions for Heimia myrtifolia and 11 other species in Myrtales.
| H. myrtifolia | L. intermedia | A. sellowiana | A. ternata | A. costata | C. eximia | E. aromaphloia | E. uniflora | O. argillicola | P. guajava | S. quadrifida | S.cumini | |
|---|---|---|---|---|---|---|---|---|---|---|---|---|
| Accession Number | MG921615 | NC034662 | KX289887 | KC180806 | NC022412 | NC022409 | NC022396 | NC027744 | EU262887 | NC033355 | NC022414 | GQ870669 |
| Family | Lythraceae | Lythraceae | Myrtaceae | Myrtaceae | Myrtaceae | Myrtaceae | Myrtaceae | Myrtaceae | Onagraceae | Myrtaceae | Myrtaceae | Myrtaceae |
| Protein Coding Genes | ||||||||||||
| Length (bp) | 81,047 | 78,749 | 78,576 | 78,693 | 68,257 | 68,889 | 68,085 | 78,777 | 70,706 | 78,410 | 68,746 | 68,448 |
| GC (%) | 37.0 | 43.0 | 38.0 | 38.0 | 43.0 | 43.0 | 43.0 | 38.0 | 43.0 | 38.0 | 43.0 | 43.0 |
| Length (%) | 51.0 | 52.0 | 49.0 | 49.0 | 43.0 | 43.0 | 43.0 | 50.0 | 43.0 | 49.0 | 43.0 | 43.0 |
| rRNA | ||||||||||||
| Length (bp) | 9050 | 9050 | 9060 | 9056 | 9020 | 9056 | 9056 | 9050 | 9102 | 9056 | 9056 | 9050 |
| GC (%) | 55.0 | 55.0 | 55.0 | 55.0 | 55.0 | 55.0 | 55.0 | 55.0 | 55.0 | 55.0 | 55.0 | 55.0 |
| Length (%) | 3.0 | 3.0 | 3.0 | 3.0 | 3.0 | 3.0 | 3.0 | 3.0 | 3.0 | 3.0 | 3.0 | 3.0 |
| tRNA | ||||||||||||
| Length (bp) | 2817 | 2813 | 2779 | 2716 | 2184 | 2199 | 2270 | 2792 | 2303 | 2790 | 2387 | 2310 |
| GC (%) | 53.0 | 53.0 | 52.0 | 52.0 | 49.0 | 53.0 | 53.0 | 52.0 | 53.0 | 52.0 | 52.0 | 53.0 |
| Length (%) | 2.0 | 2.0 | 2.0 | 2.0 | 1.0 | 1.0 | 1.0 | 2.0 | 1.0 | 2.0 | 1.0 | 1.0 |
| Intergenic Regions | ||||||||||||
| Length (bp) | 50,172 | 46,156 | 51,541 | 51,503 | 65,351 | 64,369 | 65,018 | 49,679 | 69,633 | 50,496 | 63,907 | 65,069 |
| GC (%) | 32.0 | 33.0 | 35.0 | 35.0 | 35.0 | 35.0 | 35.0 | 35.0 | 37.0 | 35.0 | 35.0 | 35.0 |
| Length (%) | 32.0 | 30.0 | 32.0 | 32.0 | 41.0 | 40.0 | 41.0 | 31.0 | 42.0 | 32.0 | 40.0 | 41.0 |
| Intron | ||||||||||||
| Length (bp) | 16,133 | 15,562 | 17,414 | 17,625 | 15,514 | 15,499 | 14,720 | 18,147 | 13,311 | 18,089 | 15,465 | 15,496 |
| GC (%) | 38.0 | 37.0 | 37.0 | 37.0 | 35.0 | 36.0 | 36.0 | 37.0 | 38.0 | 38.0 | 36.0 | 36.0 |
| Length (%) | 10.0 | 10.0 | 11.0 | 11.0 | 10.0 | 10.0 | 9.0 | 11.0 | 8.0 | 11.0 | 10.0 | 10.0 |
Table 3.
Genes in the sequenced Heimia myrtifolia chloroplast genome.
| Category of Genes | Function of Genes | Name of Genes |
|---|---|---|
| Subunits of ATP synthase | Genes for photosynthesis | atpA atpB atpE atpFA atpH atpI |
| Subunit of acetyl-CoA-carboxylase | Other genes | accD |
| c-type cytochrome synthesis gene | Other genes | ccsA |
| Envelop membrane protein | Other genes | cemA |
| ATP-dependent protease subunit p gene | Other genes | clpPA |
| Maturase | Other genes | matK |
| Subunits of NADH dehydrogenase | Genes for photosynthesis | ndhAA ndhBA,B ndhC ndhD ndhE ndhF ndhG ndhH ndhI ndhJ ndhK |
| Subunits of photosystem I | Genes for photosynthesis | psaA psaB psaC psaI psaJ |
| Subunits of photosystem II | Genes for photosynthesis | psbA psbB psbC psbD psbE psbF psbH psbI psbJ psbK psbL psbM psbN psbT psbZ |
| Subunits of cytochrome | Genes for photosynthesis | petA petBA petDA petG petL petN |
| Large subunit of Rubisco | Genes for photosynthesis | rbcL |
| Large subunit of ribosome | Self-replication | rpl2B rpl14 rpl16A rpl20 rpl22 rpl23B rpl32 rpl33 rpl36 |
| DNA dependent RNA polymerase | Self-replication | rpoA rpoB rpoC1A rpoC2 |
| Ribosomal RNA genes | Self-replication | rrn16B rrn23B rrn4.5B rrn5B |
| Small subunit of ribosome | Self-replication | rps2 rps3 rps4 rps7B rps8 rps11 rps12A,B rps14 rps15 rps16A rps18 rps19 |
| Transfer RNA genes | Self-replication | trnA-UGCA,B trnC-GCA trnD-GUC trnE-UUC trnF-GAA trnfM-CAU trnG-UCC trnG-GCC trnH-GUG trnI-CAUB trnI-GAUA,B trnK-UUUA trnL-CAAB trnL-UAAA trnL-UAG trnM-CAU trnN-GUUB trnP-UGG trnQ-UUG trnR-ACGB trnR-UCU trnS-GCU trnS-GGA trnS-UGA trnT-GGU trnT-UGU trnV-GACB trnV-UACA trnW-CCA trnY-GUA |
| Conserved open reading frames | Genes of unknown function | ycf1 ycf2B ycf3A ycf4 |
A: Genes containing introns; B: Duplicated gene (Genes appear in the IR regions).
Table 4.
The genes having intron in the Heimia myrtifolia chloroplast genome and the length of the exons and introns.
Table 4.
The genes having intron in the Heimia myrtifolia chloroplast genome and the length of the exons and introns.
| Gene | Location | ExonI (bp) | IntronI (bp) | ExonII (bp) | IntronII (bp) | ExonIII (bp) |
|---|---|---|---|---|---|---|
| rps16 | LSC | 224 | 861 | 40 | ||
| rpoC1 | LSC | 453 | 743 | 1608 | ||
| atpF | LSC | 145 | 767 | 410 | ||
| petB | LSC | 6 | 780 | 642 | ||
| petD | LSC | 8 | 749 | 475 | ||
| ndhB | IR | 756 | 685 | 777 | ||
| ndhA | SSC | 540 | 1039 | 552 | ||
| rpl16 | LSC | 399 | 976 | 9 | ||
| rps12* | LSC | 114 | 27 | 548 | 231 | |
| ycf3 | LSC | 153 | 796 | 230 | 756 | 124 |
| clpP | LSC | 228 | 585 | 292 | 836 | 71 |
| trnK-UUU | LSC | 35 | 2500 | 37 | ||
| trnL-UAA | LSC | 37 | 532 | 50 | ||
| trnV-UAC | LSC | 37 | 599 | 38 | ||
| trnI-GAU | IR | 35 | 945 | 42 | ||
| trnA-UGC | IR | 35 | 805 | 38 | ||
| trnG-UCC | LSC | 23 | 727 | 52 |
rps12 gene is trans-spliced gene with the two duplicated 3’ end exons in IR regions and 5’ end exon in the LSC region.
Table 5.
Base composition in the Heimia myrtifolia chloroplast genome.
| T | C | A | G | Length (bp) | |
|---|---|---|---|---|---|
| Genome | 31.9 | 18.8 | 31.1 | 18.2 | 159,219 |
| LSC | 33.2 | 17.9 | 31.8 | 17.1 | 88,571 |
| SSC | 34.6 | 16.2 | 34.9 | 14.4 | 18,822 |
| IR | 28.6 | 20.4 | 28.8 | 22.2 | 25,913 |
| tRNA | 22.8 | 26.8 | 23.9 | 26.6 | 2817 |
| rRNA | 19.9 | 25.1 | 24.9 | 30.1 | 9050 |
| Protein-coding genes | 32.1 | 19.4 | 30.2 | 18.4 | 81,047 |
| 1st position | 31.5 | 18.7 | 34.6 | 17.6 | 27,010 |
| 2nd position | 31.2 | 18.7 | 30.7 | 19.4 | 27,010 |
| 3rd position | 33.5 | 23 | 25.2 | 18.2 | 27,010 |
© 2018 by the authors. Licensee MDPI, Basel, Switzerland. This article is an open access article distributed under the terms and conditions of the Creative Commons Attribution (CC BY) license (http://creativecommons.org/licenses/by/4.0/).
Share and Cite
MDPI and ACS Style
Gu, C.; Dong, B.; Xu, L.; Tembrock, L.R.; Zheng, S.; Wu, Z. The Complete Chloroplast Genome of Heimia myrtifolia and Comparative Analysis within Myrtales. Molecules 2018, 23, 846. https://0-doi-org.brum.beds.ac.uk/10.3390/molecules23040846
AMA Style
Gu C, Dong B, Xu L, Tembrock LR, Zheng S, Wu Z. The Complete Chloroplast Genome of Heimia myrtifolia and Comparative Analysis within Myrtales. Molecules. 2018; 23(4):846. https://0-doi-org.brum.beds.ac.uk/10.3390/molecules23040846
Chicago/Turabian StyleGu, Cuihua, Bin Dong, Liang Xu, Luke R. Tembrock, Shaoyu Zheng, and Zhiqiang Wu. 2018. "The Complete Chloroplast Genome of Heimia myrtifolia and Comparative Analysis within Myrtales" Molecules 23, no. 4: 846. https://0-doi-org.brum.beds.ac.uk/10.3390/molecules23040846