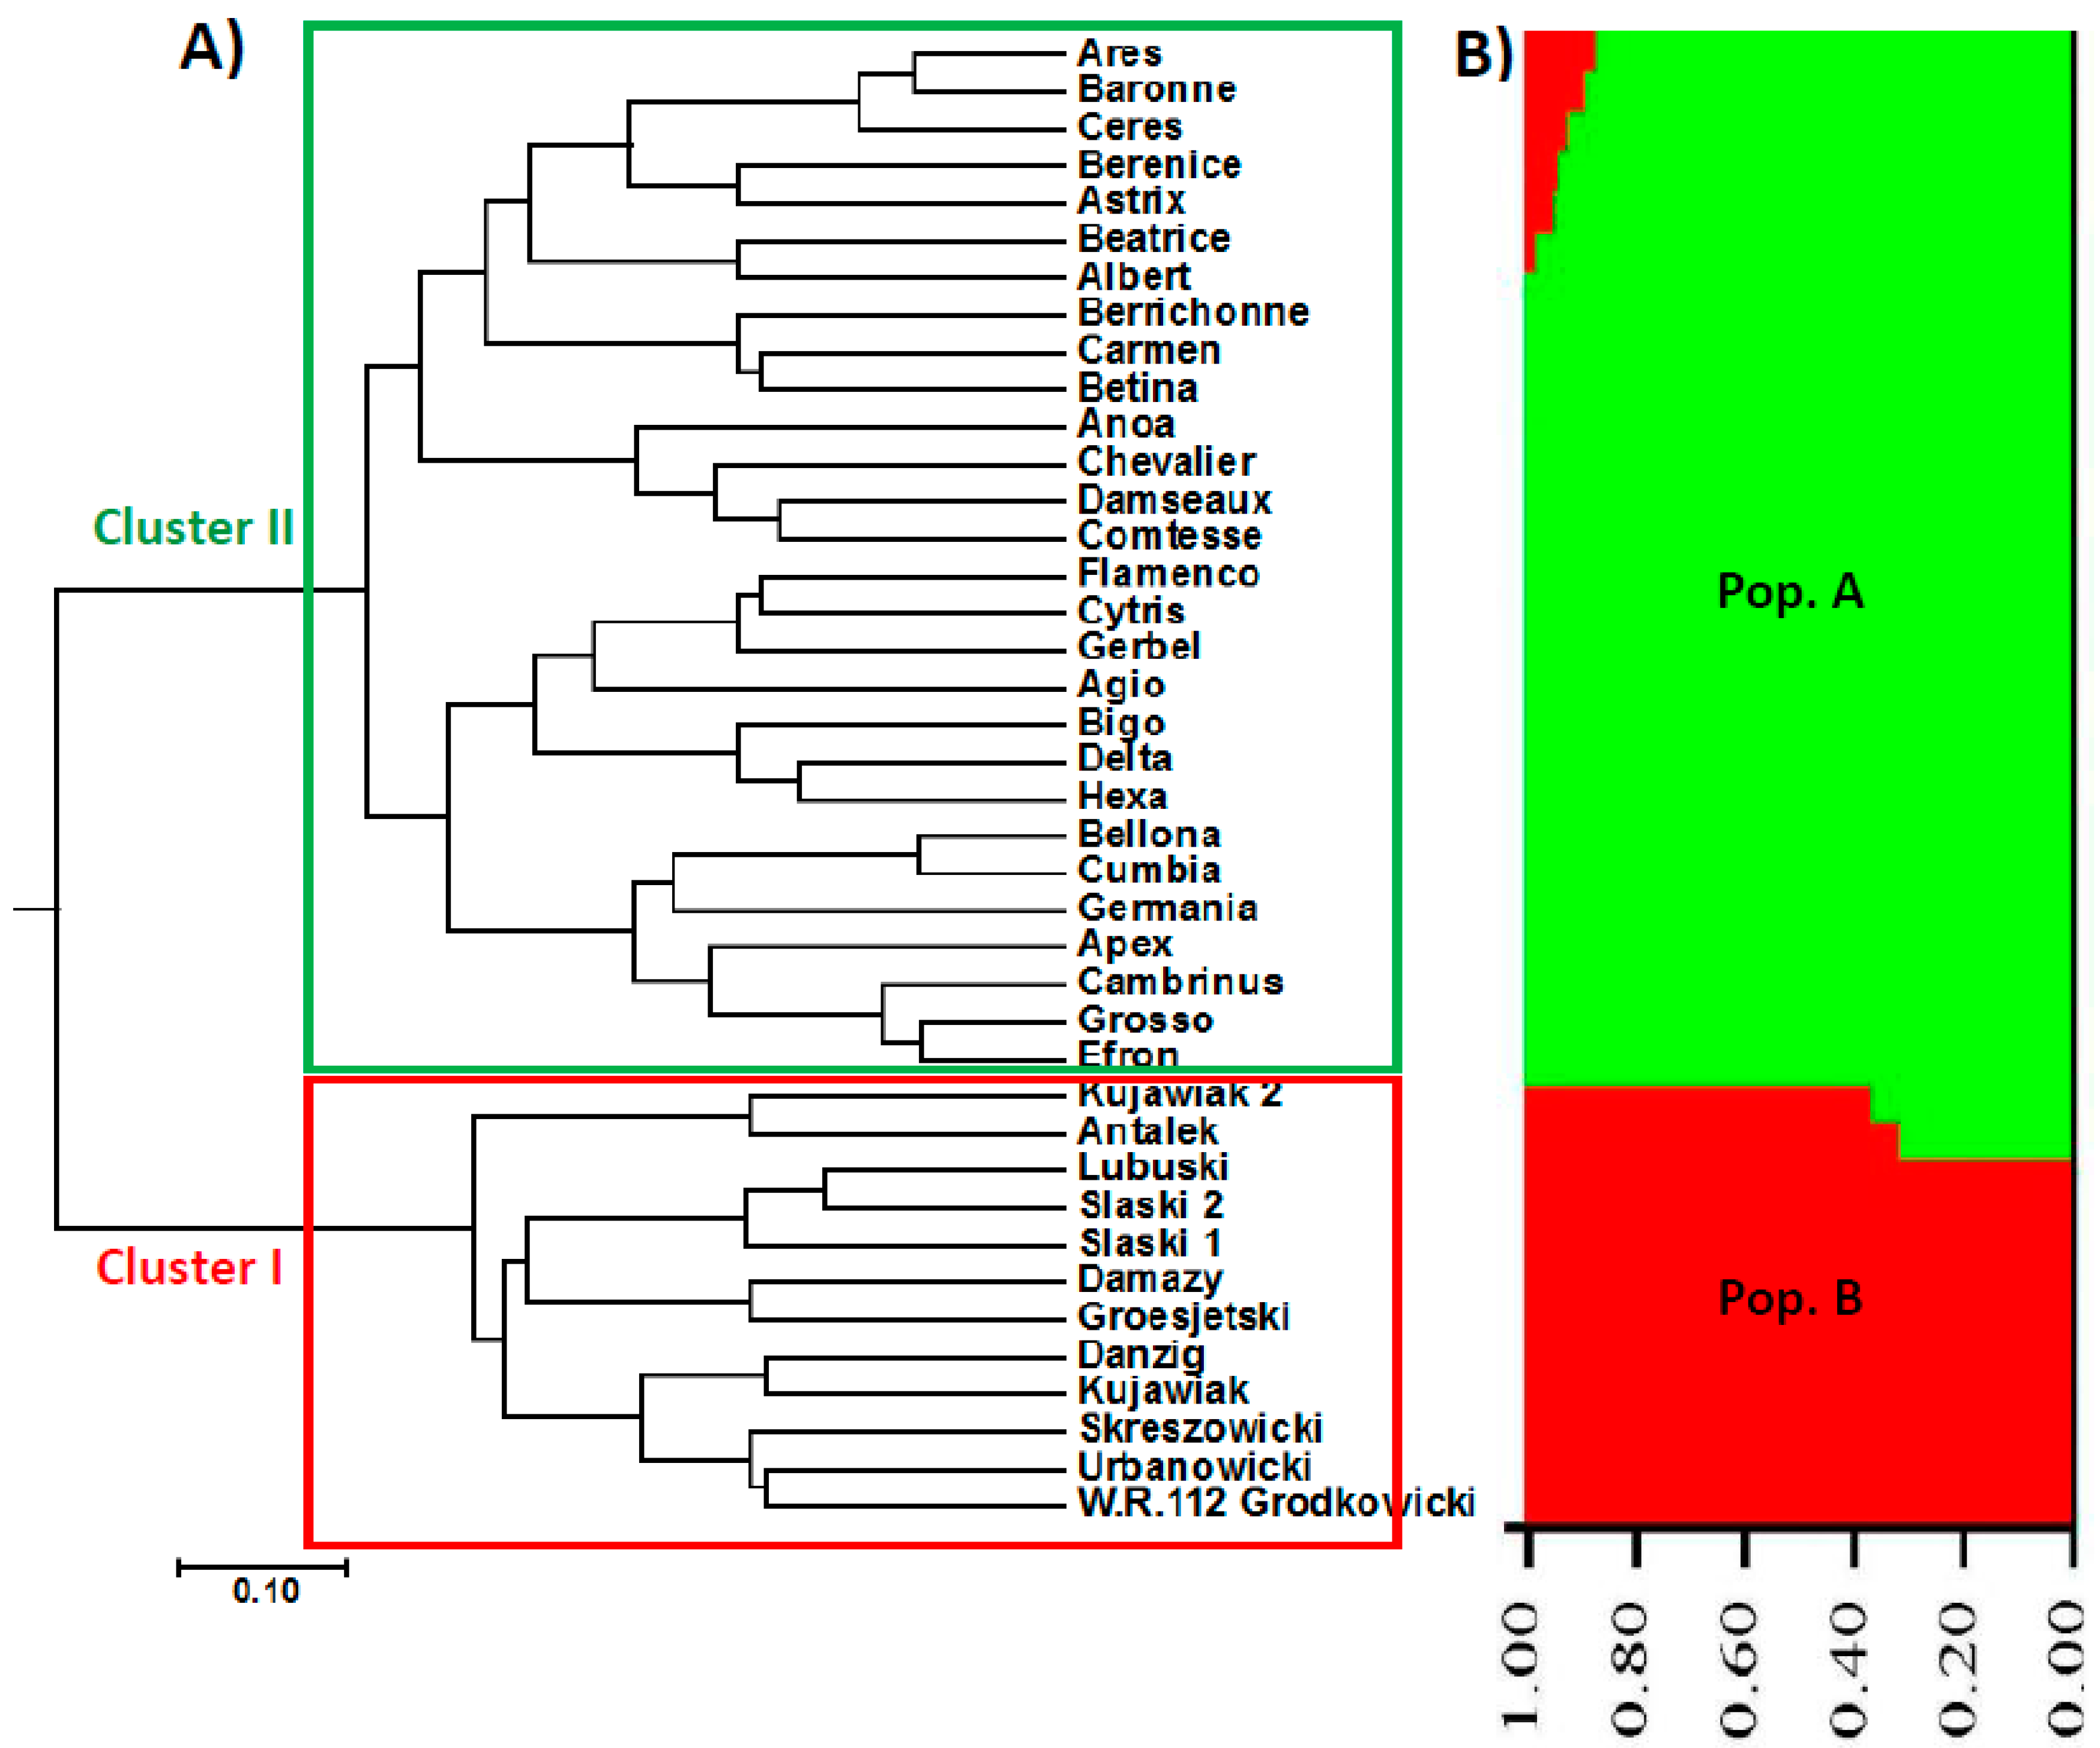
Figure 1.
UPGMA phylogenetic tree and population structure (at K = 2) of the 40 barley accessions based on AFLP data; (A) Cluster I included the Eastern European genotypes (Poland), while Cluster II represents the Western European genotypes (France and the Netherlands). (B) Structure analysis showing that the 40 barely accessions are assigned to two populations (Pop. A represented in green comprised the Western European genotypes, while Pop. B represented in red included the Eastern European genotypes).
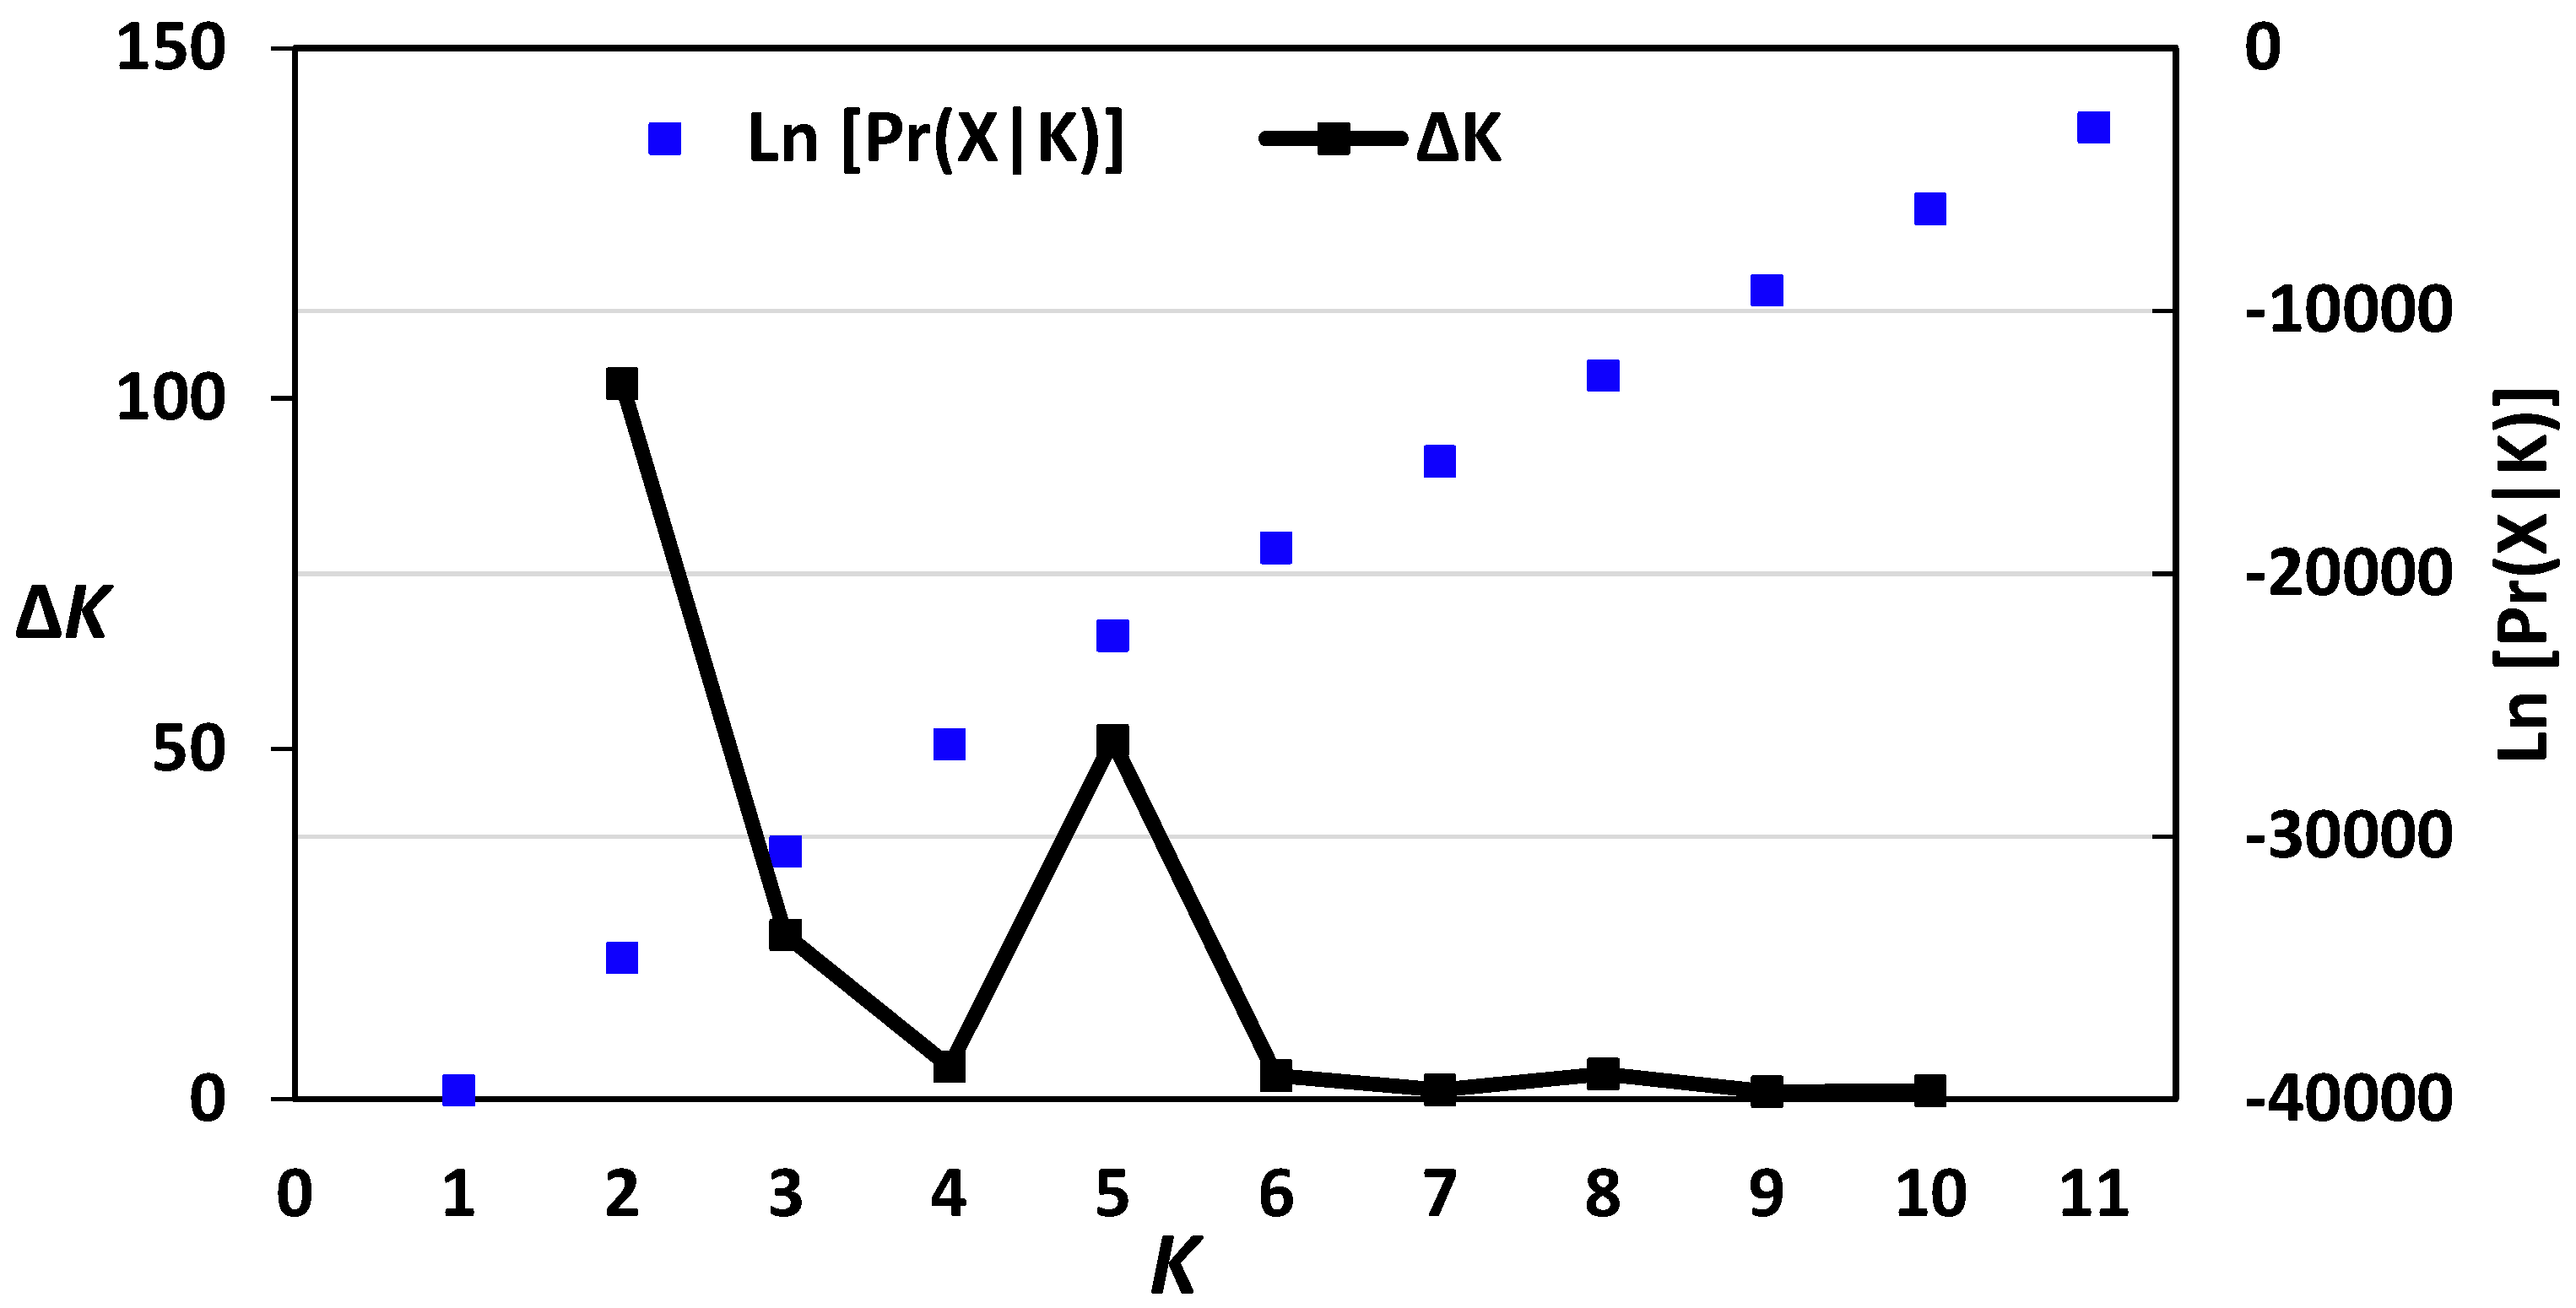
Figure 2.
Log-likelihood and ΔK values of structure analysis of the 40 barley accessions based on AFLP data. K = 2 had the highest ΔK value, indicating that the 40 barely accessions could be assigned to two populations.
Figure 2.
Log-likelihood and ΔK values of structure analysis of the 40 barley accessions based on AFLP data. K = 2 had the highest ΔK value, indicating that the 40 barely accessions could be assigned to two populations.
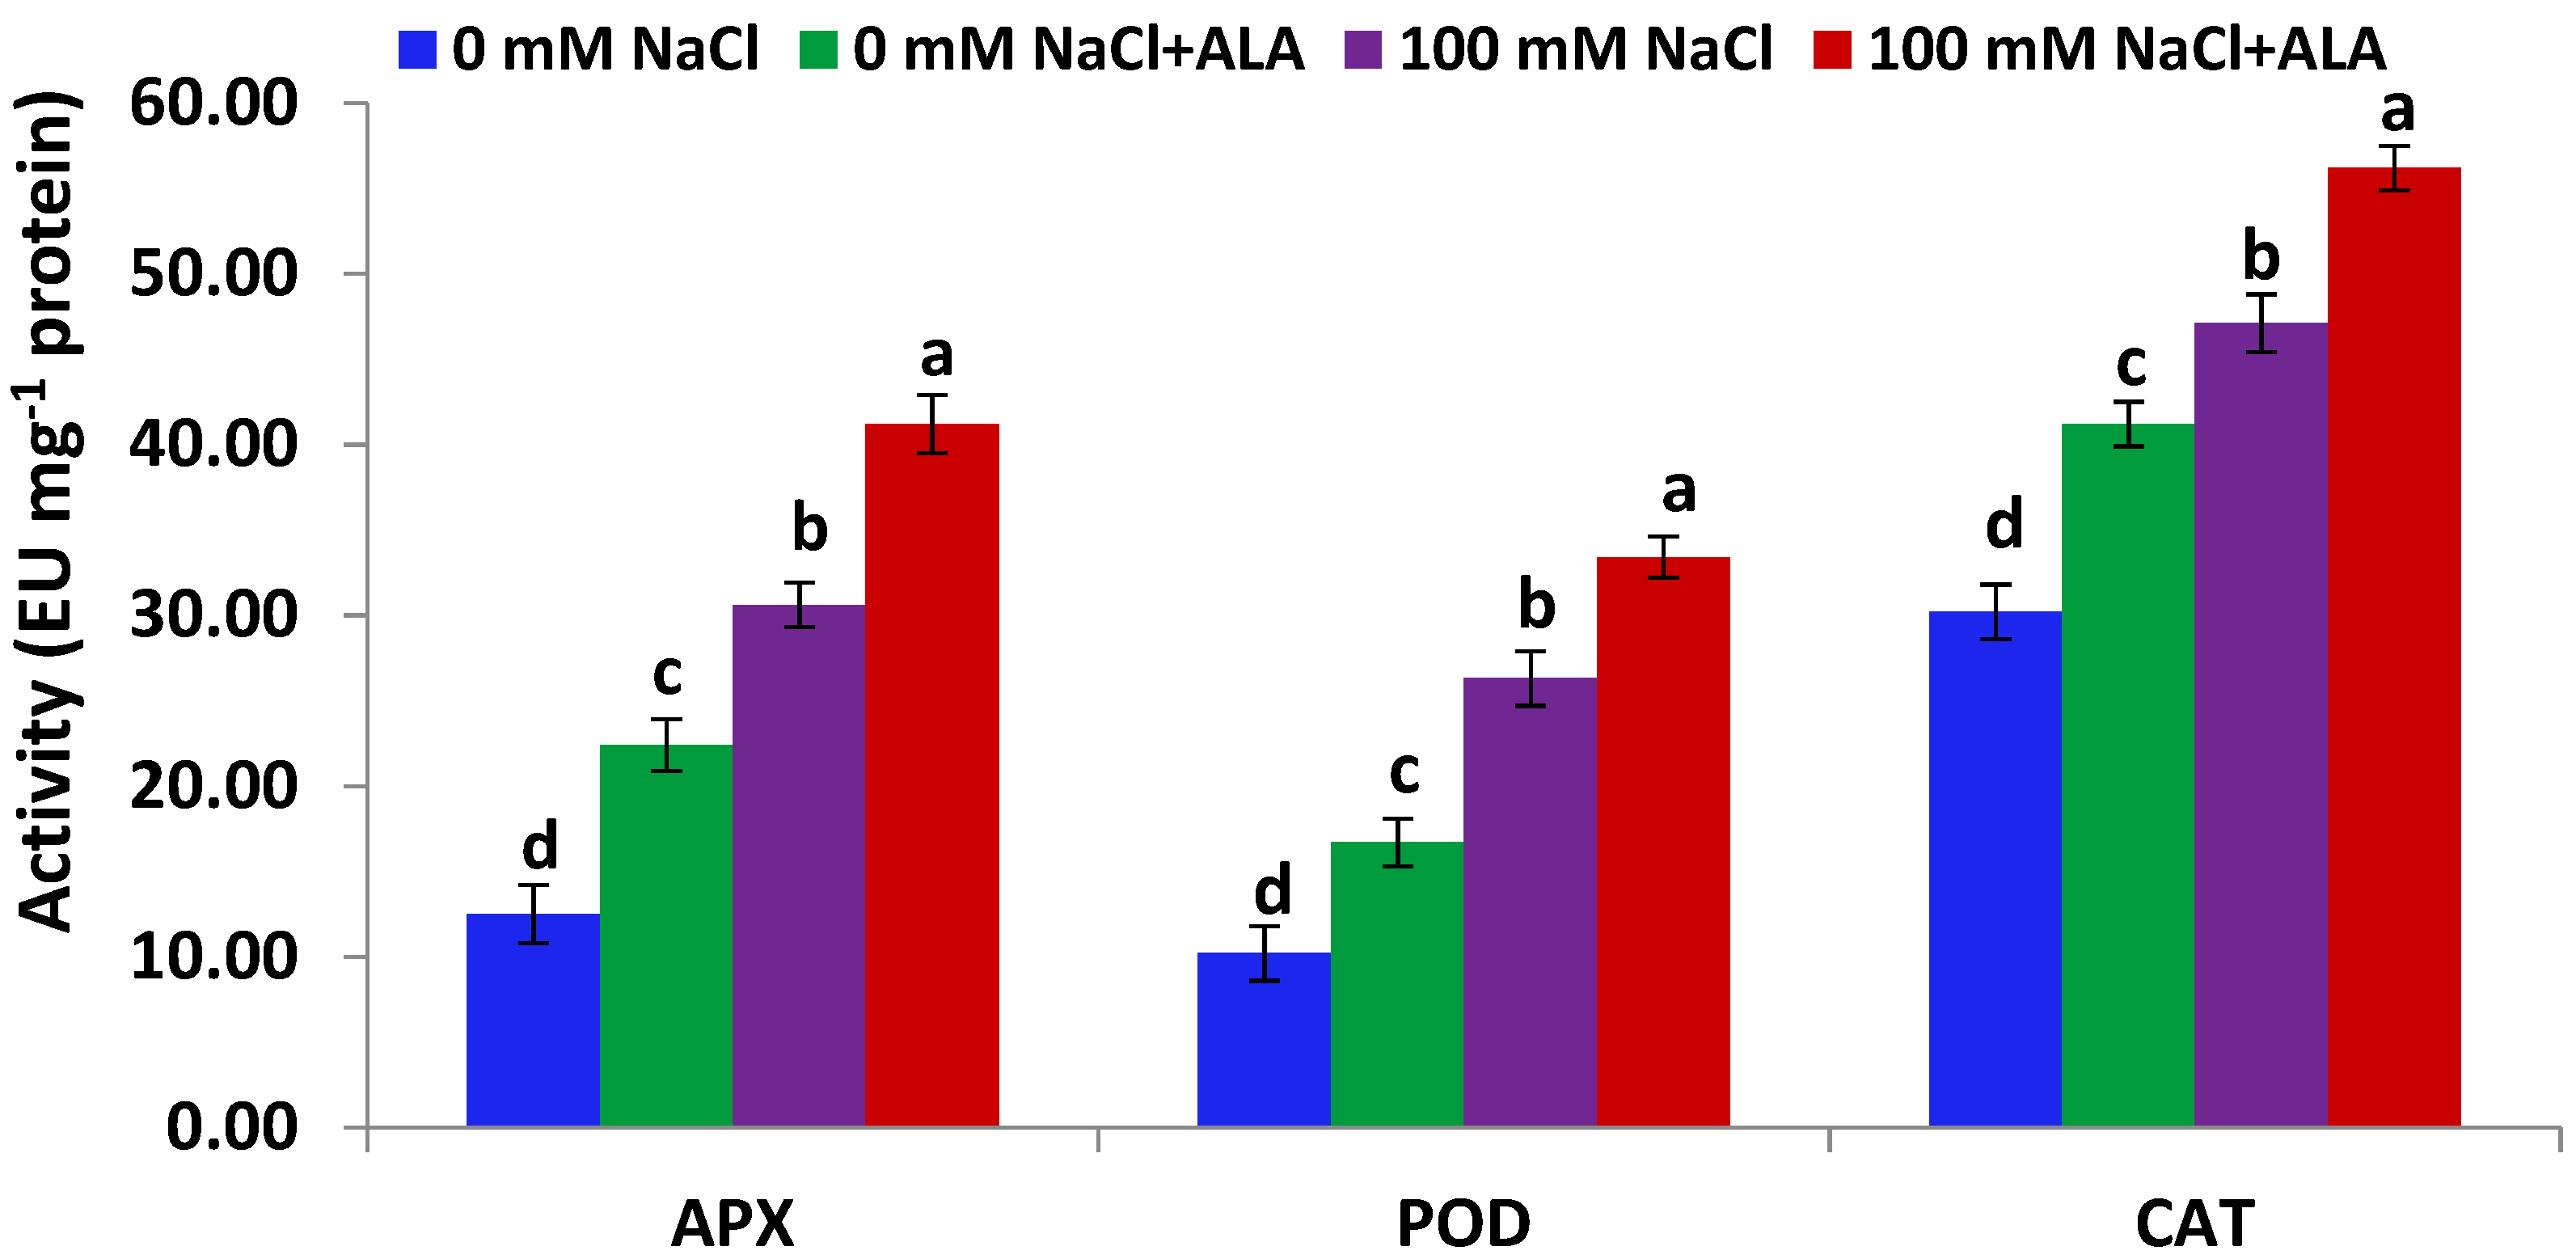
Figure 3.
APX, POD and CAT activities in Slaski 2 cultivar leaves under salt and/or ALA (7 ppm) effects. Values represent means ± SE (n = 4). Different letters show significant difference among treatments (p ≤ 0.05).
Figure 3.
APX, POD and CAT activities in Slaski 2 cultivar leaves under salt and/or ALA (7 ppm) effects. Values represent means ± SE (n = 4). Different letters show significant difference among treatments (p ≤ 0.05).
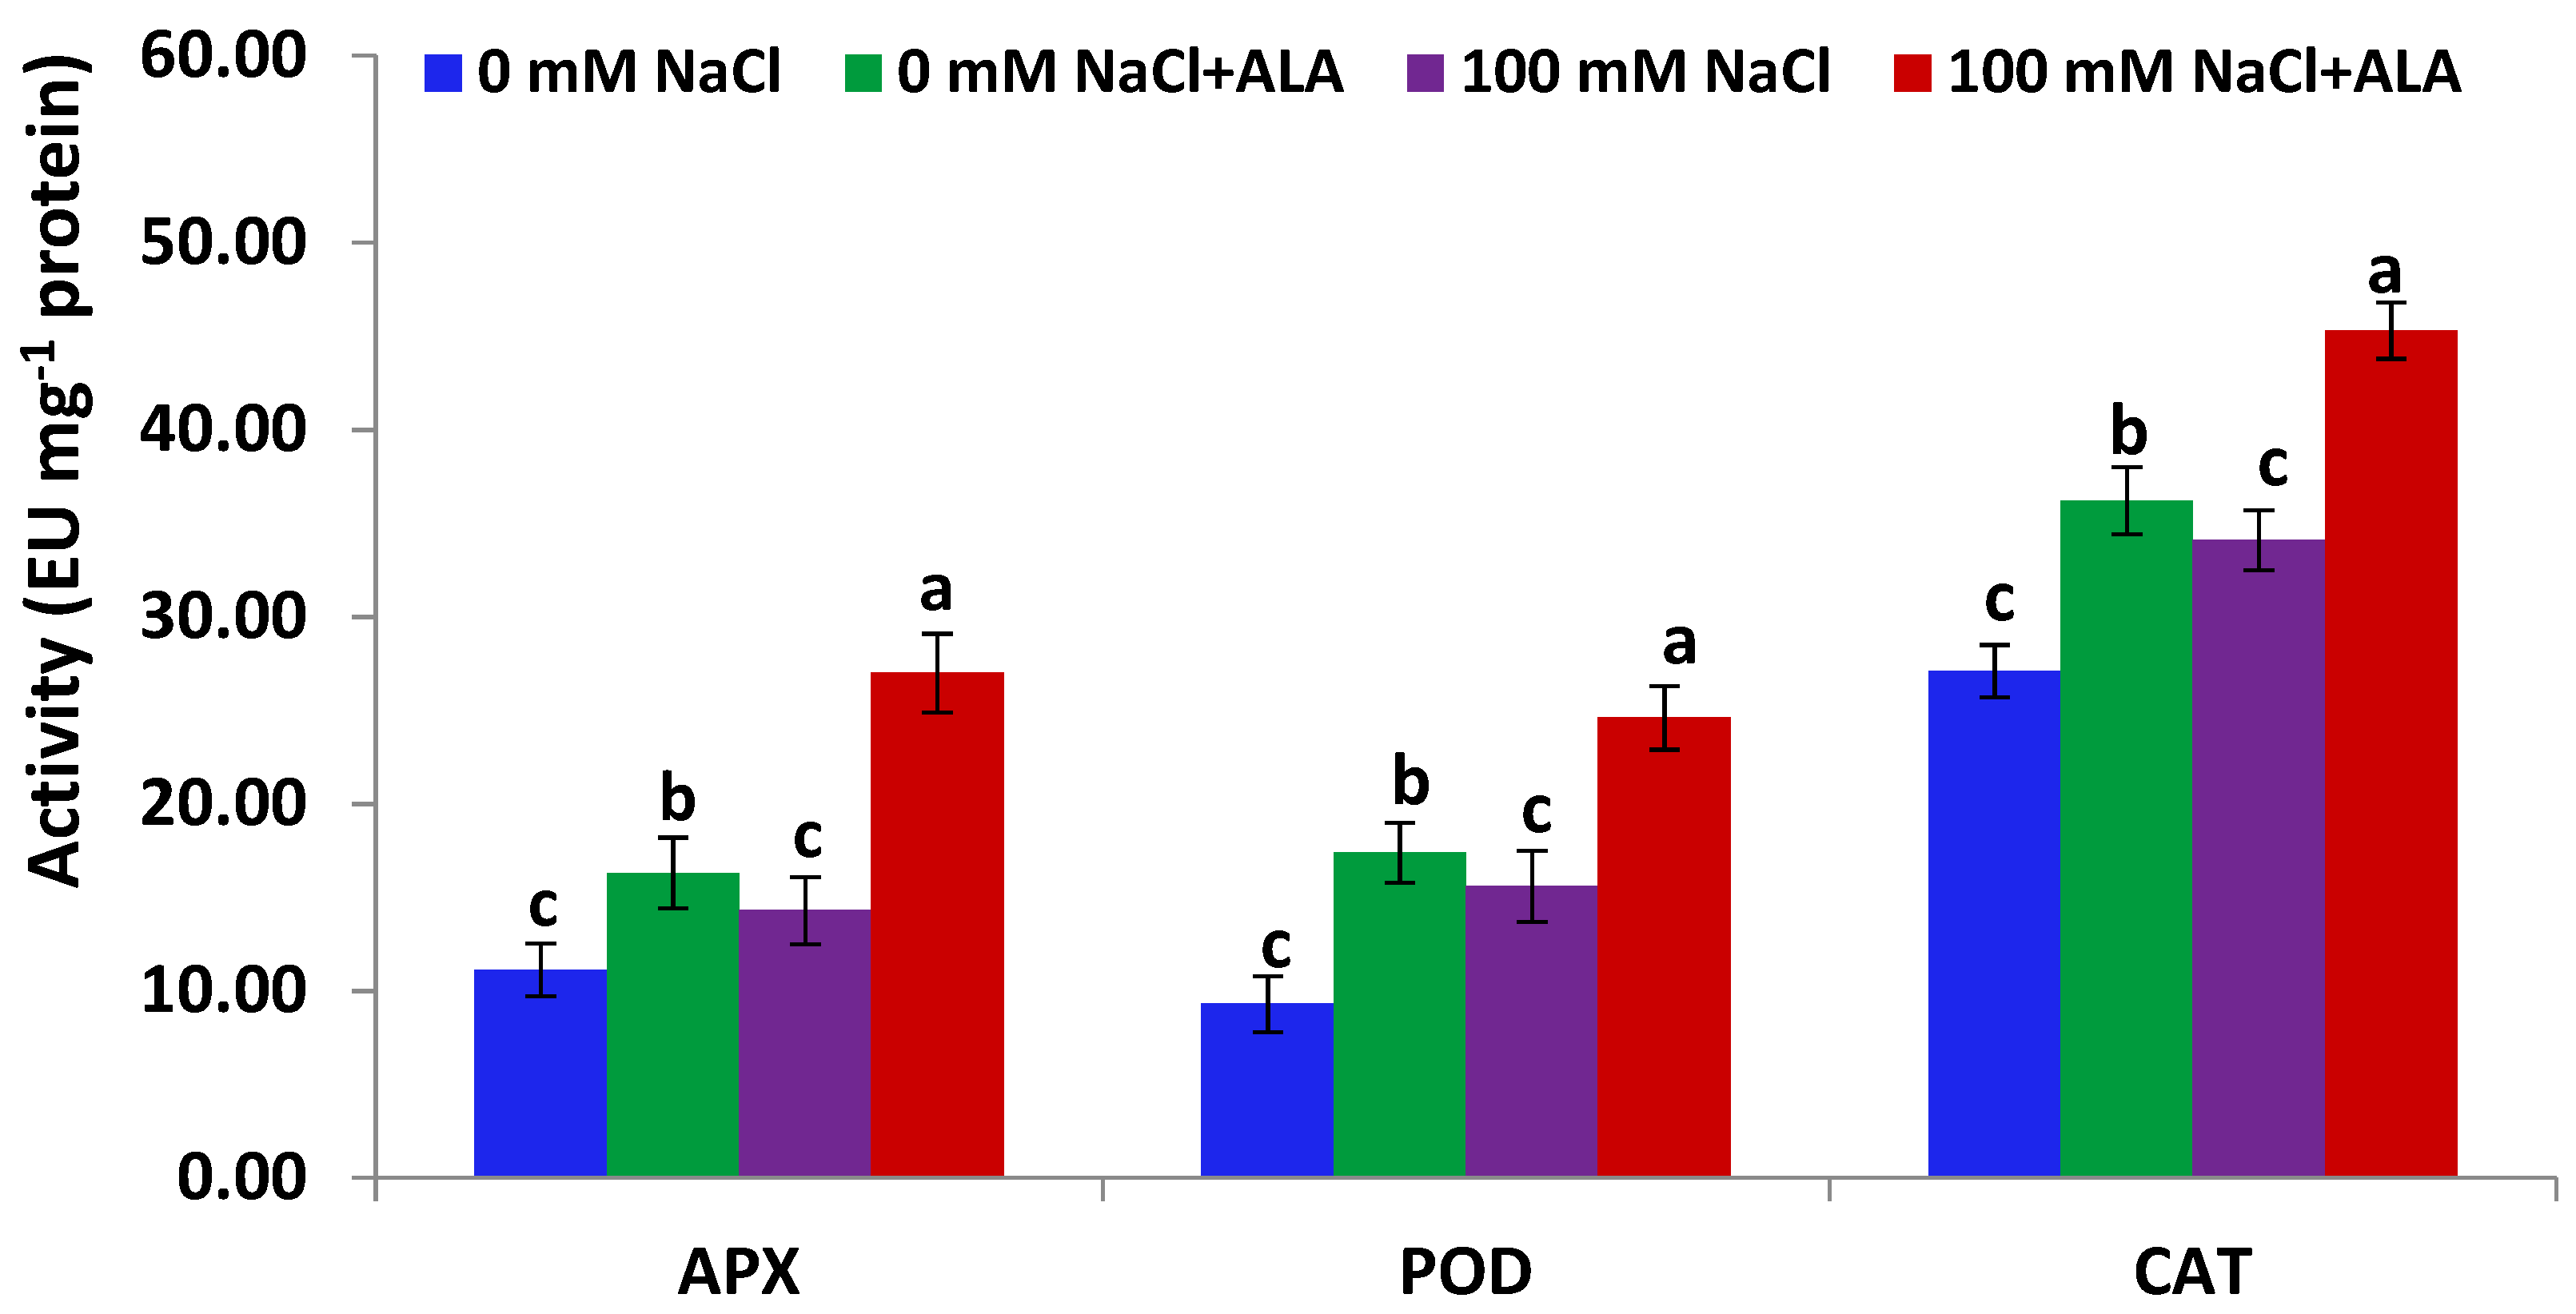
Figure 4.
APX, POD and CAT activities in Carmen cultivar leaves under salt and/or ALA (7 ppm) effects. Values represent means ± SE (n = 4). Different letters show significant difference among treatments (p ≤ 0.05).
Figure 4.
APX, POD and CAT activities in Carmen cultivar leaves under salt and/or ALA (7 ppm) effects. Values represent means ± SE (n = 4). Different letters show significant difference among treatments (p ≤ 0.05).
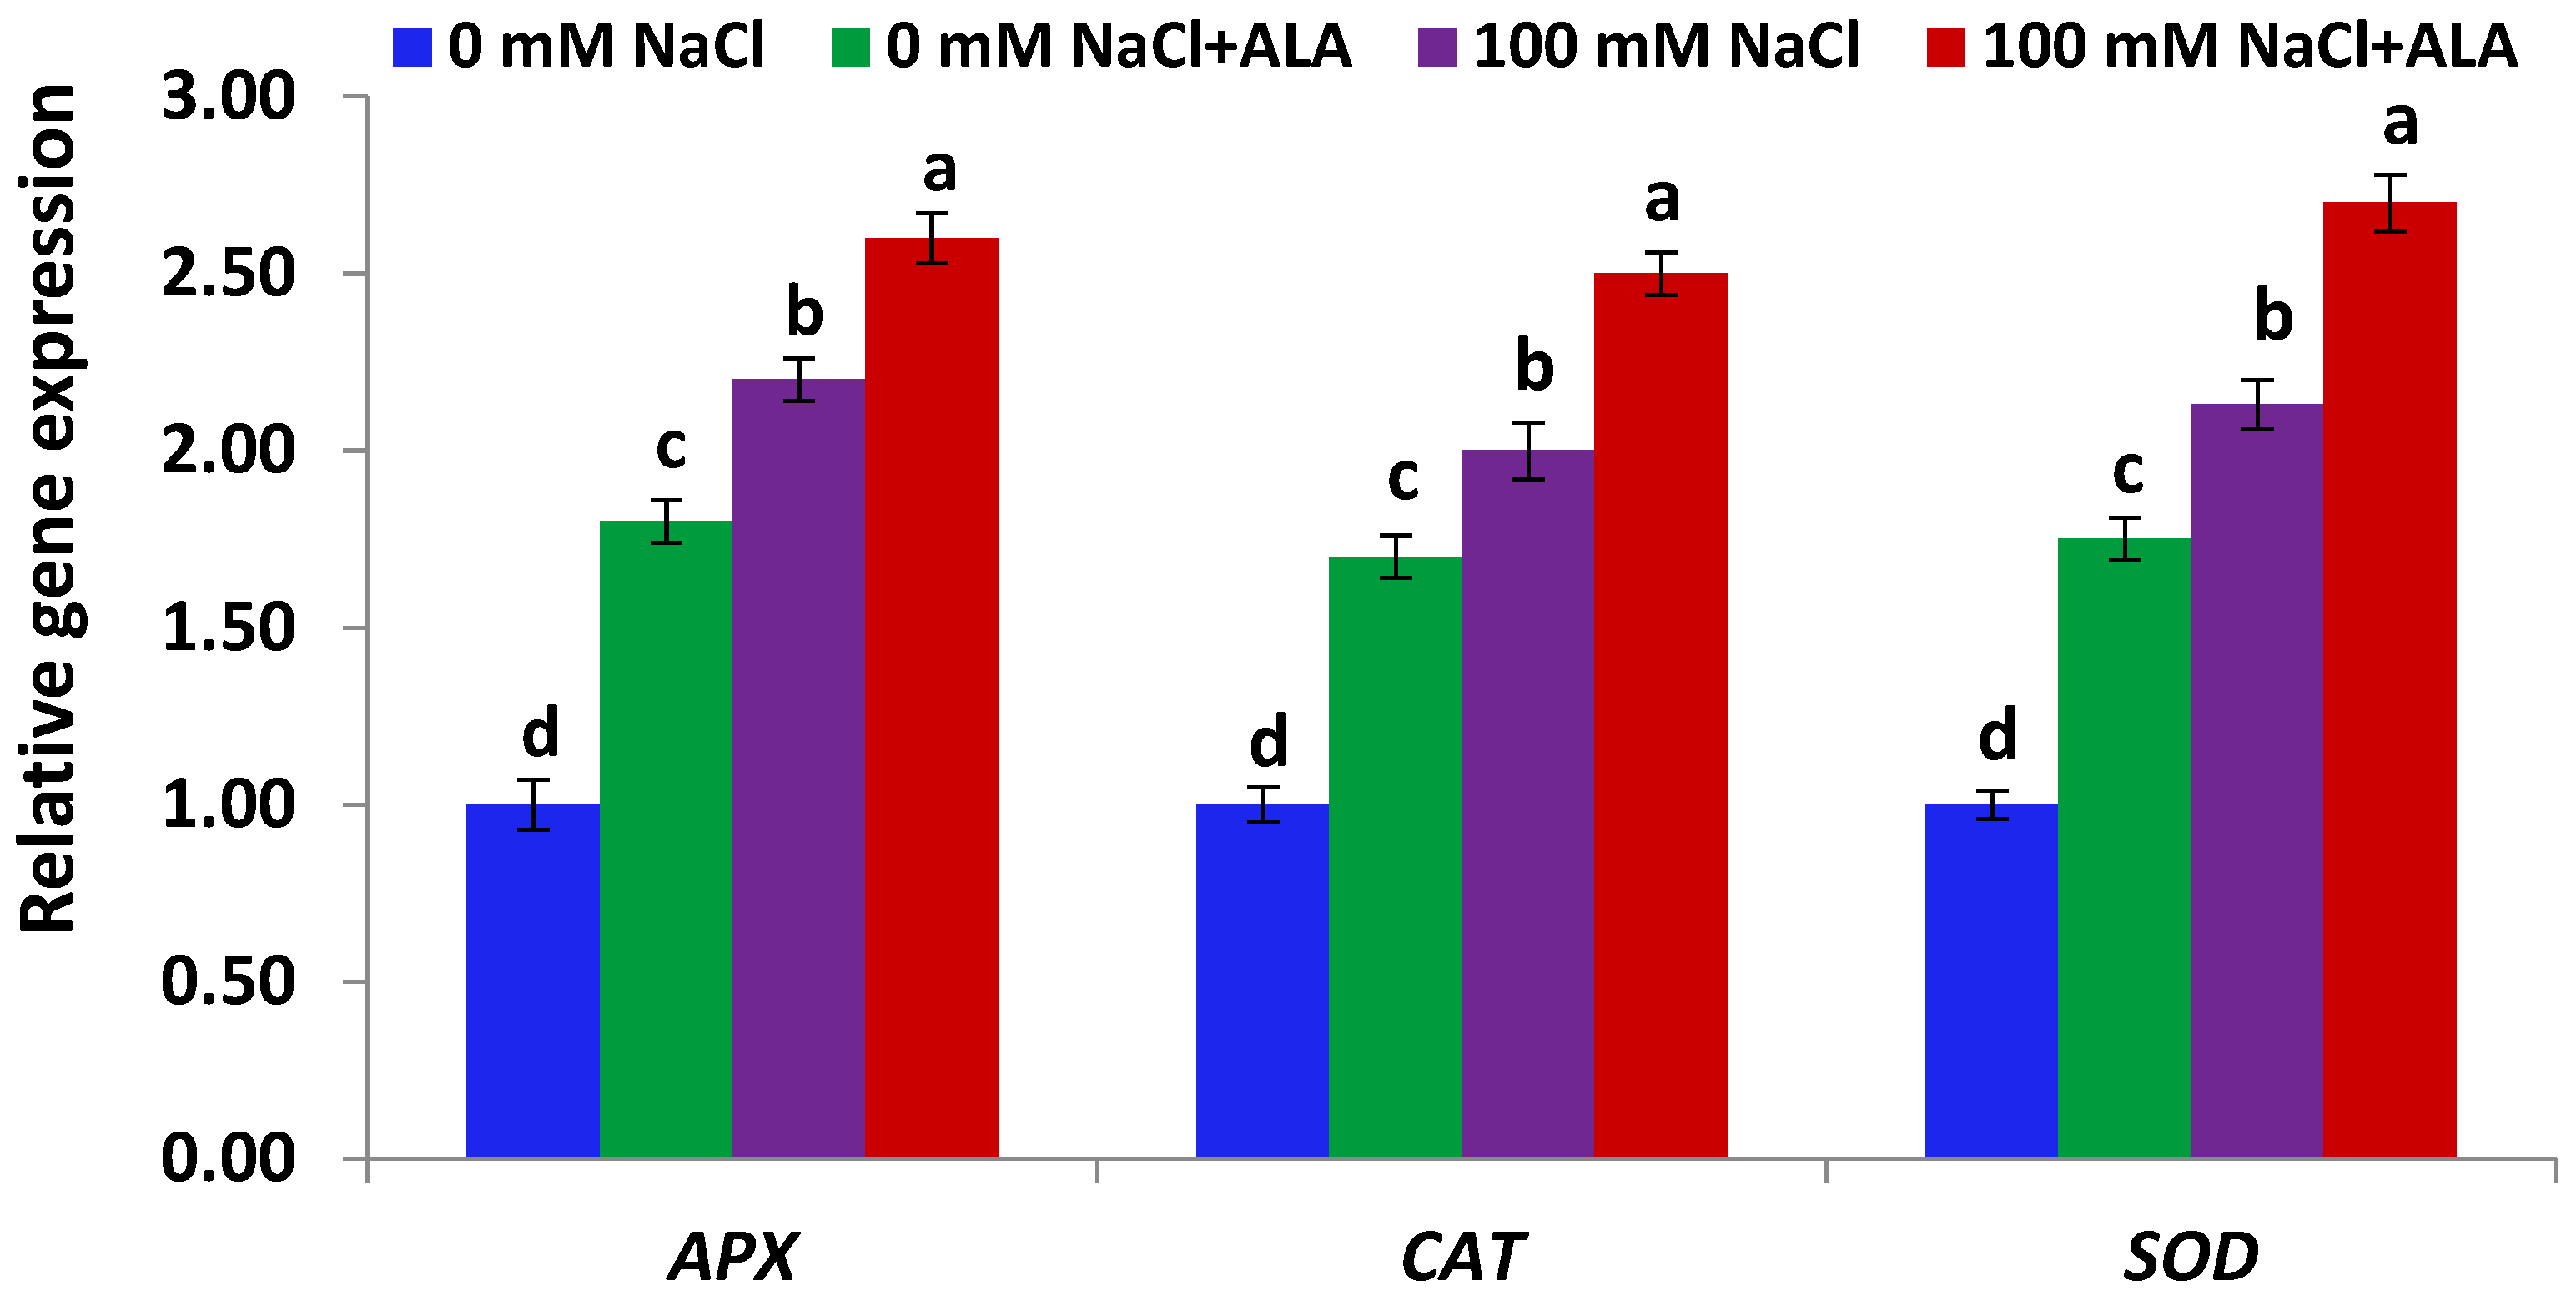
Figure 5.
Expression level of antioxidant genes in Slaski 2 cultivar leaves under salt and/or ALA (7 ppm) effects. Values represent means ± SE (n = 4). Different letters show significant difference among treatments (p ≤ 0.05).
Figure 5.
Expression level of antioxidant genes in Slaski 2 cultivar leaves under salt and/or ALA (7 ppm) effects. Values represent means ± SE (n = 4). Different letters show significant difference among treatments (p ≤ 0.05).
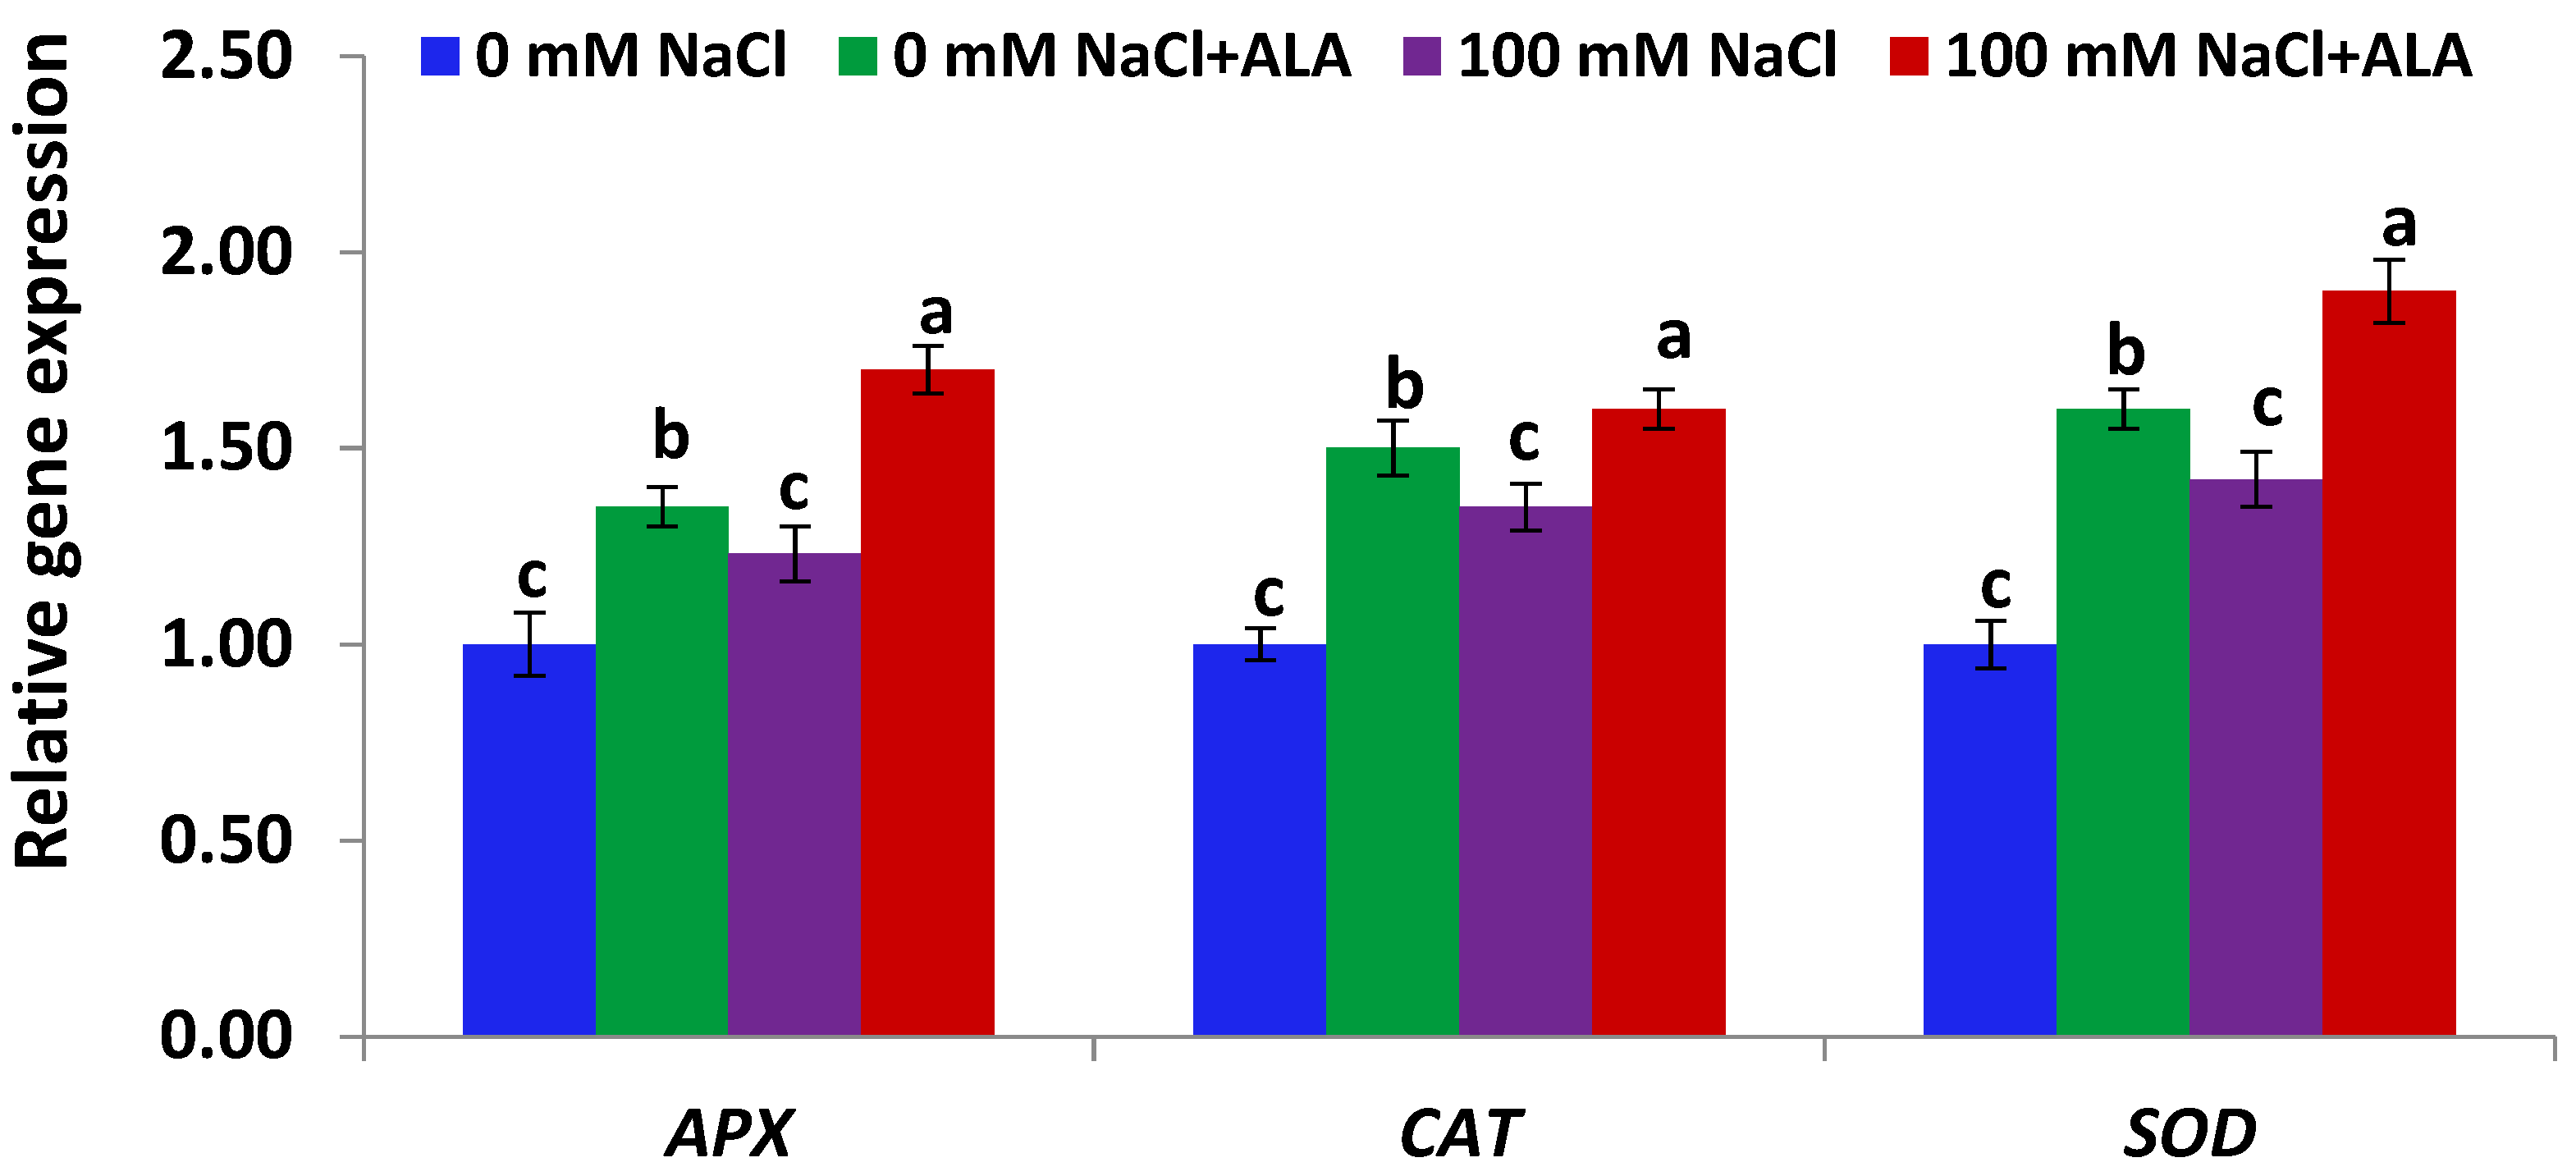
Figure 6.
Expression level of antioxidant genes in Carmen cultivar leaves under salt and/or ALA (7 ppm) effects. Values represent means ± SE (n = 4). Different letters show significant difference among treatments (p ≤ 0.05).
Figure 6.
Expression level of antioxidant genes in Carmen cultivar leaves under salt and/or ALA (7 ppm) effects. Values represent means ± SE (n = 4). Different letters show significant difference among treatments (p ≤ 0.05).
Table 1.
AFLP primers, fragments number and genetic variability indices in the 40 barely varieties.
Table 1.
AFLP primers, fragments number and genetic variability indices in the 40 barely varieties.
| AFLP Primer Sets | Number of Fragments | No. of Polymorphic Fragments | Polymorphism (%) | Fragments Size Range | Gene Diversity | PIC |
|---|
| E-AAC/M- CTT | 31 | 22 | 71.01 | 55–220 | 0.45 | 0.41 |
| E-ACT/M-CTG | 49 | 31 | 63.27 | 50–560 | 0.41 | 0.36 |
| E-ACA/M-CAG | 42 | 21 | 50.00 | 95–520 | 0.32 | 0.29 |
| E-ACT/M-CAG | 55 | 51 | 92.73 | 75–490 | 0.48 | 0.44 |
| E-AGG/M-CTA | 69 | 52 | 75.36 | 90–785 | 0.35 | 0.32 |
| E-AAG/M-CTT | 31 | 18 | 58.06 | 95–610 | 0.44 | 0.41 |
| E-ACT/M-CTT | 62 | 43 | 69.36 | 50–520 | 0.42 | 0.38 |
| E-ACC/M-CTA | 44 | 34 | 77.27 | 60–540 | 0.45 | 0.42 |
| E-AGG/M-CAG | 28 | 19 | 67.86 | 55–490 | 0.39 | 0.36 |
| E-AAG/M-CTG | 72 | 41 | 56.94 | 45–540 | 0.17 | 0.14 |
| E-AGG/M-CAC | 68 | 51 | 75.00 | 60–560 | 0.44 | 0.39 |
| E-ACC/M-CAC | 73 | 37 | 50.68 | 55–750 | 0.22 | 0.19 |
| E-AGG/M-CTT | 61 | 44 | 72.13 | 65–490 | 0.43 | 0.39 |
| E-ACC/M-CAG | 75 | 34 | 45.33 | 75–780 | 0.19 | 0.15 |
| Mean | 54.29 | 35.57 | 66.07 | - | 0.37 | 0.33 |
Table 2.
Genetic variability indices of the 40 barley accessions analyzed.
Table 2.
Genetic variability indices of the 40 barley accessions analyzed.
| Accession Number | Cultivar Name | Origin | Ho | He | F | PIC |
|---|
| CGN00328 | Albert | France | 0.312 | 0.415 | 0.301 | 0.381 |
| CGN02709 | Ares | France | 0.325 | 0.391 | 0.214 | 0.362 |
| CGN02712 | Astrix | France | 0.213 | 0.289 | 0.211 | 0.244 |
| CGN00329 | Baronne | France | 0.332 | 0.428 | 0.282 | 0.392 |
| CGN11185 | Beatrice | France | 0.274 | 0.337 | 0.182 | 0.298 |
| CGN00350 | Berenice | France | 0.261 | 0.368 | 0.298 | 0.331 |
| CGN00330 | Berrichonne | France | 0.318 | 0.411 | 0.305 | 0.379 |
| CGN00318 | Betina | France | 0.217 | 0.299 | 0.245 | 0.262 |
| CGN00351 | Carmen | France | 0.131 | 0.126 | 0.041 | 0.103 |
| CGN00339 | Ceres | France | 0.253 | 0.326 | 0.212 | 0.291 |
| CGN00337 | Chevalier | France | 0.127 | 0.226 | 0.303 | 0.203 |
| CGN00325 | Comtesse | France | 0.247 | 0.357 | 0.332 | 0.317 |
| CGN21737 | Cytris | France | 0.317 | 0.431 | 0.368 | 0.391 |
| CGN02043 | Damseaux | France | 0.286 | 0.469 | −0.537 | 0.481 |
| CGN16158 | Flamenco | France | 0.216 | 0.325 | 0.336 | 0.292 |
| CGN23651 | Gerbel | France | 0.292 | 0.427 | 0.392 | 0.391 |
| CGN00008 | Agio | Netherlands | 0.263 | 0.352 | 0.274 | 0.312 |
| CGN19325 | Anoa | Netherlands | 0.165 | 0.257 | 0.278 | 0.223 |
| CGN21734 | Apex | Netherlands | 0.262 | 0.324 | 0.151 | 0.281 |
| CGN21735 | Bellona | Netherlands | 0.236 | 0.326 | 0.274 | 0.285 |
| CGN00003 | Bigo | Netherlands | 0.142 | 0.206 | 0.246 | 0.104 |
| CGN00016 | Cambrinus | Netherlands | 0.221 | 0.207 | 0.031 | 0.106 |
| CGN19319 | Cumbia | Netherlands | 0.142 | 0.235 | 0.314 | 0.192 |
| CGN00014 | Delta | Netherlands | 0.253 | 0.341 | 0.274 | 0.298 |
| CGN19330 | Efron | Netherlands | 0.267 | 0.363 | 0.302 | 0.325 |
| CGN00230 | Germania | Netherlands | 0.273 | 0.327 | 0.151 | 0.284 |
| CGN19326 | Grosso | Netherlands | 0.287 | 0.364 | 0.241 | 0.328 |
| CGN08532 | Hexa | Netherlands | 0.291 | 0.425 | 0.361 | 0.385 |
| CGN00450 | Antalek | Poland | 0.353 | 0.442 | 0.271 | 0.478 |
| CGN00449 | Damazy | Poland | 0.226 | 0.389 | 0.392 | 0.449 |
| CGN00385 | Danzig | Poland | 0.253 | 0.432 | 0.461 | 0.398 |
| CGN00407 | Groesjetski | Poland | 0.297 | 0.454 | 0.411 | 0.413 |
| CGN02119 | Kujawiak 2 | Poland | 0.184 | 0.306 | 0.352 | 0.299 |
| CGN02106 | Kujawiak | Poland | 0.288 | 0.437 | 0.373 | 0.391 |
| CGN00451 | Lubuski | Poland | 0.198 | 0.328 | 0.342 | 0.284 |
| CGN00448 | Skreszowicki | Poland | 0.349 | 0.242 | 0.031 | 0.311 |
| CGN02107 | Slaski 1 | Poland | 0.185 | 0.278 | 0.272 | 0.279 |
| CGN02109 | Slaski 2 | Poland | 0.374 | 0.501 | −0.393 | 0.482 |
| CGN02118 | Urbanowicki | Poland | 0.311 | 0.463 | −0.411 | 0.480 |
| CGN02103 | W.R.112 Grodkowicki | Poland | 0.187 | 0.278 | 0.273 | 0.233 |
| Mean | | | 0.253 | 0.348 | 0.281 | 0.311 |
Table 3.
Genetic variability indices of barley accessions in the two European regions.
Table 3.
Genetic variability indices of barley accessions in the two European regions.
| Barley Group | Ho | He | F | PIC |
|---|
| Western Europe | 0.247 | 0.335 | 0.261 | 0.298 |
| Eastern Europe | 0.267 | 0.380 | 0.327 | 0.368 |
Table 4.
Contents of chlorophyll, carotenoids, proteins, sugars, proline, phenolics, flavonoids, H2O2, malondialdehyde (MDA) and antioxidant activity (DPPH) in leaves of Slaski 2 cultivar under salt and/or ALA (7 ppm) treatments.
Table 4.
Contents of chlorophyll, carotenoids, proteins, sugars, proline, phenolics, flavonoids, H2O2, malondialdehyde (MDA) and antioxidant activity (DPPH) in leaves of Slaski 2 cultivar under salt and/or ALA (7 ppm) treatments.
| NaCl Treatment | 0 mM | 100 mM |
|---|
| −ALA | +ALA | −ALA | +ALA |
|---|
| Chlorophyll a (mg·g−1 FW) | 2.71 ± 0.13 c | 2.98 ± 0.15 a | 2.59 ± 0.11 c | 2.80 ± 0.13 b |
| Chlorophyll b (mg·g−1 FW) | 1.39 ± 0.06 c | 1.71 ± 0.06 a | 1.33 ± 0.04 c | 1.51 ± 0.07 b |
| Total Chl (mg·g−1 FW) | 4.10 ± 0.12 c | 4.69 ± 0.14 a | 3.99 ± 0.17 c | 4.31 ± 0.14 b |
| Carotenoid (mg·g−1 FW) | 0.32 ± 0.06 c | 0.37 ± 0.07 a | 0.30 ± 0.09 c | 0.34 ± 0.06 b |
| Proteins (mg·g−1 FW) | 0.92 ± 0.11 c | 1.07 ± 0.07 a | 0.86 ± 0.08 c | 0.98 ± 0.09 b |
| Soluble sugars (µg·g−1 FW) | 2.12 ± 0.16 c | 2.35 ± 0.12 a | 2.04 ± 0.14 c | 2.19 ± 0.17 b |
| Proline (µg·g−1 FW) | 14.4 ± 0.47 d | 21.8 ± 0.51 c | 25.9 ± 0.42 b | 30.8 ± 0.51 a |
| Total Phenolics (µmol·g−1 FW) | 14.3 ± 0.33 c | 16.8 ± 0.41 a | 13.1 ± 0.31 c | 14.8 ± 0.32 b |
| Total Flavonoids (µmol·g−1 FW) | 7.11 ± 0.18 c | 8.89 ± 0.15 a | 6.41 ± 0.17 c | 7.22 ± 0.13 b |
| H2O2 (µmol·g−1 FW) | 0.23 ± 0.03 c | 0.18 ± 0.05 d | 0.34 ± 0.04 a | 0.29 ± 0.06 b |
| MDA (µmol·g−1 FW) | 0.17 ± 0.05 c | 0.15 ± 0.04 d | 0.28 ± 0.03 a | 0.23 ± 0.05 b |
| DPPH (IC50, μg·mL−1) | 0.35 ± 0.02 a | 0.32 ± 0.04 c | 0.36 ± 0.02 b | 0.31 ± 0.02 d |
Table 5.
Contents of chlorophylls, carotenoids, proteins, sugars, proline, phenolics, flavonoids, H2O2, MDA and antioxidant activity (DPPH) in leaves of Damseaux cultivar under salt and/or ALA (7 ppm) treatments.
Table 5.
Contents of chlorophylls, carotenoids, proteins, sugars, proline, phenolics, flavonoids, H2O2, MDA and antioxidant activity (DPPH) in leaves of Damseaux cultivar under salt and/or ALA (7 ppm) treatments.
| NaCl Treatment | 0 mM | 100 mM |
|---|
| −ALA | +ALA | −ALA | +ALA |
|---|
| Chlorophyll a (mg·g−1 FW) | 2.67 ± 0.14 c | 2.93 ± 0.13 a | 2.59 ± 0.13 c | 2.81 ± 0.14 b |
| Chlorophyll b (mg·g−1 FW) | 1.41 ± 0.07 c | 1.69 ± 0.05 a | 1.33 ± 0.06 c | 1.48 ± 0.05 b |
| Total Chl (mg·g−1 FW) | 4.08 ± 0.14 c | 4.62 ± 0.11 a | 3.98 ± 0.13 c | 4.29 ± 0.13 b |
| Carotenoid (mg·g−1 FW) | 0.32 ± 0.05 c | 0.41 ± 0.04 a | 0.29 ± 0.07 c | 0.35 ± 0.04 b |
| Proteins (mg·g−1 FW) | 0.86 ± 0.08 c | 1.11 ± 0.09 a | 0.82 ± 0.07 c | 1.03 ± 0.07 b |
| Soluble sugars (µg·g−1 FW) | 2.07 ± 0.12 c | 2.27 ± 0.11 a | 2.02 ± 0.15 c | 2.17 ± 0.13 b |
| Proline (µg·g−1 FW) | 14.1 ± 0.39 d | 19.2 ± 0.41 c | 24.3 ± 0.37 b | 32.2 ± 0.43 a |
| Total Phenolics (µmol·g−1 FW) | 13.6 ± 0.22 c | 14.9 ± 0.27 a | 12.9 ± 0.29 c | 14.1 ± 0.27 b |
| Total Flavonoids (µmol·g−1 FW) | 6.57 ± 0.13 c | 7.97 ± 0.11 a | 5.98 ± 0.15 c | 6.99 ± 0.12 b |
| H2O2 (µmol·g−1 FW) | 0.21 ± 0.05 c | 0.17 ± 0.04 d | 0.31 ± 0.06 a | 0.26 ± 0.07 b |
| MDA (µmol·g−1 FW) | 0.15 ± 0.03 c | 0.13 ± 0.05 d | 0.26 ± 0.06 a | 0.21 ± 0.05 b |
| DPPH (IC50, μg·mL−1) | 0.33 ± 0.03 a | 0.31 ± 0.05 c | 0.34 ± 0.03 b | 0.29 ± 0.04 d |
Table 6.
Contents of chlorophyll, carotenoids, proteins, sugars, proline, phenolics, flavonoids, H2O2, MDA and antioxidant activity (DPPH) in leaves of Urbanowicki cultivar under salt and/or ALA (7 ppm) treatments.
Table 6.
Contents of chlorophyll, carotenoids, proteins, sugars, proline, phenolics, flavonoids, H2O2, MDA and antioxidant activity (DPPH) in leaves of Urbanowicki cultivar under salt and/or ALA (7 ppm) treatments.
| NaCl Treatment | 0 mM | 100 mM |
|---|
| −ALA | +ALA | −ALA | +ALA |
|---|
| Chlorophyll a (mg·g−1 FW) | 2.69 ± 0.11 c | 2.88 ± 0.15 a | 2.57 ± 0.12 c | 2.74 ± 0.13 b |
| Chlorophyll b (mg·g−1 FW) | 1.39 ± 0.04 c | 1.58 ± 0.06 a | 1.32 ± 0.05 c | 1.41 ± 0.04 b |
| Total Chl (mg·g−1 FW) | 4.08 ± 0.13 c | 4.46 ± 0.14 a | 3.96 ± 0.12 c | 4.15 ± 0.11 b |
| Carotenoid (mg·g−1 FW) | 0.31 ± 0.06 c | 0.38 ± 0.05 a | 0.29 ± 0.06 c | 0.37 ± 0.07 b |
| Proteins (mg·g−1 FW) | 0.91 ± 0.07 c | 1.22 ± 0.08 a | 0.85 ± 0.08 c | 1.07 ± 0.06 b |
| Soluble sugars (µg·g−1 FW) | 2.03 ± 0.11 c | 2.18 ± 0.13 a | 1.98 ± 0.12 c | 2.08 ± 0.11 b |
| Proline (µg·g−1 FW) | 13.9 ± 0.29 d | 18.3 ± 0.38 c | 25.7 ± 0.27 b | 31.8 ± 0.34 a |
| Total Phenolics (µmol·g−1 FW) | 13.8 ± 0.21 c | 14.6 ± 0.22 a | 12.9 ± 0.25 c | 14.1 ± 0.23 b |
| Total Flavonoids (µmol·g−1 FW) | 7.05 ± 0.13 c | 7.86 ± 0.12 a | 5.98 ± 0.11 c | 7.02 ± 0.13 b |
| H2O2 (µmol·g−1 FW) | 0.19 ± 0.06 c | 0.16 ± 0.03 d | 0.28 ± 0.08 a | 0.23 ± 0.05 b |
| MDA (µmol·g−1 FW) | 0.14 ± 0.05 c | 0.11 ± 0.03 d | 0.24 ± 0.07 a | 0.19 ± 0.06 b |
| DPPH (IC50, μg·mL−1) | 0.31 ± 0.04 a | 0.29 ± 0.04 b | 0.32 ± 0.02 c | 0.30 ± 0.03 d |
Table 7.
Contents of chlorophyll, carotenoids, proteins, sugars, proline, phenolics, flavonoids, H2O2, MDA and antioxidant activity (DPPH) in leaves of Carmen cultivar under salt and/or ALA (7 ppm) treatments.
Table 7.
Contents of chlorophyll, carotenoids, proteins, sugars, proline, phenolics, flavonoids, H2O2, MDA and antioxidant activity (DPPH) in leaves of Carmen cultivar under salt and/or ALA (7 ppm) treatments.
| NaCl Treatment | 0 mM | 100 mM |
|---|
| −ALA | +ALA | −ALA | +ALA |
|---|
| Chlorophyll a (mg·g−1 FW) | 2.44 ± 0.11 b | 2.86 ± 0.13 a | 1.78 ± 0.16 d | 2.11 ± 0.12 c |
| Chlorophyll b (mg·g−1 FW) | 1.21 ± 0.08 b | 1.68 ± 0.07 a | 0.92 ± 0.05 d | 1.18 ± 0.08 c |
| Total Chl (mg·g−1 FW) | 3.65 ± 0.13 b | 4.54 ± 0.11 a | 2.70 ± 0.14 d | 3.29 ± 0.10 c |
| Carotenoid (mg·g−1 FW) | 0.29 ± 0.04 b | 0.34 ± 0.08 a | 0.22 ± 0.03 c | 0.28 ± 0.04 b |
| Proteins (mg·g−1 FW) | 0.89 ± 0.08 b | 1.03 ± 0.09 a | 0.78 ± 0.11 d | 0.85 ± 0.12 c |
| Soluble sugars (µg·g−1 FW) | 2.04 ± 0.13 b | 2.19 ± 0.14 a | 1.87 ± 0.12 d | 1.96 ± 0.14 c |
| Proline (µg·g−1 FW) | 14.8 ± 0.38 d | 22.7 ± 0.44 c | 26.7 ± 0.38 b | 32.6 ± 0.46 a |
| Total Phenolics (µmol·g−1 FW) | 13.9 ± 0.36 b | 15.2 ± 0.32 a | 09.1 ± 0.29 d | 11.8 ± 0.31 c |
| Total Flavonoids (µmol·g−1 FW) | 6.23 ± 0.13 b | 8.25 ± 0.16 a | 4.14 ± 0.14 d | 5.07 ± 0.16 c |
| H2O2 (µmol·g−1 FW) | 0.25 ± 0.03 c | 0.21 ± 0.06 d | 0.68 ± 0.05 a | 0.51 ± 0.04 b |
| MDA (µmol·g−1 FW) | 0.19 ± 0.04 c | 0.17 ± 0.03 d | 0.51 ± 0.05 a | 0.32 ± 0.04 b |
| DPPH (IC50, μg·mL−1) | 0.36 ± 0.04 a | 0.34 ± 0.03 b | 0.33 ± 0.04 c | 0.32 ± 0.02 d |
Table 8.
Contents of chlorophyll, carotenoids, proteins, sugars, proline, phenolics, flavonoids, H2O2, MDA and antioxidant activity (DPPH) in leaves of Bigo cultivar under salt and/or ALA (7 ppm) treatments.
Table 8.
Contents of chlorophyll, carotenoids, proteins, sugars, proline, phenolics, flavonoids, H2O2, MDA and antioxidant activity (DPPH) in leaves of Bigo cultivar under salt and/or ALA (7 ppm) treatments.
| NaCl Treatment | 0 mM | 100 mM |
|---|
| −ALA | +ALA | −ALA | +ALA |
|---|
| Chlorophyll a (mg·g−1 FW) | 2.47 ± 0.12 b | 2.68 ± 0.17 a | 1.81 ± 0.14 d | 2.23 ± 0.15 c |
| Chlorophyll b (mg·g−1 FW) | 1.18 ± 0.04 b | 1.44 ± 0.07 a | 0.88 ± 0.06 c | 1.19 ± 0.06 b |
| Total Chl (mg·g−1 FW) | 3.65 ± 0.15 b | 4.12 ± 0.12 a | 2.69 ± 0.11 d | 3.42 ± 0.12 c |
| Carotenoid (mg·g−1 FW) | 0.27 ± 0.05 b | 0.32 ± 0.04 a | 0.18 ± 0.06 d | 0.24 ± 0.05 c |
| Proteins (mg·g−1 FW) | 0.82 ± 0.07 b | 1.08 ± 0.09 a | 0.61 ± 0.12 c | 0.83 ± 0.11 b |
| Soluble sugars (µg·g−1 FW) | 2.01 ± 0.11 b | 2.23 ± 0.11 a | 1.81 ± 0.13 d | 1.93 ± 0.11 c |
| Proline (µg·g−1 FW) | 14.1 ± 0.31 d | 21.2 ± 0.37 c | 27.5 ± 0.41 b | 31.3 ± 0.27 a |
| Total Phenolics (µmol·g−1 FW) | 12.8 ± 0.41 b | 15.7 ± 0.27 a | 08.3 ± 0.32 d | 12.1 ± 0.33 c |
| Total Flavonoids (µmol·g−1 FW) | 6.11 ± 0.11 b | 8.12 ± 0.12 a | 4.03 ± 0.16 d | 5.22 ± 0.15 c |
| H2O2 (µmol·g−1 FW) | 0.23 ± 0.05 c | 0.20 ± 0.05 d | 0.71 ± 0.06 a | 0.57 ± 0.07 b |
| MDA (µmol·g−1 FW) | 0.18 ± 0.06 c | 0.15 ± 0.06 d | 0.59 ± 0.08 a | 0.39 ± 0.06 b |
| DPPH (IC50, μg·mL−1) | 0.34 ± 0.03 a | 0.32 ± 0.04 b | 0.31 ± 0.03 c | 0.29 ± 0.03 d |
Table 9.
Contents of chlorophyll, carotenoids, proteins, sugars, proline, phenolics, flavonoids, H2O2, MDA and antioxidant activity (DPPH) in leaves of Cambrinus cultivar under salt and/or ALA (7 ppm) treatments.
Table 9.
Contents of chlorophyll, carotenoids, proteins, sugars, proline, phenolics, flavonoids, H2O2, MDA and antioxidant activity (DPPH) in leaves of Cambrinus cultivar under salt and/or ALA (7 ppm) treatments.
| NaCl Treatment | 0 mM | 100 mM |
|---|
| −ALA | +ALA | −ALA | +ALA |
|---|
| Chlorophyll a (mg·g−1 FW) | 2.39 ± 0.12 b | 2.72 ± 0.15 a | 1.71 ± 0.13 d | 2.22 ± 0.11 c |
| Chlorophyll b (mg·g−1 FW) | 1.28 ± 0.05 b | 1.56 ± 0.08 a | 0.91 ± 0.04 d | 1.21 ± 0.07 c |
| Total Chl (mg·g−1 FW) | 3.67 ± 0.12 b | 4.28 ± 0.11 a | 2.62 ± 0.13 d | 3.43 ± 0.12 c |
| Carotenoid (mg·g−1 FW) | 0.27 ± 0.05 b | 0.36 ± 0.06 d | 0.20 ± 0.04 c | 0.25 ± 0.05 c |
| Proteins (mg·g−1 FW) | 0.86 ± 0.07 b | 1.15 ± 0.07 a | 0.71 ± 0.12 d | 0.82 ± 0.13 c |
| Soluble sugars (µg·g−1 FW) | 1.98 ± 0.11 c | 2.21 ± 0.12 a | 1.81 ± 0.11 d | 2.06 ± 0.12 b |
| Proline (µg·g−1 FW) | 16.1 ± 0.31 d | 24.2 ± 0.33 c | 27.2 ± 0.34 b | 33.4 ± 0.38 a |
| Total Phenolics (µmol·g−1 FW) | 14.1 ± 0.34 b | 15.6 ± 0.35 a | 10.2 ± 0.37 d | 13.7 ± 0.33 c |
| Total Flavonoids (µmol·g−1 FW) | 6.88 ± 0.12 b | 8.11 ± 0.14 a | 4.03 ± 0.12 d | 5.04 ± 0.13 c |
| H2O2 (µmol·g−1 FW) | 0.23 ± 0.07 c | 0.20 ± 0.05 d | 0.72 ± 0.07 a | 0.55 ± 0.06 b |
| MDA (µmol·g−1 FW) | 0.18 ± 0.05 c | 0.15 ± 0.04 d | 0.56 ± 0.04 a | 0.38 ± 0.03 b |
| DPPH (IC50, μg·mL−1) | 0.35 ± 0.02 a | 0.33 ± 0.03 b | 0.32 ± 0.02 c | 0.31 ± 0.02 d |

 ,
, 


