Aflatoxin B1–Formamidopyrimidine DNA Adducts: Relationships between Structures, Free Energies, and Melting Temperatures


1
Laboratory of Physical Chemistry and Chemical Thermodynamics, Faculty of Chemistry and Chemical Technology, University of Maribor, Smetanova Ulica 17, 2000 Maribor, Slovenia
2
Laboratory for Molecular Modeling, Theory Department, National Institute of Chemistry, Hajdrihova 19, 1001 Ljubljana, Slovenia
*
Author to whom correspondence should be addressed.
Molecules 2019, 24(1), 150; https://0-doi-org.brum.beds.ac.uk/10.3390/molecules24010150
Submission received: 5 December 2018
/
Revised: 21 December 2018
/
Accepted: 26 December 2018
/
Published: 2 January 2019
(This article belongs to the Special Issue Receptor-Dependent QSAR Methods)
Abstract
:Thermal stabilities of DNA duplexes containing Gua (g), α- (a) or β-anomer of formamidopyrimidine-N7-9-hydroxy-aflatoxin B1 (b) differ markedly (Tm: ), but the underlying molecular origin of this experimentally observed phenomenon is yet to be identified and determined. Here, by employing explicit-solvent molecular dynamics simulations coupled with free-energy calculations using a combined linear-interaction-energy/linear-response-approximation approach, we explain the quantitative differences in T in terms of three structural features (bulkiness, order, and compactness) and three energetical contributions (non-polar, electrostatic, and preorganized-electrostatic), and thus advance the current understanding of the relationships between structures, free energies, and thermal stabilities of DNA double helices.
1. Introduction
Aflatoxin B1 (AFB1), systematically (6aR,9aS)-4-methoxy-2,3,6a,9a-tetrahydrocyclopenta[c]-[0]furo[3′,2′:4,5]furo[2,3-h]chromene-1,11-dione 1 (Figure 1) [1,2], a secondary metabolite [3] produced by aflatoxigenic [3] aspergilli [4,5,6,7,8,9,10] contaminates agricultural commodities (e.g., corn, peanuts, rice, sorghum, and wheat) [11] in tropical, subtropical, and temperate climate zones [12]. Following ingestion, inhalation, injection, or dermal absorption of matter contaminated with AFB1, and the subsequent cellular uptake of AFB1, the unsaturated lactone ring of AFB1 [13] is epoxidized [14,15,16,17]—in humans by various cytochrome P450 enzyme isoforms [18,19,20,21,22]—into metabolically activated [14,23,24,25,26,27] AFB1-8,9-epoxide 2 (AFB1-E; Figure 1) [15]. The exo isomer of AFB1-E [28,29,30,31] is an alkylating agent [13] that intercalates into both nuclear and mitochondrial dsDNA [31,32,33,34,35,36,37,38,39], and reacts with the N7 atom of Gua 3 (Figure 1) [36,40,41] to form, via bimolecular nucleophilic substitution [29,40], a covalent [16,17] cationic 8,9-dihydro-8-(N7-guanyl)-9-hydroxy-AFB1 adduct 4 (Figure 1) [40,42,43,44,45] whose AFB1 moiety is situated at the 5′-face of the modified Gua [34,35,39,46,47] and induces ∼20 degree bending of DNA [38]. 4 is thermally and alkali labile; therefore, 4 releases itself from DNA as 2,3-dihydro-2-(N7-guanyl)-9-hydroxy-AFB1 [40,46,48,49,50], leaving behind an abasic site [48], or transforms itself (by the opening of the imidazole ring of the modified Gua) into thermally stable 8,9-dihydro-8-(N5-formyl-2′,5′,6′-triamino-4-oxo-N5-pyrimidyl)-9-hydroxy-AFB1 5 (FAPy-AFB1; Figure 1) [40,43,51,52], which remains firmly attached to the deoxyribose (dRib) in the native -anomeric configuration (b) [39,53,54] and restores the original unbent DNA conformation [36,38].
The interconversion between b and the alternative α-anomer (a) occurs only in ssDNA [39,53,54], formed upon dissociation of the complementary strands of dsDNA during DNA replication, transcription, and repair. Although ssDNA shows a slight preference for a, re-association of the complementary DNA strands strongly favors b [39,53,54], which is a consequence of (1) a to b conversion in ssDNA being very slow, (2) ssDNA life-time being too brief, and (3) b being more conducive than a to the re-association [39]. a and b are strong blockers of DNA replication [13,50,53,55,56,57,58,59,60,61,62,63,64,65] and transcription [23,25,32,55,59,60,61,62,66,67,68,69]. Additionally, b is a strong mutagen for it is the material cause of the b·C→T·A transversion substitution mutation [46,49,53,64,70,71,72,73,74,75,76,77,78,79,80,81,82], the efficient cause of which is an erroneous bypass of b lesion by the translesion DNA polymerase ζ [64,65].
As a bulky adduct, b is a potential substrate for nucleotide excision repair (NER) [47,51,82,83,84,85,86,87,88], a complex mechanism involving more than 40 proteins and operating in two modes: global genome repair (GGR; sensitive to disrupted base-pairing at the site of the lesion) and transcription-coupled repair (TCR; sensitive to, and triggered by, the ability of the lesion to block the elongating RNA polymerase II complex) [86,88]. Owing to the intact Watson-Crick (WC) hydrogen-bonding interaction between β-FAPy and the complementary cytosine [36], b is only a very poor substrate for GGR [88], and thus the repair of b depends on TCR [81], which is restricted to the transcriptionally active regions of genomic DNA [89], and within these regions only to the transcribed strand [81]. Moreover, the efficiency of TCR is hampered by the binding of AFB1-induced lipid-peroxidation products (acetaldehyde and crotonaldehyde) to, and inhibiting the natural roles of, NER proteins [82]. Alternatively, 5 can be excised by the promiscuous DNA glycosylase NEIL1 [90], but the base excision repair pathway as a whole is inhibited by AFB1 [82].
The oxidative stress induced by AFB1 [82,91,92]; the conversion of AFB1 to AFB1-E; and the formation, stability, inefficient repair, and mutagentic potential of b and acetaladehyde (mHPG, α-methyl-γ-hydroxy-1,N2-propano-Gua) DNA adducts is the complex cause [82] of the cytotoxic [3,4,13,55,59,65,93,94,95,96,97,98] (hepatotoxic [93,94,95,97,99,100,101,102,103,104], nephrotoxic [102,105], pulmotoxic [56,106,107], immunotoxic [104,108], and neurotoxic [109]), terratogenic [110], tumorigenic, and carcinogenic effects associated with AFB1 [32,82,93,94,99,101,102,106,111,112,113,114,115] and modulated by cell- [97], tissue- [86], individual- [20,116], and species-specific susceptibility [15,55,110,117,118,119].
b can exert its harmful influence on DNA information content and retrieval if, and only if, it persists for a biologically meaningful time. In this regard, a peculiar characteristic of dsDNA oligonucleotides containing b (dsDNAb) is a higher, resistance-to-NER conferring [47], thermal stability (melting temperature, Tm) of the duplex relative to dsDNAa (ΔTm ∼ 27 K) and dsDNAg (ΔTm ∼ 13 K) [33,34,36,38,39,47], which has been qualitatively (but not quantitatively) ascribed, based on nuclear magnetic resonance (NMR) structures of dsDNAa and dsDNAb (Figure 2), to favorable stacking interactions [27,36,38,39,47] (and not to perturbed WC hydrogen bonding interactions, for these remain intact in both dsDNAa and dsDNAb) [36,39,47].
And this brings us to defining the main object of our present inquiry, an attempt to answer the following question: What are the structural and energetical causes, not only qualitatively but also quantitatively, of the experimentally observed differences in the thermal stability of dsDNAg, dsDNAa, and dsDNAb? For knowing the answer to this question—besides being the good per se (as one of the pieces of the aflatoxin puzzle)—may help us to proceed from particular observations to general principles that determine the structure and stability of N5-substituted FAPy lesions and intercalated bulky DNA adducts on a long journey toward a complete understanding of the stability and energetics of the DNA double helix in terms of the contributions of polar and non-polar interactions [120].
We approach the problem of quantifying the structural and energetical causes of the differences in the thermal stability between dsDNAg, dsDNAa, and dsDNAb theoretically in three steps: (1) generating ensembles of structures-and-energies of dsDNA and ssDNA models of DNAg [121,122,123], DNAa [39], and DNAb [36] using molecular dynamics (MD) simulations [124], (2) calculating absolute (ΔG, dsDNA vs. ssDNA) and relative free energies (ΔΔG, g vs. a vs. b) using a combination [125] of linear response approximation (LRA) [126] and linear interaction energy (LIE) methods [127], and (3) correlating the experimentally known melting temperatures [39,47] with the ensemble-derived structural signatures and free energies.
2. Results
2.1. Sizes
a (α-FAPy-N7-9-hydroxy-AFB1) and b (β-FAPy-N7-9-hydroxy-AFB1) are of equal size and 3.3 times bulkier than g (Gua), from which the ranking by bulkiness was determined: .
2.2. Structures
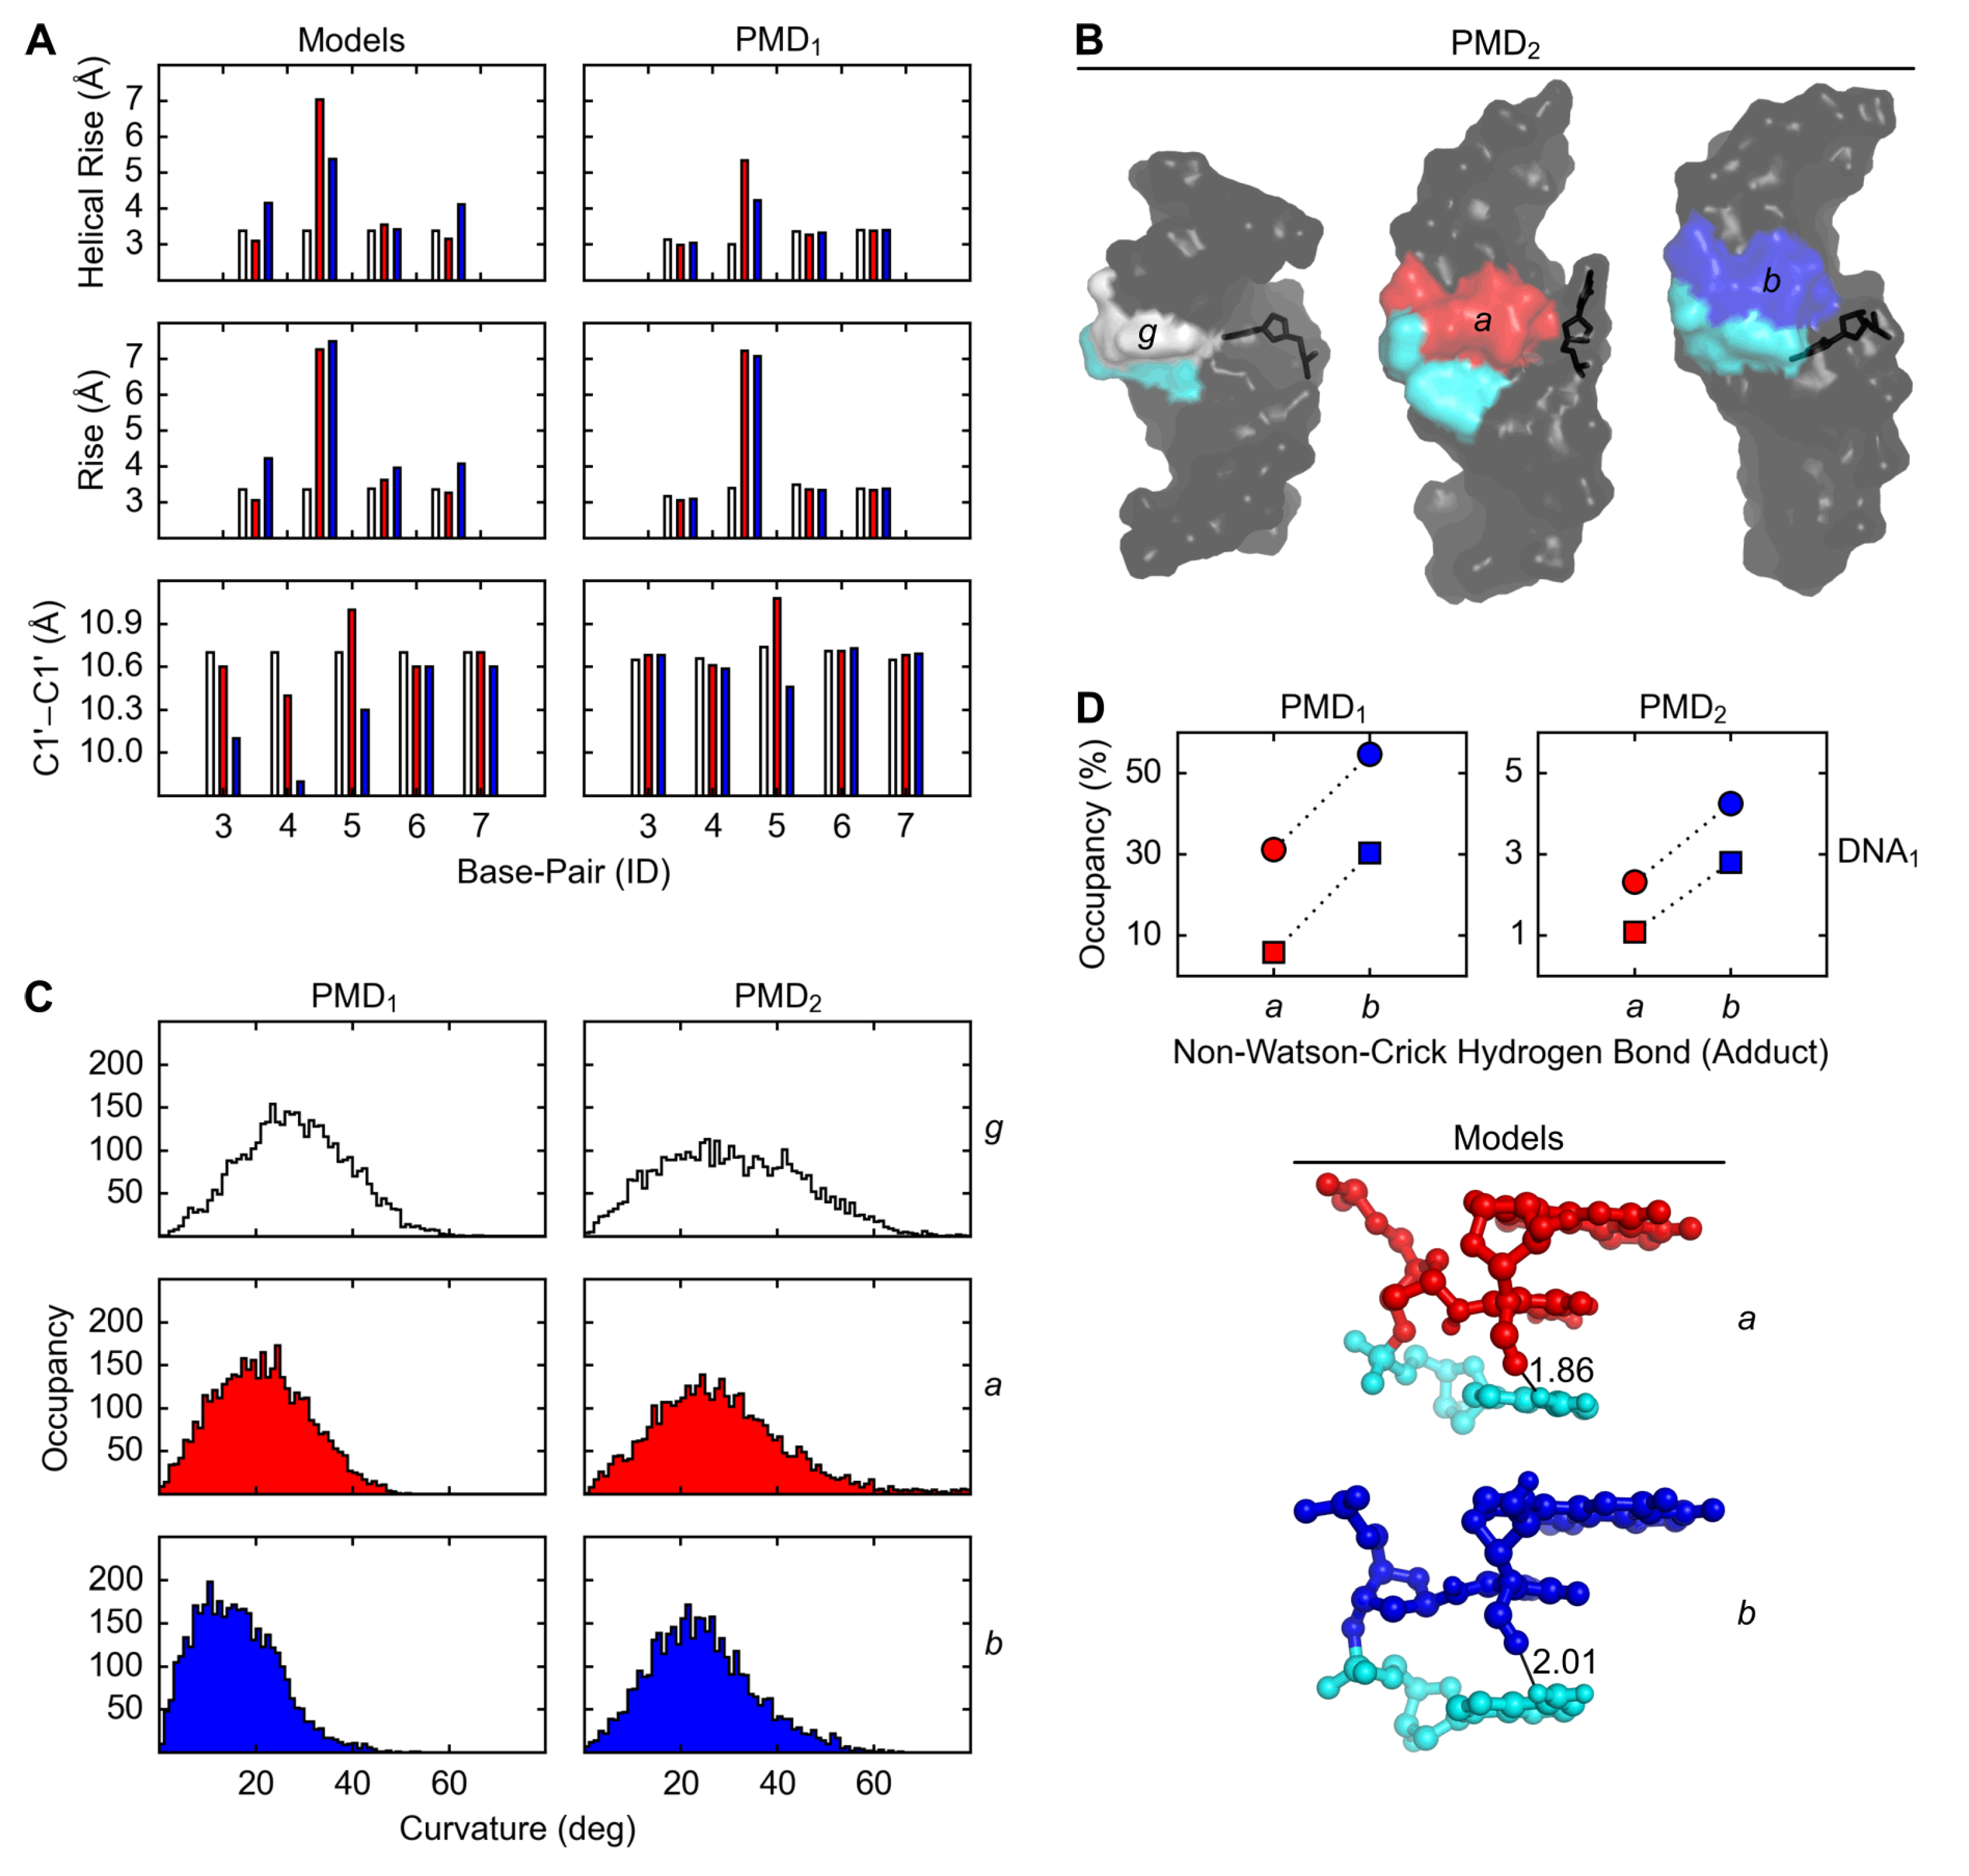
The lengths of helical rise between the base pairs 4 and 5 in the initial dsDNA models vs. PMD1 (producing molecular dynamics; the polar state 1) structures of g, a, and b were, respectively, 3.4 vs. 3.0, 7.0 vs. 5.3, and 5.4 vs. 4.2 Å (the average of DNA1, the A·T variant, and DNA2, the G·C variant), from which the ranking by disorder was determined: (Figure 3A, top row). In contrast to the length of helical rise, the length of rise between the base pairs 4 and 5 does not distinguish a from b: (Figure 3A, middle row). The distances between the C1’ atoms of the base-pair 5 in the initial dsDNA models of g, a, and b were 10.7, 11.0, and 10.3 Å, respectively, and the average occupancies of WC-5 (the Watson-Crick hydrogen bonds within the base-pair 5) in PMD2 (the non-polar state 2) structures of g, a, and b were, respectively, 14, 11, and 17% (the average of DNA1 and DNA2); from these two measures the ranking by looseness was determined: (Figure 3A, bottom row).
The same ranking, , would be also obtained for the distances between the C1′ atoms of the base-pair 5 in PMD structures, but only if ST, significance threshold, for the differences were ignored, because the distances in PMD1 vs. PMD2 structures of g, a, and b were, respectively, 10.7 vs. 11.9, 11.1 vs. 12.3, and 10.5 vs. 11.8 Å (the average of DNA1 and DNA2), and so the differences () between g and b were Å. The same ranking, , would be also obtained for the occupancy of the perturbed conformation of the nucleobase Cyt-16 (Figure 3B), but only if ST for the differences in the occupancies were ignored, because the occupancies were 0.5, 1.6, and 0.2% (the average of DNA1 and DNA2), respectively, for g, a, and b, and so the differences () between the occupancies were %.
The dsDNA bending angles in PMD1 structures of g, a, and b were, respectively, 25, 20, and 15° (the average of DNA1 and DNA2), and the corresponding dsDNA bending angles in PMD2 structures were 30, 25, and 20°, respectively; from these two measures the ranking by curvature was determined: (Figure 3C).
The average occupancies of nWC (the non-Watson-Crick hydrogen bond involving the formyl group of the FAPy moiety and the exocyclic amino group of the 3′-neighboring Ade in DNA1) in PMD1 structures of dsDNAa, dsDNAb, ssDNAa, and ssDNAb were 31, 55, 6, and 30%, respectively, and the corresponding occupancies in PMD2 structures were 2, 4, 1, and 3%, respectively; from these two measures the rankings by the stability of nWC in dsDNA1 and ssDNA1, and the ranking by percentual difference in the stability of nWC between dsDNA1 and ssDNA1, were determined: , , and , respectively (Figure 3D).
2.3. Free Energies
Contributions of the probes to the absolute free energies of dsDNA formation (Table S1) were obtained from interaction energies (Table 1); relative free energies (Table 2) were obtained from the corresponding absolute free energies. ΔGvdw1 of g, a, and b were, respectively, −1.0, −2.9, and −3.0 kcal/mol (the average of DNA1 and DNA2), from which the ranking by non-electrostatic contribution of the probe to the dsDNA formation, was determined: . ΔGele1 of g, a, and b were, respectively, −2.7, −0.5, and −1.4 kcal/mol (the average of DNA1 and DNA2), from which the ranking by electrostatic contribution of the probe in the polar state 1 to the dsDNA formation, was determined: . ΔGele2 of g, a, and b were, respectively, −0.4, 0.7, and −1.2 kcal/mol (the average of DNA1 and DNA2), from which the ranking by electrostatic contribution of the probe in the non-polar state 2—i.e., the ranking by the contribution of electrostatic preorganization to the dsDNA formation—was determined: . ΔGele of g, a, and b were, respectively, −3.1, 0.2, and −2.6 kcal/mol (the average of DNA1 and DNA2), from which the ranking by total electrostatic contribution of the probe to the dsDNA formation, was determined: . ΔG of g, a, and b were, respectively, −4.1, −2.8, and −5.6 kcal/mol (the average of DNA1 and DNA2), from which the ranking by the total contribution of the probe to the free energy of the dsDNA formation, , and the ranking by |ΔΔG|, using g as the reference, , were determined. The differences in ΔG between DNA2 (the G·C variant) and DNA1 (the A·T variant), , for g, a, and b were 0.4, −0.3, and 1.5 kcal/mol, respectively, from which the ratio of correct:incorrect signs of ΔΔGdna was determined: 1:2.
The maximum average convergence errors of the scaled interaction energies, , , , and (obtained from PMD1 and PMD2 simulations of dsDNAg, dsDNAa, dsDNAb, ssDNAg, ssDNAa, and ssDNAb) were, respectively, 0.3, 0.9, 0.7, and 1.1 kcal/mol (the average of DNA1 and DNA2). The maximum average convergence errors of ΔGvdw1, ΔGele1, ΔGele2, ΔGele, and ΔG were, respectively, 0.4, 1.5, 1.1, 2.0, and 2.2 kcal/mol (the average of DNA1 and DNA2). The maximum standard deviations of these free energies were, respectively, 0.3, 1.7, 1.2, 2.0, and 2.0 kcal/mol (the average of DNA1 and DNA2). The maximum spreads of these free energies were, respectively, 0.7, 3.9, 2.4, 4.8, and 4.4 kcal/mol (the average of DNA1 and DNA2). The ratios of low:medium:high uncertainties of these interaction and free energies were 3:1:0 and 1:3:1, respectively—as determined from the maximum average convergence errors using arbitrary, but judicious thresholds (kcal/mol): .
2.4. Correlations
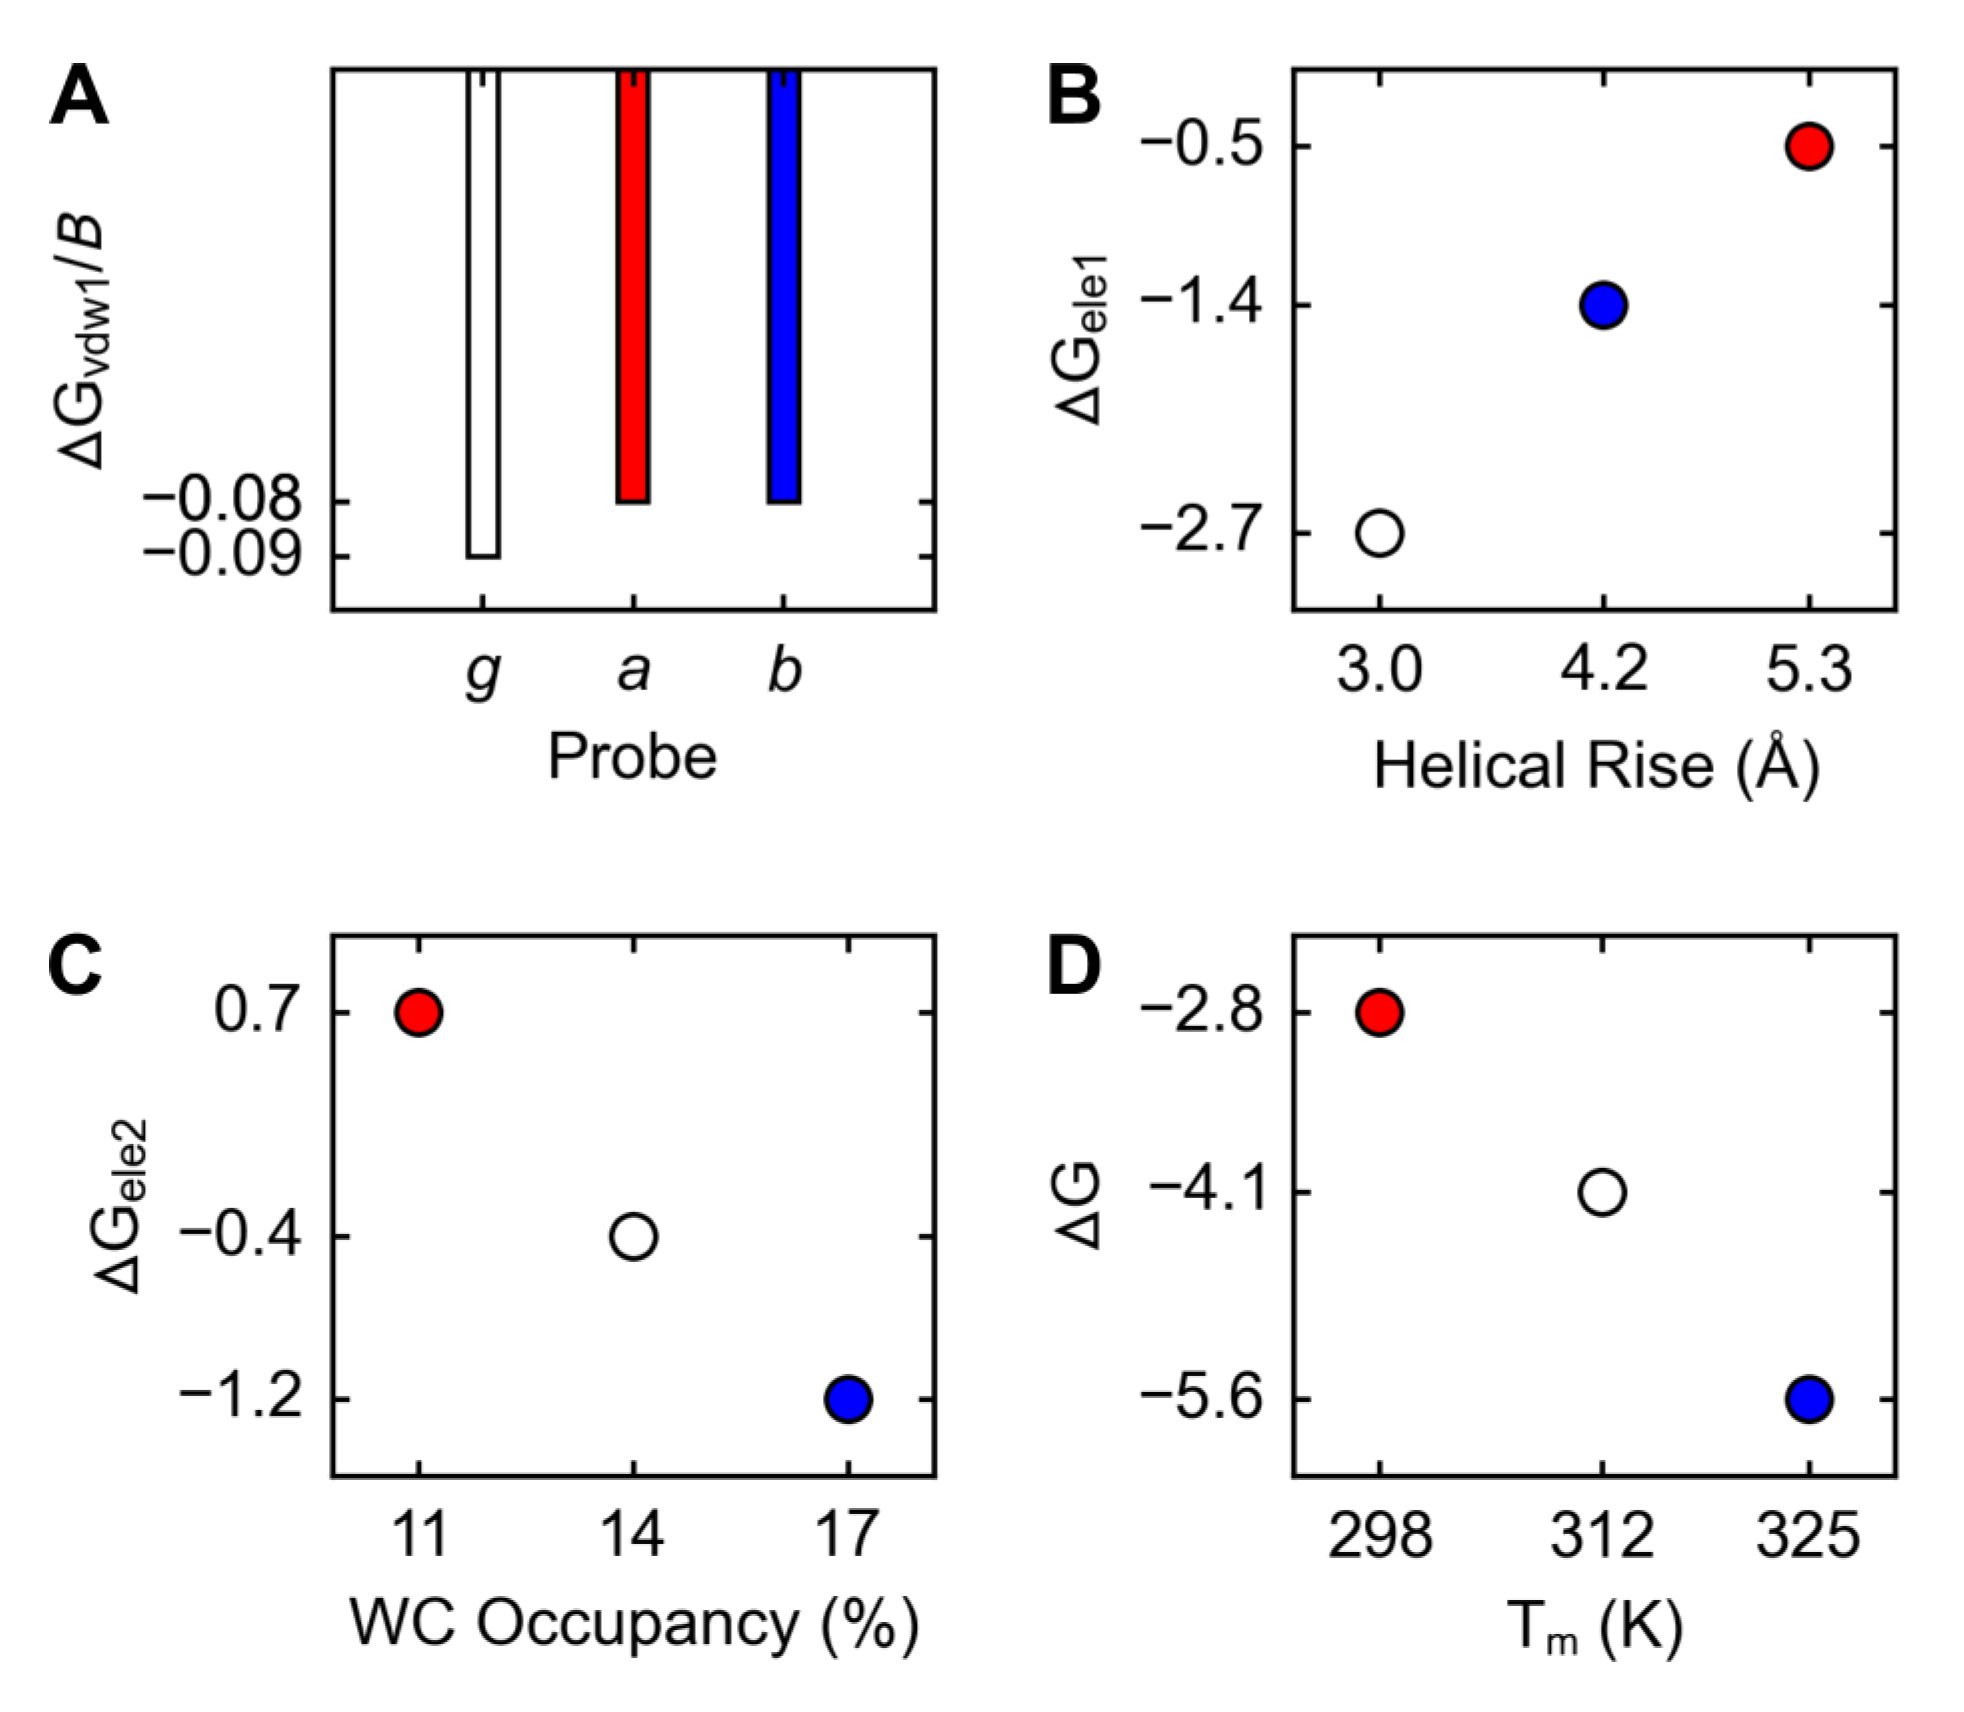
The ranking by bulkiness, , was the same as the inverse of the ranking by ΔGvdw1, ; hence, the bulkier the probe, the more favorable its non-electrostatic contribution to the free energy of dsDNA formation: , where u is 1 kcal/mol and B is the number of non-hydrogen atoms in the probe (Figure 4A). The ranking by disorder, , was the same as the ranking by ΔGele1; hence, the greater the disorder, the less favorable the electrostatic contribution from the polar state to the free energy of dsDNA formation: , where u is 1 kcal/(mol·Å) and D is the helical rise obtained from PMD1 structures (Figure 4B). The ranking by looseness, , was the same as the ranking by ΔGele2 (Figure 4C); hence, the greater the looseness, the less favorable the electrostatic contribution from the non-polar state to the free energy of dsDNA formation: , where u is 1 kcal/mol and L is the WC occupancy obtained from PMD2 structures. The ranking by ΔG, , was the same as the inverse of the ranking by Tm (melting temperature); hence, the more favorable the free energy of dsDNA formation, the higher the melting temperature: , where u is 1 mol·K/kcal (Figure 4D).
3. Discussion
3.1. Relationships between Structures, Free Energies, and Melting Temperatures
Now, let us bring to the reader’s attention the main question to which we seek answers in our present, theoretical work (in which we simulate the molecular dynamics of dsDNA decamers and ssDNA trimers—containing g, a, or b as the probe of non-bonded interactions—in aqueous solution), What are the structural and energetical causes, not only qualitatively but also quantitatively, of the experimentally observed differences in the thermal stability of dsDNAg, dsDNAa, and dsDNAb?, and let us offer the reader an answer: The differences in the melting temperatures () can be explained (1) structurally by the differences in bulkiness (; measured by the number of non-hydrogen atoms in the probe), disorder (; measured by the average length of the helical rise between the base pairs 4 and 5 in the ensemble of PMD structures of dsDNA generated with the probe in the natural, charged state 1), and looseness (; measured by the average occupancy of the WC hydrogen bonds between nucleobases belonging to the base pair 5 in the ensemble of PMD structures of dsDNA generated with the probe in the artificial, uncharged state 2), and (2) energetically by the differences in the non-electrostatic (; ΔGvdw1, calculated from the Lennard-Jones van der Waals interaction energies), electrostatic (; ΔGele1, calculated from the Coulombic interaction energies obtained for the ensemble of PMD structures generated with the probe in its natural, charged state 1), and preorganized electrostatic (; ΔGele2, calculated from the Coulombic interaction energies obtained for the ensemble of PMD structures generated with the probe in its artificial, uncharged state 2) free energy contributions of a given probe to the total free energies of dsDNA formation (; ΔG, calculated as the sum of ΔGvdw1, ΔGele1, and ΔGele2).
Thus, the three structural attributes, bulkiness (which anticorrelates linearly with ΔGvdw1), disorder (which correlates linearly with ΔGele1), and looseness (which correlates linearly with ΔGele2), determine ΔG (which correlates linearly with ΔGele2 and anticorrelates linearly with the melting temperature, Tm) as follows: the bulkier the nucleobase/adduct, and the less disordered the dsDNA, and the less loose the dsDNA, the higher the melting temperature. If the combined differences in the bulkiness (ΔGvdw1) and disorder (ΔGele1) reflect the differences in the favorability of stacking interactions of g, a, and b with the nucleobases of the neighboring base-pairs—which, in general, is a reasonable assumption [128]—our results are qualitatively in agreement with other studies [36,38,39,47] but quantitatively unprecedented (for our computational work is the first of this kind). If the differences in ΔGele2, quantified here for the first time, do indeed reflect the electrostatic preorganization of the WC hydrogen bonding interactions involving the nucleobases of the base pair 5, we have identified a hitherto unknown contribution to the differences in thermal stability, and the current view of the intactness of these interactions in both a and b adducts [36,39,47] might need to be reconsidered. However, compactness is the contrary to looseness, and what is compact, is put together closely, and thus the single best measure of looseness might be the distance between C1’ atoms of the base pair 5, which is the shortest in the NMR structure of dsDNAb [36] the longest in the NMR structure of dsDNAa [39] and intermediate in the standard B-DNA model of dsDNAg [121]. However, we did not find any explicit mentioning of these differences in the scientific literature. As for our PMD structures, they do, regardless of the charge state of the probe, preserve this ranking but only if we ignore our strict ST (significance threshold) of 0.3 Å. However, even if we do not ignore ST, which is our primary strategy, we can still clearly distinguish dsDNAa from dsDNAg from dsDNAb using this measure and so our current view is that the distance between C1’ atoms of the base pair 5 is indeed a useful indicator of looseness.
A peculiar feature of DNA1 is nWC (the intrastrand non-Watson-Crick hydrogen bond involving the formyl group of the FAPy moiety and the exocyclic amino group of the 3′-neighboring Ade) [36], which stabilizes the WC hydrogen-bonding interactions between the nucleobases in the base pairs 4–7 [36] but does not contribute to the differences in the melting temperature between DNA1,g, DNA1,a, and DNA1,b [39,47], even though, compared to a, nWC involving b is more stable [39], and even though, compared to ssDNA, nWC in dsDNA is more stable [47]. In addition, while our PMD1 and PMD2 structures do not show the experimentally observed stabilizing effect of nWC on WC in the base pairs 4–7, they do agree with the remaining three experimental observations concerning nWC. Moreover, if our relative nWC occupancies (calculated as percentual differences) are quantitatively correct, the cause of the difference in the stability between nWC involving a and b resides in the geometric preferences of the adducts (and not in the differences between dsDNA and ssDNA).
3.2. Errors
Every measurement, no matter whether experimental or theoretical, is associated with errors: perfect measurement is impossible: every measurement is only approximate. In general, however, compared to experimental measurements, theoretical, computational results are prone to larger errors, because the latter do not actually observe real phenomena, but merely simulate (imitate) them, and they do so by using simplified models. The combined LRA-LIE approach, as employed in our present work, is no exception, despite the physical soundness and beautiful simplicity of the expression for the calculation of ΔG as the sum of ΔGele1 (LRA), ΔGele2 (LRA), and ΔGvdw1 (LIE) contributions [125,126,127,129,130]. Simply put, it is extremely difficult to calculate absolute binding free energies [127,129]; and the larger the molecules involved, the more degrees of freedom, and the bigger the problem [131]. Besides the problem with obtaining accurate ΔG values, there is also the issue of assessing the uncertainty of the ΔG values themselves [127]. We use three uncertainty metrics, namely, (1) convergence errors [127] (calculated as differences between ΔG values obtained from the first and second halves of PMD simulations), (2) standard deviations (calculated from ΔG values obtained from four parallel sets of PMD simulations), and (3) spreads (calculated as maximum differences between four parallel sets of ΔG values). While high convergence errors would imply that our 5.0 ns PMD simulations are too short, high standard deviations would imply that our four parallel sets of PMD simulations are too few; and large spreads would illustrate the necessity of generating multiple parallel sets of PMD simulations. The uncertainties in the rankings of the free energy values are low (ΔGvdw1: and ; ΔGele1: ; ΔGele2: ), medium (ΔGele1: ; ΔG: ), and high (ΔGele2: ; ΔG: ), for the convergence errors smaller, similar (within ST of 0.3 kcal/mol), or greater than the unsigned free energies, and our confidence in the meaningfulness of the rankings are, correspondingly, high, medium, and low. However, no average convergence error in ΔGvdw1, ΔGele1, ΔGele2, and ΔG is greater than 0.4, 1.5, 1.1, and 2.2 kcal/mol, respectively, and, therefore, if we adopt 2.0 kcal/mol as the threshold of good convergence [127,130,132] only the convergence error of ΔG for DNAa, and only due to the convergence error of ΔG for DNA2,a, exceeds this good convergence threshold, and only by 0.2 kcal/mol. We would have to generate one or more additional sets of PMD simulations to lower the convergence error, but no improvement in the accuracy could be expected because our ΔG values for DNAg, DNAa, and DNAb are already perfectly linearly correlated with the corresponding melting temperatures.
3.3. Strengths and Weaknesses
Interpreting quantitative relationships based on three points requires extreme caution because the probability of fortuitous correlations is not negligible. We would like to emphasize that we use the original scaling parameters of the van der Waals () and electrostatic () interaction energies [127], because neither the refined scaling parameters (, , ) [133] nor free parametrization (all combinations of and from 0.000 to 1.000 by 0.001 increments) improves the linear correlation between the free energies and the corresponding melting temperatures, which is supportive of the physical meaning residing in the free energy contributions to ΔG, and we would caution against the use of and parameters as freely adjustable fudge factors if the purpose of obtaining binding free energies is truly scientific (Proclus): “For the task of science is the recognition of causes, and only when we recognize the causes of things do we say that we know them.” If the original and values do not result in a good agreement between the calculated free energies and the corresponding experimental quantities, it is, in our opinion, less likely, due to the lack of robustness of the combined LRA-LIE approach but, rather, due to a problem with the molecular model or due to an insufficient sampling of the configurational space. The latter is the probable reason why our ΔG rankings for DNA variants with swapped identities of the nucleobases in the base pair 6 with respect to DNA1 (T·A: ) and DNA2 (C·G: ) were incorrect (and therefore not included in the dataset used for the interpretation of the relationships between structures, free energies, and melting temperatures).
The reliability of this computational approach depends, to a certain extent, on the availability of the corresponding experimental quantities. In addition if the differences between the experimental quantities translate into sub-1.0 kcal/mol differences in the calculated free energies, such as, in our case of DNA1 vs. DNA2, it is difficult, if at all possible, to distinguish such small differences with high confidence, and the reason for this is, ultimately, as with any other computational or experimental technique, the detection limit, which is a function of both signal strength (sensitivity) and signal stability (noisiness). Only massively parallel PMD simulations would provide a definite answer about the true sensitivity and noisiness limits—and only for a given case, really, because the limits are partly case-specific—but such an undertaking is beyond the scope of our present work.
4. Materials and Methods
4.1. Structural Models
NMR structures of dsDNA decamers in B-conformation, PDB IDs 2KH3 [39] (a; model ID 1) and 1HM1 [36] (b; model ID 1) consisting of two complementary DNA strands (strand ID 1: 5′-CTATXYTTCA-3′, where X-5 is a or b, and Y-6 is Ade, A; and strand ID 2: 5′-TGAAZCATAG-3′, where Z-15 is Thy, T) were obtained from the Protein Data Bank [134], and named, for convenience, dsDNA1,a and dsDNA1,b, respectively; dsDNA2,a and dsDNA2,b were generated from their corresponding dsDNA1 models by replacing the original nucleobases Y-6 and Z-15 with Gua and Cyt, respectively, for the purpose of exploring two sequence-specific effects: (1) an intra-strand non-WC hydrogen bond involving the formyl group of the FAPy moiety and the exocyclic amino group of the 3′-neighboring Ade, but not the Gua, and (2) two vs. three WC hydrogen bonds involving the complementary nucleobases Y·Z (A·T vs. G·C). Four single-stranded DNA models (ssDNA1,a, ssDNA1,b, ssDNA2,a, and ssDNA2,b), were created by extracting the nucleotides 4–6 from the corresponding dsDNA models (5′-TXY-3′, where X-2 is a or b, and Y-3 is Ade or Gua); and these trimeric models were considered to be suitable approximations of the corresponding decameric strands 1 in the dissociated, single-stranded configuration [135,136]. The reference dsDNA1,g model in the standard B-conformation [121] was built using X3DNA 2.1 [122,123] (fiber −seq=CTATXYTTCA −b, where X-5 is Gua and Y-6 is Ade), and the three remaining models—dsDNA2,g, ssDNA1,g, and ssDNA2,g—were created analogously to the corresponding DNAa and DNAb models.
4.2. Energetical Models
Atom types, bond lengths, bond angles, torsion angles, and partial atomic charges of the natural nucleotides in the DNA models were described using the AMBER 95 Force Field [137,138]. The total charge of each 5′-terminal, non-terminal, and 3′-terminal natural nucleotide was, −0.3079, −1.0000, and −0.6921 e, respectively (amber11/data/leap/lib/DNA_CI.lib) [138]. Atom types, bond lengths, bond angles, and torsion angles of a and b were primarily described by the AMBER 95 Force Field [137], secondarily by the General AMBER Force Field (which is compatible with the AMBER 95 Force Field) [139], and tertiarily by the analogy to the AMBER 95 Force Field. Partial atomic charges of a and b were derived using the Restrained Electrostatic Potential (RESP) method [140], as implemented in AMBER 11 (resp −O −i resp.in −o resp.out −p resp.pch −t resp.chg −e esp) [138], applied to the quantum-mechanically calculated electrostatic potential (ESP) at the Hartree-Fock (HF) level of theory with 6-31G(d) basis set using Gaussian 09 (#HF 6−31G(d) opt scf = tight pop = MK iop(2/11 =1) iop(6/33 = 2)) [141] for 8-methyl-9-hydroxy-AFB1, with the carbon atom of the methyl group corresponding to the C1′ atom of the dRib to which the FAPy moiety is attached. The net charges of the methyl groups in 8-methyl-9-hydroxy-AFB1 were evenly distributed among all atoms of FAPy-N7-9-hydroxy-AFB1, and rounded to four decimal places; thus the original partial atomic charges of the dRib (including the atoms C1′ and H1′) and the net −1 e charge of X-5 nucleotide containing either a or b were preserved.
4.3. Solvation
The net −18 and −2 e charge of dsDNA and ssDNA models, respectively, was neutralized by an addition of 18 and 2 sodium ions (each with +1 e charge) on a grid surrounding the DNA: randomly, but not closer than 5 Å from any atom of the DNA, not farther than 18 Å from the geometrical center of the DNA, and not closer than 6 Å from each other. The resulting electroneutral complexes, composed of DNA and sodium ions, were immersed in a spherical grid—being centered at the geometrical center of DNA and having 28 Å in radius—of TIP3P water molecules [142] using the preparation program Qprep (version 5.03) from the molecular dynamics package Q (version 5.0) [124].
4.4. Simulation
The variable parts of the DNAg, DNAa, and DNAb models—i.e., g (15 atoms; net charge −0.0888 e), a (54 atoms; net charge −0.0888 e), and b (54 atoms; net charge −0.0888 e)—would be used as the probes (Tables S2 and S3; Figure S1), for which their van der Waals interaction energies (Evdw), modeled using Lennard-Jones potential, and their electrostatic interaction energies (Eele), modeled according to the Coulomb’s law, with all the components of the surrounding environment—i.e., with the probe-less part of the DNA, the ions, and all the water molecules—would be collected from MD simulations for these are the potential energies from which the van der Waals (ΔGvdw) and electrostatic (ΔGele) contributions of the probe to the free energy of dsDNA formation (ΔG) would be obtained. MD simulations would be performed, separately, using the normally charged probe (state ID 1) and the uncharged probe (state ID 2; with all partial atomic charges set to 0 e), and the charged probe would be used for collecting Evdw1, Eele1, and Eele2, where the integers 1 and 2 denote the simulated state.
The solvated DNA models, containing the probe in the state 1, were prepared for the subsequent collecting of structures and energies by a well-tried, continuous series of 12 equilibrating MD simulations (EMD) [143] using the simulation program Qdyn (version 5.04) from the molecular dynamics simulation package Q (Table S4): Water molecules were subjected to the surface-constraint all-atom solvent (SCAAS)-type boundary conditions [124]. DNA was prevented from moving toward the boundary of the simulation sphere, but not hindered in its tumbling motion, by being restrained to its geometrical center with a force constant of 2.0 kcal/(mol·Å2) (dsDNA), or by having the C1′ atom of the nucleotide X-2 restrained to its initial coordinates with a force constant of 50 kcal/(mol·Å2) (ssDNA). No cut-off was applied to non-bonded interactions involving the atoms of the probe. Non-bonded interactions between atoms not belonging to the probe were evaluated explicitly and using the Local Reaction Field method for distances ⩽ and > 10 Å, respectively. Four parallel equilibrations were generated for each solvated DNA model by executing the equilibrating MD simulation protocol with four different values of the seed for the pseudo-random number generator (which is used by Qdyn to generate initial velocities). The collecting of structures (every 1.0 ps) and energies (every 0.02 ps) was performed in the last 5000 ps of 5000 ps (with the probe being in the state 1) and 5500 ps (with the probe being in the state 2) of 96 producing MD simulations (PMD1 and PMD2), each of which was a natural continuation of the 12th EMD simulation (ensemble, constant NVT; temperature, 298.15 K; step size, 2 fs; bonds involving hydrogen atoms restrained using the SHAKE algorithm). Hence, 5000/250,000 and 480,000/24,000,000 structural/energetical configurations were harvested per PMD simulation and in total, respectively.
4.5. Visualization
4.6. Measurement
The size of the probe was determined by the number of non-hydrogen atoms constituting the probe. Every 10th PMD structure was characterized—based on three attributes of bodies: locality, length, and angularity—using X3DNA. The presence of hydrogen-bonding interactions—both WC (involving complementary nucleobases, including FAPy) and non-WC (involving the formyl group of the FAPy moiety and the exocyclic amino group of the 3′-neighboring Ade)—was determined, for every PMD structure, using hydrogen ⋯ acceptor distance (⩽2.5 Å) and donor–hydrogen ⋯ acceptor angle (⩾135°) criteria, and hydrogen-bonding occupancies were calculated as fractions of the structures in the ensemble that satisfied these arbitrary, but stringent, geometrical standards for hydrogen-bonding [146]. The conformation of Cyt-16 in PMD structures of dsDNA was classified as perturbed when the distance between the geometrical centers of Cyt-16 and Gua- or FAPy-5 exceeded our arbitrary, but judicious, threshold of 8.0 Å.
The contribution of the probe to the absolute free energy of dsDNA formation was calculated from the average Evdw1, Eele1, and Eele2 interaction energies (), which were extracted from the collections of energies from PMD simulations of dsDNA (ds) and ssDNA (ss) models using Qfep (version 5.01) from the molecular dynamics simulation package Q as follows (Equations (1)–(4)): [125]
where and [127,131]. The relative free energies of dsDNAg, dsDNAa, and dsDNAb formation were calculated as differences between the corresponding absolute free energies (Equation (5)):
where f is either a or b.
The structural and energetical quantities obtained from parallel PMD simulations were simply averaged. The rounding error was set, arbitrarily, but judiciously, to 0.1 Å for distances, 1.0° for angles, 1.0% for occupancies, and 0.1 kcal/mol for energies. The average energetical quantities were also calculated (1) separately for each of the four parallel sets of PMD simulations (for the purpose of assessing non-cumulative uncertainties in these quantities as standard deviations and spreads), and (2) separately for the first and last 130,000 energies (for the purpose of assessing non-cumulative convergences of these quantities as differences between the two averages). An arbitrary, but judicious, significance threshold (ST) of three times the rounding error was set for the structural and energetical differences between the DNA models distinguished by the identities of X-5, Y-6, and Z-15 nucleotides. The rankings of the DNA models according to the structural and energetical quantities, produced from the sums of integer significance scores obtained from the matrices of differences () between the DNA models (−1, if ; 0, if ; 1, if ), were compared with each other and with the ranking according to the experimental Tm (). In the cases of matching rankings, linear correlation coefficients (R2; ST set to 0.96) were calculated by comparing the actual quantities, for the purpose of which only one set of experimental Tm values—representing, approximately (within the experimental error of 1 K), the average of DNA1 and DNA2—was used: K, K, and K, indicating that Tm,g lies, approximately, in the middle between Tm,a ( K) and Tm,b ( K) [39,47].
5. Conclusions
Having identified the general attributes of a (bulky), b (as bulky as a), dsDNAa (disordered and loose) and dsDNAb (disordered, but less than dsDNAa, and compact), and thus having answered our main question, we ask ourselves: (1) How do the attributes of thermal (de)stabilization modulate (i) the efficiency and fidelity of the bypass of these lesions by the translesion-synthesis DNA polymerase (which “preferentially misincorporates Ade opposite the lesion [64,65],” suggesting that this polymerase is “responsible for the predominant G·C→T·A mutation” induced by FAPy-AFB1 adducts) [64,65], (ii) the recognition of these lesions by the global-genome-repair-specific XPC-HR23B complex (which “screens the genome for damage on the basis of disrupted base-pairing instead of lesions per se”) [88], and (iii) the subsequent dual incision (which is the “rate-limiting step of the nucleotide excision repair [86],” and which releases an oligonucleotide containing the lesion) [147], and (2) why is the thermal stabilization of DNA duplex by b (which is the dominant FAPy-N7-9-hydroxy-AFB1 adduct in genomic DNA) [54] not common among bulky-and-intercalated-but-not-cross-linked DNA adducts [36]? These questions remain to be answered by future experimental and theoretical studies.
Supplementary Materials
The following are available online, Table S1: Contributions of the probes (g, a, or b) to the absolute free energy of dsDNA formation (kcal/mol), Table S2: Atom types and partial atomic charges of the Gua probe, Table S3: Atom types and partial atomic charges of the α- and β-FAPy-N7-9-hydroxy-AFB1 probes, Table S4: Parameters of 12-stage equilibrating molecular dynamics (EMD) simulations, Figure S1: Atom identifiers of the probes.
Author Contributions
Conceptualization, U.B.; Formal analysis, M.K.; Funding acquisition, U.B.; Investigation, M.K.; Project administration, U.B.; Resources, U.B.; Supervision, U.B.; Visualization, M.K.; Writing—original draft, M.K.; Writing—review & editing, M.K. and U.B.
Funding
This research was funded by the Slovenian Research Agency project grant J1-6736 and by the Slovenian Ministry of Education, Science and Sport program grant F4F.
Conflicts of Interest
The authors declare no conflict of interest.
Abbreviations
The following abbreviations are used in this manuscript:
| AFB1 | aflatoxin (Aspergillus flavus toxin) B1 |
| a | α-FAPy-N7-9-hydroxy-AFB1 |
| b | β-FAPy-N7-9-hydroxy-AFB1 |
| g | Gua |
| AFB1-E | exo-8,9-epoxide of AFB1 |
| dsDNA | double-stranded DNA |
| ΔΔG | relative free energy of dsDNA formation |
| ΔG | contribution of a probe (g, a, or b) to the absolute free energy of dsDNA formation |
| EMD | equilibrating MD simulation |
| FAPy | formamidopyrimidine |
| LIE | linear interaction energy |
| LRA | linear response approximation |
| MD | molecular dynamics |
| PMD | producing MD simulation |
| ssDNA | single-stranded DNA |
| Tm | melting temperature |
| WC | Watson-Crick |
References
- Asao, T.; Buchi, G.; Abdel-Kader, M.M.; Chang, S.B.; Wick, E.L.; Wogan, G.N. Aflatoxins B and G. J. Am. Chem. Soc. 1963, 85, 1706–1707. [Google Scholar] [CrossRef]
- Asao, T.; Buechi, G.; Abdel-Kader, M.M.; Chang, S.B.; Wick, E.L.; Wogan, G.N. The structures of aflatoxins B and G. J. Am. Chem. Soc. 1965, 87, 882–886. [Google Scholar] [CrossRef] [PubMed]
- Nesbitt, B.F.; O’Kelly, J.; Sargeant, K.; Sheridan, A. Aspergillus flavus and turkey X disease. Toxic metabolites of Aspergillus flavus. Nature 1962, 195, 1062–1063. [Google Scholar] [CrossRef]
- Sargeant, K.; Sheridan, A.; O’Kelly, J.; Carnaghan, R.B.A. Toxicity associated with certain samples of groundnuts. Nature 1961, 192, 1096–1097. [Google Scholar] [CrossRef]
- Codner, R.C.; Sargeant, K.; Yeo, R. Production of aflatoxin by the culture of strains of Aspergillus flavus–oryzae on sterilized peanuts. Biotechnol. Bioeng. 1963, 5, 185–192. [Google Scholar] [CrossRef]
- Kurtzman, C.P.; Horn, B.W.; Hesseltine, C.W. Aspergillus nomius, a new aflatoxin-producing species related to Aspergillus flavus and Aspergillus tamarii. Antonie van Leeuwenhoek 1987, 53, 147–158. [Google Scholar] [CrossRef]
- Klich, M.A.; Mullaney, E.J.; Daly, C.B.; Cary, J.W. Molecular and physiological aspects of aflatoxin and sterigmatocystin biosynthesis by Aspergillus tamarii and A. ochraceoroseus. Appl. Microbiol. Biotechnol. 2000, 53, 605–609. [Google Scholar] [CrossRef] [PubMed]
- Frisvad, J.C.; Skouboe, P.; Samson, R.A. Taxonomic comparison of three different groups of aflatoxin producers and a new efficient producer of aflatoxin B1, sterigmatocystin and 3-O-methylsterigmatocystin, Aspergillus rambellii sp. nov. Syst. Appl. Microbiol. 2005, 28, 442–453. [Google Scholar] [CrossRef] [PubMed]
- Varga, J.; Frisvad, J.C.; Samson, R.A. Two new aflatoxin producing species, and an overview of Aspergillus section Flavi. Stud. Mycol. 2011, 69, 57–80. [Google Scholar] [CrossRef]
- Carvajal-Campos, A.; Manizan, A.L.; Tadrist, S.; Akaki, D.K.; Koffi-Nevry, R.; Moore, G.G.; Fapohunda, S.O.; Bailly, S.; Montet, D.; Oswald, I.P.; et al. Aspergillus korhogoensis, a novel aflatoxin producing species from the Côte d’Ivoire. Toxins 2017, 9, 353. [Google Scholar] [CrossRef]
- Hesseltine, C.W.; Shotwell, O.L.; Ellis, J.J.; Stubblefield, R.D. Aflatoxin formation by Aspergillus flavus. Bacteriol. Rev. 1966, 30, 795–805. [Google Scholar] [PubMed]
- Battilani, P.; Toscano, P.; Van der Fels-Klerx, H.J.; Moretti, A.; Camardo Leggieri, M.; Brera, C.; Rortais, A.; Goumperis, T.; Robinson, T. Aflatoxin B1 contamination in maize in Europe increases due to climate change. Sci. Rep. 2016, 6, 24328. [Google Scholar] [CrossRef] [PubMed]
- Legator, M.S.; Zuffante, S.M.; Harp, A.R. Aflatoxin: Effect on cultured heteroploid human embryonic lung cells. Nature 1965, 208, 345–347. [Google Scholar] [CrossRef] [PubMed]
- Schoental, R. Hepatotoxic activity of retrorsine, senkirkine and hydroxysenkirkine in newborn rats, and the role of epoxides in carcinogenesis by pyrrolizidine alkaloids and aflatoxins. Nature 1970, 227, 401–402. [Google Scholar] [CrossRef] [PubMed]
- Garner, R.C. Chemical evidence for the formation of a reactive aflatoxin B1 metabolite, by hamster liver microsomes. FEBS Lett. 1973, 36, 261–264. [Google Scholar] [CrossRef]
- Swenson, D.H.; Miller, J.A.; Miller, E.C. 2,3-Dihydro-2,3-dihydroxy-aflatoxin B1: An acid hydrolysis product of an RNA–aflatoxin B1 adduct formed by hamster and rat liver microsomes in vitro. Biochem. Biophys. Res. Commun. 1973, 53, 1260–1267. [Google Scholar] [CrossRef]
- Swenson, D.H.; Miller, E.C.; Miller, J.A. Aflatoxin B1-2,3-oxide: Evidence for its formation in rat liver in vivo and by human liver microsomes in vitro. Biochem. Biophys. Res. Commun. 1974, 60, 1036–1043. [Google Scholar] [CrossRef]
- Baertschi, S.W.; Raney, K.D.; Shimada, T.; Harris, T.M.; Guengerich, F.P. Comparison of rates of enzymatic oxidation of aflatoxin B1, aflatoxin G1, and sterigmatocystin and activities of the epoxides in forming guanyl-N7 adducts and inducing different genetic responses. Chem. Res. Toxicol. 1989, 2, 114–122. [Google Scholar] [CrossRef] [PubMed]
- Shimada, T.; Guengerich, F.P. Evidence for cytochrome P-450NF, the nifedipine oxidase, being the principal enzyme involved in the bioactivation of aflatoxins in human liver. Proc. Natl. Acad. Sci. USA 1989, 86, 462–465. [Google Scholar] [CrossRef]
- Forrester, L.M.; Neal, G.E.; Judah, D.J.; Glancey, M.J.; Wolf, C.R. Evidence for involvement of multiple forms of cytochrome P-450 in aflatoxin B1 metabolism in human liver. Proc. Natl. Acad. Sci. USA 1990, 87, 8306–8310. [Google Scholar] [CrossRef]
- Kamdem, L.K.; Meineke, I.; Gödtel-Armbrust, U.; Brockmöller, J.; Wojnowski, L. Dominant contribution of P450 3A4 to the hepatic carcinogenic activation of aflatoxin B1. Chem. Res. Toxicol. 2006, 19, 577–586. [Google Scholar] [CrossRef] [PubMed]
- He, X.Y.; Tang, L.; Wang, S.L.; Cai, Q.S.; Wang, J.S.; Hong, J.Y. Efficient activation of aflatoxin B1 by cytochrome P450 2A13, an enzyme predominantly expressed in human respiratory tract. Int. J. Cancer 2006, 118, 2665–2671. [Google Scholar] [CrossRef] [PubMed]
- Roy, A.K. Effects of aflatoxin B1 on polysomal profiles and RNA synthesis in rat liver. Biochim. Biophys. Acta 1968, 169, 206–211. [Google Scholar] [CrossRef]
- Goodall, C.M.; Butler, W.H. Aflatoxin carcinogenesis: Inhibition of liver cancer induction in hypophysectomized rats. Int. J. Cancer 1969, 4, 422–429. [Google Scholar] [CrossRef] [PubMed]
- Edwards, G.S.; Wogan, G.N. Aflatoxin inhibition of template activity of rat liver chromatin. Biochim. Biophys. Acta 1970, 224, 597–607. [Google Scholar] [CrossRef]
- Saunders, F.C.; Barker, E.A.; Smuckler, E.A. Selective inhibition of nucleoplasmic rat liver DNA-dependent RNA polymerase by aflatoxin B1. Cancer Res. 1972, 32, 2487–2494. [Google Scholar] [PubMed]
- Ames, B.N.; Durston, W.E.; Yamasaki, E.; Lee, F.D. Carcinogens are mutagens: A simple test system combining liver homogenates for activation and bacteria for detection. Proc. Natl. Acad. Sci. USA 1973, 70, 2281–2285. [Google Scholar] [CrossRef]
- Raney, V.M.; Harris, T.M.; Stone, M.P. DNA conformation mediates aflatoxin B1-DNA binding and the formation of guanine N7 adducts by aflatoxin B1 8,9-exo-epoxide. Chem. Res. Toxicol. 1993, 6, 64–68. [Google Scholar] [CrossRef]
- Johnson, W.W.; Guengerich, F.P. Reaction of aflatoxin B1 exo-8,9-epoxide with DNA: Kinetic analysis of covalent binding and DNA-induced hydrolysis. Proc. Natl. Acad. Sci. USA 1997, 94, 6121–6125. [Google Scholar] [CrossRef]
- Bren, U.; Guengerich, F.P.; Mavri, J. Guanine alkylation by the potent carcinogen aflatoxin B1: Quantum chemical calculations. Chem. Res. Toxicol. 2007, 20, 1134–1140. [Google Scholar] [CrossRef]
- Brown, K.L.; Bren, U.; Stone, M.P.; Guengerich, F.P. Inherent stereospecificity in the reaction of aflatoxin B1 8,9-epoxide with deoxyguanosine and efficiency of DNA catalysis. Chem. Res. Toxicol. 2009, 22, 913–917. [Google Scholar] [CrossRef]
- Bhat, N.K.; Emeh, J.K.; Niranjan, B.G.; Avadhani, N.G. Inhibition of mitochondrial protein synthesis during early stages of aflatoxin B1-induced hepatocarcinogenesis. Cancer Res. 1982, 42, 1876–1880. [Google Scholar] [PubMed]
- Gopalakrishnan, S.; Byrd, S.; Stone, M.P.; Harris, T.M. Carcinogen-nucleic acid interactions: Equilibrium binding studies of aflatoxin B1 with the oligodeoxynucleotide d(ATGCAT)2 and with plasmid pBR322 support intercalative association with the B-DNA helix. Biochemistry 1989, 28, 726–734. [Google Scholar] [CrossRef] [PubMed]
- Gopalakrishnan, S.; Harris, T.M.; Stone, M.P. Intercalation of aflatoxin B1 in two oligodeoxynucleotide adducts: Comparative 1H NMR analysis of d(ATCAFBGAT)·d(ATCGAT) and d(ATAFBGCAT)2. Biochemistry 1990, 29, 10438–10448. [Google Scholar] [CrossRef]
- Johnston, D.S.; Stone, M.P. Refined solution structure of 8,9-dihydro-8-(N7-guanyl)-9-hydroxyaflatoxin B1 opposite CpA in the complementary strand of an oligodeoxynucleotide duplex as determined by 1H NMR. Biochemistry 1995, 34, 14037–14050. [Google Scholar] [CrossRef]
- Mao, H.; Deng, Z.; Wang, F.; Harris, T.M.; Stone, M.P. An intercalated and thermally stable FAPY adduct of aflatoxin B1 in a DNA duplex: Structural refinement from 1H NMR. Biochemistry 1998, 37, 4374–4387. [Google Scholar] [CrossRef] [PubMed]
- Nakatani, K.; Matsuno, T.; Adachi, K.; Hagihara, S.; Saito, I. Selective intercalation of charge neutral intercalators into GG and CG steps: Implication of HOMO-LUMO interaction for sequence-selective drug intercalation into DNA. J. Am. Chem. Soc. 2001, 123, 5695–5702. [Google Scholar] [CrossRef]
- Giri, I.; Stone, M.P. Thermal stabilization of the DNA duplex by adducts of aflatoxin B1. Biopolymers 2002, 65, 190–201. [Google Scholar] [CrossRef]
- Brown, K.L.; Voehler, M.W.; Magee, S.M.; Harris, C.M.; Harris, T.M.; Stone, M.P. Structural perturbations induced by the α-anomer of the aflatoxin B1 formamidopyrimidine adduct in duplex and single-strand DNA. J. Am. Chem. Soc. 2009, 131, 16096–16107. [Google Scholar] [CrossRef]
- Croy, R.G.; Essigmann, J.M.; Reinhold, V.N.; Wogan, G.N. Identification of the principal aflatoxin B1–DNA adduct formed in vivo in rat liver. Proc. Natl. Acad. Sci. USA 1978, 75, 1745–1749. [Google Scholar] [CrossRef]
- Lamm, G.; Pack, G.R. Acidic domains around nucleic acids. Proc. Natl. Acad. Sci. USA 1990, 87, 9033–9036. [Google Scholar] [CrossRef] [PubMed]
- Essigmann, J.M.; Croy, R.G.; Nadzan, A.M.; Busby, W.F., Jr.; Reinhold, V.N.; Büchi, G.; Wogan, G.N. Structural identification of the major DNA adduct formed by aflatoxin B1 in vitro. Proc. Natl. Acad. Sci. USA 1977, 74, 1870–1874. [Google Scholar] [CrossRef] [PubMed]
- Lin, J.K.; Miller, J.A.; Miller, E.C. 2,3-Dihydro-2-(guan-7-yl)-3-hydroxy-aflatoxin B1, a major acid hydrolysis product of aflatoxin B1–DNA or –ribosomal RNA adducts formed in hepatic microsome-mediated reactions and in rat liver in vivo. Cancer Res. 1977, 37, 4430–4438. [Google Scholar] [PubMed]
- Martin, C.N.; Garner, R.C. Aflatoxin B-oxide generated by chemical or enzymic oxidation of aflatoxin B1 causes guanine substitution in nucleic acids. Nature 1977, 267, 863–865. [Google Scholar] [CrossRef] [PubMed]
- Stark, A.A.; Essigmann, J.M.; Demain, A.L.; Skopek, T.R.; Wogan, G.N. Aflatoxin B1 mutagenesis, DNA binding, and adduct formation in Salmonella typhimurium. Proc. Natl. Acad. Sci. USA 1979, 76, 1343–1347. [Google Scholar] [CrossRef] [PubMed]
- Bailey, E.A.; Iyer, R.S.; Stone, M.P.; Harris, T.M.; Essigmann, J.M. Mutational properties of the primary aflatoxin B1–DNA adduct. Proc. Natl. Acad. Sci. USA 1996, 93, 1535–1539. [Google Scholar] [CrossRef] [PubMed]
- Li, L.; Brown, K.L.; Ma, R.; Stone, M.P. DNA sequence modulates geometrical isomerism of the trans-8,9-dihydro-8-(2,6-diamino-4-oxo-3,4-dihydropyrimid-5-yl-formamido)-9-hydroxy aflatoxin B1 adduct. Chem. Res. Toxicol. 2015, 28, 225–237. [Google Scholar] [CrossRef]
- Chu, Y.H.; Saffhill, R. Errors in DNA synthesis induced by aflatoxin B1 modification of poly(dC-dG). Carcinogenesis 1983, 4, 643–646. [Google Scholar] [CrossRef]
- Foster, P.L.; Eisenstadt, E.; Miller, J.H. Base substitution mutations induced by metabolically activated aflatoxin B1. Proc. Natl. Acad. Sci. USA 1983, 80, 2695–2698. [Google Scholar] [CrossRef]
- Refolo, L.M.; Conley, M.P.; Sambamurti, K.; Jacobsen, J.S.; Humayun, M.Z. Sequence context effects in DNA replication blocks induced by aflatoxin B1. Proc. Natl. Acad. Sci. USA 1985, 82, 3096–3100. [Google Scholar] [CrossRef]
- Leadon, S.A.; Tyrrell, R.M.; Cerutti, P.A. Excision repair of aflatoxin B1–DNA adducts in human fibroblasts. Cancer Res. 1981, 41, 5125–5129. [Google Scholar] [PubMed]
- Chetsanga, C.J.; Frenette, G.P. Excision of aflatoxin B1–imidazole ring opened guanine adducts from DNA by formamidopyrimidine-DNA glycosylase. Carcinogenesis 1983, 4, 997–1000. [Google Scholar] [CrossRef]
- Smela, M.E.; Hamm, M.L.; Henderson, P.T.; Harris, C.M.; Thomas, H.M.; Essigmann, J.M. The aflatoxin B1 formamidopyrimidine adduct plays a major role in causing the types of mutations observed in human hepatocellular carcinoma. Proc. Natl. Acad. Sci. USA 2002, 99, 6655–6660. [Google Scholar] [CrossRef] [PubMed]
- Brown, K.L.; Deng, J.Z.; Iyer, R.S.; Iyer, L.G.; Voehler, M.W.; Stone, M.P.; Harris, C.M.; Harris, T.M. Unraveling the aflatoxin–FAPY conundrum: Structural basis for differential replicative processing of isomeric forms of the formamidopyrimidine-type DNA adduct of aflatoxin B1. J. Am. Chem. Soc. 2006, 128, 15188–15199. [Google Scholar] [CrossRef] [PubMed]
- Gabliks, J.; Schaeffer, W.; Friedman, L.; Wogan, G. Effect of aflatoxin B1 on cell cultures. J. Bacteriol. 1965, 90, 720–723. [Google Scholar] [PubMed]
- Legator, M. Biological effects of aflatoxin in cell culture. Bacteriol. Rev. 1966, 30, 471–477. [Google Scholar] [PubMed]
- Lillehoj, E.B.; Ciegler, A. Inhibition of deoxyribonucleic acid synthesis in Flavobacterium aurantiacum by aflatoxin B1. J. Bacteriol. 1967, 94, 787–788. [Google Scholar] [PubMed]
- Wragg, J.B.; Ross, V.C.; Legator, M.S. Effect of aflatoxin B1 on the deoxyribonucleic acid polymerase of Escherichia coli. Proc. Soc. Exp. Biol. Med. 1967, 125, 1052–1055. [Google Scholar] [CrossRef] [PubMed]
- Harley, E.H.; Rees, K.R.; Cohen, A. A comparative study of the effect of aflatoxin B1 and actinomycin D on HeLa cells. Biochem. J. 1969, 114, 289–298. [Google Scholar] [CrossRef] [PubMed]
- Lafarge, C.; Frayssinet, C. The reversibility of inhibition of RNA and DNA synthesis induced by aflatoxin in rat liver. A tentative explanation for carcinogenic mechanism. Int. J. Cancer 1970, 6, 74–83. [Google Scholar] [CrossRef] [PubMed]
- Maher, V.M.; Summers, W.C. Mutagenic action of aflatoxin B1 on transforming DNA and inhibition of DNA template activity in vitro. Nature 1970, 225, 68–70. [Google Scholar] [CrossRef] [PubMed]
- Shieh, J.C.; Song, P.S. Photochemically induced binding of aflatoxins to DNA and its effects on template activity. Cancer Res. 1980, 40, 689–695. [Google Scholar] [PubMed]
- Johnston, D.S.; Stone, M.P. Replication of a site-specific trans-8,9-dihydro-8-(N7-guanyl)-9-hydroxyaflatoxin B1 adduct by the exonuclease deficient Klenow fragment of DNA polymerase I. Chem. Res. Toxicol. 2000, 13, 1158–1164. [Google Scholar] [CrossRef] [PubMed]
- Lin, Y.C.; Li, L.; Makarova, A.V.; Burgers, P.M.; Stone, M.P.; Lloyd, R.S. Molecular basis of aflatoxin-induced mutagenesis-role of the aflatoxin B1–formamidopyrimidine adduct. Carcinogenesis 2014, 35, 1461–1468. [Google Scholar] [CrossRef] [PubMed]
- Lin, Y.C.; Owen, N.; Minko, I.G.; Lange, S.S.; Li, L.; Stone, M.P.; Wood, R.D.; McCullough, A.K.; Lloyd, R.S. DNA polymerase ζ limits chromosomal damage and promotes cell survival following aflatoxin exposure. Proc. Natl. Acad. Sci. USA 2016, 113, 13774–13779. [Google Scholar] [CrossRef] [PubMed]
- Gelboin, H.V.; Wortham, J.S.; Wilson, R.G.; Friedman, M.; Wogan, G.N. Rapid and marked inhibition of rat-liver RNA polymerase by aflatoxin B1. Science 1966, 154, 1205–1206. [Google Scholar] [CrossRef] [PubMed]
- Sporn, M.B.; Dingman, C.W.; Phelps, H.L.; Wogan, G.N. Aflatoxin B1: Binding to DNA in vitro and alteration of RNA metabolism in vivo. Science 1966, 151, 1539–1541. [Google Scholar] [CrossRef]
- Clifford, J.I.; Rees, K.R. The action of aflatoxin B1 on the rat liver. Biochem. J. 1967, 102, 65–75. [Google Scholar] [CrossRef]
- Neal, G.E. The effect of aflatoxin B1 on normal and cortisol-stimulated rat liver ribonucleic acid synthesis. Biochem. J. 1972, 130, 619–629. [Google Scholar] [CrossRef]
- Bressac, B.; Kew, M.; Wands, J.; Ozturk, M. Selective G to T mutations of p53 gene in hepatocellular carcinoma from southern Africa. Nature 1991, 350, 429–431. [Google Scholar] [CrossRef]
- Hsu, I.C.; Metcalf, R.A.; Sun, T.; Welsh, J.A.; Wang, N.J.; Harris, C.C. Mutational hotspot in the p53 gene in human hepatocellular carcinomas. Nature 1991, 350, 427–428. [Google Scholar] [CrossRef] [PubMed]
- Fujimoto, Y.; Hampton, L.L.; Luo, L.D.; Wirth, P.J.; Thorgeirsson, S.S. Low frequency of p53 gene mutation in tumors induced by aflatoxin B1 in nonhuman primates. Cancer Res. 1992, 52, 1044–1046. [Google Scholar] [PubMed]
- Aguilar, F.; Hussain, S.P.; Cerutti, P. Aflatoxin B1 induces the transversion of G→T in codon 249 of the p53 tumor suppressor gene in human hepatocytes. Proc. Natl. Acad. Sci. USA 1993, 90, 8586–8590. [Google Scholar] [CrossRef] [PubMed]
- Cariello, N.F.; Cui, L.; Skopek, T.R. In vitro mutational spectrum of aflatoxin B1 in the human hypoxanthine guanine phosphoribosyltransferase gene. Cancer Res. 1994, 54, 4436–4441. [Google Scholar] [PubMed]
- Yang, M.; Zhou, H.; Kong, R.Y.; Fong, W.F.; Ren, L.Q.; Liao, X.H.; Wang, Y.; Zhuang, W.; Yang, S. Mutations at codon 249 of p53 gene in human hepatocellular carcinomas from Tongan, China. Mutat. Res. 1997, 381, 25–29. [Google Scholar] [CrossRef]
- Courtemanche, C.; Anderson, A. Multiple mutations in a shuttle vector modified by ultraviolet irradiation, (±)-7β,8α-dihydroxy-9α,10α-epoxy-7,8,9,10-tetrahydrobenzo[a]pyrene, and aflatoxin B1 have different properties than single mutations and may be generated during translesion synthesis. Mutat. Res. 1999, 430, 23–36. [Google Scholar] [PubMed]
- Denissenko, M.F.; Cahill, J.; Koudriakova, T.B.; Gerber, N.; Pfeifer, G.P. Quantitation and mapping of aflatoxin B1-induced DNA damage in genomic DNA using aflatoxin B1-8,9-epoxide and microsomal activation systems. Mutat. Res. 1999, 425, 205–211. [Google Scholar] [CrossRef]
- Pineau, P.; Marchio, A.; Battiston, C.; Cordina, E.; Russo, A.; Terris, B.; Qin, L.X.; Turlin, B.; Tang, Z.Y.; Mazzaferro, V.; et al. Chromosome instability in human hepatocellular carcinoma depends on p53 status and aflatoxin exposure. Mutat. Res. 2008, 653, 6–13. [Google Scholar] [CrossRef]
- Paget, V.; Lechevrel, M.; Andre, V.; Goff, J.L.; Pottier, D.; Billet, S.; Garçon, G.; Shirali, P.; Sichel, F. Benzo[a]pyrene, aflatoxin B1 and acetaldehyde mutational patterns in TP53 gene using a functional assay: Relevance to human cancer aetiology. PLoS ONE 2012, 7, e30921. [Google Scholar] [CrossRef]
- Chawanthayatham, S.; Valentine, C.C.; Fedeles, B.I.; Fox, E.J.; Loeb, L.A.; Levine, S.S.; Slocum, S.L.; Wogan, G.N.; Croy, R.G.; Essigmann, J.M. Mutational spectra of aflatoxin B1 in vivo establish biomarkers of exposure for human hepatocellular carcinoma. Proc. Natl. Acad. Sci. USA 2017, 114, E3101–E3109. [Google Scholar] [CrossRef]
- Letouzé, E.; Shinde, J.; Renault, V.; Couchy, G.; Blanc, J.F.; Tubacher, E.; Bayard, Q.; Bacq, D.; Meyer, V.; Semhoun, J.; et al. Mutational signatures reveal the dynamic interplay of risk factors and cellular processes during liver tumorigenesis. Nat. Commun. 2017, 8, 1315. [Google Scholar] [CrossRef] [PubMed] [Green Version]
- Weng, M.W.; Lee, H.W.; Choi, B.; Wang, H.T.; Hu, Y.; Mehta, M.; Desai, D.; Amin, S.; Zheng, Y.; Tang, M.S. AFB1 hepatocarcinogenesis is via lipid peroxidation that inhibits DNA repair, sensitizes mutation susceptibility and induces aldehyde–DNA adducts at p53 mutational hotspot codon 249. Oncotarget 2017, 8, 18213–18226. [Google Scholar] [CrossRef] [PubMed]
- Sarasin, A.R.; Smith, C.A.; Hanawalt, P.C. Repair of DNA in human cells after treatment with activated aflatoxin B1. Cancer Res. 1977, 37, 1786–1793. [Google Scholar] [PubMed]
- Oleykowski, C.A.; Mayernik, J.A.; Lim, S.E.; Groopman, J.D.; Grossman, L.; Wogan, G.N.; Yeung, A.T. Repair of aflatoxin B1 DNA adducts by the UvrABC endonuclease of Escherichia coli. J. Biol. Chem. 1993, 268, 7990–8002. [Google Scholar] [PubMed]
- Alekseyev, Y.O.; Hamm, M.L.; Essigmann, J.M. Aflatoxin B1 formamidopyrimidine adducts are preferentially repaired by the nucleotide excision repair pathway in vivo. Carcinogenesis 2004, 25, 1045–1051. [Google Scholar] [CrossRef] [PubMed]
- Bedard, L.L.; Alessi, M.; Davey, S.; Massey, T.E. Susceptibility to aflatoxin B1-induced carcinogenesis correlates with tissue-specific differences in DNA repair activity in mouse and in rat. Cancer Res. 2005, 65, 1265–1270. [Google Scholar] [CrossRef] [PubMed]
- Guo, Y.; Breeden, L.L.; Zarbl, H.; Preston, B.D.; Eaton, D.L. Expression of a human cytochrome P450 in yeast permits analysis of pathways for response to and repair of aflatoxin-induced DNA damage. Mol. Cell. Biol. 2005, 25, 5823–5833. [Google Scholar] [CrossRef] [PubMed]
- Bedard, L.L.; Massey, T.E. Aflatoxin B1-induced DNA damage and its repair. Cancer Lett. 2006, 241, 174–183. [Google Scholar] [CrossRef] [PubMed]
- Irvin, T.R.; Wogan, G.N. Quantitation of aflatoxin B1 adduction within the ribosomal RNA gene sequences of rat liver DNA. Proc. Natl. Acad. Sci. USA 1984, 81, 664–668. [Google Scholar] [CrossRef]
- Vartanian, V.; Minko, I.G.; Chawanthayatham, S.; Egner, P.A.; Lin, Y.C.; Earley, L.F.; Makar, R.; Eng, J.R.; Camp, M.T.; Li, L.; et al. NEIL1 protects against aflatoxin-induced hepatocellular carcinoma in mice. Proc. Natl. Acad. Sci. USA 2017, 114, 4207–4212. [Google Scholar] [CrossRef] [Green Version]
- Shen, H.M.; Shi, C.Y.; Lee, H.P.; Ong, C.N. Aflatoxin B1-induced lipid peroxidation in rat liver. Toxicol. Appl. Pharmacol. 1994, 127, 145–150. [Google Scholar] [CrossRef] [PubMed]
- Shen, H.M.; Ong, C.N.; Lee, B.L.; Shi, C.Y. Aflatoxin B1-induced 8-hydroxydeoxyguanosine formation in rat hepatic DNA. Carcinogenesis 1995, 16, 419–422. [Google Scholar] [CrossRef] [PubMed]
- Lancaster, M.C.; Jenkins, F.P.; Philp, J.M. Toxicity associated with certain samples of groundnuts. Nature 1961, 192, 1095–1096. [Google Scholar] [CrossRef]
- Butler, W.H.; Barnes, J.M. Toxic effects of groundnut meal containing aflatoxin to rats and guinea-pigs. Br. J. Cancer 1963, 17, 699–710. [Google Scholar] [CrossRef]
- Carnaghan, R.B.A.; Hartley, R.D.; O’Kelly, J. Toxicity and fluorescence properties of the aflatoxins. Nature 1963, 200, 1101. [Google Scholar] [CrossRef]
- Tulpule, P.G.; Madhavan, T.V.; Gopalan, C. Effect of feeding aflatoxin to young monkeys. Lancet 1964, 1, 962–963. [Google Scholar] [CrossRef]
- Judah, D.J.; Legg, R.F.; Neal, G.E. Development of resistance to cytotoxicity during aflatoxin carcinogenesis. Nature 1977, 265, 343–345. [Google Scholar] [CrossRef]
- Paini, A.; Scholz, G.; Marin-Kuan, M.; Schilter, B.; O’Brien, J.; van Bladeren, P.J.; Rietjens, I.M.C.M. Quantitative comparison between in vivo DNA adduct formation from exposure to selected DNA-reactive carcinogens, natural background levels of DNA adduct formation and tumour incidence in rodent bioassays. Mutagenesis 2011, 26, 605–618. [Google Scholar] [CrossRef] [Green Version]
- Barnes, J.; Butler, W.H. Carcinogenic activity of aflatoxin to rats. Nature 1964, 202, 1016. [Google Scholar] [CrossRef]
- Butler, W.H. Acute toxicity of aflatoxin B1 in rats. Br. J. Cancer 1964, 18, 756–762. [Google Scholar] [CrossRef]
- Carnaghan, R.B. Hepatic tumours and other chronic liver changes in rats following a single oral administration of aflatoxin. Br. J. Cancer 1967, 21, 811–814. [Google Scholar] [CrossRef] [PubMed]
- Epstein, S.M.; Bartus, B.; Farber, E. Renal epithelial neoplasms induced in male Wistar rats by oral aflatoxin B1. Cancer Res. 1969, 29, 1045–1050. [Google Scholar] [PubMed]
- Alpert, M.E.; Hutt, M.S.; Wogan, G.N.; Davidson, C.S. Association between aflatoxin content of food and hepatoma frequency in Uganda. Cancer 1971, 28, 253–260. [Google Scholar] [CrossRef] [Green Version]
- Lutwick, L.I. Relation between aflatoxin, hepatitis-B virus, and hepatocellular carcinoma. Lancet 1979, 313, 755–757. [Google Scholar] [CrossRef]
- Grosman, M.E.; Elías, M.M.; Comin, E.J.; Rodriguez Garay, E.A. Alterations in renal function induced by aflatoxin B1 in the rat. Toxicol. Appl. Pharmacol. 1983, 69, 319–325. [Google Scholar] [CrossRef]
- Wieder, R.; Wogan, G.N.; Shimkin, M.B. Pulmonary tumors in strain A mice given injections of aflatoxin B1. J. Natl. Cancer Inst. 1968, 40, 1195–1197. [Google Scholar] [PubMed]
- Paget, V.; Sichel, F.; Garon, D.; Lechevrel, M. Aflatoxin B1-induced TP53 mutational pattern in normal human cells using the FASAY (Functional Analysis of Separated Alleles in Yeast). Mutat. Res. 2008, 656, 55–61. [Google Scholar] [CrossRef]
- Pier, A.C.; Heddleston, K.L. The effect of aflatoxin on immunity in turkeys. I. Impairment of actively acquired resistance to bacterial challenge. Avian Dis. 1970, 14, 797–809. [Google Scholar] [CrossRef]
- Ikegwuonu, F.I. The neurotoxicity of aflatoxin B1 in the rat. Toxicology 1983, 28, 247–259. [Google Scholar] [CrossRef]
- DiPaolo, J.A.; Elis, J.; Erwin, H. Teratogenic response by hamsters, rats and mice to aflatoxin B1. Nature 1967, 215, 638–639. [Google Scholar] [CrossRef]
- Dickens, F.; Jones, H.E. The carcinogenic action of aflatoxin after its subcutaneous injection in the rat. Br. J. Cancer 1963, 17, 691–698. [Google Scholar] [CrossRef]
- Carnaghan, R.B.A. Hepatic tumours in ducks fed a low level of toxic groundnut meal. Nature 1965, 208, 308. [Google Scholar] [CrossRef] [PubMed]
- Callen, D.F.; Mohn, G.R.; Ong, T.M. Comparison of the genetic activity of aflatoxins B1 and G1 in Escherichia coli and Saccharomyces cerevisiae. Mutat. Res. 1977, 45, 7–11. [Google Scholar] [CrossRef]
- Aguilar, F.; Harris, C.C.; Sun, T.; Hollstein, M.; Cerutti, P. Geographic variation of p53 mutational profile in nonmalignant human liver. Science 1994, 264, 1317–1319. [Google Scholar] [CrossRef] [PubMed]
- Liu, Y.; Wu, F. Global burden of aflatoxin-induced hepatocellular carcinoma: A risk assessment. Environ. Health Perspect. 2010, 118, 818–824. [Google Scholar] [CrossRef] [PubMed]
- McGlynn, K.A.; Rosvold, E.A.; Lustbader, E.D.; Hu, Y.; Clapper, M.L.; Zhou, T.; Wild, C.P.; Xia, X.L.; Baffoe-Bonnie, A.; Ofori-Adjei, D. Susceptibility to hepatocellular carcinoma is associated with genetic variation in the enzymatic detoxification of aflatoxin B1. Proc. Natl. Acad. Sci. USA 1995, 92, 2384–2387. [Google Scholar] [CrossRef] [PubMed]
- Lancaster, M.C. Comparative aspects of aflatoxin-induced hepatic tumors. Cancer Res. 1968, 28, 2288–2292. [Google Scholar]
- Portman, R.S.; Plowman, K.M.; Campbell, T.C. Aflatoxin metabolism by liver microsomal preparations of two different species. Biochem. Biophys. Res. Commun. 1968, 33, 711–715. [Google Scholar] [CrossRef]
- Newberne, P.M.; Butler, W.H. Acute and chronic effects of aflatoxin on the liver of domestic and laboratory animals: A review. Cancer Res. 1969, 29, 236–250. [Google Scholar]
- Vologodskii, A.; Frank-Kamenetskii, M.D. DNA melting and energetics of the double helix. Phys. Life Rev. 2018, 25, 1–21. [Google Scholar] [CrossRef]
- Chandrasekaran, R.; Arnott, S. The structure of B-DNA in oriented fibers. J. Biomol. Struct. Dyn. 1996, 13, 1015–1027. [Google Scholar] [CrossRef]
- Lu, X.J.; Olson, W.K. 3DNA: A software package for the analysis, rebuilding and visualization of three-dimensional nucleic acid structures. Nucl. Acids Res. 2003, 31, 5108–5121. [Google Scholar] [CrossRef] [PubMed]
- Lu, X.J.; Olson, W.K. 3DNA: A versatile, integrated software system for the analysis, rebuilding and visualization of three-dimensional nucleic-acid structures. Nat. Protoc. 2008, 3, 1213–1227. [Google Scholar] [CrossRef] [PubMed]
- Marelius, J.; Kolmodin, K.; Feierberg, I.; Åqvist, J. Q: A molecular dynamics program for free energy calculations and empirical valence bond simulations in biomolecular systems. J. Mol. Graph. Model. 1998, 16, 213–225. [Google Scholar] [CrossRef]
- Ishikita, H.; Warshel, A. Predicting drug-resistant mutations of HIV protease. Angew. Chem. Int. Ed. Engl. 2008, 47, 697–700. [Google Scholar] [CrossRef] [PubMed]
- Lee, F.S.; Chu, Z.T.; Bolger, M.B.; Warshel, A. Calculations of antibody-antigen interactions: Microscopic and semi-microscopic evaluation of the free energies of binding of phosphorylcholine analogs to McPC603. Protein Eng. 1992, 5, 215–228. [Google Scholar] [CrossRef] [PubMed]
- Åqvist, J.; Medina, C.; Samuelsson, J.E. A new method for predicting binding affinity in computer-aided drug design. Protein Eng. 1994, 7, 385–391. [Google Scholar] [CrossRef] [PubMed]
- Šponer, J.; Šponer, J.E.; Mládek, A.; Jurečka, P.; Banáš, P.; Otyepka, M. Nature and magnitude of aromatic base stacking in DNA and RNA: quantum chemistry, molecular mechanics, and experiment. Biopolymers 2013, 99, 978–988. [Google Scholar] [CrossRef]
- Singh, N.; Warshel, A. Absolute binding free energy calculations: On the accuracy of computational scoring of protein-ligand interactions. Proteins 2010, 78, 1705–1723. [Google Scholar] [CrossRef]
- Gutiérrez-de Terán, H.; Åqvist, J. Linear interaction energy: Method and applications in drug design. Methods Mol. Biol. 2012, 819, 305–323. [Google Scholar] [CrossRef]
- Sham, Y.Y.; Chu, Z.T.; Tao, H.; Warshel, A. Examining methods for calculations of binding free energies: LRA, LIE, PDLD-LRA, and PDLD/S-LRA calculations of ligands binding to an HIV protease. Proteins 2000, 39, 393–407. [Google Scholar] [CrossRef]
- Díaz, L.; Bujons, J.; Delgado, A.; Gutiérrez-de Terán, H.; Åqvist, J. Computational prediction of structure-activity relationships for the binding of aminocyclitols to β-glucocerebrosidase. J. Chem. Inf. Model. 2011, 51, 601–611. [Google Scholar] [CrossRef] [PubMed]
- Hansson, T.; Marelius, J.; Åqvist, J. Ligand binding affinity prediction by linear interaction energy methods. J. Comput. Aided Mol. Des. 1998, 12, 27–35. [Google Scholar] [CrossRef] [PubMed]
- Berman, H.M.; Westbrook, J.; Feng, Z.; Gilliland, G.; Bhat, T.N.; Weissig, H.; Shindyalov, I.N.; Bourne, P.E. The Protein Data Bank. Nucl. Acids Res. 2000, 28, 235–242. [Google Scholar] [CrossRef] [PubMed] [Green Version]
- Florián, J.; Goodman, M.F.; Warshel, A. Free-energy perturbation calculations of DNA destabilization by base substitutions: The effect of neutral guanine·thymine, adenine·cytosine and adenine·difluorotoluene mismatches. J. Phys. Chem. B 2000, 104, 10092–10099. [Google Scholar] [CrossRef]
- Bren, U.; Lah, J.; Bren, M.; Martínek, V.; Florián, J. DNA duplex stability: The role of preorganized electrostatics. J. Phys. Chem. B 2010, 114, 2876–2885. [Google Scholar] [CrossRef] [PubMed]
- Cornell, W.D.; Cieplak, P.; Bayly, C.I.; Gould, I.R.; Merz, K.M.; Ferguson, D.M.; Spellmeyer, D.C.; Fox, T.; Caldwell, J.W.; Kollman, P.A. A second generation force field for the simulation of proteins, nucleic acids, and organic molecules. J. Am. Chem. Soc. 1995, 117, 5179–5197. [Google Scholar] [CrossRef]
- Case, D.A.; Darden, T.A.; Cheatham, T.E., III; Simmerling, C.L.; Wang, J.; Duke, R.E.; Luo, R.; Walker, R.C.; Zhang, W.; Merz, K.M.; et al. AMBER; University of California: San Francisco, CA, USA, 2010. [Google Scholar]
- Wang, J.; Wolf, R.M.; Caldwell, J.W.; Kollman, P.A.; Case, D.A. Development and testing of a general Amber force field. J. Comput. Chem. 2004, 25, 1157–1174. [Google Scholar] [CrossRef]
- Bayly, C.I.; Cieplak, P.; Cornell, W.; Kollman, P.A. A well-behaved electrostatic potential based method using charge restraints for deriving atomic charges: The RESP model. J. Phys. Chem. 1993, 97, 10269–10280. [Google Scholar] [CrossRef]
- Frisch, M.J.; Trucks, G.W.; Schlegel, H.B.; Scuseria, G.E.; Robb, M.A.; Cheeseman, J.R.; Scalmani, G.; Barone, V.; Mennucci, B.; Petersson, G.A.; et al. Gaussian; Gaussian, Inc.: Wallingford, CT, USA, 2009. [Google Scholar]
- Jorgensen, W.L.; Chandrasekhar, J.; Madura, J.D.; Impey, R.W.; Klein, M.L. Comparison of simple potential functions for simulating liquid water. J. Chem. Phys. 1983, 79, 926–935. [Google Scholar] [CrossRef]
- Klvaňa, M.; Bren, U.; Florián, J. Uniform free-energy profiles of the P–O Bond formation and cleavage reactions catalyzed by DNA polymerases β and λ. J. Phys. Chem. B 2016, 120, 13017–13030. [Google Scholar] [CrossRef] [PubMed]
- DeLano, W.L. The PyMOL Molecular Graphics System; DeLano Scientific, LLC: Palo Alto, CA, USA, 2006. [Google Scholar]
- Humphrey, W.; Dalke, A.; Schulten, K. VMD: Visual molecular dynamics. J. Mol. Graph. 1996, 14, 33–38. [Google Scholar] [CrossRef]
- Arunan, E.; Desiraju, G.R.; Klein, R.A.; Sadlej, J.; Scheiner, S.; Alkorta, I.; Clary, D.C.; Crabtree, R.H.; Dannenberg, J.J.; Hobza, P.; et al. Definition of the hydrogen bond (IUPAC Recommendations 2011). Pure Appl. Chem. 2011, 83, 1637–1641. [Google Scholar] [CrossRef] [Green Version]
- Svoboda, D.L.; Taylor, J.S.; Hearst, J.E.; Sancar, A. DNA repair by eukaryotic nucleotide excision nuclease. Removal of thymine dimer and psoralen monoadduct by HeLa cell-free extract and of thymine dimer by Xenopus laevis oocytes. J. Biol. Chem. 1993, 268, 1931–1936. [Google Scholar] [PubMed]
Sample Availability: Not available. |
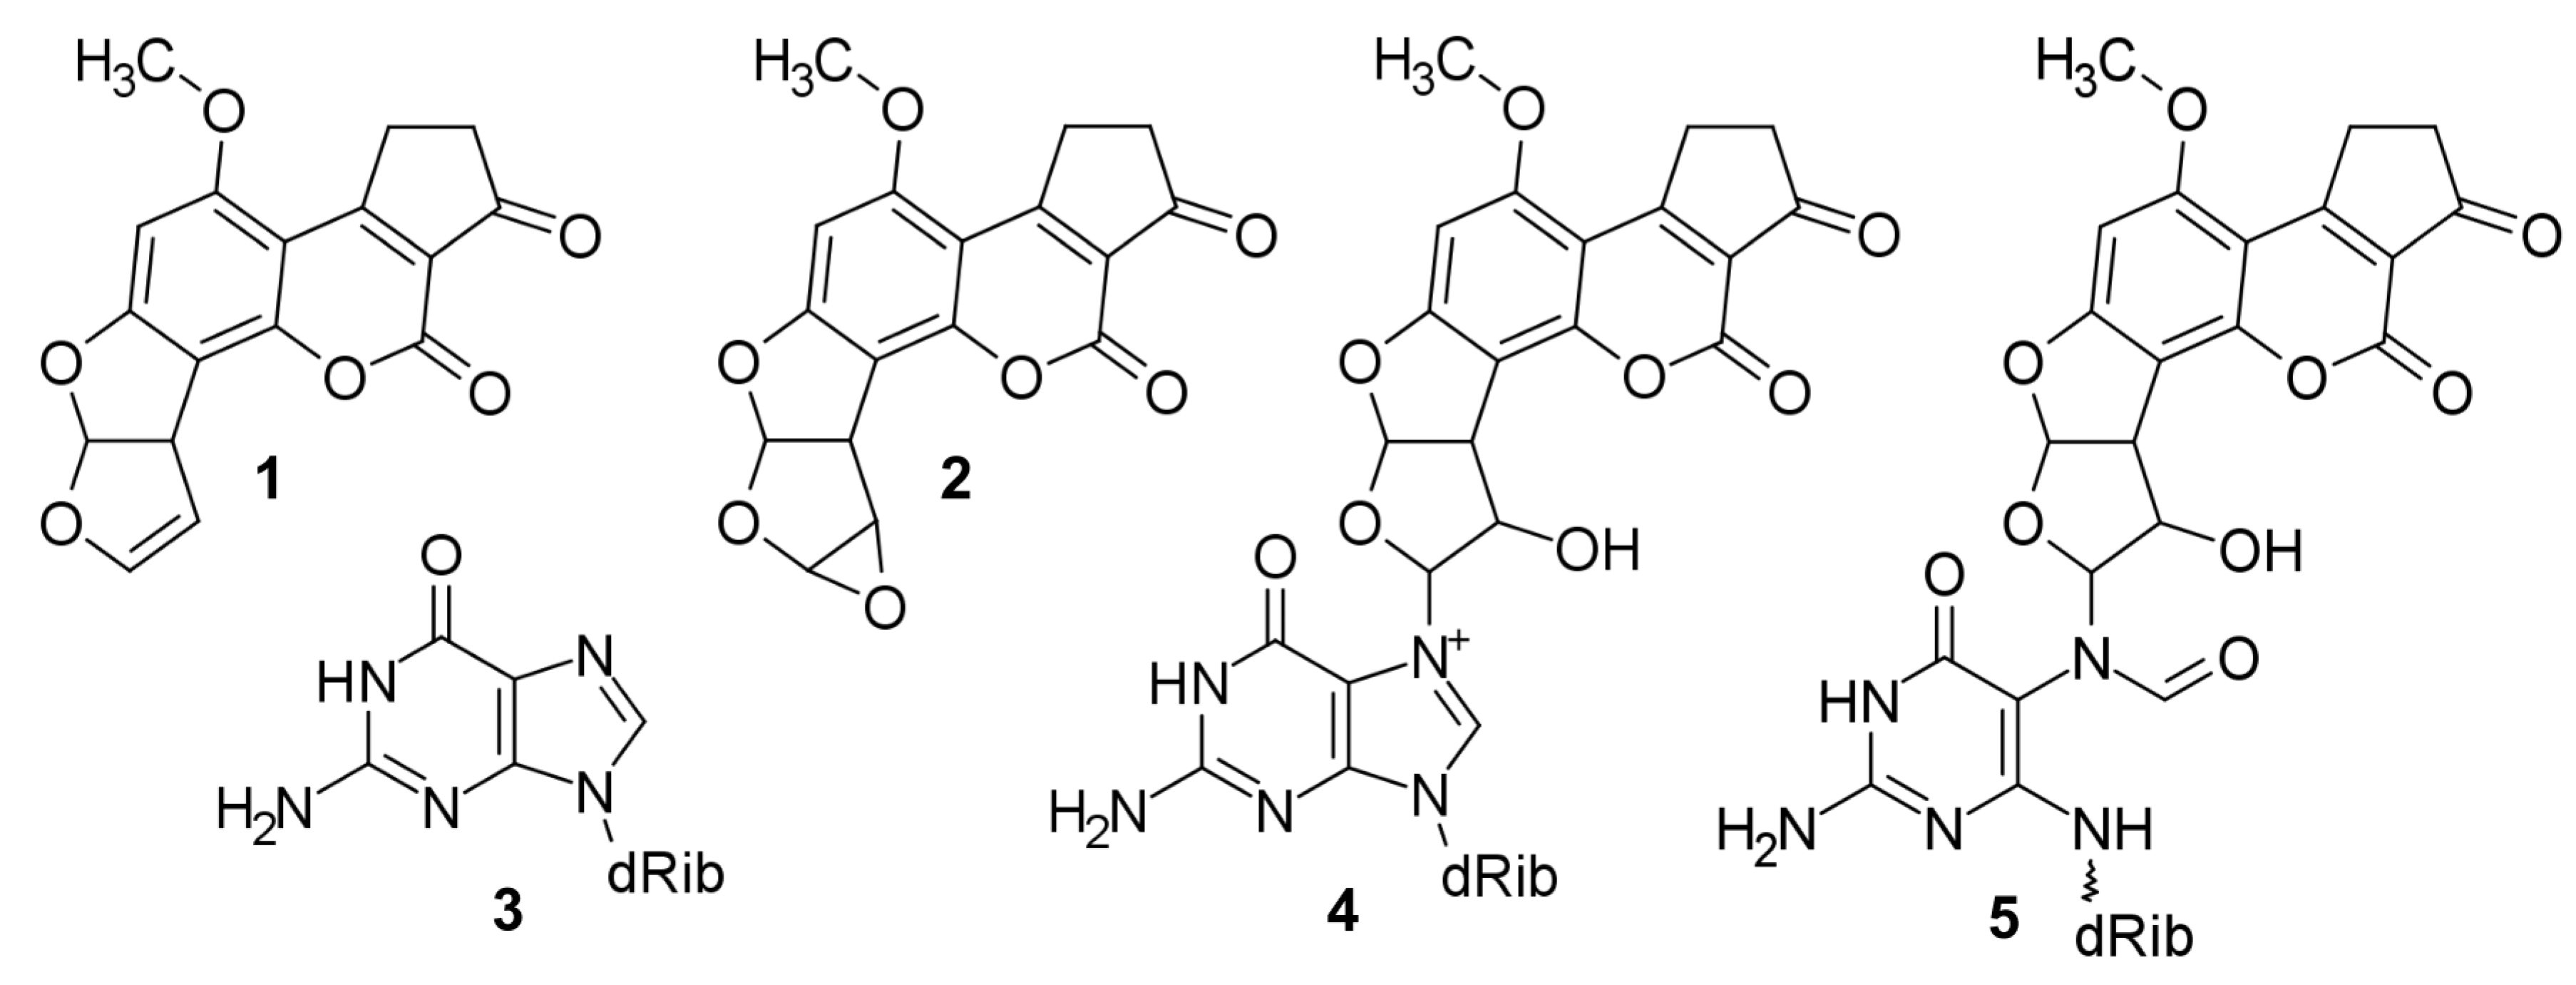
Figure 1.
Structural formulae. 1, AFB1; 2, AFB1-E; 3, Gua; 4, Cationic Gua-N7-9-hydroxy-AFB1; 5, FAPy-N7-9-hydroxy-AFB1.
Figure 1.
Structural formulae. 1, AFB1; 2, AFB1-E; 3, Gua; 4, Cationic Gua-N7-9-hydroxy-AFB1; 5, FAPy-N7-9-hydroxy-AFB1.

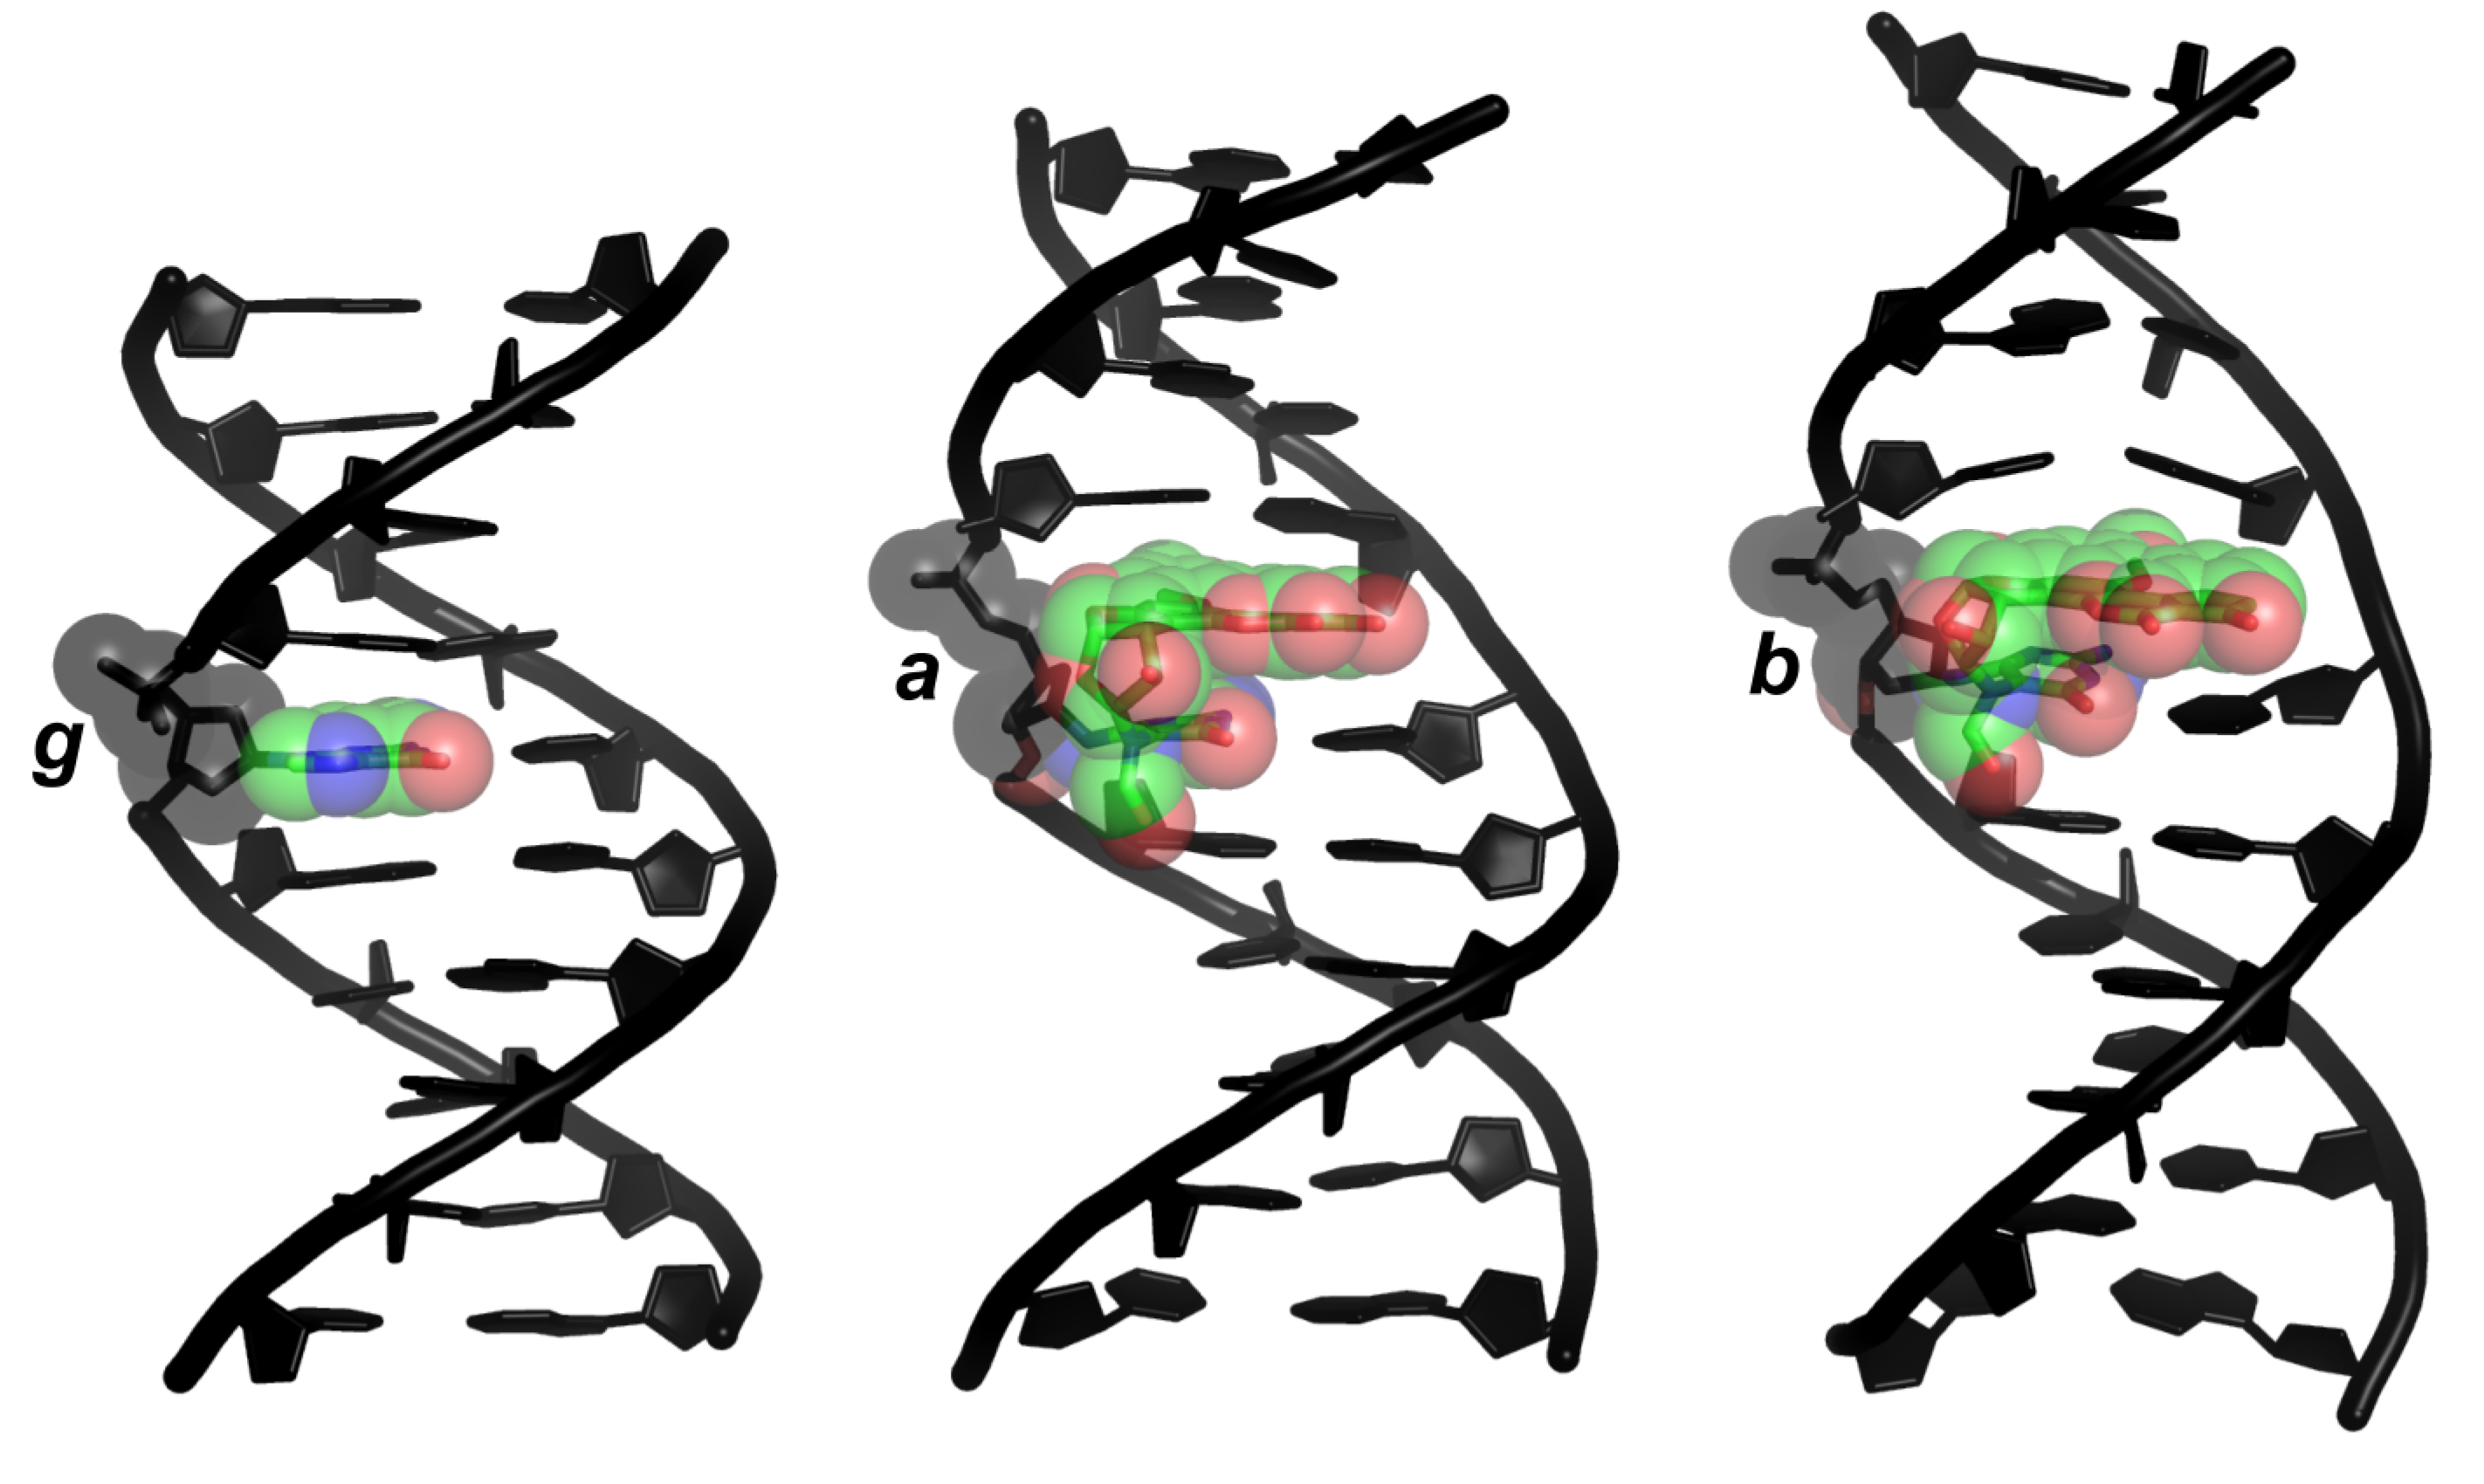
Figure 2.
Structures of dsDNA decamers differing in the nucleobase 5. (g), Gua (standard B-DNA model); (a), α-FAPy-N7-9-hydroxy-AFB1 (NMR structure; PDB ID 2KH3); (b), β-FAPy-N7-9-hydroxy-AFB1 (NMR structure; PDB ID 1HM1). Green, carbon; blue, nitrogen; red, oxygen.
Figure 2.
Structures of dsDNA decamers differing in the nucleobase 5. (g), Gua (standard B-DNA model); (a), α-FAPy-N7-9-hydroxy-AFB1 (NMR structure; PDB ID 2KH3); (b), β-FAPy-N7-9-hydroxy-AFB1 (NMR structure; PDB ID 1HM1). Green, carbon; blue, nitrogen; red, oxygen.

Figure 3.
Geometrical features of DNA with Gua (g, white), α- (a, red) and β-FAPy-N7-9-hydroxy-AFB1 (b, blue) adducts. (A) Inter- and intra-base-pair parameters in DNA models and PMD1 simulations. (B) Perturbation of base-pair 5 in PMD2 simulations. (C) Angle between base-pair origins 1, 5, and 10 in PMD simulations. (D) Intra-strand hydrogen bond between nucleobases 5 (a, red; b, blue) and 6 (Ade, cyan) in PMD simulations and models of DNA1 (circles, dsDNA; squares, ssDNA; distances in Å).

Figure 4.
Relationships between molecular structures, free energies (kcal/mol), and melting temperatures of DNA containing Gua (g, white), α- (a, red) or β-FAPy-N7-9-hydroxy-AFB1 (b, blue) adduct. (A) Probe vs. average van der Waals free energy per non-hydrogen probe-atom. (B) Helical rise vs contribution of the probe to the electrostatic free energy of dsDNA formation obtained from PMD1 simulations. (C) Average occupancy of the Watson-Crick hydrogen bonds between nucleobases of the base pair 5 vs. contribution of the probe to the electrostatic free energy of dsDNA formation obtained from PMD2 simulations. (D) Melting temperature vs. contribution of the probe to the free energy of dsDNA formation.


Table 1.
Scaled non-bonded interaction energies (kcal/mol). a
| αEvdw1 | βEele1 | βEele2 | βEele | |
|---|---|---|---|---|
| dsDNA1g | −4.4 (0.0, 0.0, 0.1) | −26.7 (0.4, 0.1, 0.2) | 0.2 (0.1, 0.4, 0.8) | −26.5 (0.4, 0.4, 0.9) |
| dsDNA1a | −10.3 (0.1, 0.2, 0.4) | −50.6 (0.1, 2.1, 4.5) | −3.9 (0.6, 1.3, 3.1) | −54.4 (0.7, 2.5, 5.7) |
| dsDNA1b | −9.8 (0.0, 0.5, 1.0) | −50.6 (0.5, 2.5, 5.7) | −5.1 (0.6, 0.9, 1.9) | −55.8 (0.8, 3.0, 6.6) |
| ssDNA1g | −3.3 (0.2, 0.4, 0.8) | −24.3 (0.3, 0.5, 1.1) | 0.9 (0.3, 0.1, 0.2) | −23.4 (0.4, 0.5, 1.1) |
| ssDNA1a | −6.8 (0.6, 0.4, 0.8) | −51.5 (1.1, 0.9, 2.1) | −3.8 (0.3, 0.4, 0.8) | −55.3 (1.0, 1.2, 2.7) |
| ssDNA1b | −7.1 (0.3, 0.3, 0.6) | −48.8 (0.9, 0.4, 0.8) | −3.4 (0.3, 0.2, 0.6) | −52.2 (1.2, 0.4, 0.9) |
| dsDNA2g | −4.4 (0.0, 0.0, 0.0) | −26.8 (0.3, 0.2, 0.6) | 0.6 (1.3, 1.1, 2.7) | −26.1 (1.5, 1.1, 2.3) |
| dsDNA2a | −9.5 (0.1, 0.4, 0.7) | −51.8 (0.6, 1.6, 2.8) | −1.9 (1.3, 0.6, 1.3) | −53.7 (1.7, 1.7, 3.8) |
| dsDNA2b | −9.7 (0.2, 0.1, 0.3) | −50.2 (0.8, 0.8, 2.0) | −3.7 (0.7, 1.2, 2.5) | −53.9 (1.5, 1.3, 2.7) |
| ssDNA2g | −3.5 (0.3, 0.2, 0.4) | −23.8 (0.4, 0.2, 0.4) | 0.7 (0.1, 0.2, 0.5) | −23.1 (0.4, 0.1, 0.1) |
| ssDNA2a | −7.2 (0.4, 0.1, 0.4) | −49.9 (0.7, 2.0, 4.8) | −3.3 (0.9, 0.6, 1.4) | −53.2 (1.5, 2.5, 5.9) |
| ssDNA2b | −6.5 (0.4, 0.4, 0.9) | −49.2 (0.9, 0.9, 2.0) | −3.1 (0.1, 0.2, 0.4) | −52.3 (0.8, 1.0, 2.3) |
| dsDNAg | −4.4 (0.0, 0.0, 0.0) | −26.7 (0.2, 0.1, 0.3) | 0.4 (0.7, 0.5, 0.9) | −26.3 (0.6, 0.4, 0.9) |
| dsDNAa | −9.9 (0.1, 0.1, 0.2) | −51.2 (0.3, 1.8, 3.6) | −2.9 (0.6, 0.9, 1.9) | −54.1 (0.8, 2.0, 4.8) |
| dsDNAb | −9.8 (0.1, 0.2, 0.5) | −50.4 (0.7, 1.4, 3.2) | −4.4 (0.6, 0.9, 2.2) | −54.8 (1.1, 1.4, 3.4) |
| ssDNAg | −3.4 (0.2, 0.3, 0.6) | −24.0 (0.2, 0.3, 0.7) | 0.8 (0.2, 0.1, 0.3) | −23.2 (0.4, 0.3, 0.5) |
| ssDNAa | −7.0 (0.3, 0.2, 0.5) | −50.7 (0.8, 0.8, 1.7) | −3.6 (0.5, 0.4, 0.8) | −54.2 (1.1, 1.1, 2.4) |
| ssDNAb | −6.8 (0.3, 0.3, 0.6) | −49.0 (0.8, 0.5, 1.2) | −3.2 (0.2, 0.1, 0.2) | −52.2 (0.9, 0.4, 1.1) |
a; ; vdw, van der Waals; ele, electrostatic; ; ; scaled interaction energy (convergence, standard deviation, spread).
Table 2.
Relative free energies of dsDNA formation (kcal/mol). a
| ΔΔGvdw1 | ΔΔGele1 | ΔΔGele2 | ΔΔGele | ΔΔG | |
|---|---|---|---|---|---|
| DNA1a | −2.3 (0.6, 0.5, 1.3) | 3.3 (0.9, 3.0, 6.8) | 0.7 (0.3, 1.7, 4.2) | 4.0 (1.1, 4.0, 8.7) | 1.7 (1.3, 3.6, 7.7) |
| DNA1b | −1.6 (0.4, 0.6, 1.4) | 0.6 (1.1, 2.5, 5.3) | −1.0 (0.9, 1.0, 2.2) | −0.4 (1.5, 2.8, 6.2) | −2.0 (1.6, 2.3, 5.3) |
| DNA2a | −1.5 (0.5, 0.6, 1.3) | 1.0 (1.4, 1.2, 2.5) | 1.6 (1.5, 2.3, 5.3) | 2.6 (2.3, 3.0, 7.3) | 1.1 (2.8, 3.2, 7.8) |
| DNA2b | −2.3 (0.6, 0.3, 0.7) | 1.9 (1.8, 1.3, 3.1) | −0.5 (1.6, 2.2, 4.6) | 1.4 (3.0, 2.8, 6.7) | −0.9 (2.5, 2.5, 6.0) |
| DNAa | −1.9 (0.4, 0.6, 1.3) | 2.2 (1.1, 1.6, 3.7) | 1.1 (0.7, 1.6, 3.1) | 3.3 (1.6, 2.6, 6.2) | 1.4 (1.9, 2.4, 5.2) |
| DNAb | −1.9 (0.5, 0.4, 0.9) | 1.2 (1.4, 1.5, 3.6) | −0.7 (1.1, 1.3, 3.1) | 0.5 (1.9, 1.7, 4.0) | −1.4 (1.4, 1.4, 3.1) |
a vdw, van der Waals; ele, electrostatic; ; ; ; reference systems: DNA1g, DNA2g, DNAg; free energy (convergence, standard deviation, spread).
© 2019 by the authors. Licensee MDPI, Basel, Switzerland. This article is an open access article distributed under the terms and conditions of the Creative Commons Attribution (CC BY) license (http://creativecommons.org/licenses/by/4.0/).
Share and Cite
MDPI and ACS Style
Klvana, M.; Bren, U. Aflatoxin B1–Formamidopyrimidine DNA Adducts: Relationships between Structures, Free Energies, and Melting Temperatures. Molecules 2019, 24, 150. https://0-doi-org.brum.beds.ac.uk/10.3390/molecules24010150
AMA Style
Klvana M, Bren U. Aflatoxin B1–Formamidopyrimidine DNA Adducts: Relationships between Structures, Free Energies, and Melting Temperatures. Molecules. 2019; 24(1):150. https://0-doi-org.brum.beds.ac.uk/10.3390/molecules24010150
Chicago/Turabian StyleKlvana, Martin, and Urban Bren. 2019. "Aflatoxin B1–Formamidopyrimidine DNA Adducts: Relationships between Structures, Free Energies, and Melting Temperatures" Molecules 24, no. 1: 150. https://0-doi-org.brum.beds.ac.uk/10.3390/molecules24010150