Protein–Phenolic Interactions as a Factor Affecting the Physicochemical Properties of White Bean Proteins


Abstract
: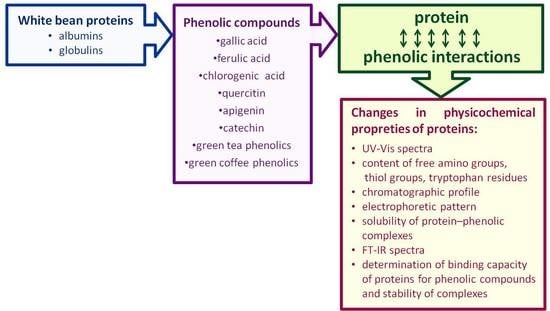
1. Introduction
2. Results
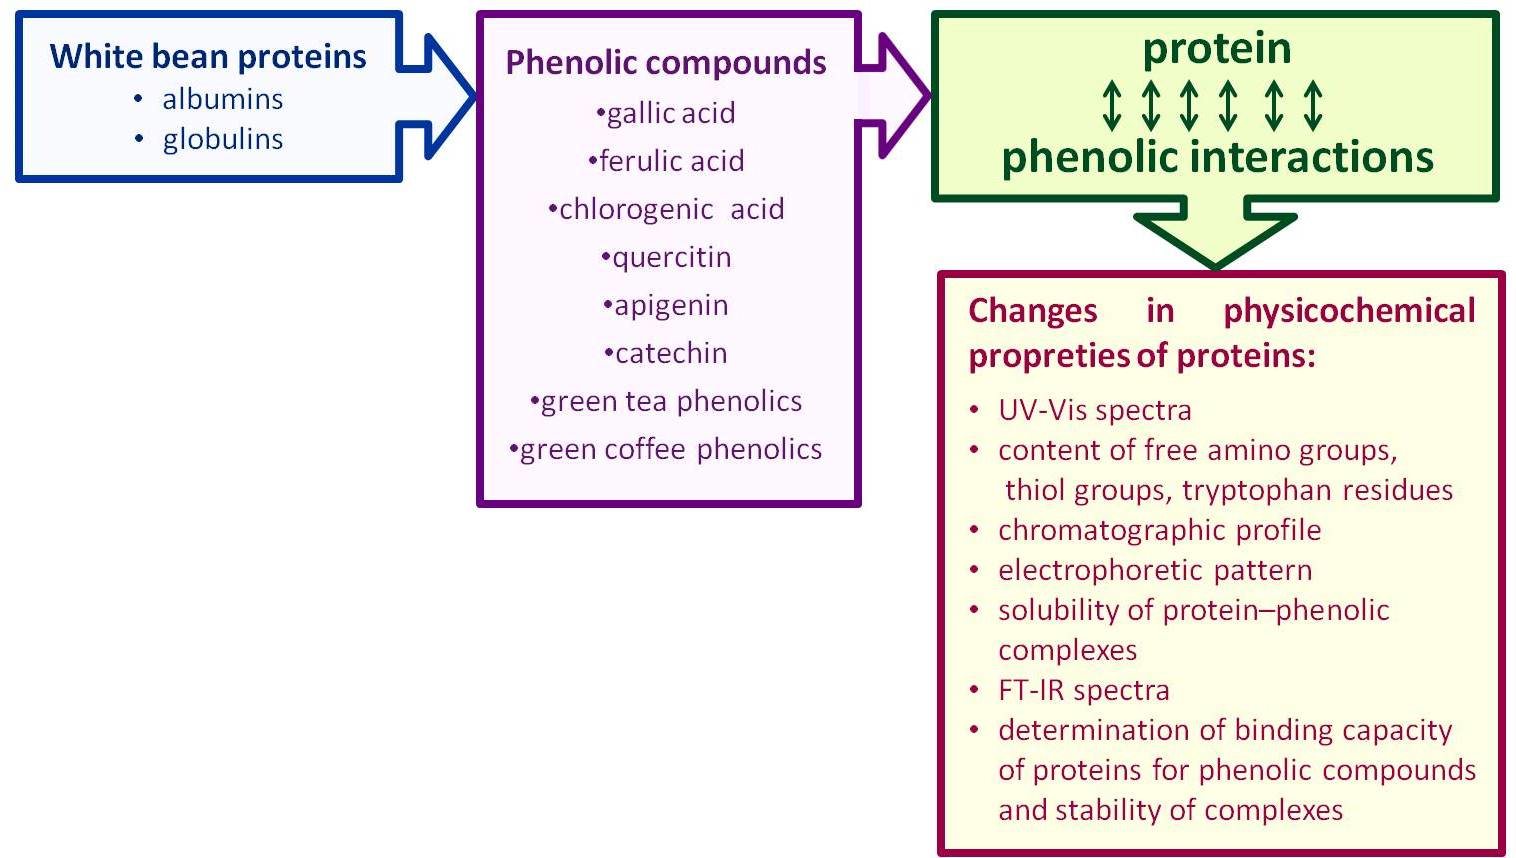
2.1. UV-Vis Spectra of Protein–Phenolic Complexes
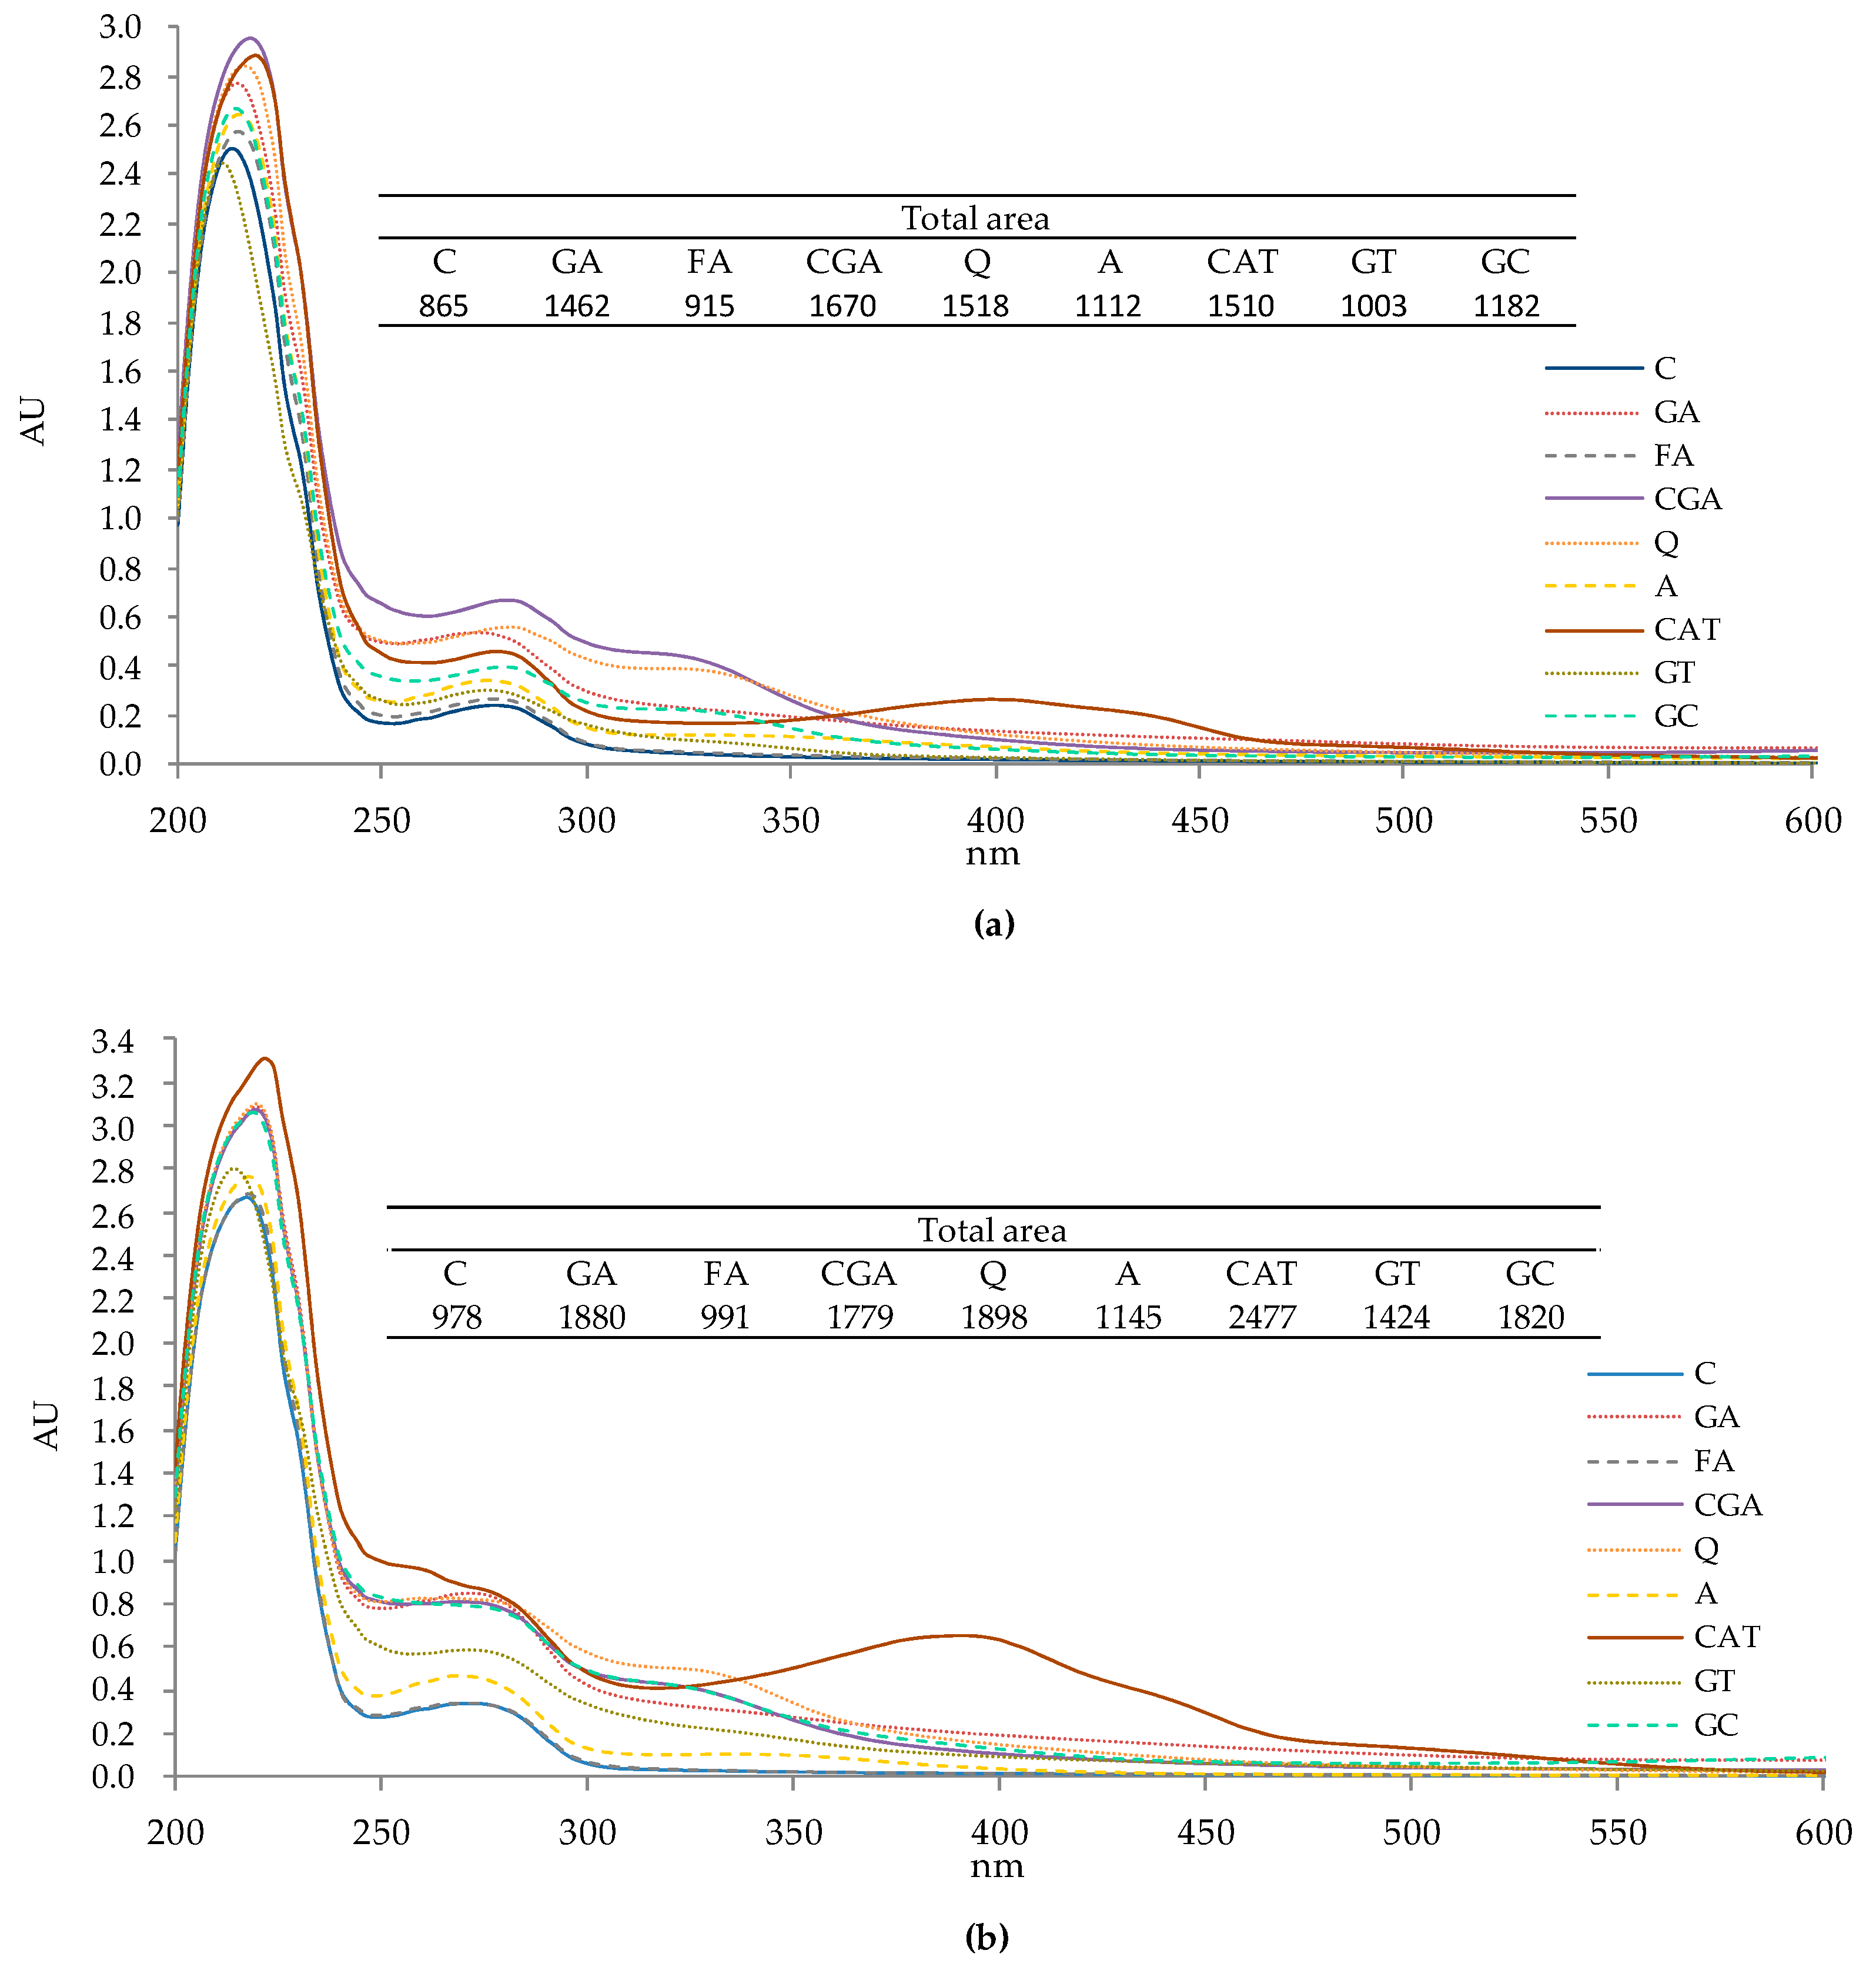
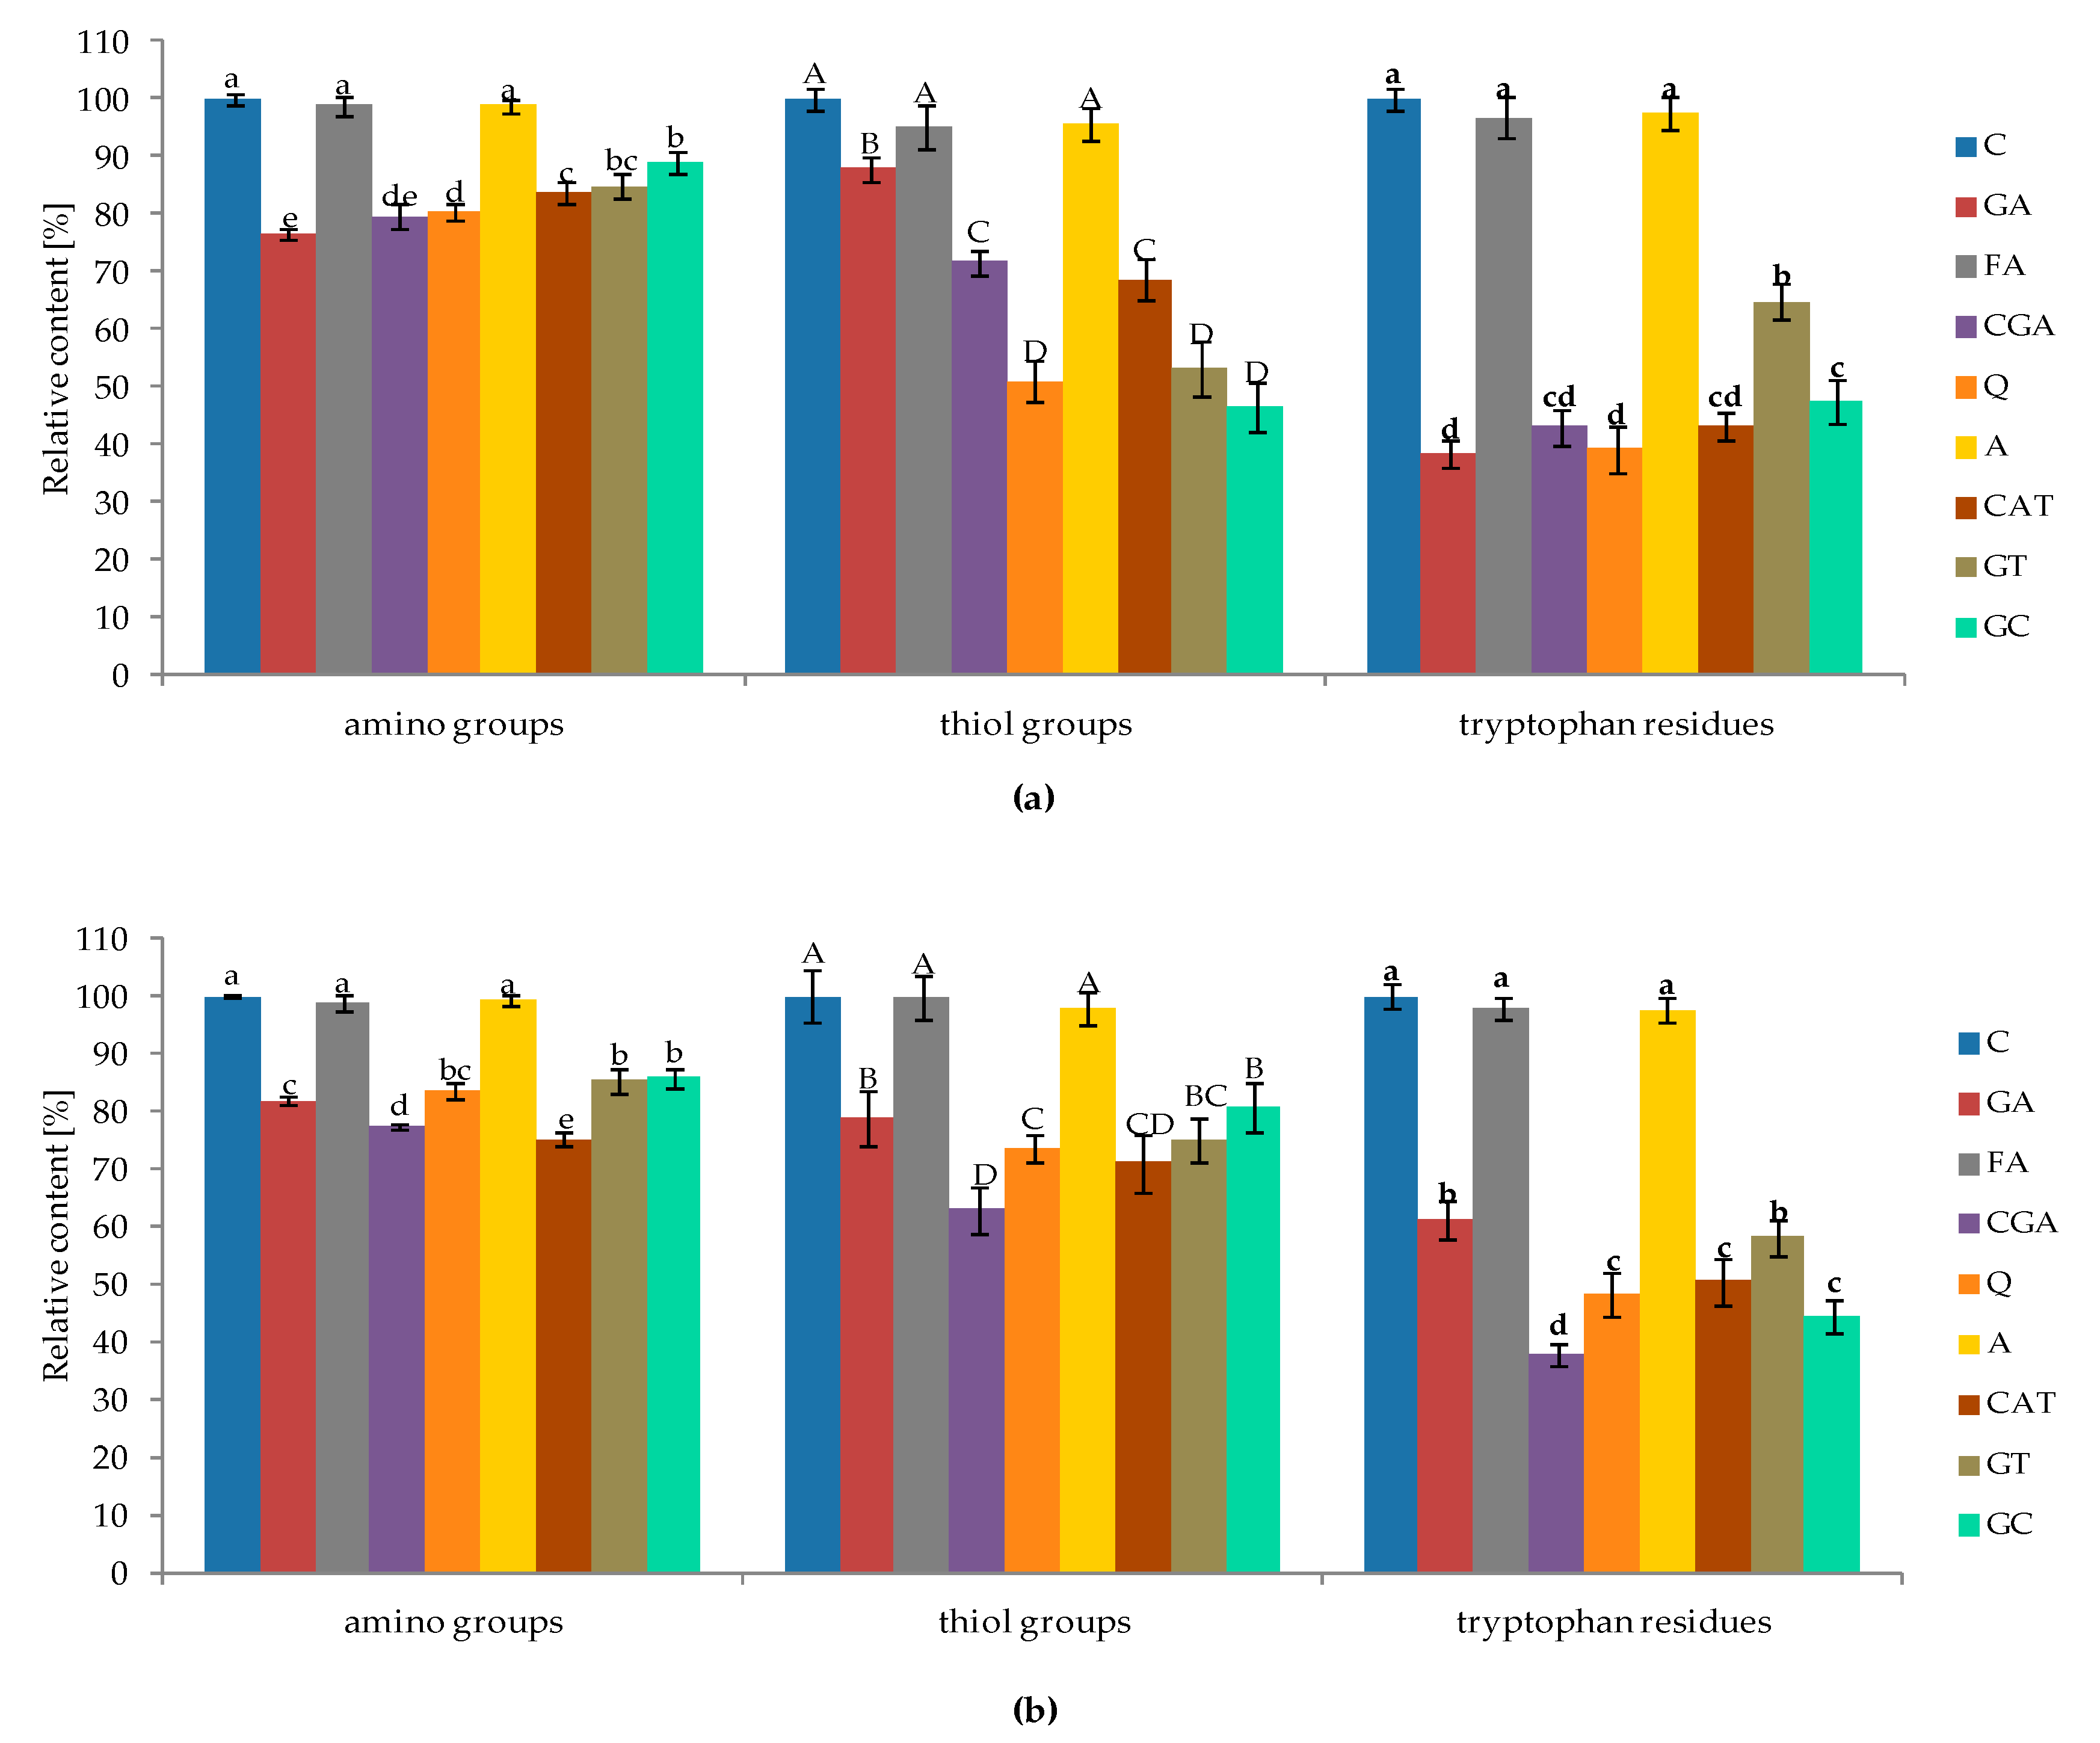
2.2. Changes in Content of Free Amino Groups, Thiol Groups, and Tryptophan Residues of Proteins Affected by Phenolic Compounds
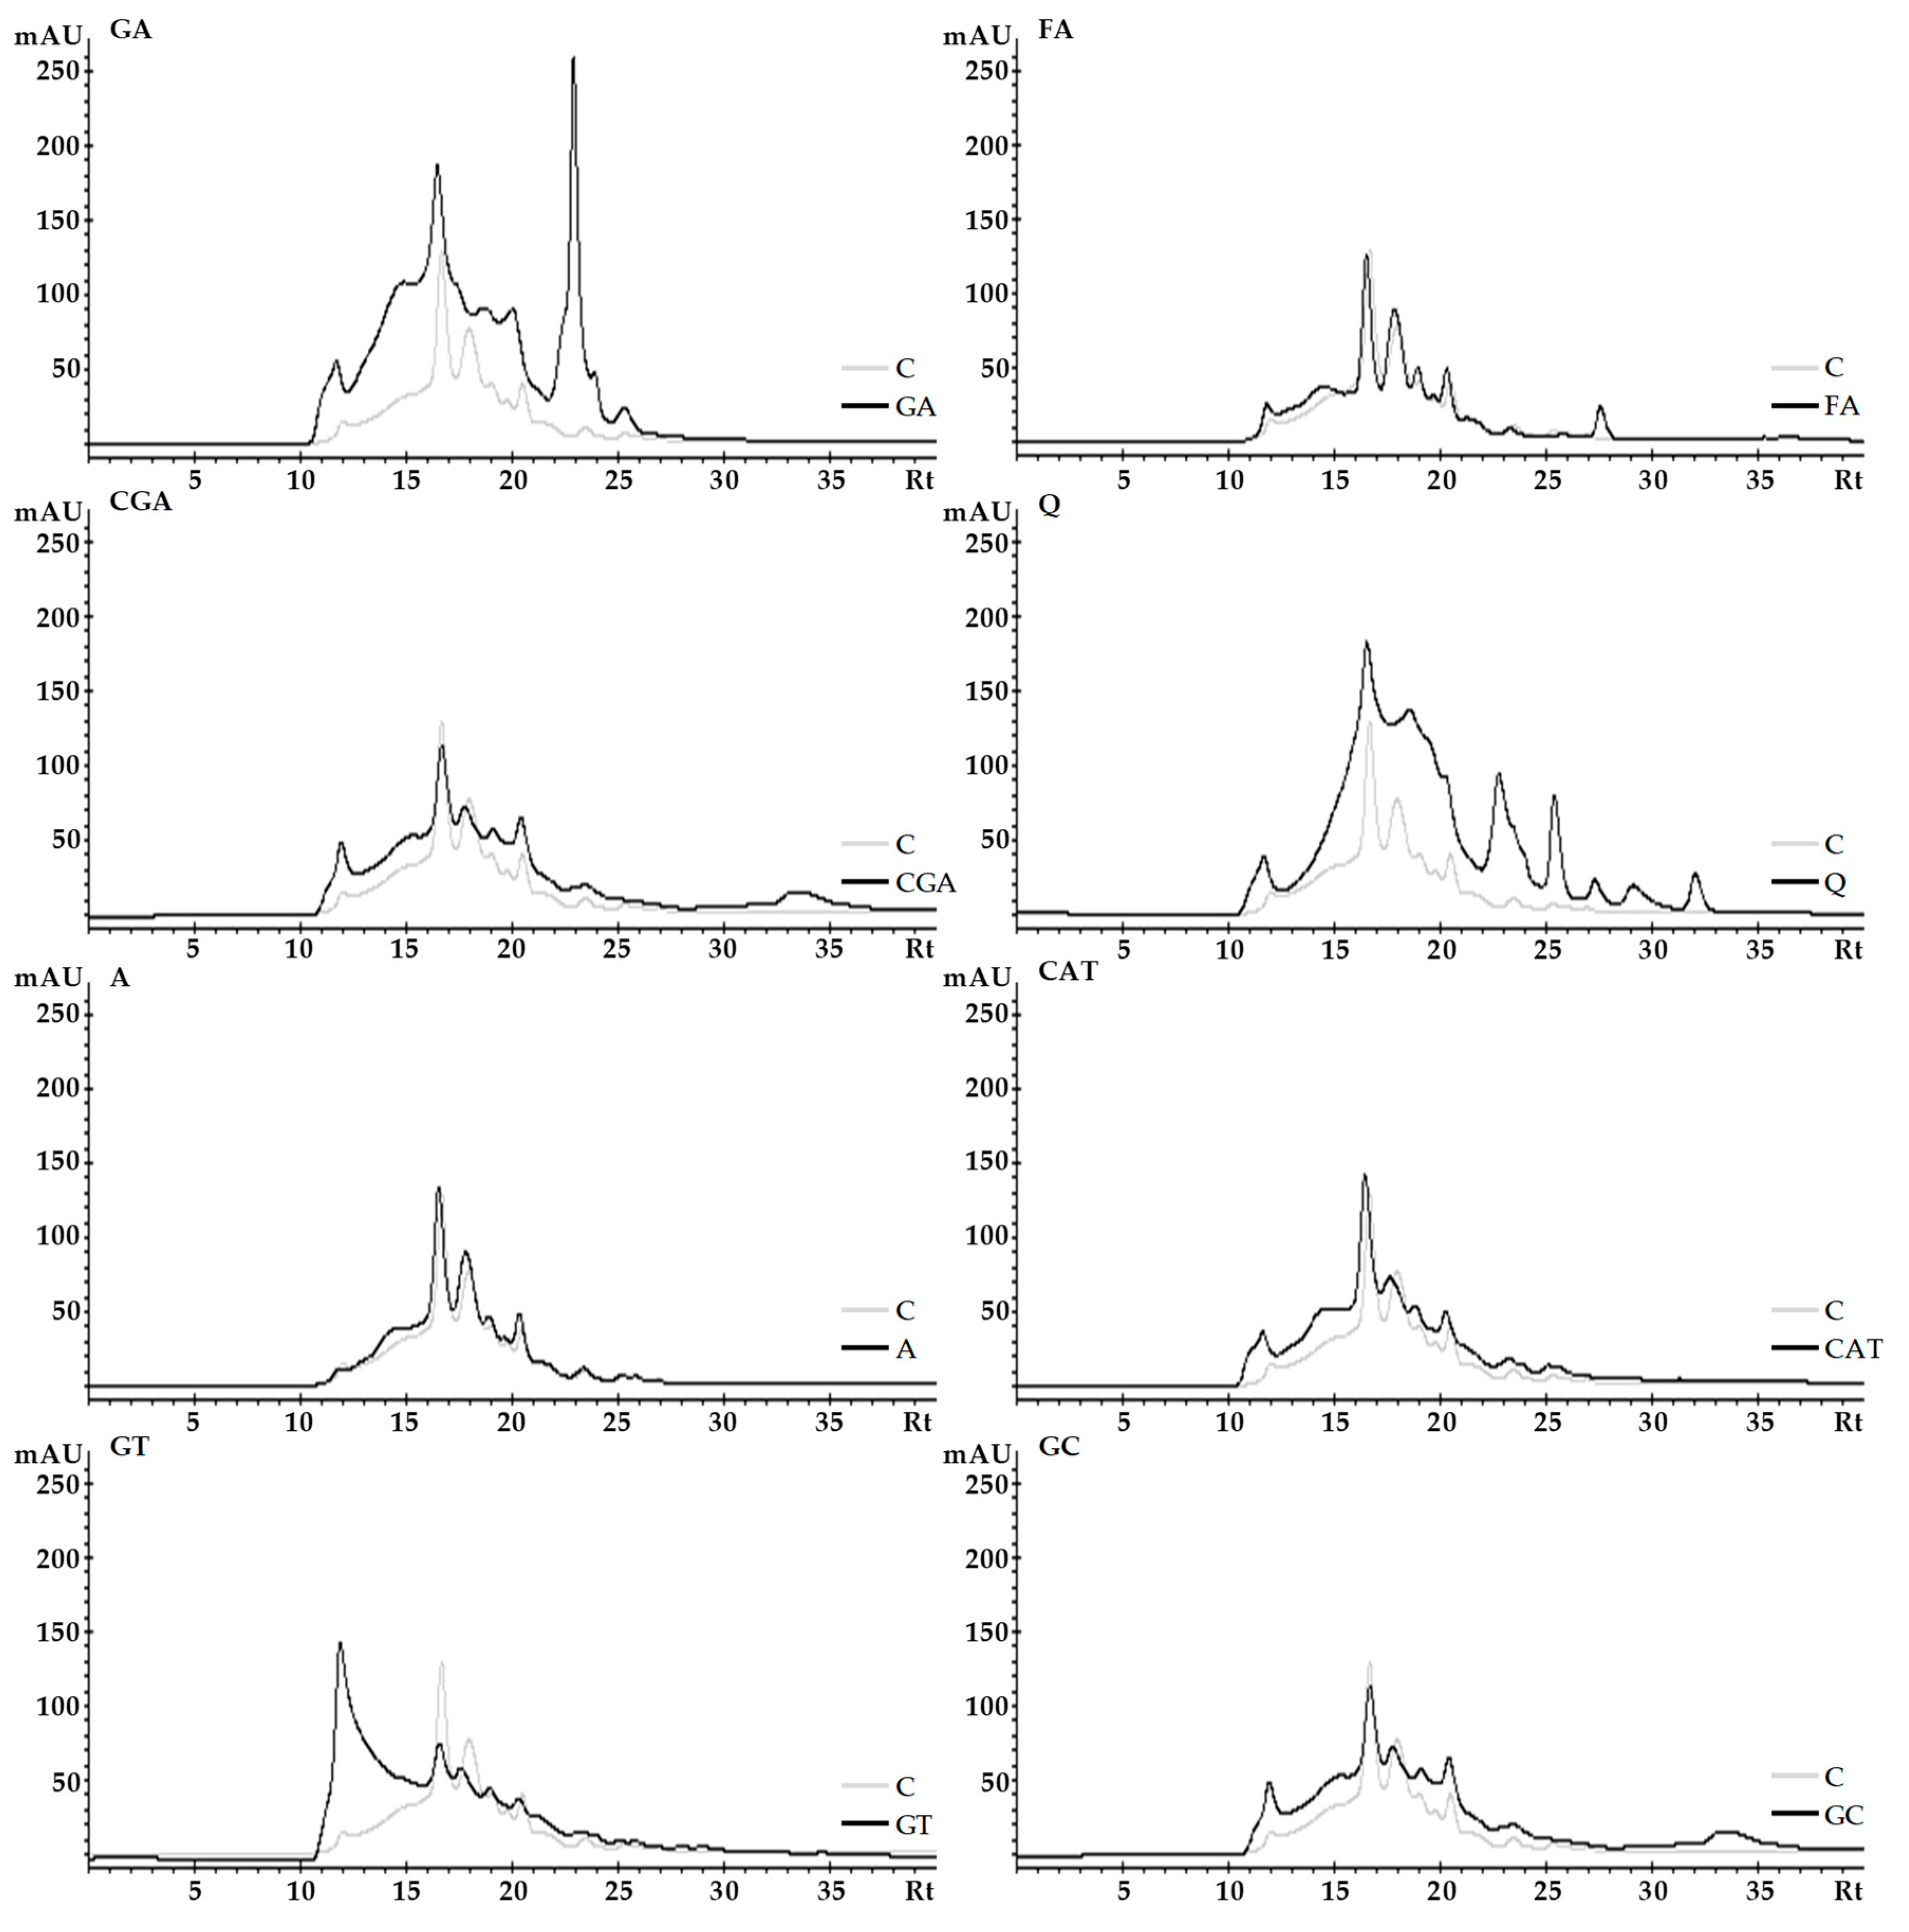
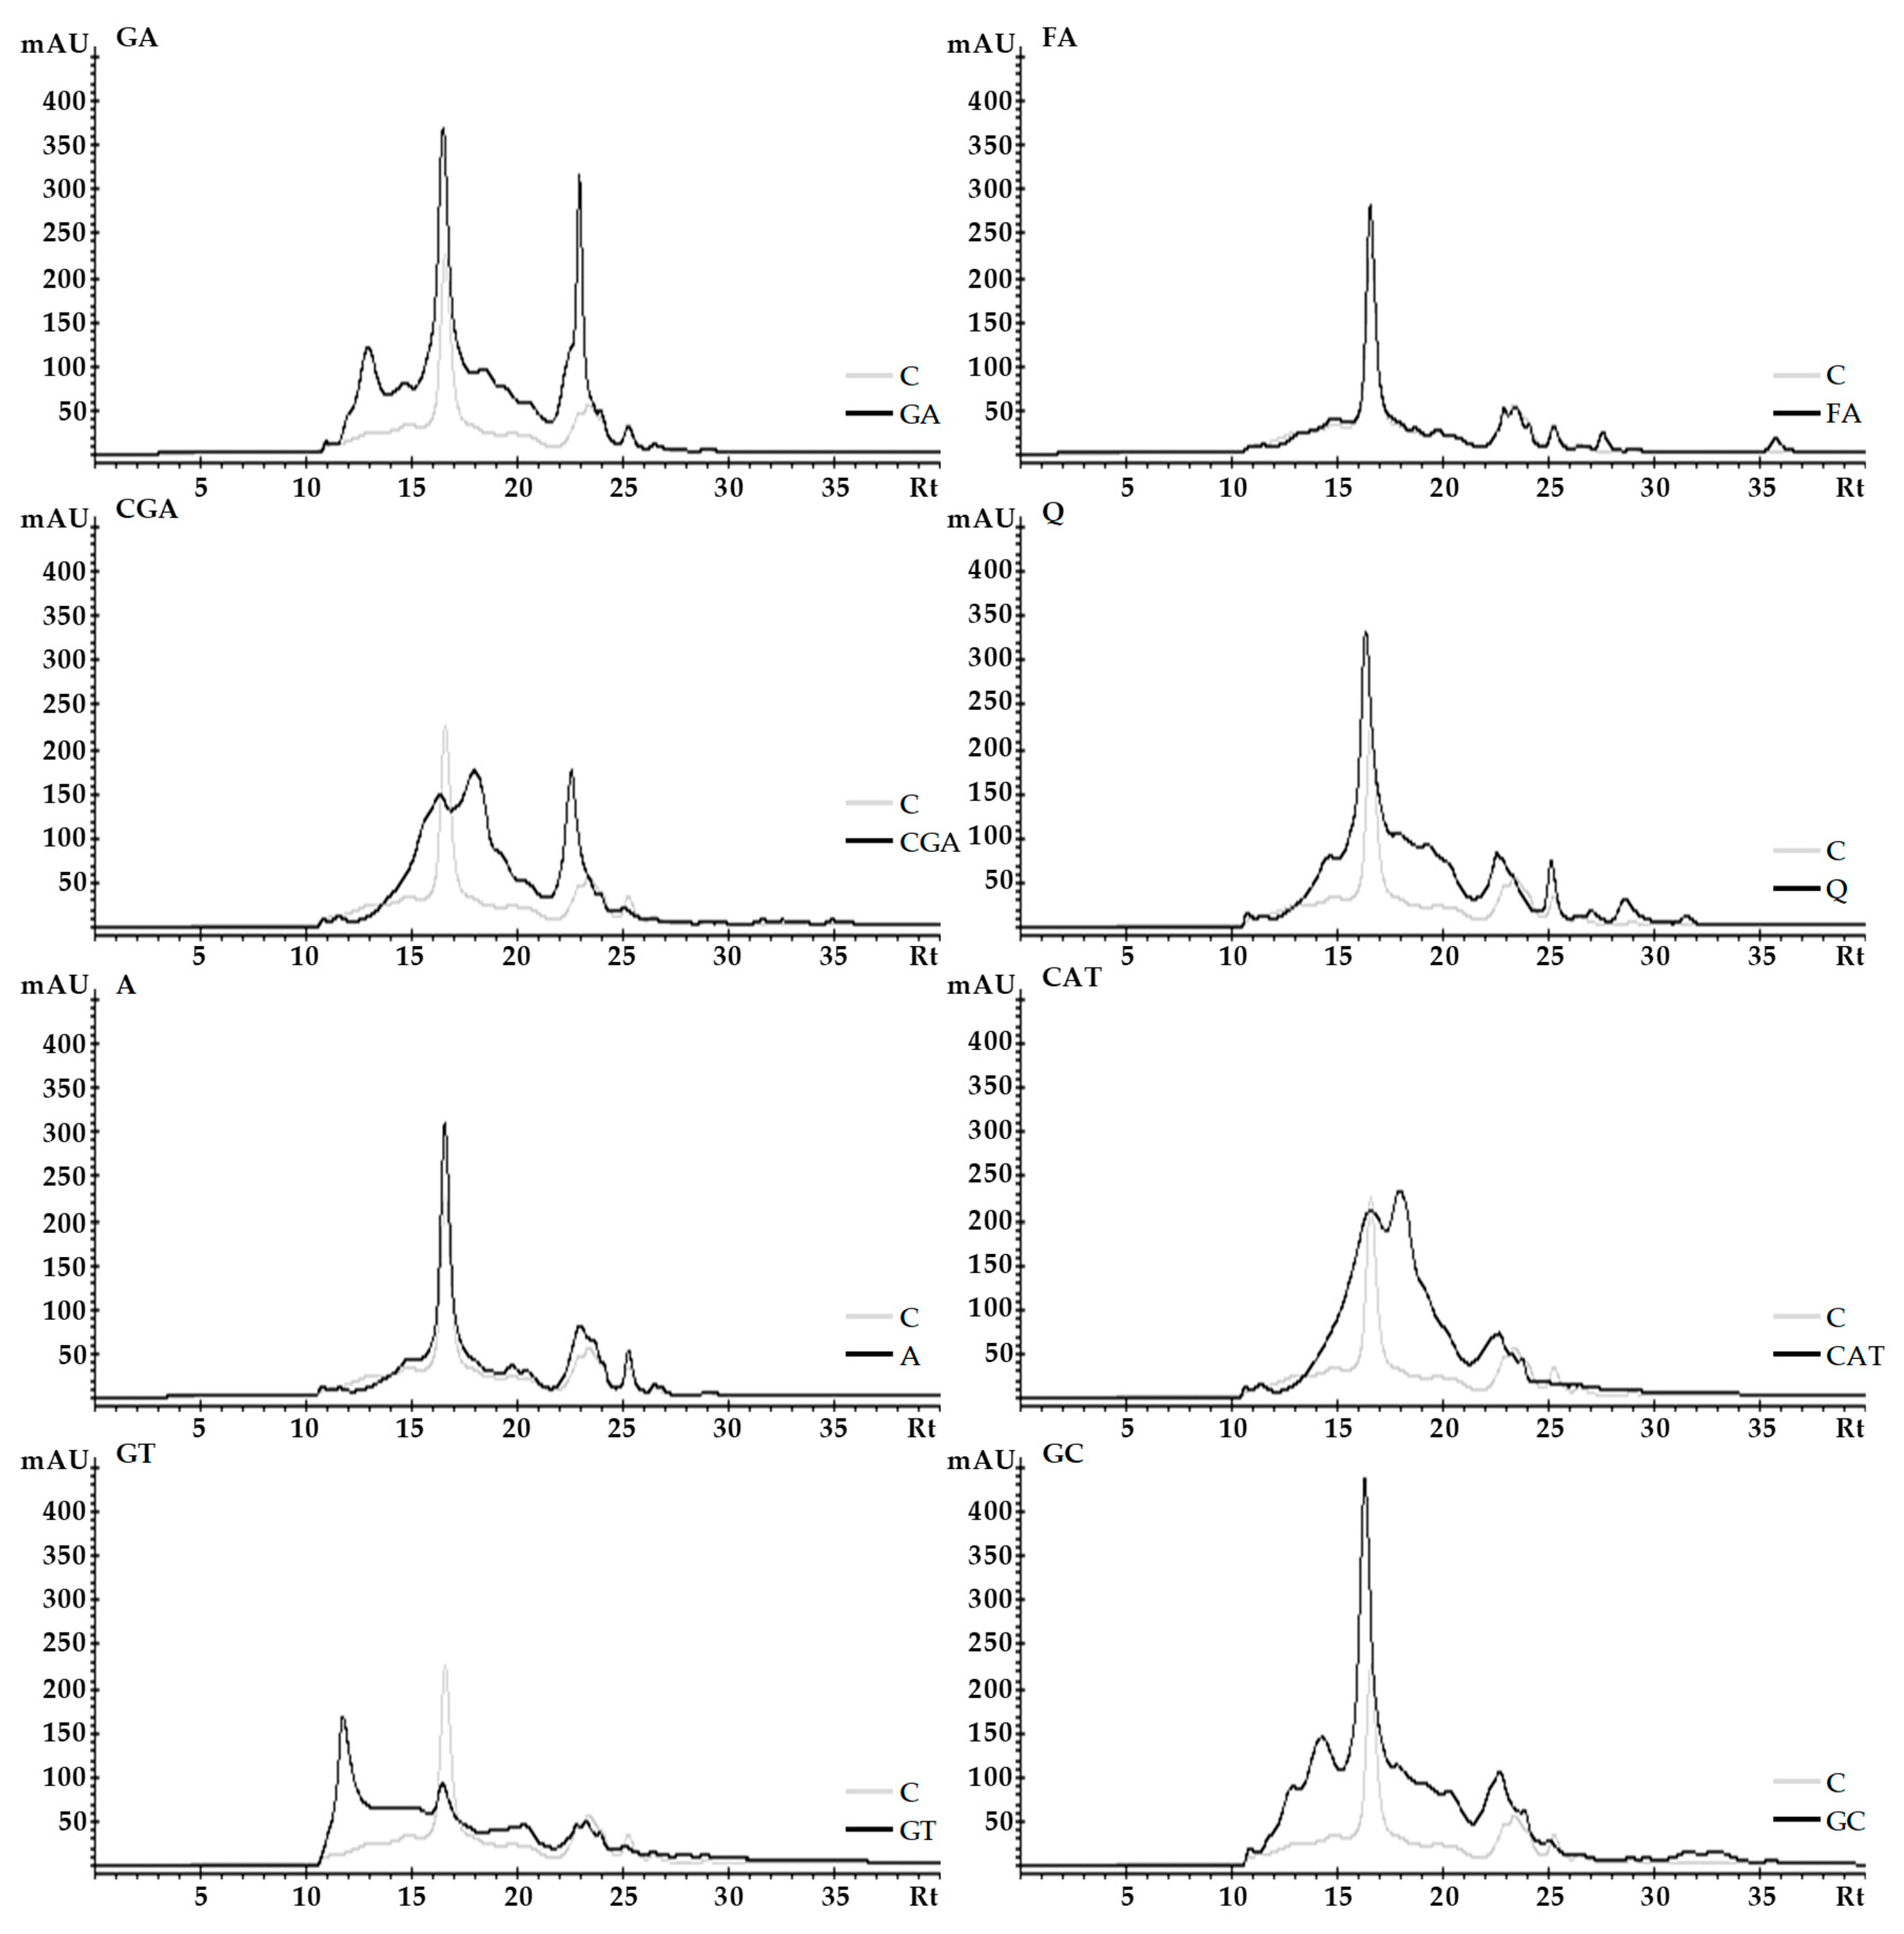
2.3. Size-Exclusion High-Performance Liquid Chromatography (SE-HPLC)
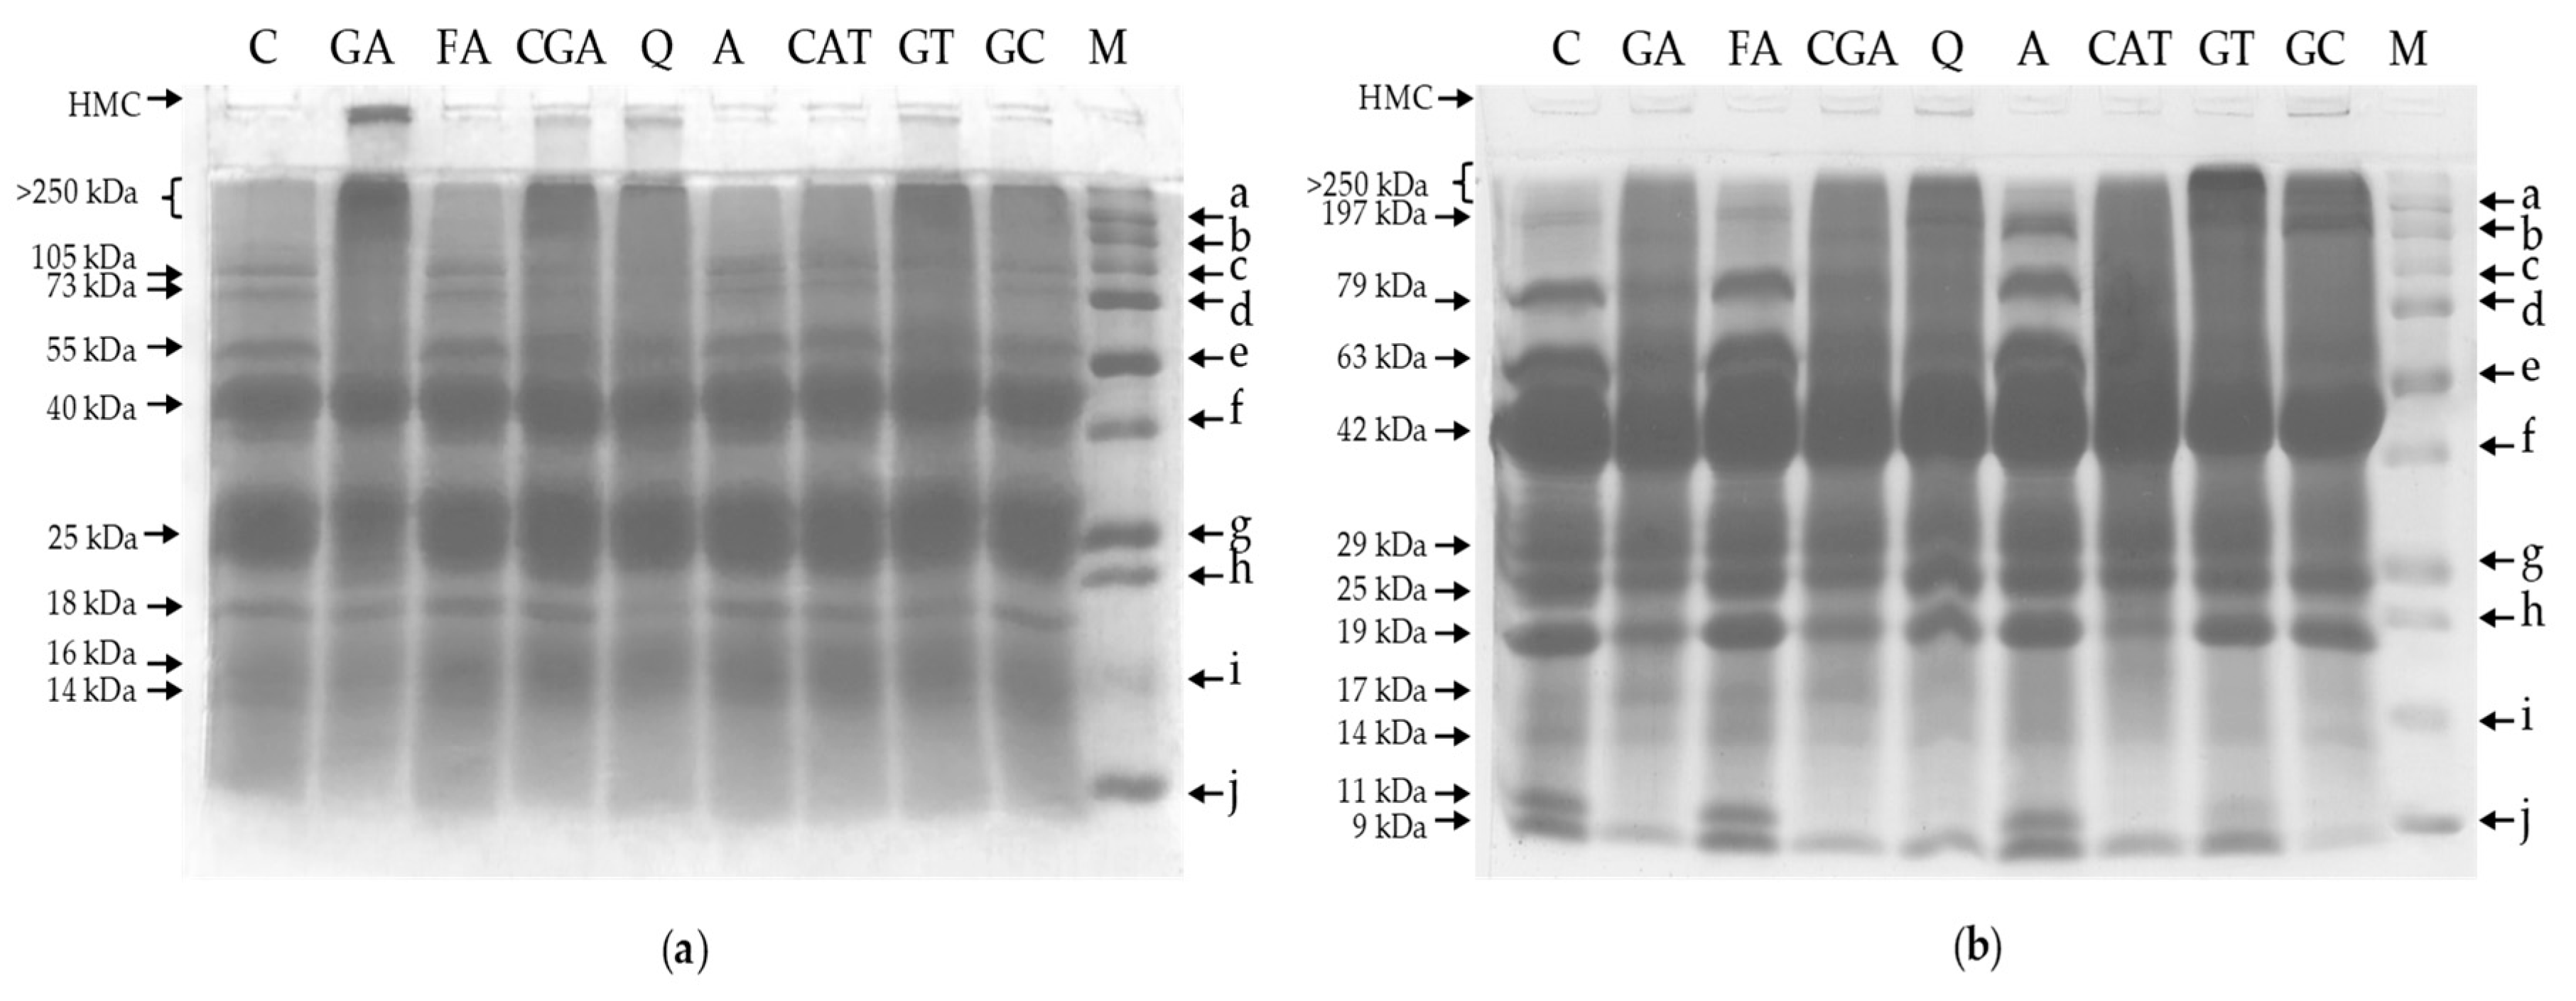
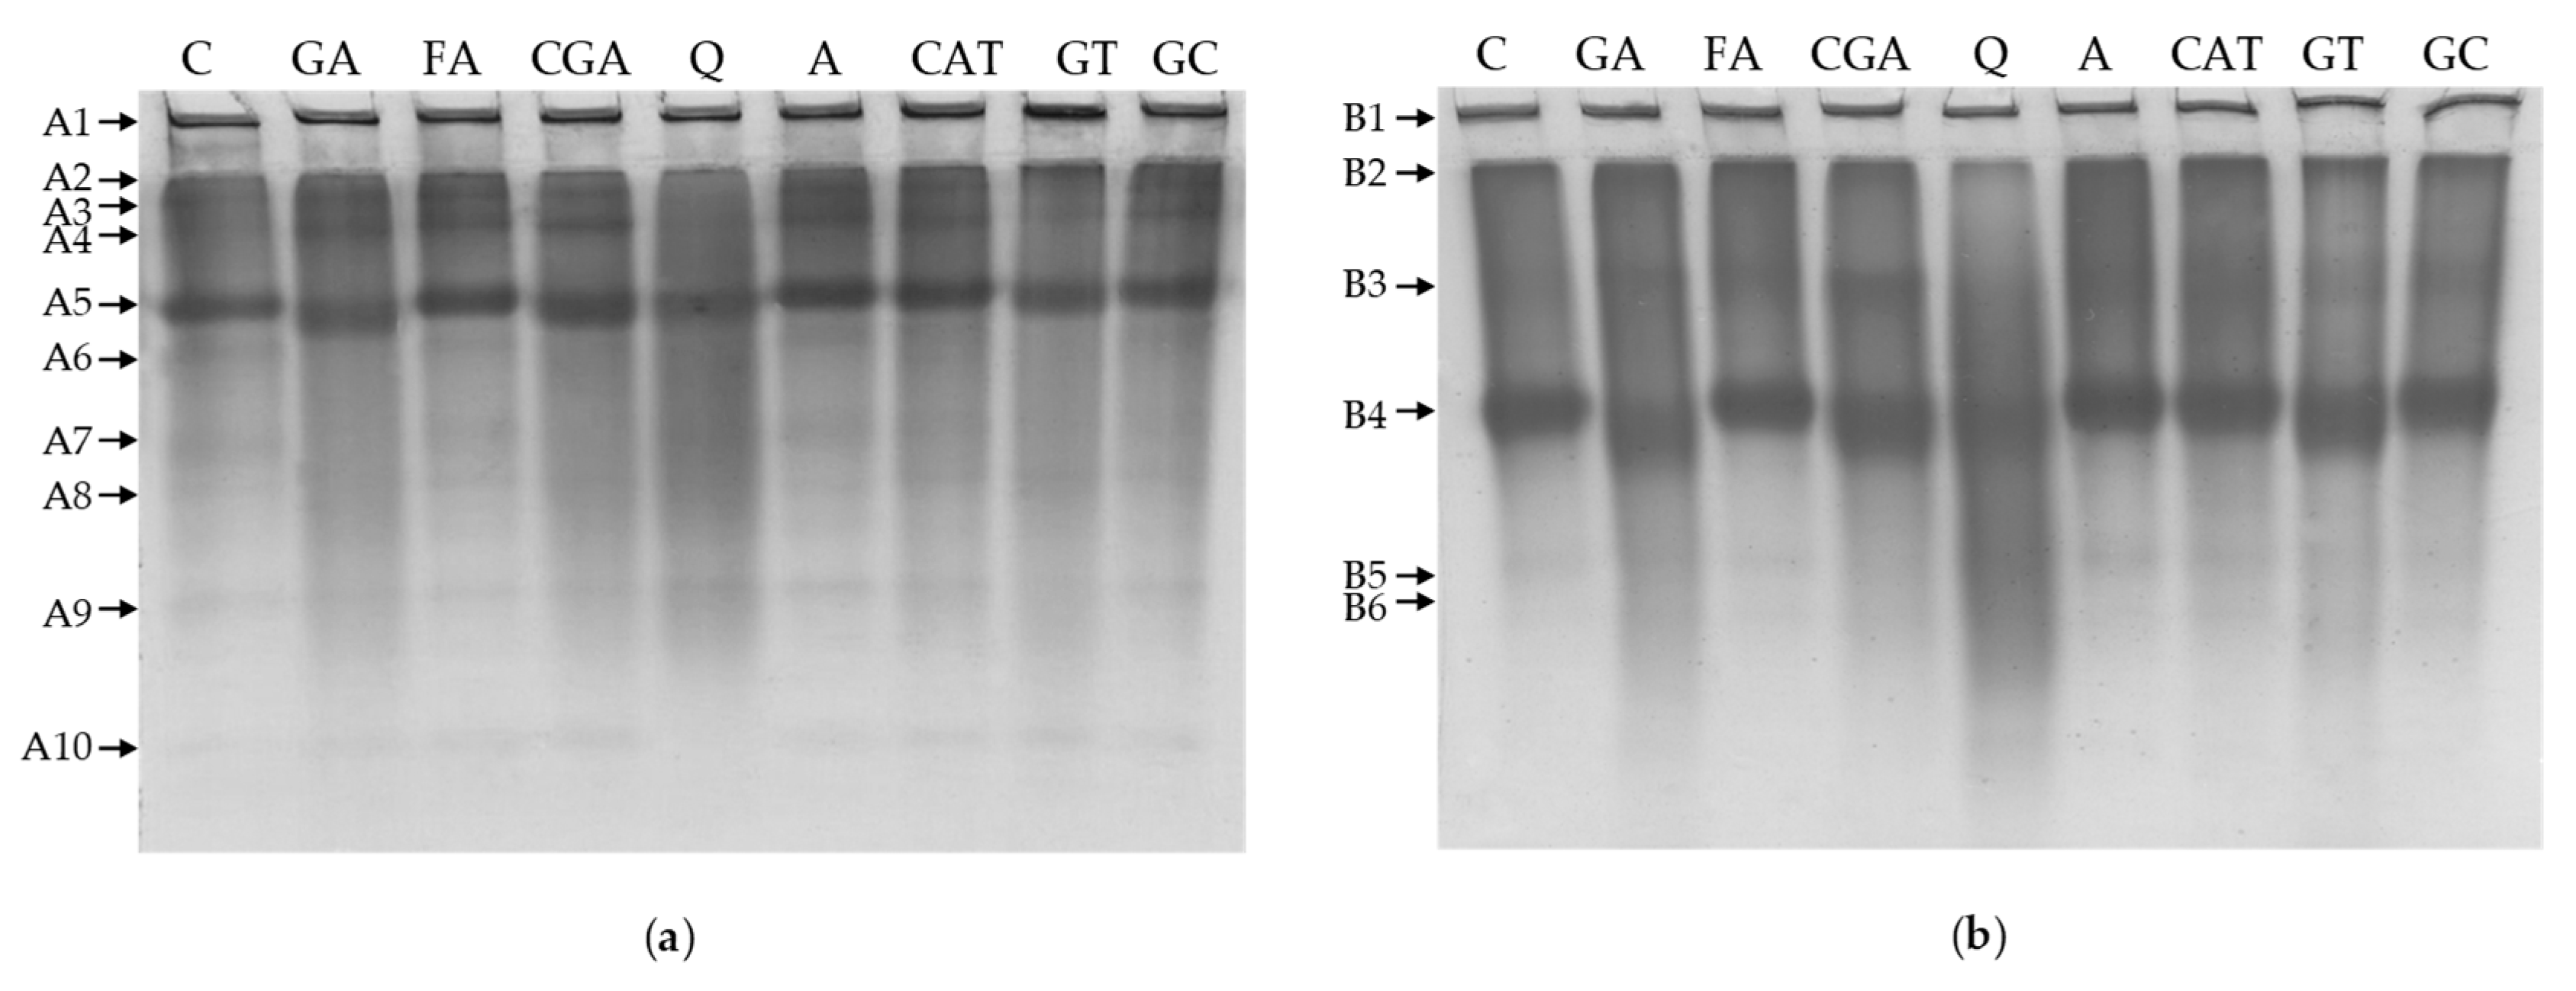
2.4. Polyacrylamide Gel Electrophoresis
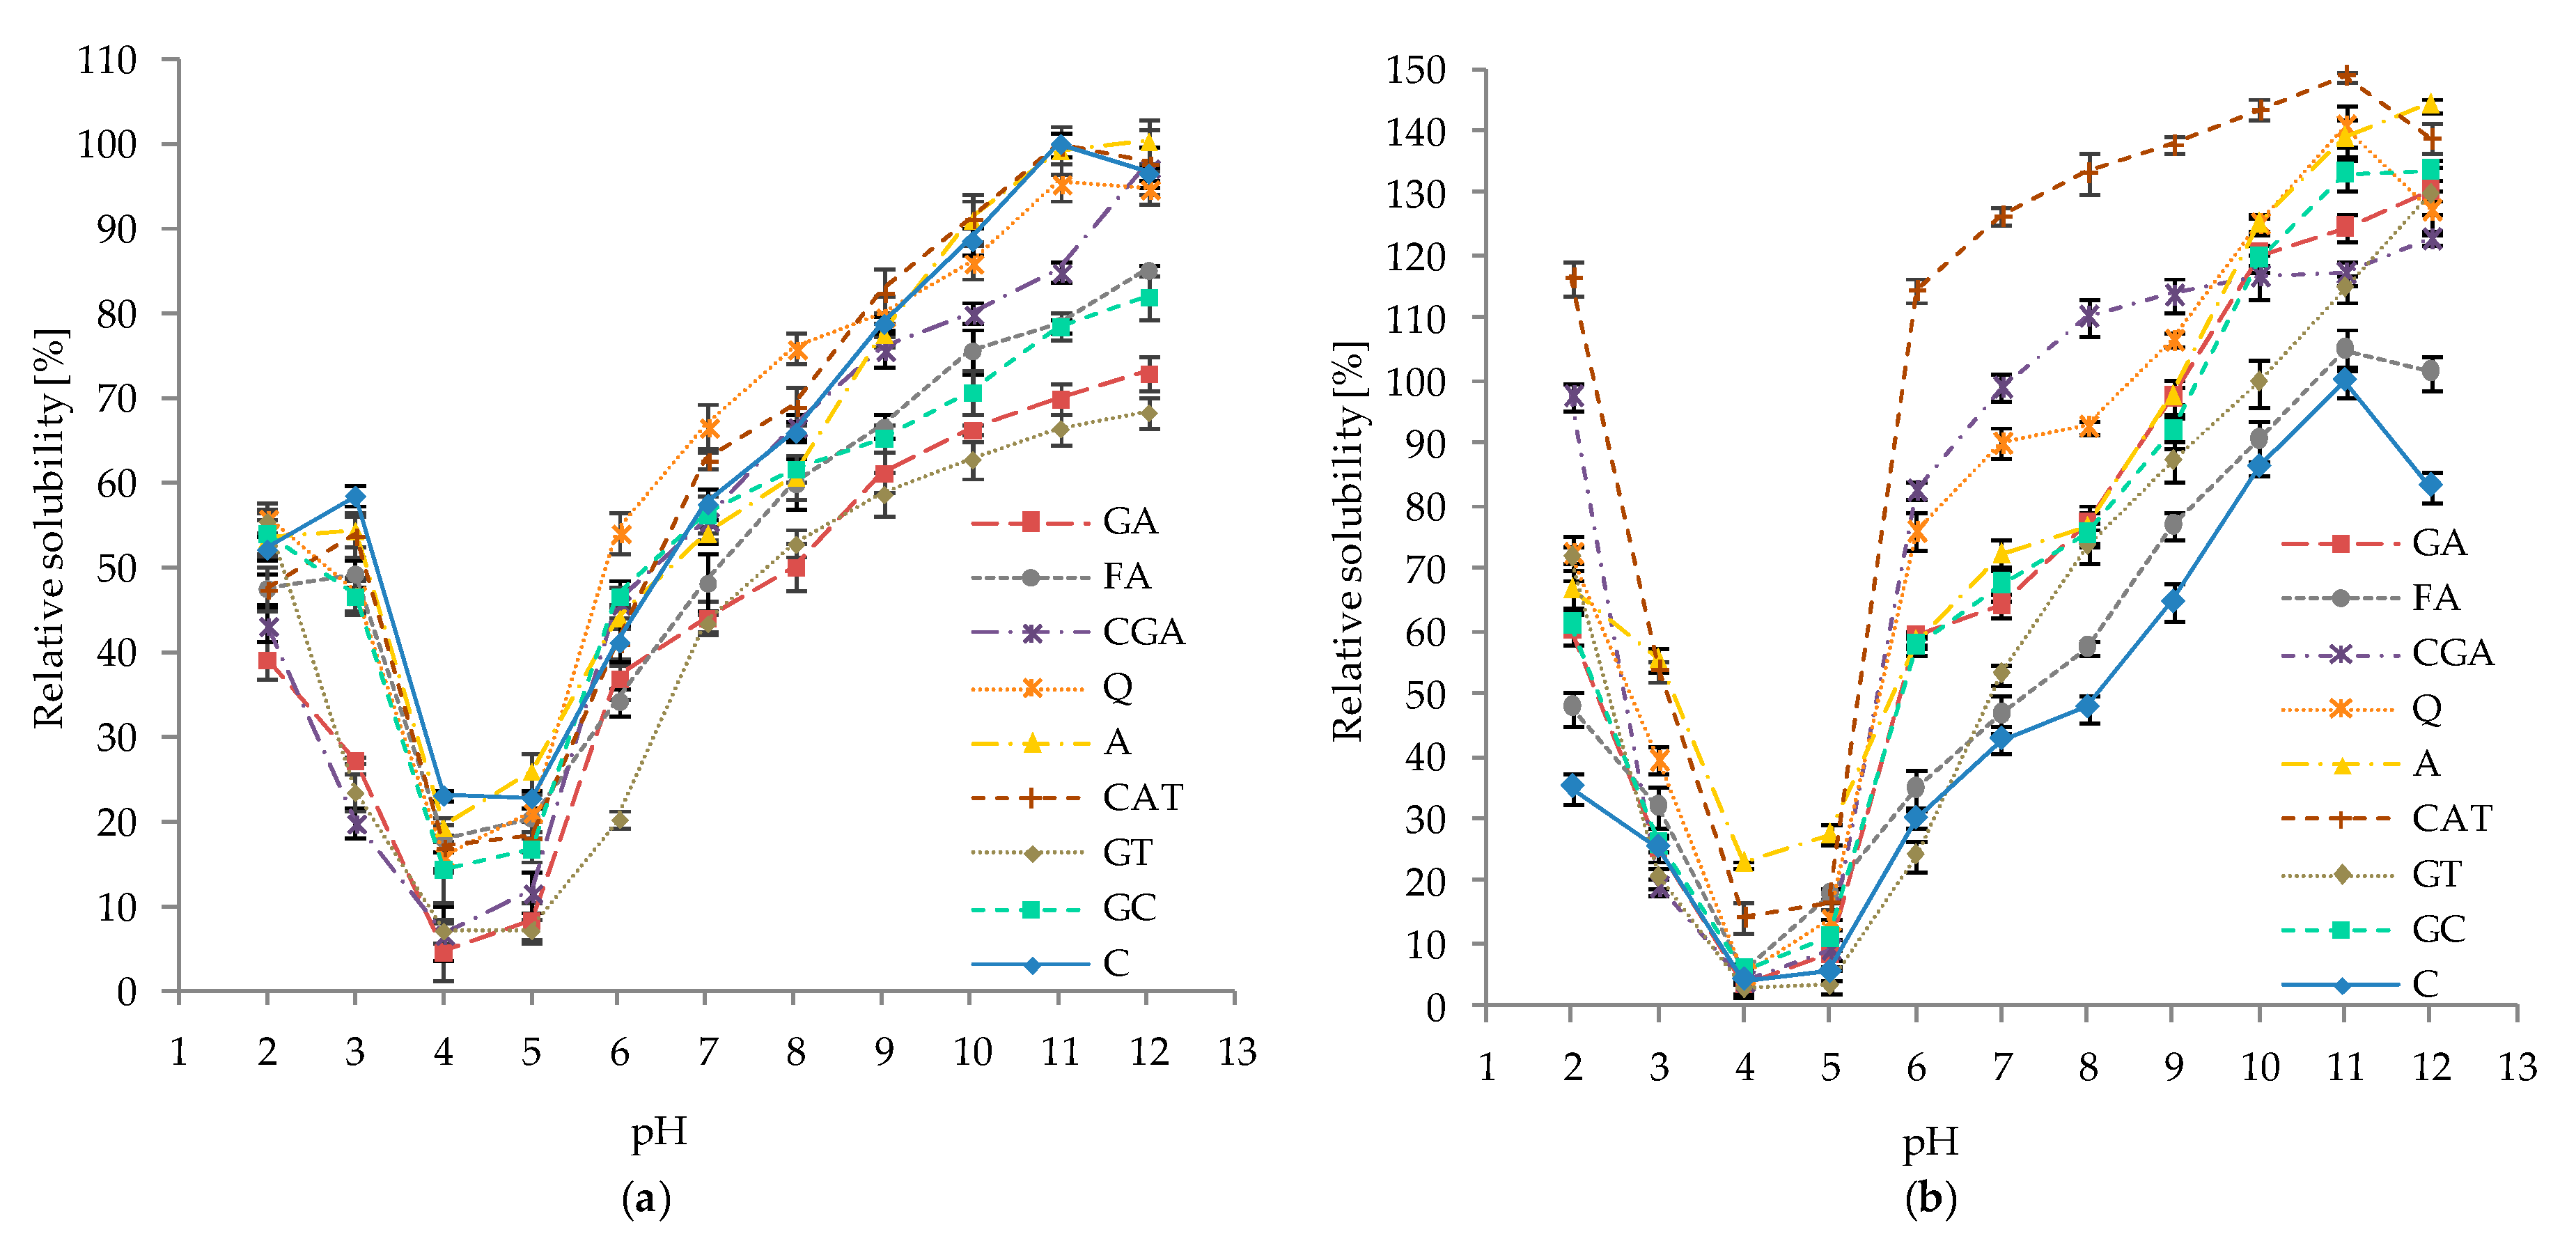
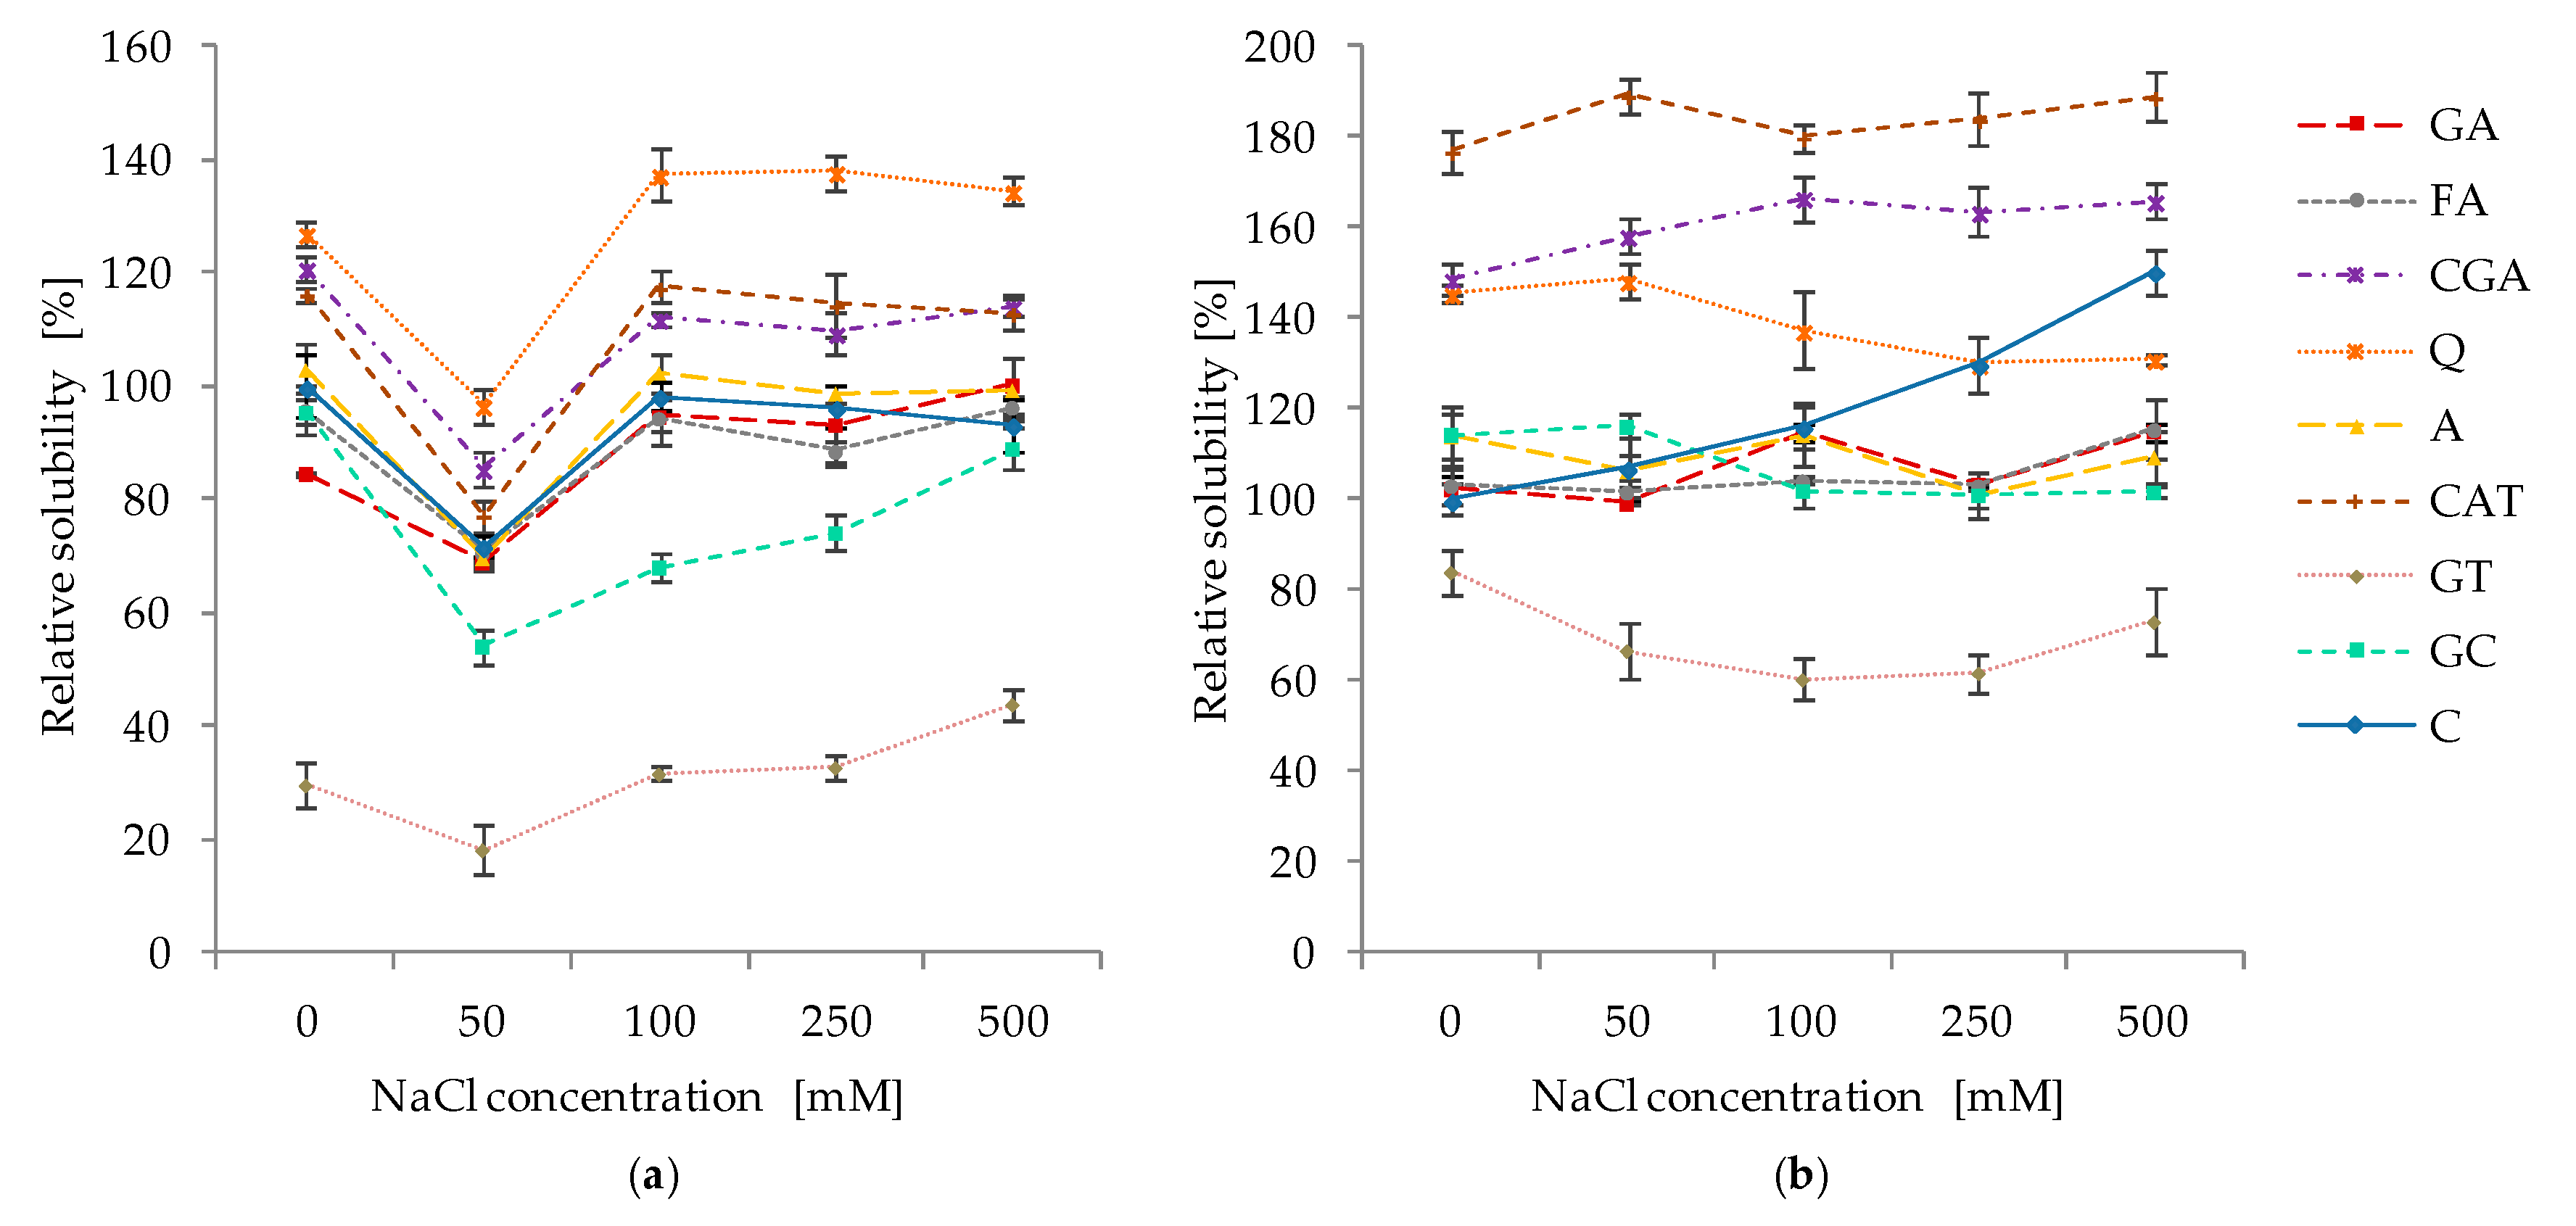
2.5. Effect of pH and Ionic Strength on the Solubility of Protein–Phenolic Complexes
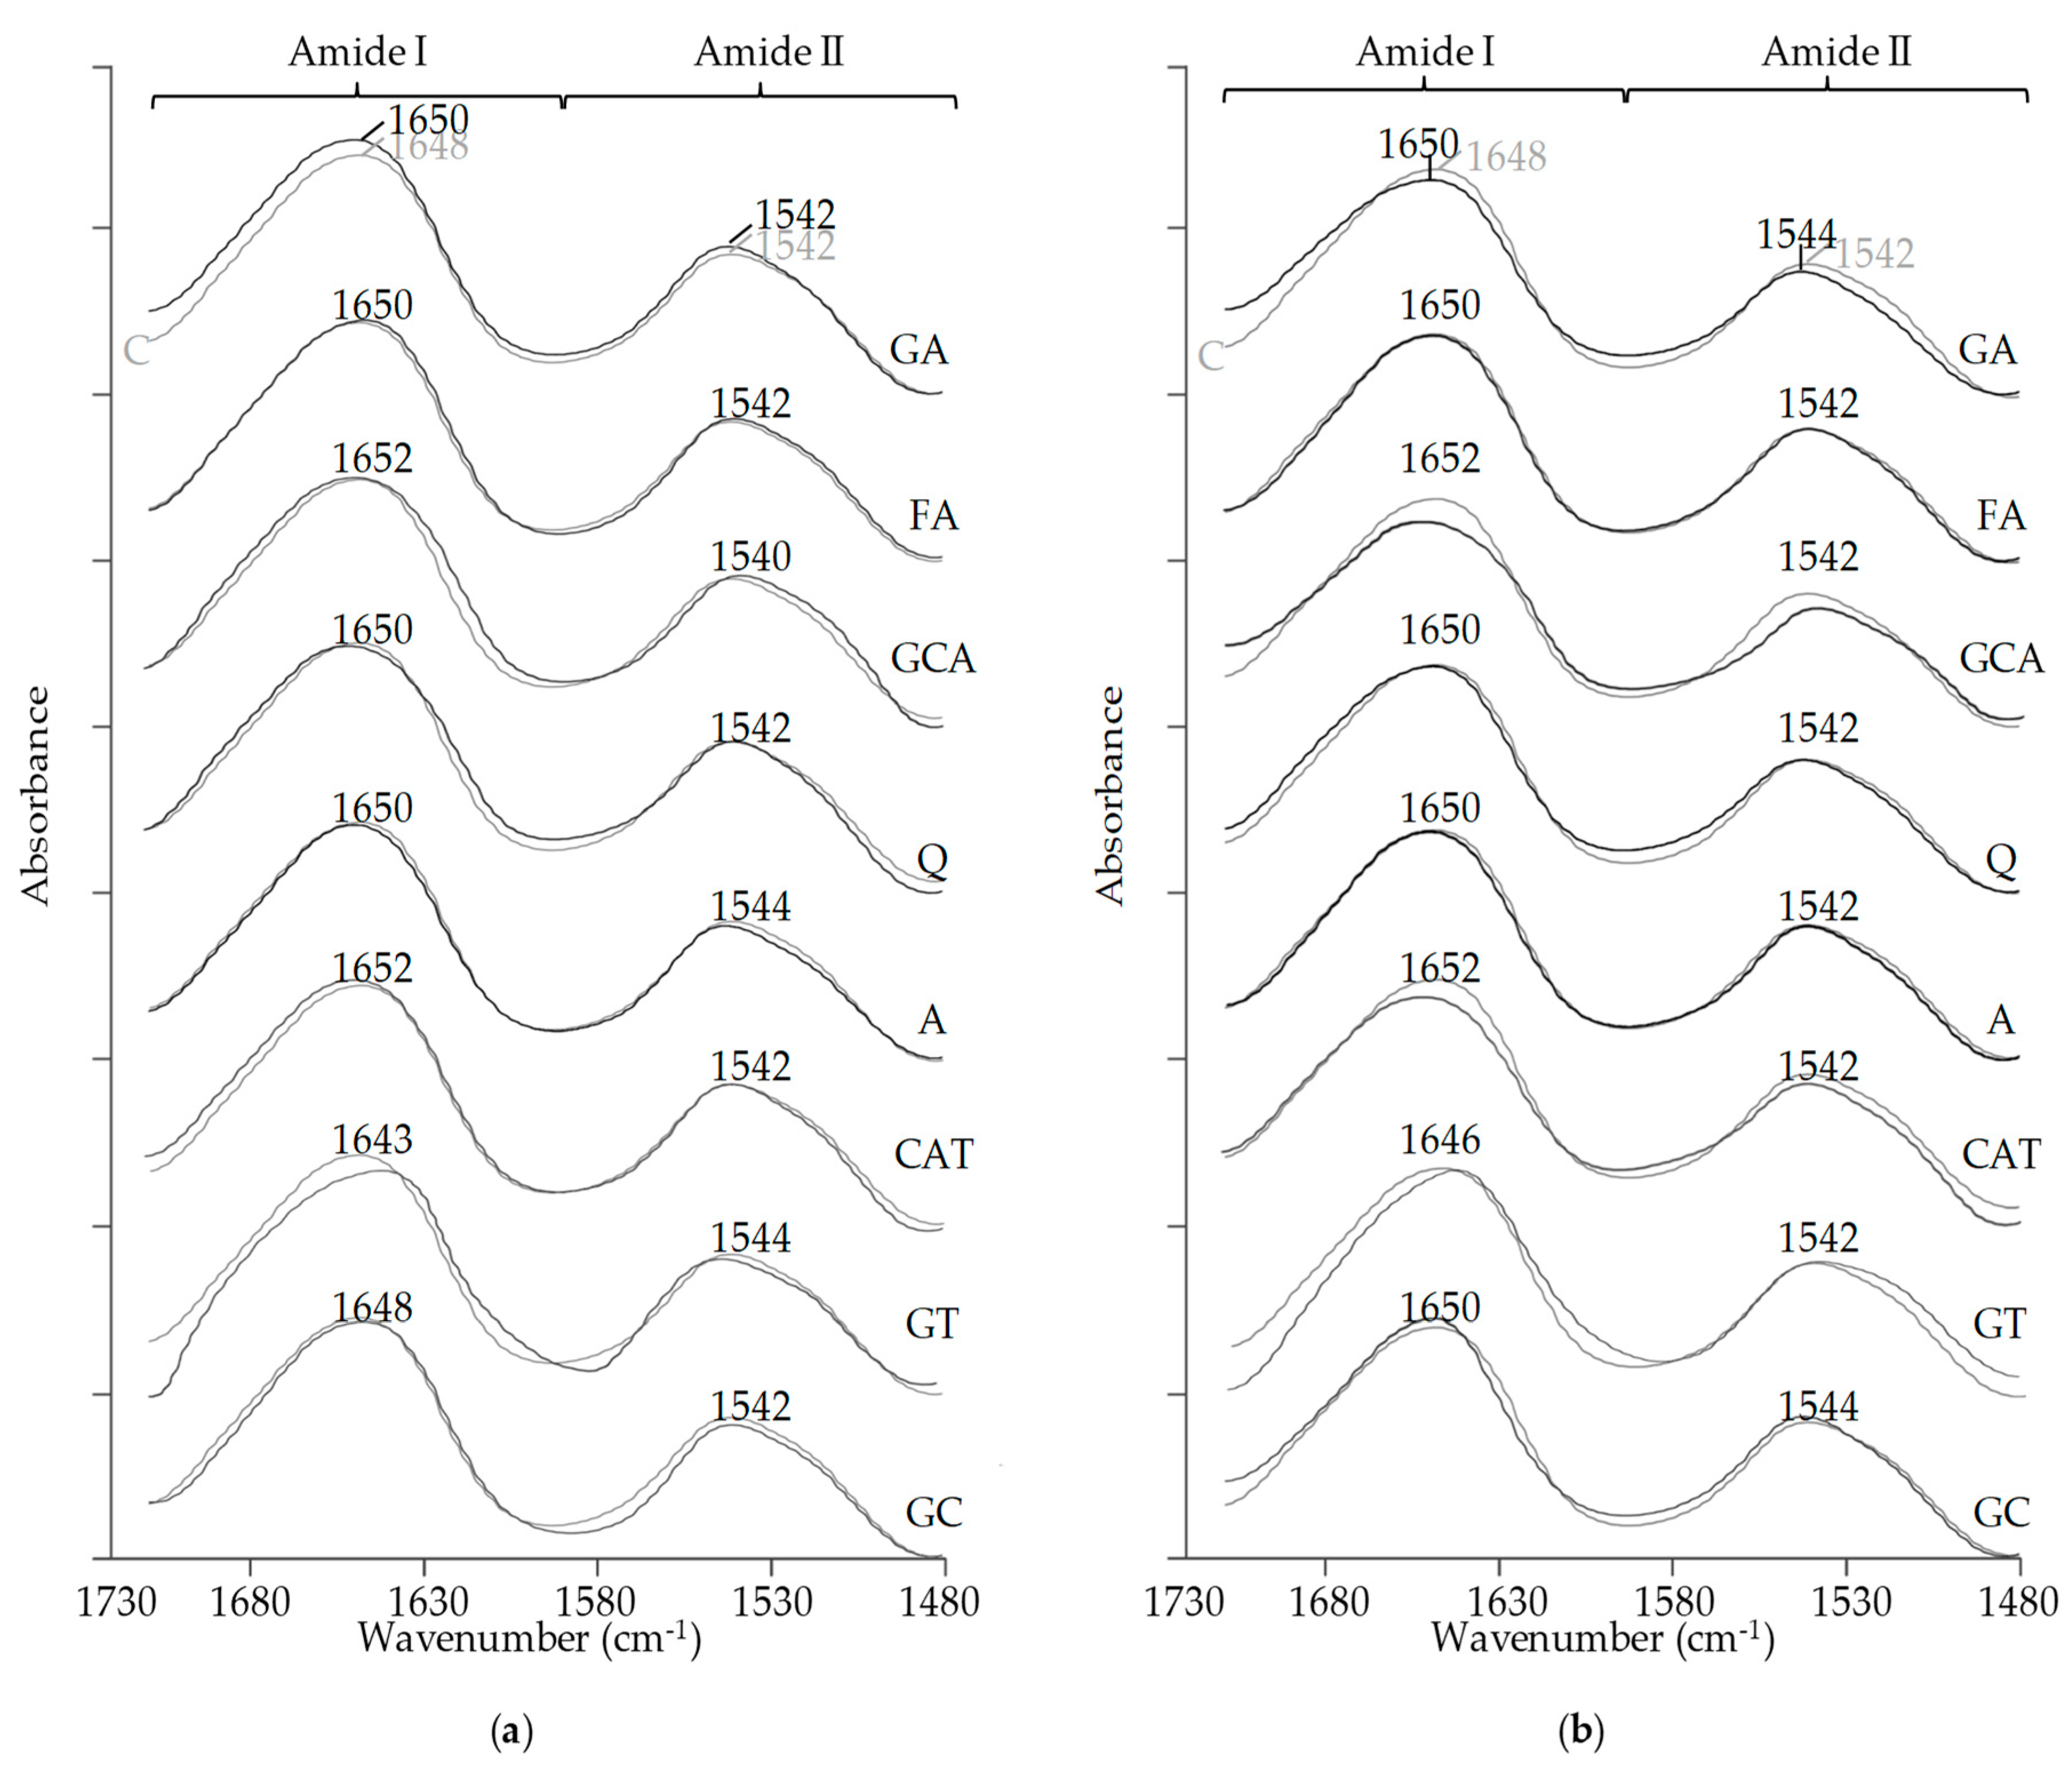
2.6. FT-IR Spectral Analysis
2.7. Binding Capacity of Proteins for Phenolic Compounds and Stability of Complexes
3. Discussion
3.1. UV-Vis Spectra of Protein–Phenolic Complexes
3.2. Changes in the Content of Proteins, Free Amino Groups, Thiol Groups, and Tryptophan Residues Affected by Phenolic Compounds
3.3. Size-Exclusion High-Performance Liquid Chromatography
3.4. Polyacrylamide Gel Electrophoresis
3.5. Effect of pH and Ionic Strength on the Solubility of Protein–Phenolics Complexes
3.6. FT-IR Spectral Analysis
3.7. Binding Capacity of Protein for Phenolic Compounds and Stability of Complexes
4. Materials and Methods
4.1. Chemicals
4.2. Plant Materials
4.3. Extraction of Protein Fractions
4.3.1. Isolation of Albumins
4.3.2. Isolation of Globulins
4.4. Extraction of Phenolic Compounds from Plant Materials
4.5. Incubation of Proteins with Phenolic Compounds
4.6. UV-Vis Spectra of Protein–Phenolic Complexes
4.7. Changes in Content of Proteins Free Amino Groups, Thiol Groups, and Tryptophan Residues Affected by Phenolic Compounds
4.7.1. Effect of Phenolic Compounds on The Content of Free Amino Groups
4.7.2. Effect of Phenolic Compounds on the Content of Free Thiol Groups
4.7.3. Effect of Phenolic Compounds on the Free Tryptophan Residues
4.8. Size-Exclusion High-Performance Liquid Chromatography
4.9. Polyacrylamide Gel Electrophoresis
4.9.1. SDS-PAGE
4.9.2. Native-PAGE
4.10. Effect of pH and Ionic Strength on The Solubility of Protein–Phenolics Complexes
4.10.1. Effect of pH
4.10.2. Effect of Ionic Strength
4.11. FT-IR Spectral Analysis
4.12. Binding Capacity of Protein for Phenolic Compounds and Stability of Complexes
4.12.1. Binding Capacity of Protein for Phenolic Compounds
4.12.2. Effect of pH on the Desorption Stability of Protein–Phenolic Complexes
4.12.3. Effect of Ionic Strength on the Desorption Stability of Protein–Phenolic Complexes
4.13. Determination of Phenolic Contents by HPLC
4.14. Statistical Analysis
5. Conclusions
Supplementary Materials
Author Contributions
Funding
Conflicts of Interest
References
- Weichselbaum, E.; Buttriss, J.L. Polyphenols in the diet. Nutr. Bull. 2010, 35, 157–164. [Google Scholar] [CrossRef]
- Tsao, R. Chemistry and biochemistry of dietary polyphenols. Nutrients 2010, 2, 1231–1246. [Google Scholar] [CrossRef]
- Li, A.; Li, S.; Zhang, Y.; Xu, X.; Chen, Y.; Li, H. Resources and Biological Activities of Natural Polyphenols. Nutrients 2014, 6, 6020–6047. [Google Scholar] [CrossRef] [PubMed] [Green Version]
- Manach, C.; Scalbert, A.; Morand, C.; Rémésy, C.; Jiménez, L. Polyphenols: Food sources and bioavailability. Am. J. Clin. Nutr. 2004, 79, 727–747. [Google Scholar] [CrossRef]
- D’Archivio, M.D.; Filesi, C.; Varì, R.; Scazzocchio, B.; Masella, R. Bioavailability of the polyphenols: Status and controversies. Int. J. Mol. Sci. 2010, 11, 1321–1342. [Google Scholar] [CrossRef] [PubMed]
- Scalbert, A.; Manach, C.; Morand, C.; Rémésy, C.; Jiménez, L. Dietary polyphenols and the prevention of diseases. Crit. Rev. Food Sci. Nutr. 2005, 45, 287–306. [Google Scholar] [CrossRef] [PubMed]
- D’Archivio, M.; Filesi, C.; Di Benedetto, R.; Gargiulo, R.; Giovannini, C.; Masella, R. Polyphenols, dietary sources and bioavailability. Ann. Ist. Super. Sanita 2007, 43, 348–361. [Google Scholar]
- Vauzour, D.; Rodriguez-Mateos, A.; Corona, G.; Oruna-Concha, M.J.; Spencer, J.P.E. Polyphenols and human health: Prevention of disease and mechanisms of action. Nutrients 2010, 2, 1106–1131. [Google Scholar] [CrossRef]
- Carocho, M.; Ferreira, I.C.F.R. A review on antioxidants, prooxidants and related controversy: Natural and synthetic compounds, screening and analysis methodologies and future perspectives. Food Chem. Toxicol. 2013, 51, 15–25. [Google Scholar] [CrossRef] [Green Version]
- Dziki, D.; Różyło, R.; Gawlik-Dziki, U.; Świeca, M. Current trends in the enhancement of antioxidant activity of wheat bread by the addition of plant materials rich in phenolic compounds. Trends Food Sci. Technol. 2014, 40, 48–61. [Google Scholar] [CrossRef]
- Buchwald-Werner, S.; Gärtner, C.; Horlacher, P.; Schwarz, G. Fortification with substances other than vitamins and minerals (polyphenols, carotenoids, fatty acids and phytosterols). In Food Fortification and Supplementation; Elsevier: Amsterdam, The Netherlands, 2008; pp. 41–59. [Google Scholar]
- Świeca, M.; Gawlik-Dziki, U.; Dziki, D.; Baraniak, B.; Czyż, J. The influence of protein-flavonoid interactions on protein digestibility in vitro and the antioxidant quality of breads enriched with onion skin. Food Chem. 2013, 141, 451–458. [Google Scholar] [CrossRef] [PubMed]
- Sęczyk, Ł.; Świeca, M.; Gawlik-Dziki, U.; Luty, M.; Czyż, J. Effect of fortification with parsley (Petroselinum crispum Mill.) leaves on the nutraceutical and nutritional quality of wheat pasta. Food Chem. 2015, 190, 419–428. [Google Scholar] [CrossRef] [PubMed]
- Świeca, M.; Sęczyk, Ł.; Gawlik-Dziki, U.; Dziki, D. Bread enriched with quinoa leaves—the influence of protein–phenolics interactions on the nutritional and antioxidant quality. Food Chem. 2014, 162, 54–62. [Google Scholar] [CrossRef] [PubMed]
- Jakobek, L. Interactions of polyphenols with carbohydrates, lipids and proteins. Food Chem. 2015, 175, 556–567. [Google Scholar] [CrossRef] [PubMed]
- Ali, H.; Alli, I.; Ismail, A.; Kermasha, S. Protein–phenolic interactions in food. Eurasian, J. Anal. Chem. 2012, 7, 123–133. [Google Scholar]
- Ozdal, T.; Capanoglu, E.; Altay, F. A review on protein–phenolic interactions and associated changes. Food Res. Int. 2013, 51, 954–970. [Google Scholar] [CrossRef]
- Rawel, H.M.; Czajka, D.; Rohn, S.; Kroll, J. Interactions of different phenolic acids and flavonoids with soy proteins. Int. J. Biol. Macromol. 2002, 30, 137–150. [Google Scholar] [CrossRef]
- Rawel, H.M.; Rohn, S. Nature of hydroxycinnamate-protein interactions. Phytochem. Rev. 2009, 9, 93–109. [Google Scholar] [CrossRef]
- Pandey, K.B.; Rizvi, S.I. Plant polyphenols as dietary antioxidants in human health and disease. Oxid. Med. Cell. Longev. 2009, 2, 270–278. [Google Scholar] [CrossRef]
- Rawel, H.M.; Rohn, S.; Kruse, H.-P.; Kroll, J. Structural changes induced in bovine serum albumin by covalent attachment of chlorogenic acid. Food Chem. 2002, 78, 443–455. [Google Scholar] [CrossRef]
- Hasni, I.; Bourassa, P.; Hamdani, S.; Samson, G.; Carpentier, R.; Tajmir-Riahi, H.-A. Interaction of milk α- and β-caseins with tea polyphenols. Food Chem. 2011, 126, 630–639. [Google Scholar] [CrossRef]
- Rawel, H.; Kroll, J.; Hohl, U.C. Model studies on reactions of plant phenols with whey proteins. Nahrung 2001, 45, 72–81. [Google Scholar] [CrossRef]
- Kroll, J.; Rawel, H.M. Reactions of Plant Phenols with Myoglobin: Influence of Chemical Structure of the Phenolic Compounds. J. Food Sci. 2001, 66, 48–58. [Google Scholar] [CrossRef]
- Rohn, S. Possibilities and limitations in the analysis of covalent interactions between phenolic compounds and proteins. Food Res. Int. 2014, 65, 13–19. [Google Scholar] [CrossRef]
- Shahidi, F.; Naczk, M. Phenolics in Food and Nutraceuticals; CRC Press: Boca Raton, FL, USA, 1995; ISBN 1587161389. [Google Scholar]
- Hatano, T.; Hori, M.; Hemingway, R.W.; Yoshida, T. Size exclusion chromatographic analysis of polyphenol–serum albumin complexes. Phytochemistry 2003, 63, 817–823. [Google Scholar] [CrossRef]
- Brudzynski, K.; Sjaarda, C.; Maldonado-Alvarez, L. A new look on protein-polyphenol complexation during honey storage: Is this a random or organized event with the help of dirigent-like proteins? PLoS ONE 2013, 8, e72897. [Google Scholar] [CrossRef]
- Rawel, H.M.; Kroll, J.; Rohn, S. Reactions of phenolic substances with lysozyme—Physicochemical characterisation and proteolytic digestion of the derivatives. Food Chem. 2001, 72, 59–71. [Google Scholar] [CrossRef]
- Schmid, M.; Prinz, T.K.; Stäbler, A.; Sängerlaub, S. Effect of Sodium Sulfite, Sodium Dodecyl Sulfate, and Urea on the Molecular Interactions and Properties of Whey Protein Isolate-Based Films. Front. Chem. 2016, 4, 49. [Google Scholar] [CrossRef]
- Mundi, S.; Aluko, R.E. Physicochemical and functional properties of kidney bean albumin and globulin protein fractions. Food Res. Int. 2012, 48, 299–306. [Google Scholar] [CrossRef]
- Carbonaro, M.; Cappelloni, M.; Nicoli, S.; Lucarini, M.; Carnovale, E. Solubility-Digestibility Relationship of Legume Proteins. J. Agric. Food Chem. 1997, 45, 3387–3394. [Google Scholar] [CrossRef]
- Kramer, R.M.; Shende, V.R.; Motl, N.; Pace, C.N.; Scholtz, J.M. Toward a molecular understanding of protein solubility: Increased negative surface charge correlates with increased solubility. Biophys. J. 2012, 102, 1907–1915. [Google Scholar] [CrossRef] [PubMed]
- Prigent, S.V.E.; Voragen, A.G.J.; van Koningsveld, G.A.; Baron, A.; Renard, C.M.G.C.; Gruppen, H. Interactions between globular proteins and procyanidins of different degrees of polymerization. J. Dairy Sci. 2009, 92, 5843–5853. [Google Scholar] [CrossRef] [PubMed]
- Labuckas, D.O.; Maestri, D.M.; Perelló, M.; Martínez, M.L.; Lamarque, A.L. Phenolics from walnut (Juglans regia L.) kernels: Antioxidant activity and interactions with proteins. Food Chem. 2008, 107, 607–612. [Google Scholar] [CrossRef]
- Malik, M.A.; Sharma, H.K.; Saini, C.S. Effect of removal of phenolic compounds on structural and thermal properties of sunflower protein isolate. J. Food Sci. Technol. 2016, 53, 3455–3464. [Google Scholar] [CrossRef] [PubMed] [Green Version]
- Kanakis, C.D.; Hasni, I.; Bourassa, P.; Tarantilis, P.A.; Polissiou, M.G.; Tajmir-Riahi, H.-A. Milk β-lactoglobulin complexes with tea polyphenols. Food Chem. 2011, 127, 1046–1055. [Google Scholar] [CrossRef] [PubMed]
- Kang, J.; Liu, Y.; Xie, M.-X.; Li, S.; Jiang, M.; Wang, Y.-D. Interactions of human serum albumin with chlorogenic acid and ferulic acid. Biochim. Biophys. Acta Gen. Subj. 2004, 1674, 205–214. [Google Scholar] [CrossRef] [PubMed]
- Barth, A. Infrared spectroscopy of proteins. Biochim. Biophys. Acta Bioenerg. 2007, 1767, 1073–1101. [Google Scholar] [CrossRef] [PubMed] [Green Version]
- Sivam, A.S.; Sun-Waterhouse, D.; Perera, C.O.; Waterhouse, G.I.N. Application of FT-IR and Raman spectroscopy for the study of biopolymers in breads fortified with fibre and polyphenols. Food Res. Int. 2013, 50, 574–585. [Google Scholar] [CrossRef]
- Roy, D.; Dutta, S.; Maity, S.S.; Ghosh, S.; Singha Roy, A.; Ghosh, K.S.; Dasgupta, S. Spectroscopic and docking studies of the binding of two stereoisomeric antioxidant catechins to serum albumins. J. Lumin. 2012, 132, 1364–1375. [Google Scholar] [CrossRef]
- Ribeiro, A.; Monteiro, S.; Carrapiço, B.; Ferreira, R. Are Vicilins Another Major Class of Legume Lectins? Molecules 2014, 19, 20350–20373. [Google Scholar] [CrossRef] [Green Version]
- Adler-Nissen, J. Determination of the degree of hydrolysis of food protein hydrolysates by trinitrobenzenesulfonic acid. J. Agric. Food Chem. 1979, 27, 1256–1262. [Google Scholar] [CrossRef] [PubMed]
- Ellman, G.L. Tissue sulfhydryl groups. Arch. Biochem. Biophys. 1959, 82, 70–77. [Google Scholar] [CrossRef]
- Rawel, H.M.; Frey, S.K.; Meidtner, K.; Kroll, J.; Schweigert, F.J. Determining the binding affinities of phenolic compounds to proteins by quenching of the intrinsic tryptophan fluorescence. Mol. Nutr. Food Res. 2006, 50, 705–713. [Google Scholar] [CrossRef] [PubMed]
- Laemmli, U.K. Cleavage of Structural Proteins during the Assembly of the Head of Bacteriophage T4. Nature 1970, 227, 680–685. [Google Scholar] [CrossRef] [PubMed]
- Wittig, I.; Braun, H.-P.; Schägger, H. Blue native PAGE. Nat. Protoc. 2006, 1, 418–428. [Google Scholar] [CrossRef] [PubMed] [Green Version]
- Carmody, W.R. Easily prepared wide range buffer series. J. Chem. Educ. 1961, 38, 559. [Google Scholar] [CrossRef]
- Dalluge, J.J.; Nelson, B.C. Determination of tea catechins. J. Chromatogr. A 2000, 881, 411–424. [Google Scholar] [CrossRef]
- Bonoli, M.; Pelillo, M.; Toschi, T.G.; Lercker, G. Analysis of green tea catechins: Comparative study between HPLC and HPCE. Food Chem. 2003, 81, 631–638. [Google Scholar] [CrossRef]
- Babova, O.; Occhipinti, A.; Maffei, M.E. Chemical partitioning and antioxidant capacity of green coffee (Coffea arabica and Coffea canephora) of different geographical origin. Phytochemistry 2016, 123, 33–39. [Google Scholar] [CrossRef] [PubMed]
Sample Availability: Samples of the compounds are not available from the authors. |


| Sample | Albumins | Globulins | ||
|---|---|---|---|---|
| Phenolics Bound µmol/g Protein ± SD | ||||
| Phenolics | GA | 172.2 Aa ± 5.32 | 157.4 Bc ± 4.02 | |
| FA | 5.5 Ac ± 2.15 | 6.2 Ae ± 2.32 | ||
| CGA | 174.6 Ba ± 5.12 | 187.5 Aa ± 6.50 | ||
| Q | 149.4 Ab ± 6.95 | 131.4 Bc ± 7.72 | ||
| A | 8.9 Ac ± 2.24 | 7.1 Ad ± 2.22 | ||
| CAT | 157.3 Ab ± 6.84 | 165.3 Ab ± 6.12 | ||
| Extracts | GT | GCAT | 5.2 Bf ± 0.82 | 11.3 Ad ± 0.61 |
| EGCAT | 21.0 Ac ± 1.09 | 19.3 Ac ± 1.39 | ||
| CAT | 174.3 Ba ± 2.25 | 184.6 Aa ± 4.37 | ||
| ECAT | 8.6 Be ± 0.23 | 10.0 Ae ± 0.65 | ||
| EGCATG | 89.3 Ab ± 1.09 | 86.2 Ab ± 2.97 | ||
| ECATG | 12.1 Ad ± 0.54 | 8.5 Bf ± 0.63 | ||
| GC | NCGA | 7.1 Bd ± 0.33 | 11.7 Ac ± 0.55 | |
| CGA | 212.9 Ba ± 8.12 | 231.5 Aa ± 7.11 | ||
| CCGA | 10.9 Bb ± 1.18 | 18.5 Ab ± 2.72 | ||
| FQA | 10.8 Bb ± 0.42 | 3.3 Af ± 0.43 | ||
| 3,4-DCQA | 2.9 B ± 0.30 | 3.8 Aef ± 0.59 | ||
| 3,5-DCQA | 8.9 Ac ± 0.61 | 9.7 Ad ± 1.71 | ||
| 4,5-DCQA | 3.9 Be ± 0.48 | 4.1 Ae ± 0.33 | ||
© 2019 by the authors. Licensee MDPI, Basel, Switzerland. This article is an open access article distributed under the terms and conditions of the Creative Commons Attribution (CC BY) license (http://creativecommons.org/licenses/by/4.0/).
Share and Cite
Sęczyk, Ł.; Świeca, M.; Kapusta, I.; Gawlik-Dziki, U. Protein–Phenolic Interactions as a Factor Affecting the Physicochemical Properties of White Bean Proteins. Molecules 2019, 24, 408. https://0-doi-org.brum.beds.ac.uk/10.3390/molecules24030408
Sęczyk Ł, Świeca M, Kapusta I, Gawlik-Dziki U. Protein–Phenolic Interactions as a Factor Affecting the Physicochemical Properties of White Bean Proteins. Molecules. 2019; 24(3):408. https://0-doi-org.brum.beds.ac.uk/10.3390/molecules24030408
Chicago/Turabian StyleSęczyk, Łukasz, Michał Świeca, Ireneusz Kapusta, and Urszula Gawlik-Dziki. 2019. "Protein–Phenolic Interactions as a Factor Affecting the Physicochemical Properties of White Bean Proteins" Molecules 24, no. 3: 408. https://0-doi-org.brum.beds.ac.uk/10.3390/molecules24030408