Article

Biobased Poly(ethylene furanoate) Polyester/TiO2 Supported Nanocomposites as Effective Photocatalysts for Anti-inflammatory/Analgesic Drugs

by
Anastasia Koltsakidou
1,
Zoi Terzopoulou
2,
George Z. Kyzas
3,
Dimitrios N. Bikiaris
2 and
Dimitra A. Lambropoulou
1,*
1
Laboratory of Environmental Pollution Control, Department of Chemistry, Aristotle University of Thessaloniki, GR–541 24 Thessaloniki, Greece
2
Laboratory of Polymer Chemistry and Technology, Department of Chemistry, Aristotle University of Thessaloniki, GR-541 24 Thessaloniki, Greece
3
Hephaestus Advanced Laboratory, Eastern Macedonia and Thrace Institute of Technology, GR-654 04 Kavala, Greece
*
Author to whom correspondence should be addressed.
Submission received: 16 January 2019 / Revised: 31 January 2019 / Accepted: 1 February 2019 / Published: 4 February 2019
(This article belongs to the Special Issue Polymer Composites and Nanocomposites with Enhanched Properties)

Abstract

:
In the present study, polymer supported nanocomposites, consisting of bio-based poly(ethylene furanoate) polyester and TiO2 nanoparticles, were prepared and evaluated as effective photocatalysts for anti-inflammatory/analgesic drug removal. Nanocomposites were prepared by the solvent evaporation method containing 5, 10, 15, and 20 wt% TiO2 and characterized using Fourier Transform Infrared spectroscopy (FTIR), differential scanning calorimetry (DSC), wide-angle X-ray diffraction (WAXD), thermogravimetric analysis (TGA), and scanning electron microscopy (SEM). Thin films of them have been prepared by the melt press and optimization of the photocatalytic procedure was conducted for the most efficient synthesized photocatalyst. Finally, mineralization was evaluated by means of Total organic carbon (TOC) reduction and ion release, while the transformation products (TPs) generated during the photocatalytic procedure were identified by high-resolution mass spectrometry.

1. Introduction

During the last decades, photocatalysis is used for the treatment of a variety of pollutants such as dyes, pesticides pharmaceuticals, and various endocrine disrupting compounds [1,2,3,4]. Titanium dioxide has been reported as one of the most efficient photocatalysts, mostly because of its low cost, the high chemical, photo, and biological stability and high catalytic activity. Apart from that, development of multifunctional TiO2-based materials for biomedical applications were extensively reported in literature [5,6,7,8]. Titanium dioxide is commercially available in the form of powder that shows the greatest surface area and efficiency. However, when applied to wastewater in the form of powder, it suffers from the following drawbacks: Low light utilization efficiency of suspended photocatalyst, due to the attenuation loss suffered by light rays [9]; requirement of post-treatment recovery, that is both time and money consuming, and also leads to the loss of catalyst [10]; and possible cause of un-favorable human health problems associated with the mobility of the powder form [11].
In order to overcome all the aforementioned drawbacks, continuous efforts are being made to support TiO2 on various substrates. Membranes that are commonly used to purify water and to separate TiO2 particles from treated water are an ideal material to support TiO2. Since Anderson et al. introduced the photocatalysis by immobilizing TiO2 in a membrane [12], many scientists have applied it to both organic [13,14,15] and inorganic membranes [16]. Polymers such as polyamide, polysulfone, polyethersulfone, polyvinylidene fluoride, polypropylene, polyacrylonitrile, and cellulose acetate have been used as substrates for TiO2 based photocatalysts [17]. Moreover, the importance of immobilizing TiO2 in a polymer matrix can also be noted for different important applications, as for example, in hybrid photovoltaics [18]. Due to the ongoing progress in hybrid solar cells, the reached efficiency values become more and more competitive with conventional photovoltaics. The morphology of the active layer turned out to be very important for these devices. Mainly titania (TiO2) of different morphologies is used as a major component in such hybrid solar cells. In addition to research focusing on increasing device efficiencies, the development of alternative, more environmentally friendly hybrid solar cell fabrication routes is interesting.
Polymer support appears to be highly suitable for TiO2 due to a series of advantages. Firstly, polymers are innoxious materials, chemically inert and mechanically stable with high durability [19]. They can offer pre-concentration of the organic pollutants on their surface, increasing the efficiency of adsorption and subsequent oxidation, due to their hydrophobic nature [19]. Furthermore, they are inexpensive, readily available with thermos-softening properties, which increase the ease of coating TiO2 on them by simple thermal treatment methods [20]. Finally, many of them have high UV-resistance, hence they do not undergo oxidation readily [21].
Bio-based polymers that are either biodegradable or at least partly bio-based, constitute one of the fastest growing markets [22,23,24,25,26,27,28], due to the great concern about the depletion of fossil resources, as well as the growing accumulation of plastic waste in the environment. During the last years, the production of furan derivatives from sugars has become exciting in chemistry and in catalysis studies, because it aids one of the major routes for achieving sustainable energy supply and chemicals production. 5-HMF, 2,5-FDCA, and 2,5-dimethylfuran (2,5-DMF) have been called the “sleeping giants” of renewable intermediate chemicals and can be produced from biomass after its fermentation [29,30]. FDCA is considered the bio-based equivalent of terepthalic acid, therefore its polyester poly(ethylene furanoate) (PEF) is very promising as the bio-based alternative of poly(ethylene terephthalate) (PET) [31].
Since PEF is expected to be the bio-based polyester that will gradually replace its fossil-based counterpart PET, studying its properties and possible uses is a fast-developing research interest area. The furan ring provides PEF higher polarity, making it more compatible with TiO2 nanoparticles and therefore more suitable as a support polymer for TiO2 photocatalysts.
The usual methods of supporting TiO2 on polymers are sol-gel and sputtering, however sol-gel techniques result in photocatalysts with amorphous TiO2, instead of the preferred anatase form, and require post-deposition thermal treatment in temperatures above 300 °C in order to recrystallize it [32]. Another possible approach for the support of TiO2 on polymers is solution mixing, which is an inexpensive technique that occurs in inert conditions and does not affect the crystal structure of anatase. Additionally, in comparison with sputtering or hot-pressing methods, it allows the polymeric substrate to form stronger interactions with the TiO2 nanoparticles.
In the context of development environmentally friendly materials and based on the fact that the furan ring polarity makes the PEF a suitable substrate for the immobilization of TiO2, the aim of this study was the synthesis of PEF/nTiO2 nanocomposites, as a first stage of membrane PEF/TiO2 synthesis investigation, containing various concentrations (wt%) of TiO2. Additionally, the main objective of this study was to assess the application of the promising PEF/TiO2 membrane configuration in the photocatalytic treatment of commonly detected contaminants like Non-Steroidal Anti-Inflammatory Drugs (NSAIDs). Among all the human medicines, NSAIDs are one of the most frequently recommended pain killer medicines. Large amounts of these painkillers are prescribed in human medical care, but more often, they are sold without prescription as so-called ‘over-the-counter’ drugs. Residues of NSAIDs are usually present in surface water and ground water or even in drinking water [33,34,35]. Despite this, they have been detected in wastewater treatment plants, sewage sludge, and agricultural soils due to application of manure contaminated with pharmaceuticals, irrigation with non-reclaimed or treated wastewater [36]. Therefore, removal of NSAIDs from water systems is necessary considering its potentially harmful impacts on the environment. In the present study, a mixture of such extensively found contaminants in the aquatic system such as Ibuprofen (IBU), Diclofenac (DCF) and Acetaminophen (ACM) was selected. These NSAIDs are among the most frequently utilized drugs and the NORMAN experts have included them in the list of the ‘emerging contaminants’.
Further emphasis was given to optimize the photocatalytic procedure using different parameters (drug concentration, catalyst concentration and pH). To the best of our knowledge, this is the first study regarding the synthesis of PEF/TiO2 nanocomposites, evaluation of its properties, and its application for the photocatalytic treatment of pharmaceuticals.

2. Results and Discussion

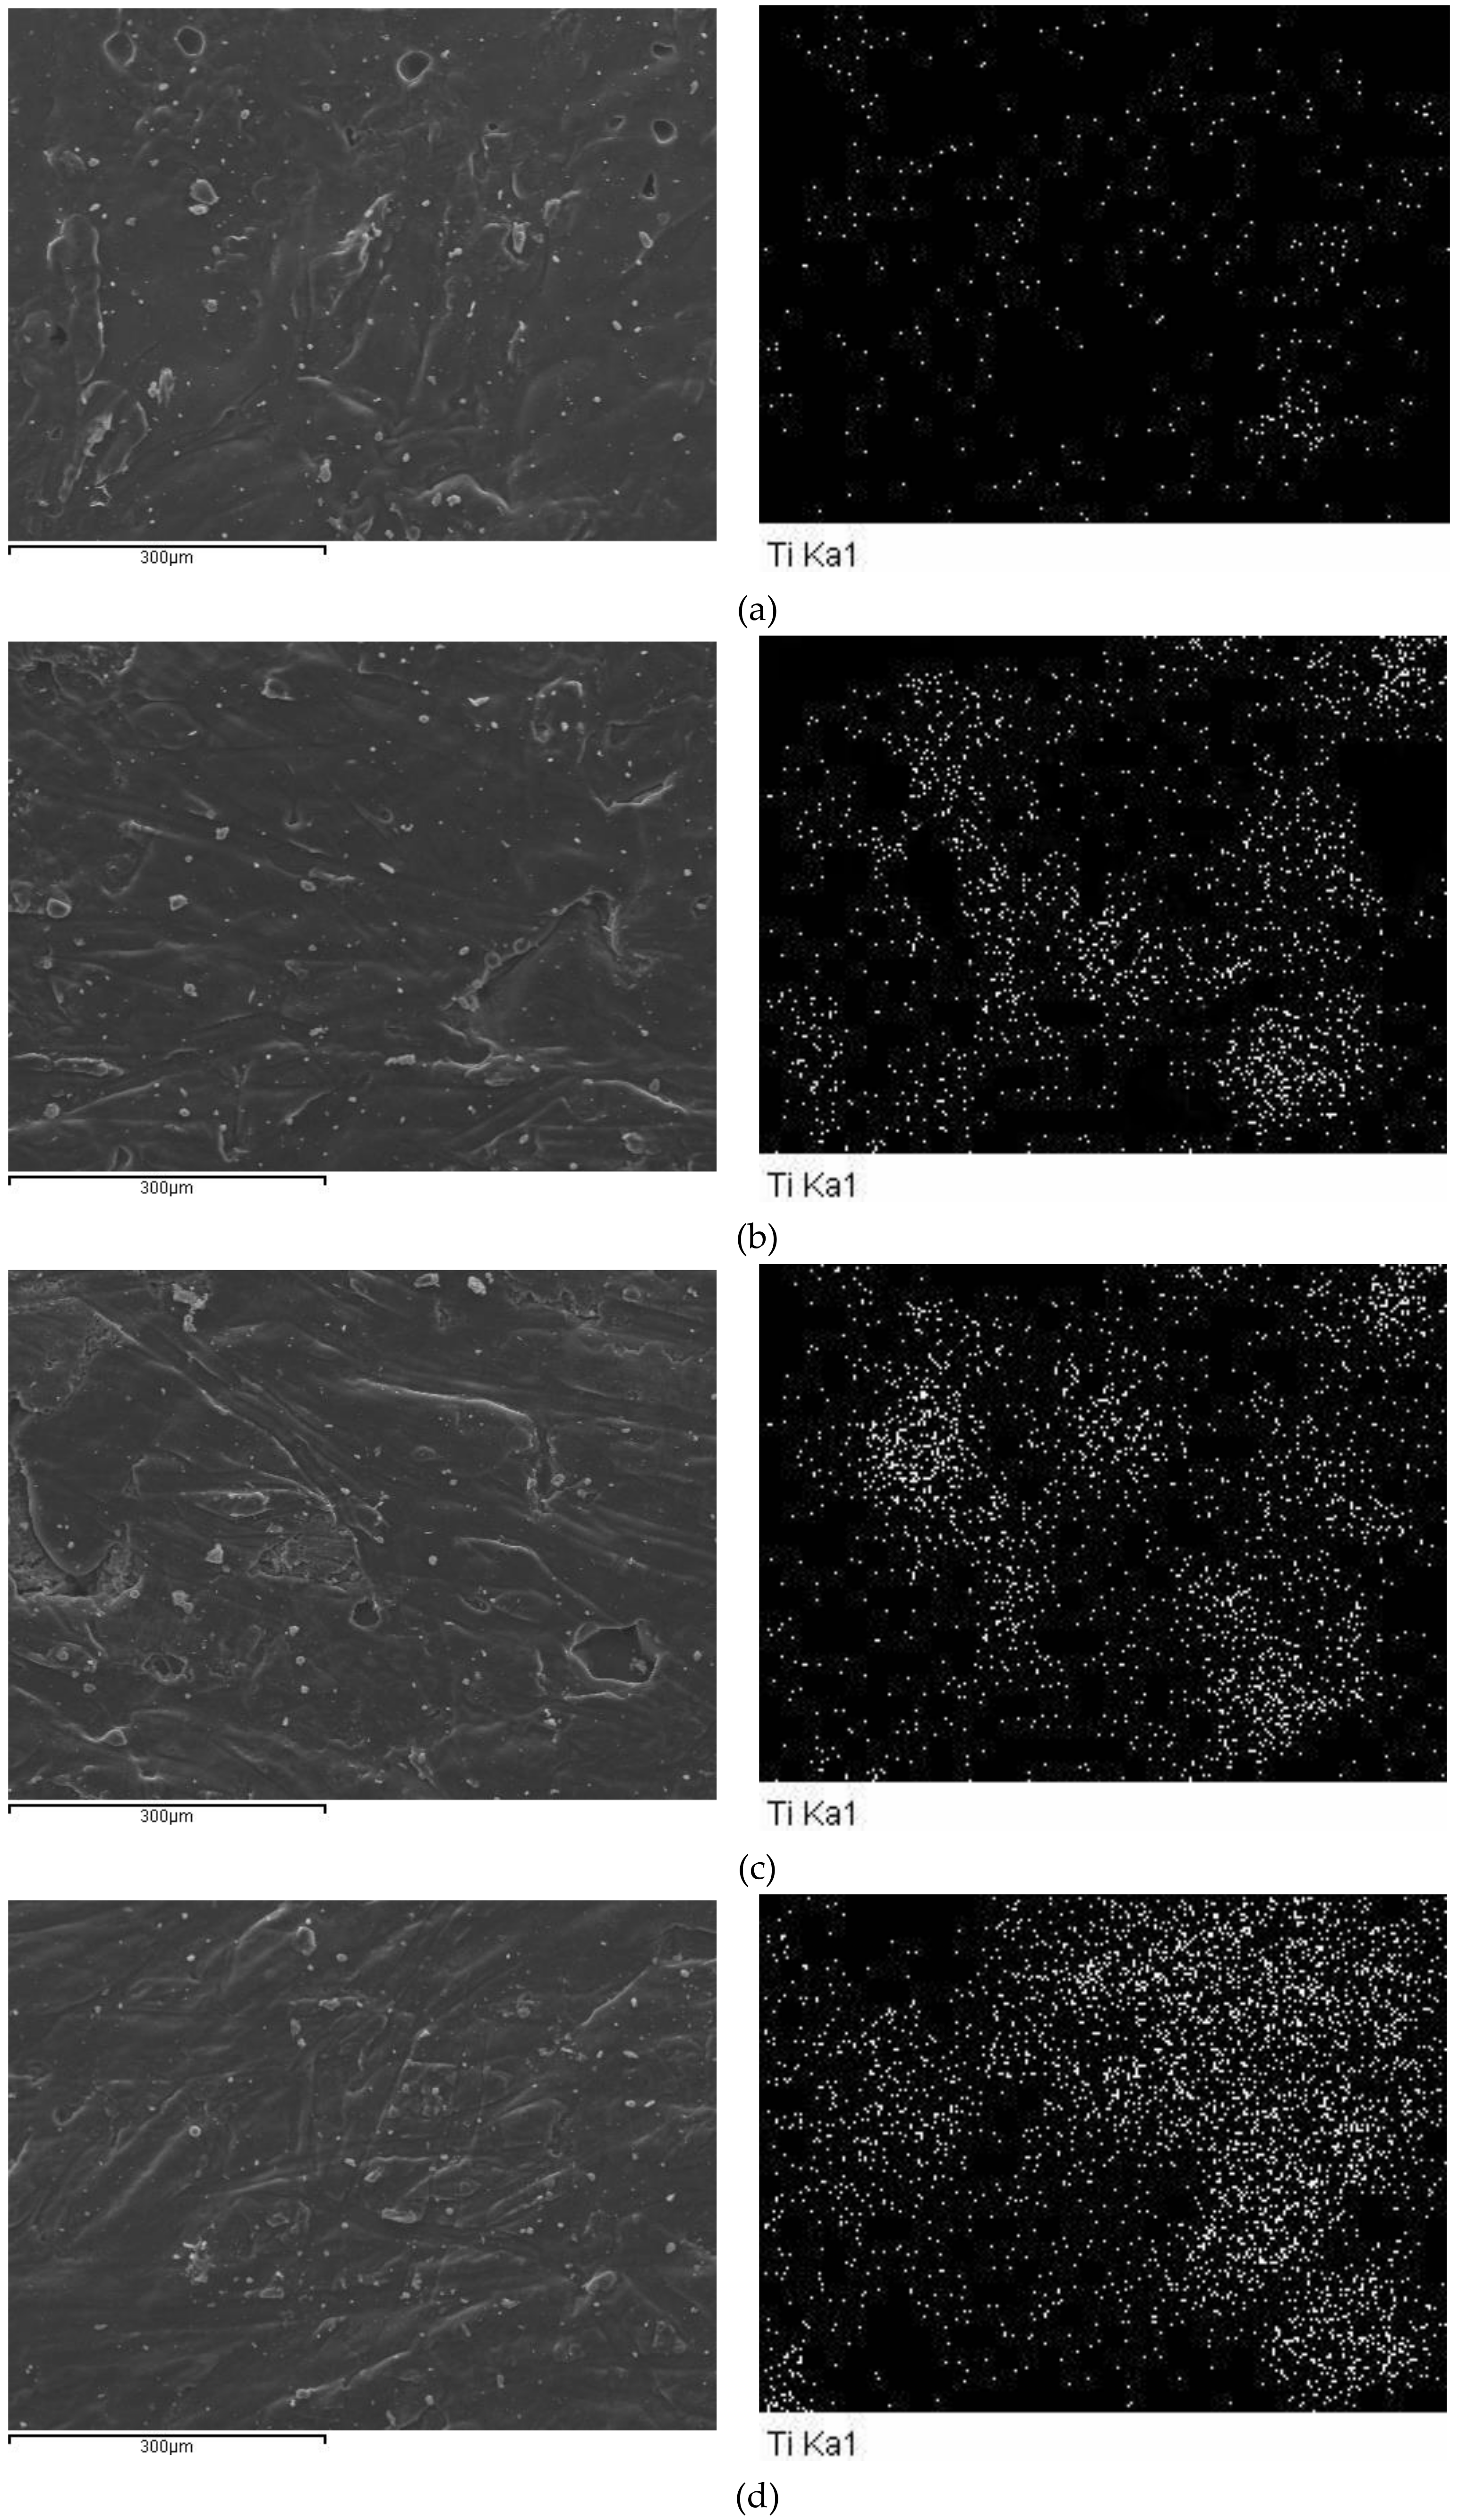
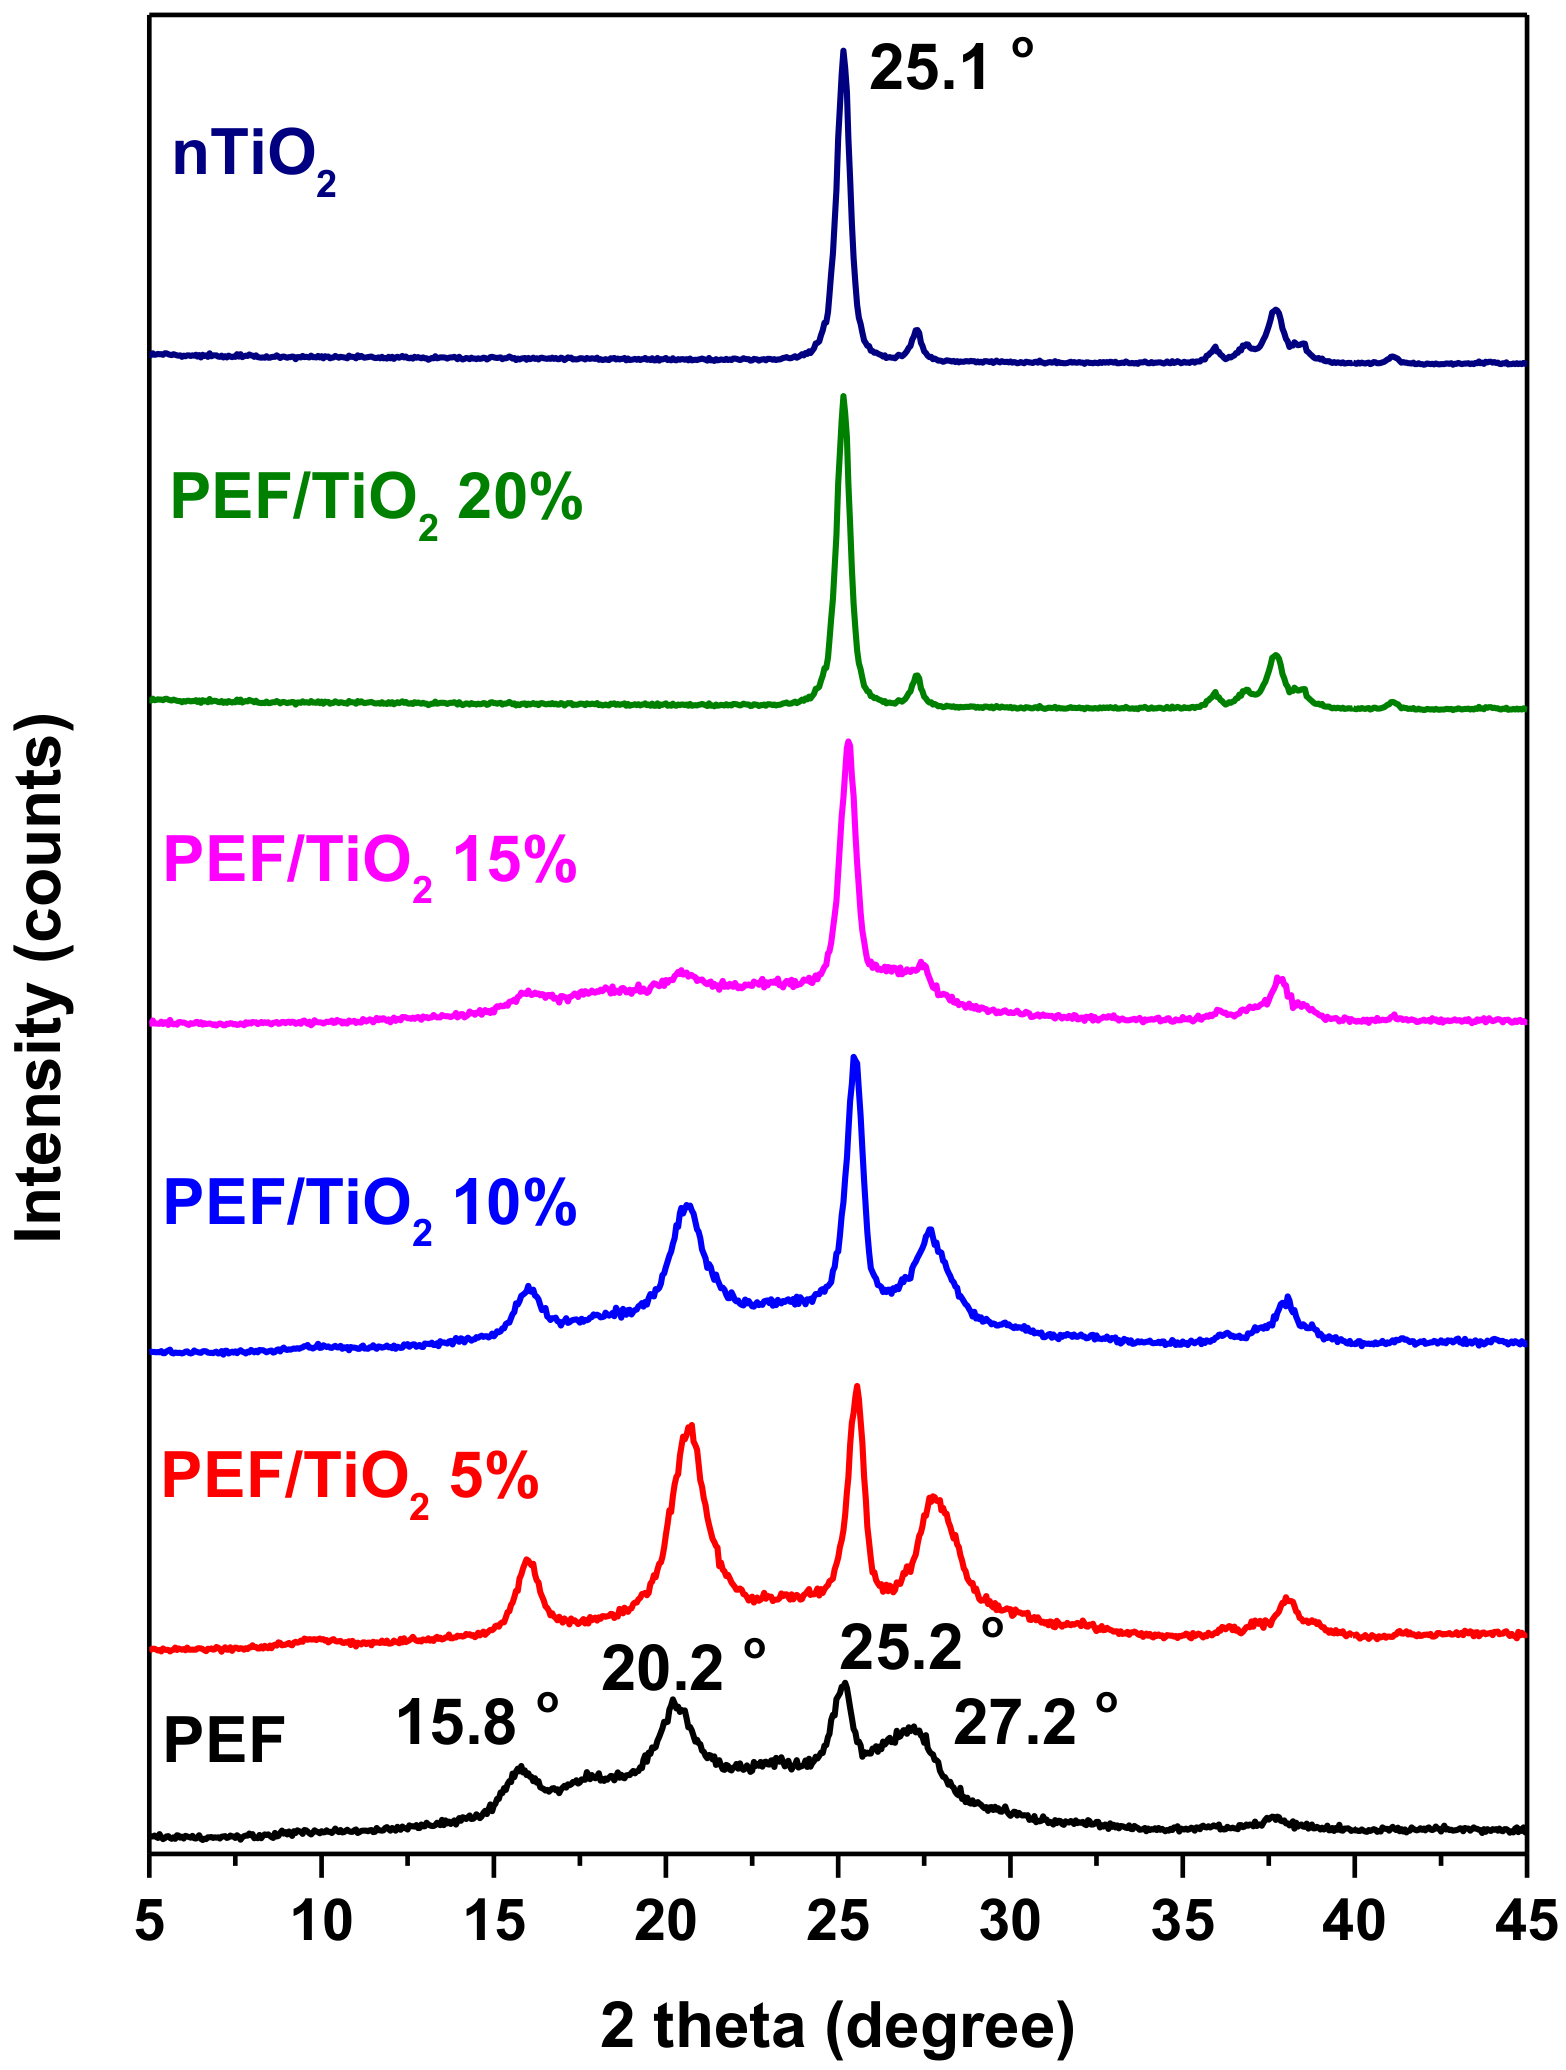
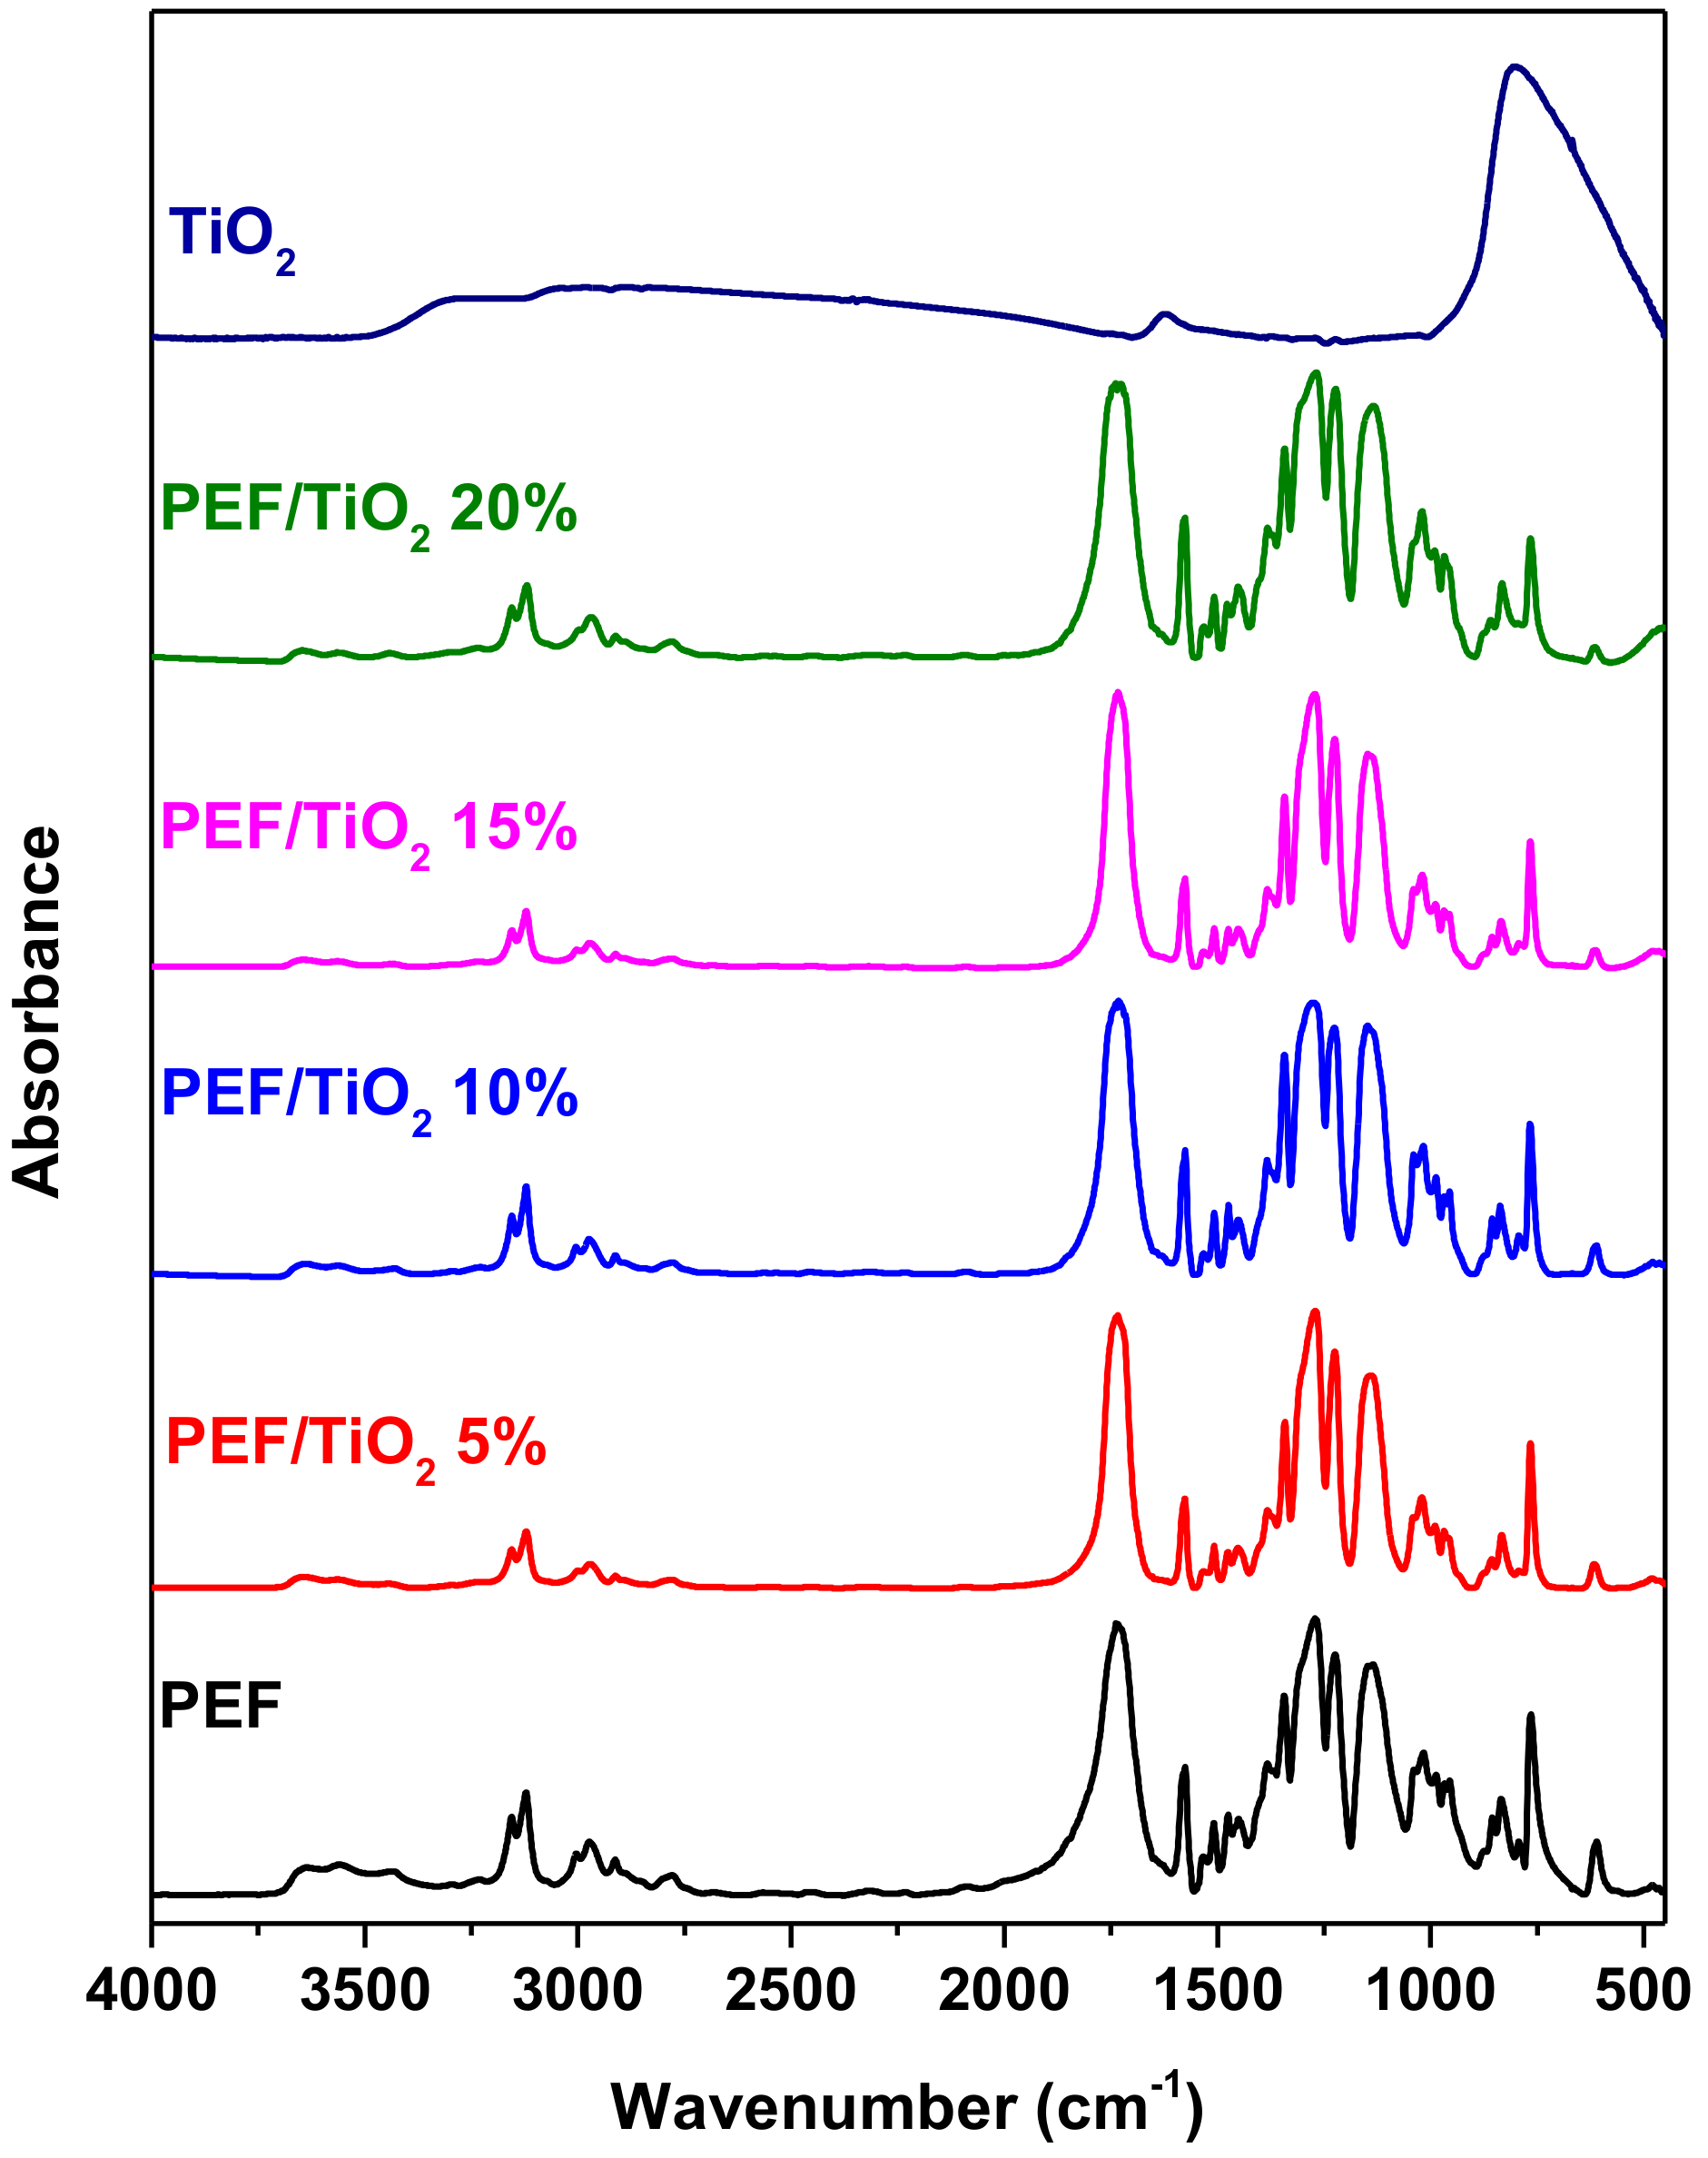
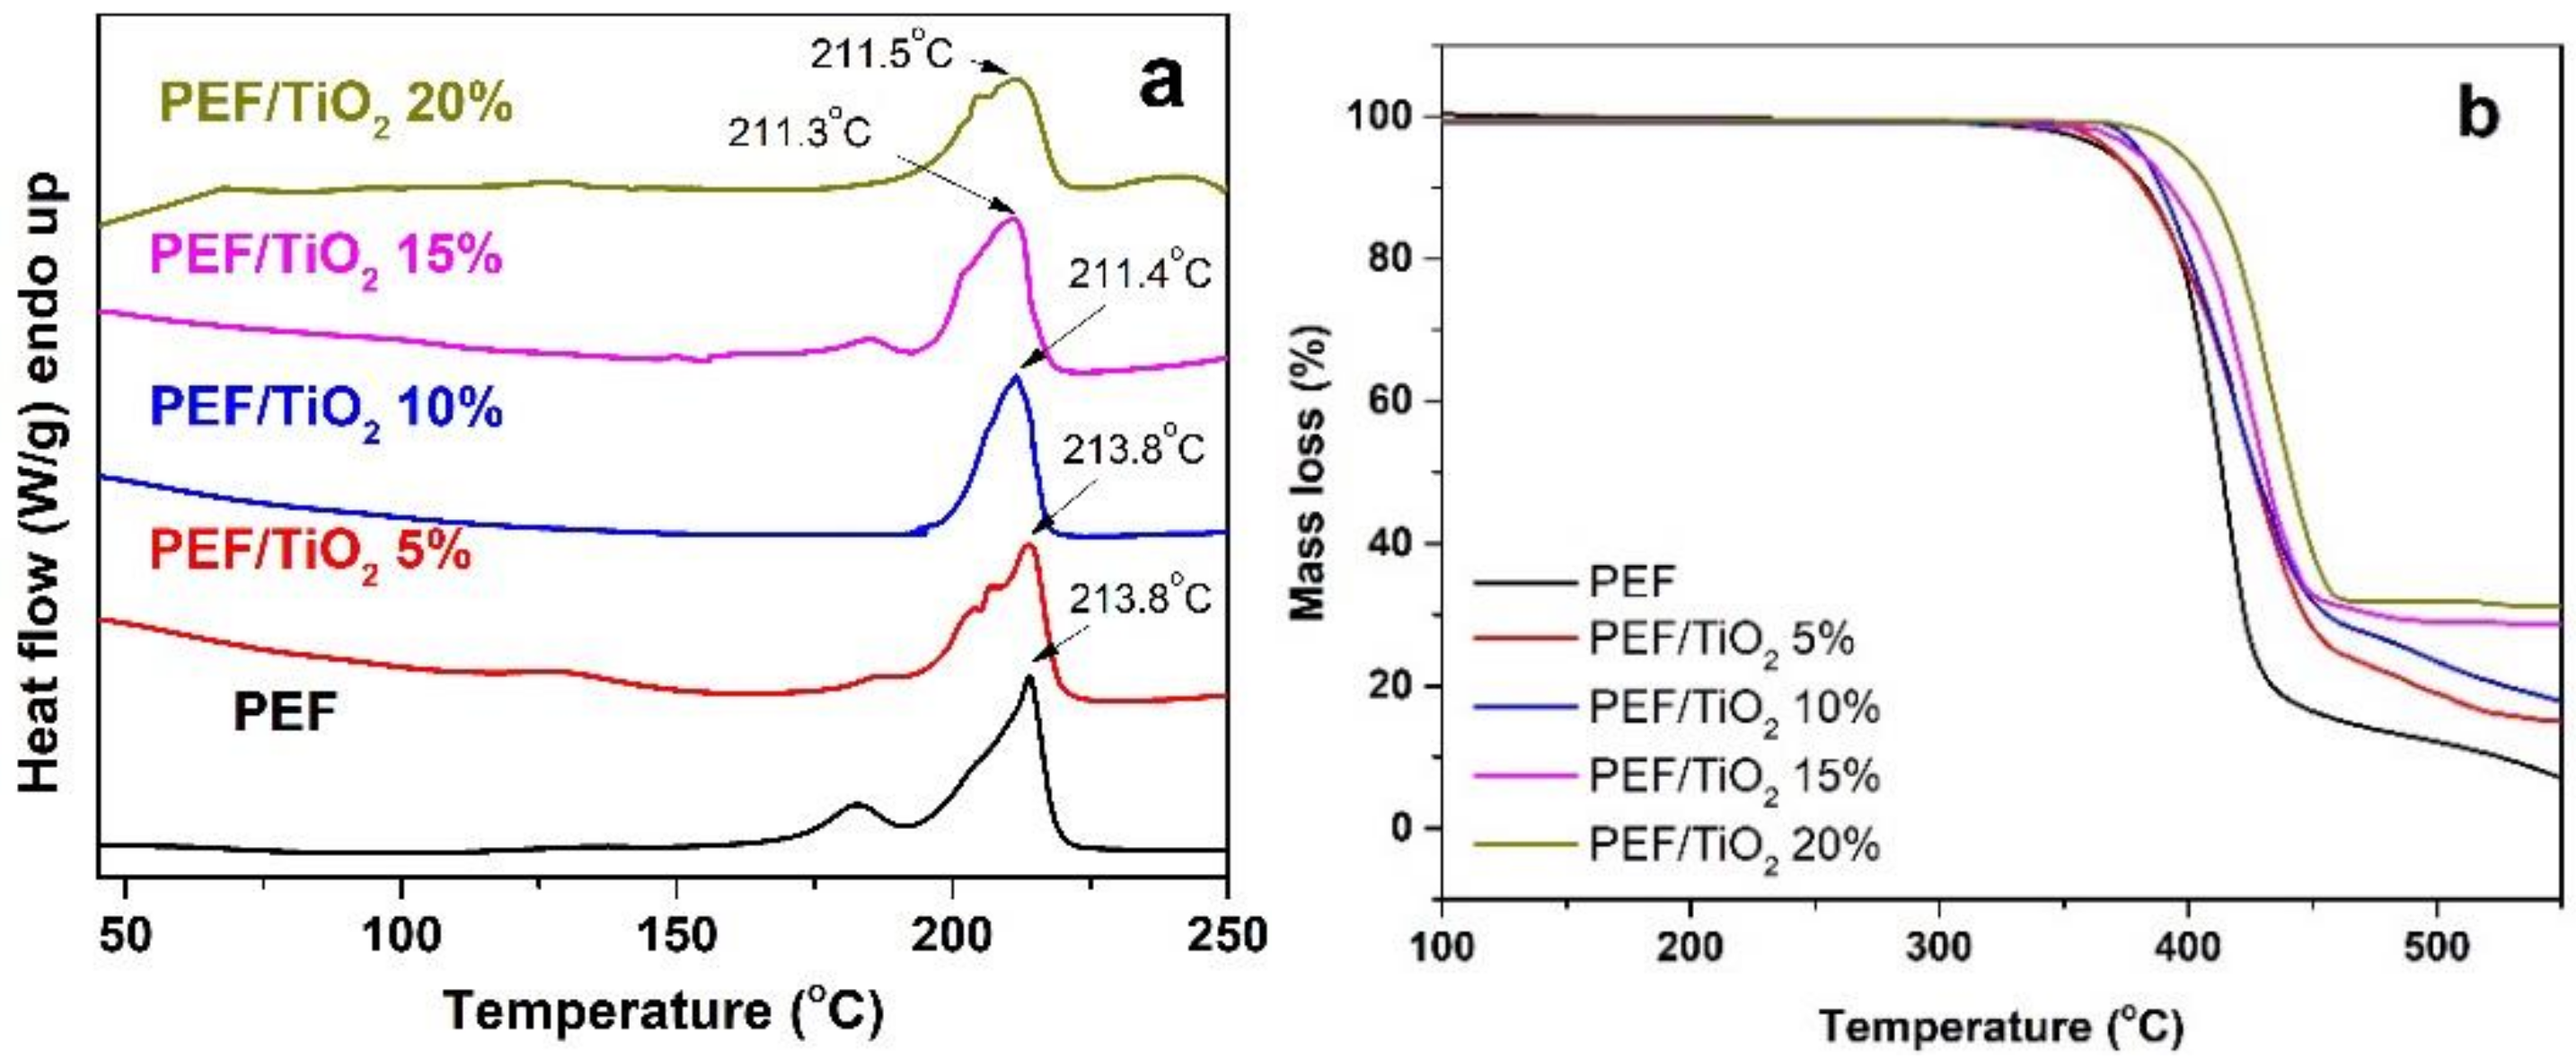
2.1. Synthesis and Characterization of PEF/TiO2 Photocatalysts

PEF was synthesized from DMFD by the two-step melt polycondensation method with the use of TBT catalyst (Scheme 1). The final product had a IV value of 0.45 dL g−1, which is within the values reported for the same catalyst in previous studies [37,38] and what was found by GPC PEF has Mn = 11200 g mol−1. Since the polyester exhibited a yellow discoloration, a purification process took place in order to remove impurities and unreacted monomers. For this reason, PEF was dissolved in a mixture of trifluoroacetic acid/chloroform 1/4 v/v and precipitated in cold methanol. The product obtained after the purification was a white powder, which means that some decomposition products formed during synthesis of PEF have been removed during this treatment [39].
TiO2 was supported on the synthesized PEF by preparing PEF/TiO2 nanocomposites with the solution mixing method firstly and after melt pressing thin films (1 mm) in final TiO2 concentrations 5, 10, 15, and 20 wt% have been prepared. The morphology and dispersion of the nanocomposites powder was studied by SEM and EDX element mapping. SEM micrographs and their corresponding Ti maps are presented in Figure 1. The respective mapping images reveal satisfactory dispersion of the nanoparticles into the polymer matrix, and the density of the maps increases while increasing TiO2 concentration. This suggests that PEF is capable of supporting TiO2 quantities up to 20 wt%.
WAXD was employed in order to clarify the crystalline structure of PEF and TiO2 in the nanocomposites. The resulting diffraction patterns are shown in Figure 2. Neat PEF has some weak diffraction peaks at 15.8, 20.2, 25.2, and 27.2°, which reveal that it is crystallized in the β-crystal form [40]. Its crystal structure is sustained in the nanocomposites with 5 and 10% wt % TiO2, but is significantly reduced in concentrations of 15 and mainly 20 wt%, as evidenced by the very weak diffraction peaks. TiO2 powder exhibits an intense diffraction peak at 25.1°, which corresponds to the form of anatase. This peak is also present in the nanocomposites, indicating that the anatase structure remains the main form of TiO2 in the catalysts, which is the desired one since it is able to degrade compounds via photocatalysis [41]. Especially in the nanocomposites with 15 and 20 wt% TiO2, the nanofiller is well crystallized, with strong diffraction peaks, suggesting that it will retain its photocatalytic activity [32].
FTIR spectra of the polyesters were recorded to confirm their structure and possible interactions between polymer matrix and TiO2 (Figure 3). The spectrum of PEF exhibits absorption bands at 3645 cm−1 due to the RCH2OH hydroxyl group vibration, at 3563 cm−1 due to the O-H bending of the carboxylic hydroxyls, at 3435 cm−1 due to the O-H bending of the hydroxyl end groups of the polyester, at 3123 cm−1 and 3004 cm−1, due to the C-H bending of the furan ring, at 2976 cm−1 of the C-H bending vibrations, at 1737 cm−1 of the carbonyl group’s bending, at 1575 cm−1 due to the bending vibrations of the =C-H of the furan ring, at 1271 cm−1 and 1225 cm−1 due to the Csp2-O and Csp3-O bonds of the furan ring, and at 1136 cm−1 due to the C-O bending vibration of the ester group. The spectra of the nanocomposites do not exhibit noticeable differences compared with neat PEF, therefore the presence of TiO2 did not affect the chemical structure of the polymer. A small peak in the region 450–500 cm−1 that increases in area with increasing the nanofiller content is also observed and can be attributed to the Ti-O stretching vibration. Additionally, since the main peaks of PEF are recorded at the same positions in nanocomposites, it can be said that there are no covalent interactions or hydrogen bonding between PEF matrix and TiO2 nanoparticles.
Thermal characterization of PEF and its nanocomposites was performed with DSC and TGA (Figure 4). The characteristic temperatures Tm and Tg, as well as the crystallinity are presented in Table 1. The melting point of PEF appears at 213.8 °C, as a broad endothermic peak. After the incorporation of nTiO2, melting point values are not significantly affected in low filler content 5 wt%, but start to decrease slightly in the presence of 10–20 wt% nTiO2. This shift could be attributed to the lower degree of crystallinity that these nanocomposites have or due to the formations of imperfect crystals. As can be seen from enthalpy of fusion the degree of crystallinity reduces gradually by increasing TiO2 content. This is clear evidence that the nanoparticles, due to the higher amount added, restrict the ability of macromolecular chains to fold and form crystal structures. For this reason, the degree of crystallinity (Xc) was reduced significantly in nanocomposites with 15 and 20 wt% TiO2, which is in good agreement with WAXD findings. In contrast, Tg is increased in the nanocomposites, indicating their hindering effect towards the movement of the macromolecular chains.
The effect of TiO2 on the thermal stability of PEF was studied by TGA. The characteristic degradation temperatures and solid residue are also presented in Table 1. It can be seen that PEF is a thermally stable polyester, since it starts to degrade after 390 °C. Thermal stability is increased for all the nanocomposites, with increasing filler content, as evidenced by the Tmax. The amounts of solid residue at 550 °C are increasing, while increasing TiO2 content, as was expected, due to the high added TiO2 amounts. Furthermore, from these residues it is clear that the whole amount of added TiO2 was incorporated inside the polymer matrix.

2.2. Photocatalytic Degradation Process

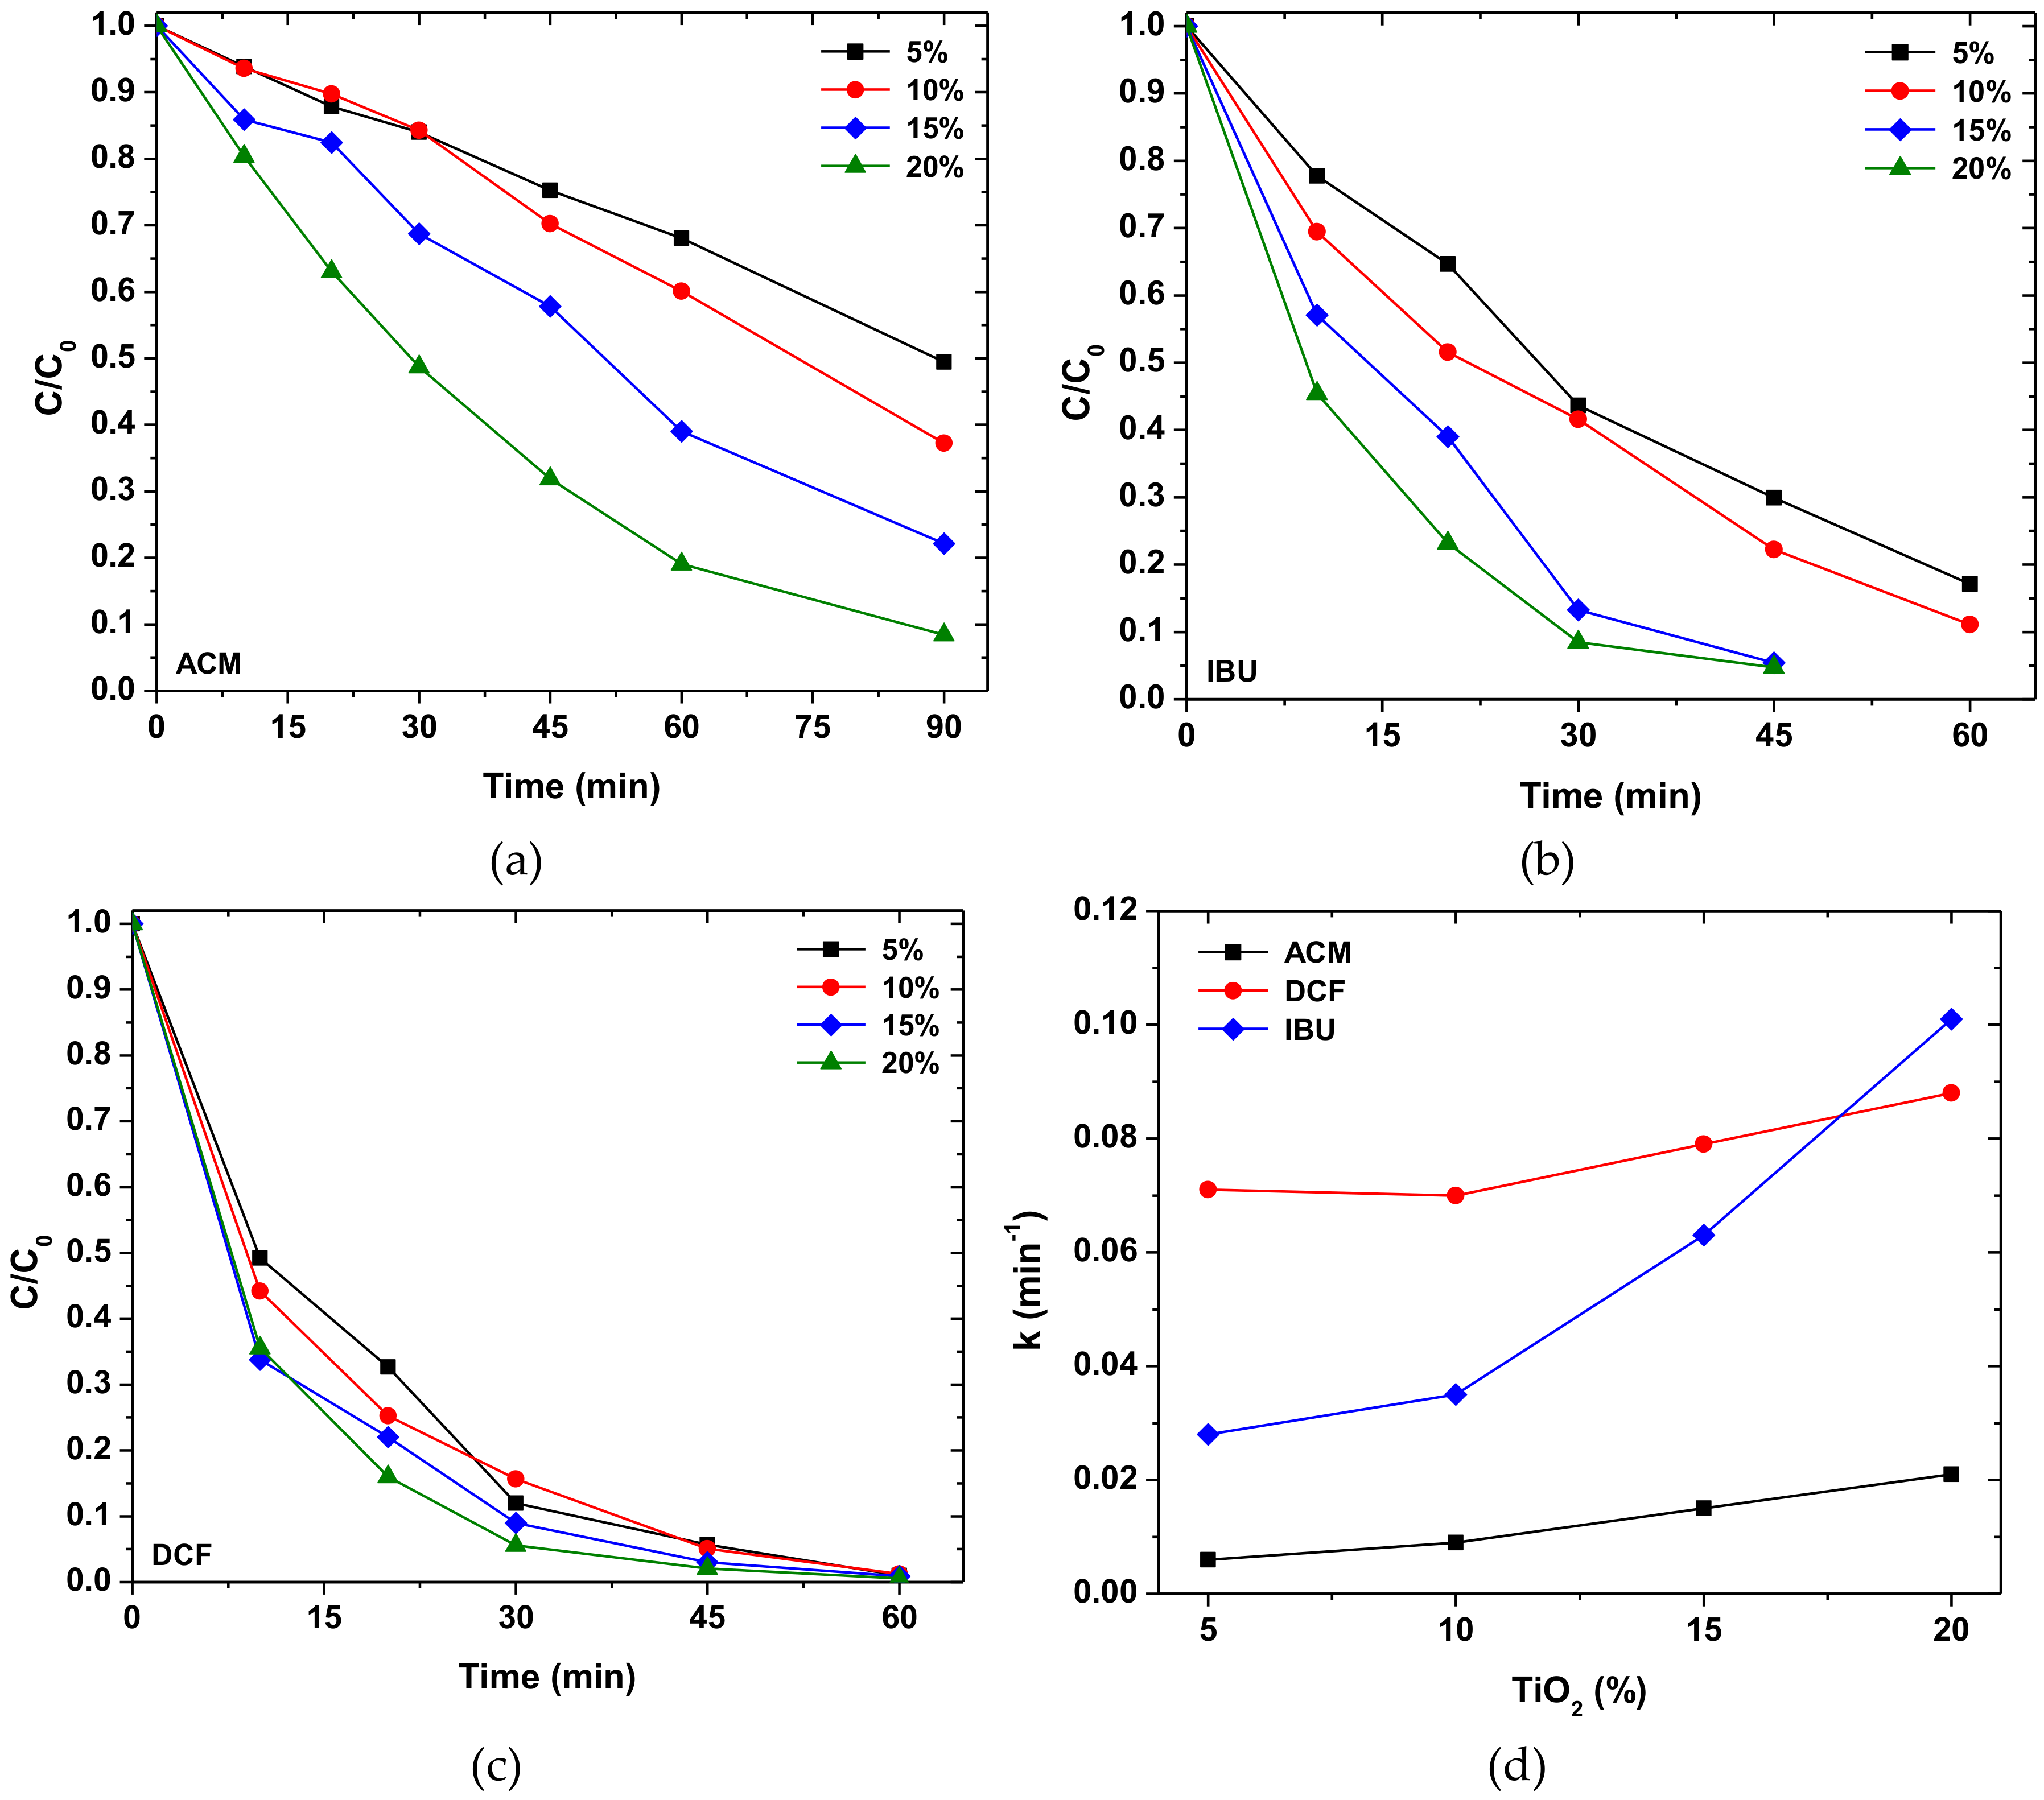
2.2.1. Effect of TiO2 Amount on Drug Removal

Due to the increased concern for the usage of immobilized TiO2 catalysts, all the synthetized catalysts (600 mg L−1 of each) with the concentration of TiO2 ranging from 5 to 20 wt%, were evaluated for the degradation of anti-inflammatory drugs mixture (5 mg L−1 of each compound), at inherent pH.
The selected drugs are found very often in wastewaters as well as in surface waters. For example, IBU is a non-steroidal, antipyretic drug that is recognized with a huge global consumption rate [42] and has been detected in effluents of municipal WWTPs and in surface waters at concentrations levels between ng L−1 and µg L−1 [43]. ACM is a mild analgesic that is commonly used in combinatory drugs for the relief of fever, headaches, and some minor pains, which has been commonly detected in surface waters, ground waters, wastewaters, and even drinking waters, along with its toxic metabolites [44,45]. DCF is frequently detected in secondary effluent, surface water, and drinking water at concentrations range of from 1.2 to 4.7 μg L−1, respectively [46]. DCF is also one of the monitored pollutants by European Commission (EC), since itself and its transformation by-products pose a serious threat to public health and ecosystems according to the persistence and ecotoxicity in the water [47].
Mixture’s degradation by all studied catalysts, under SSL, follows first-order kinetics according to the high values of correlation coefficient, R2 = 0.99 (lnCo/C vs. time), for all the compounds. The kinetic profiles are depicted in Figure 5a–c, while the kinetic rate constants are in Figure 5d.
All four catalysts exhibit photocatalytic activity, while, as expected, the immobilized catalyst with the 20 wt% of TiO2 is the most efficient for the removal of the drug mixture, since the kinetics obtained are faster for all studied compounds. The elimination of all compounds by PEF/TiO2 20 wt% catalyst was almost complete during the first 90 min of the procedure. Therefore, further experiments were only conducted for PEF/TiO2 20 wt% catalyst. Preliminary adsorption experiments were also carried out using 5 mg L−1 of each compound as the initial concentration. Under dark conditions, negligible adsorption of the target compounds on the catalyst’s surface (600 mg L−1 of PEF/TiO2 20 wt%) was observed.

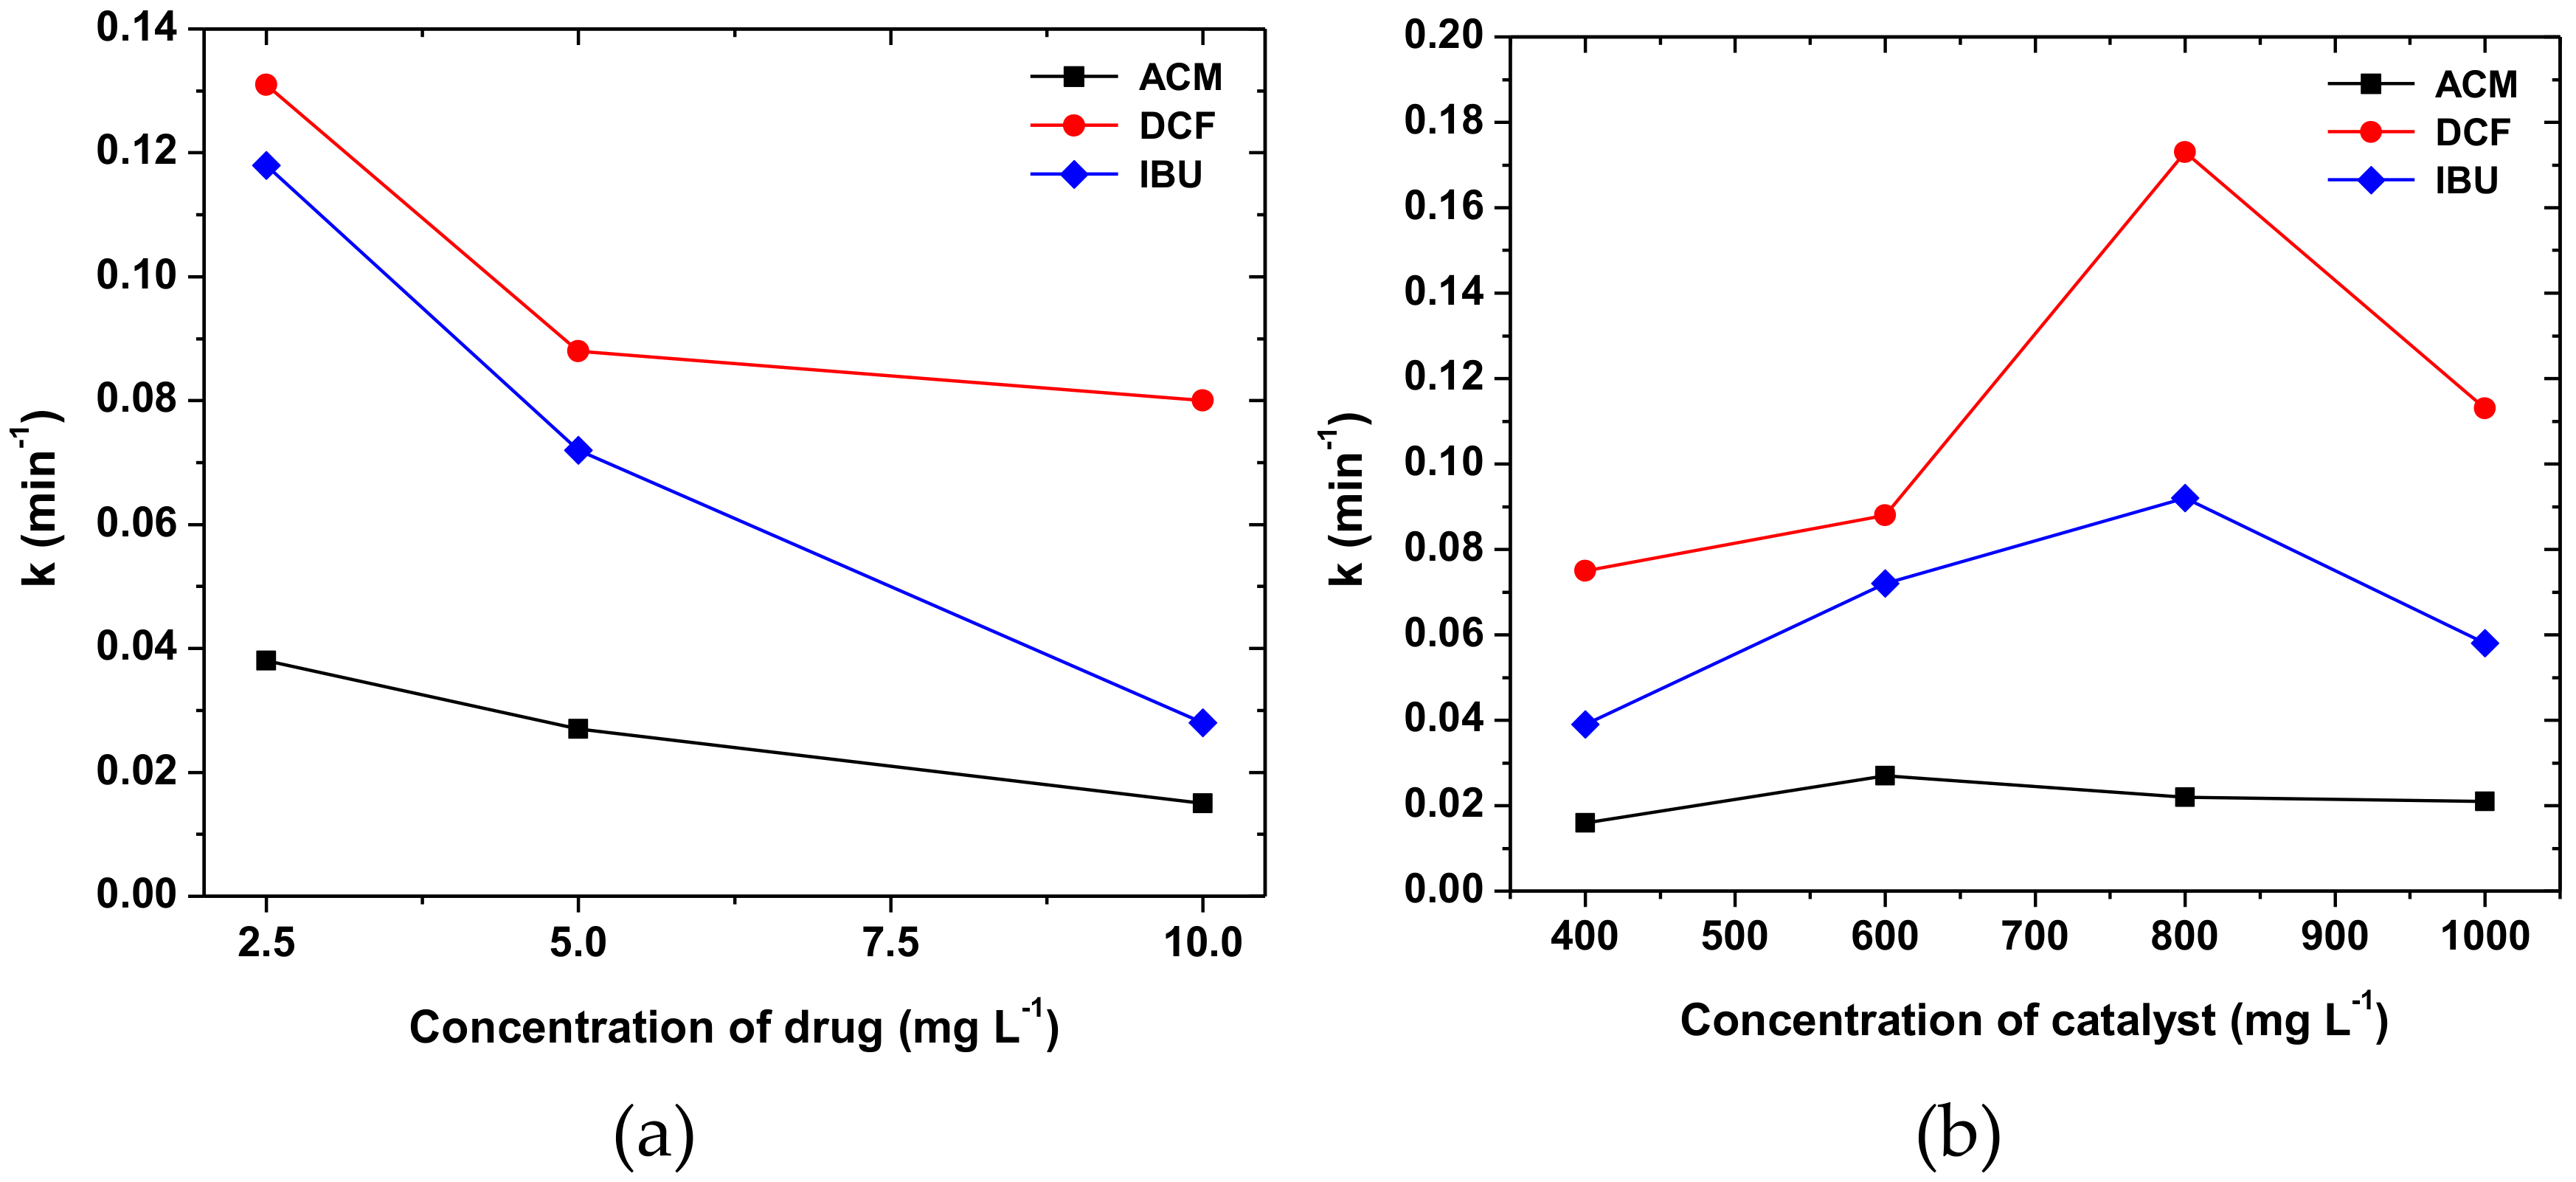
2.2.2. Effect of Drug Concentration

Additionally, experiments were conducted in order to investigate the effect of the initial concentration of the mixture (2.5–10 mg L−1 of each compound), keeping the rest of the parameters constant. According to the results (Figure 6a), an increase in the concentration of the mixture leads to a decrease in the photocatalytic rate constants that could be attributed to the lower ratio of active oxidative species to the substrate molecules, which has also been reported elsewhere [48,49,50]. The concentration of 5 mg L−1 for each drug was selected for further experiments and the effect of several parameters to pollutants removal was evaluated, since this concentration enables the proper monitoring of the degradation kinetics. The degradation curves obtained for each drug are given in detail in the Supplementary Materials (Figure S1).

2.2.3. Effect of Catalyst Loading
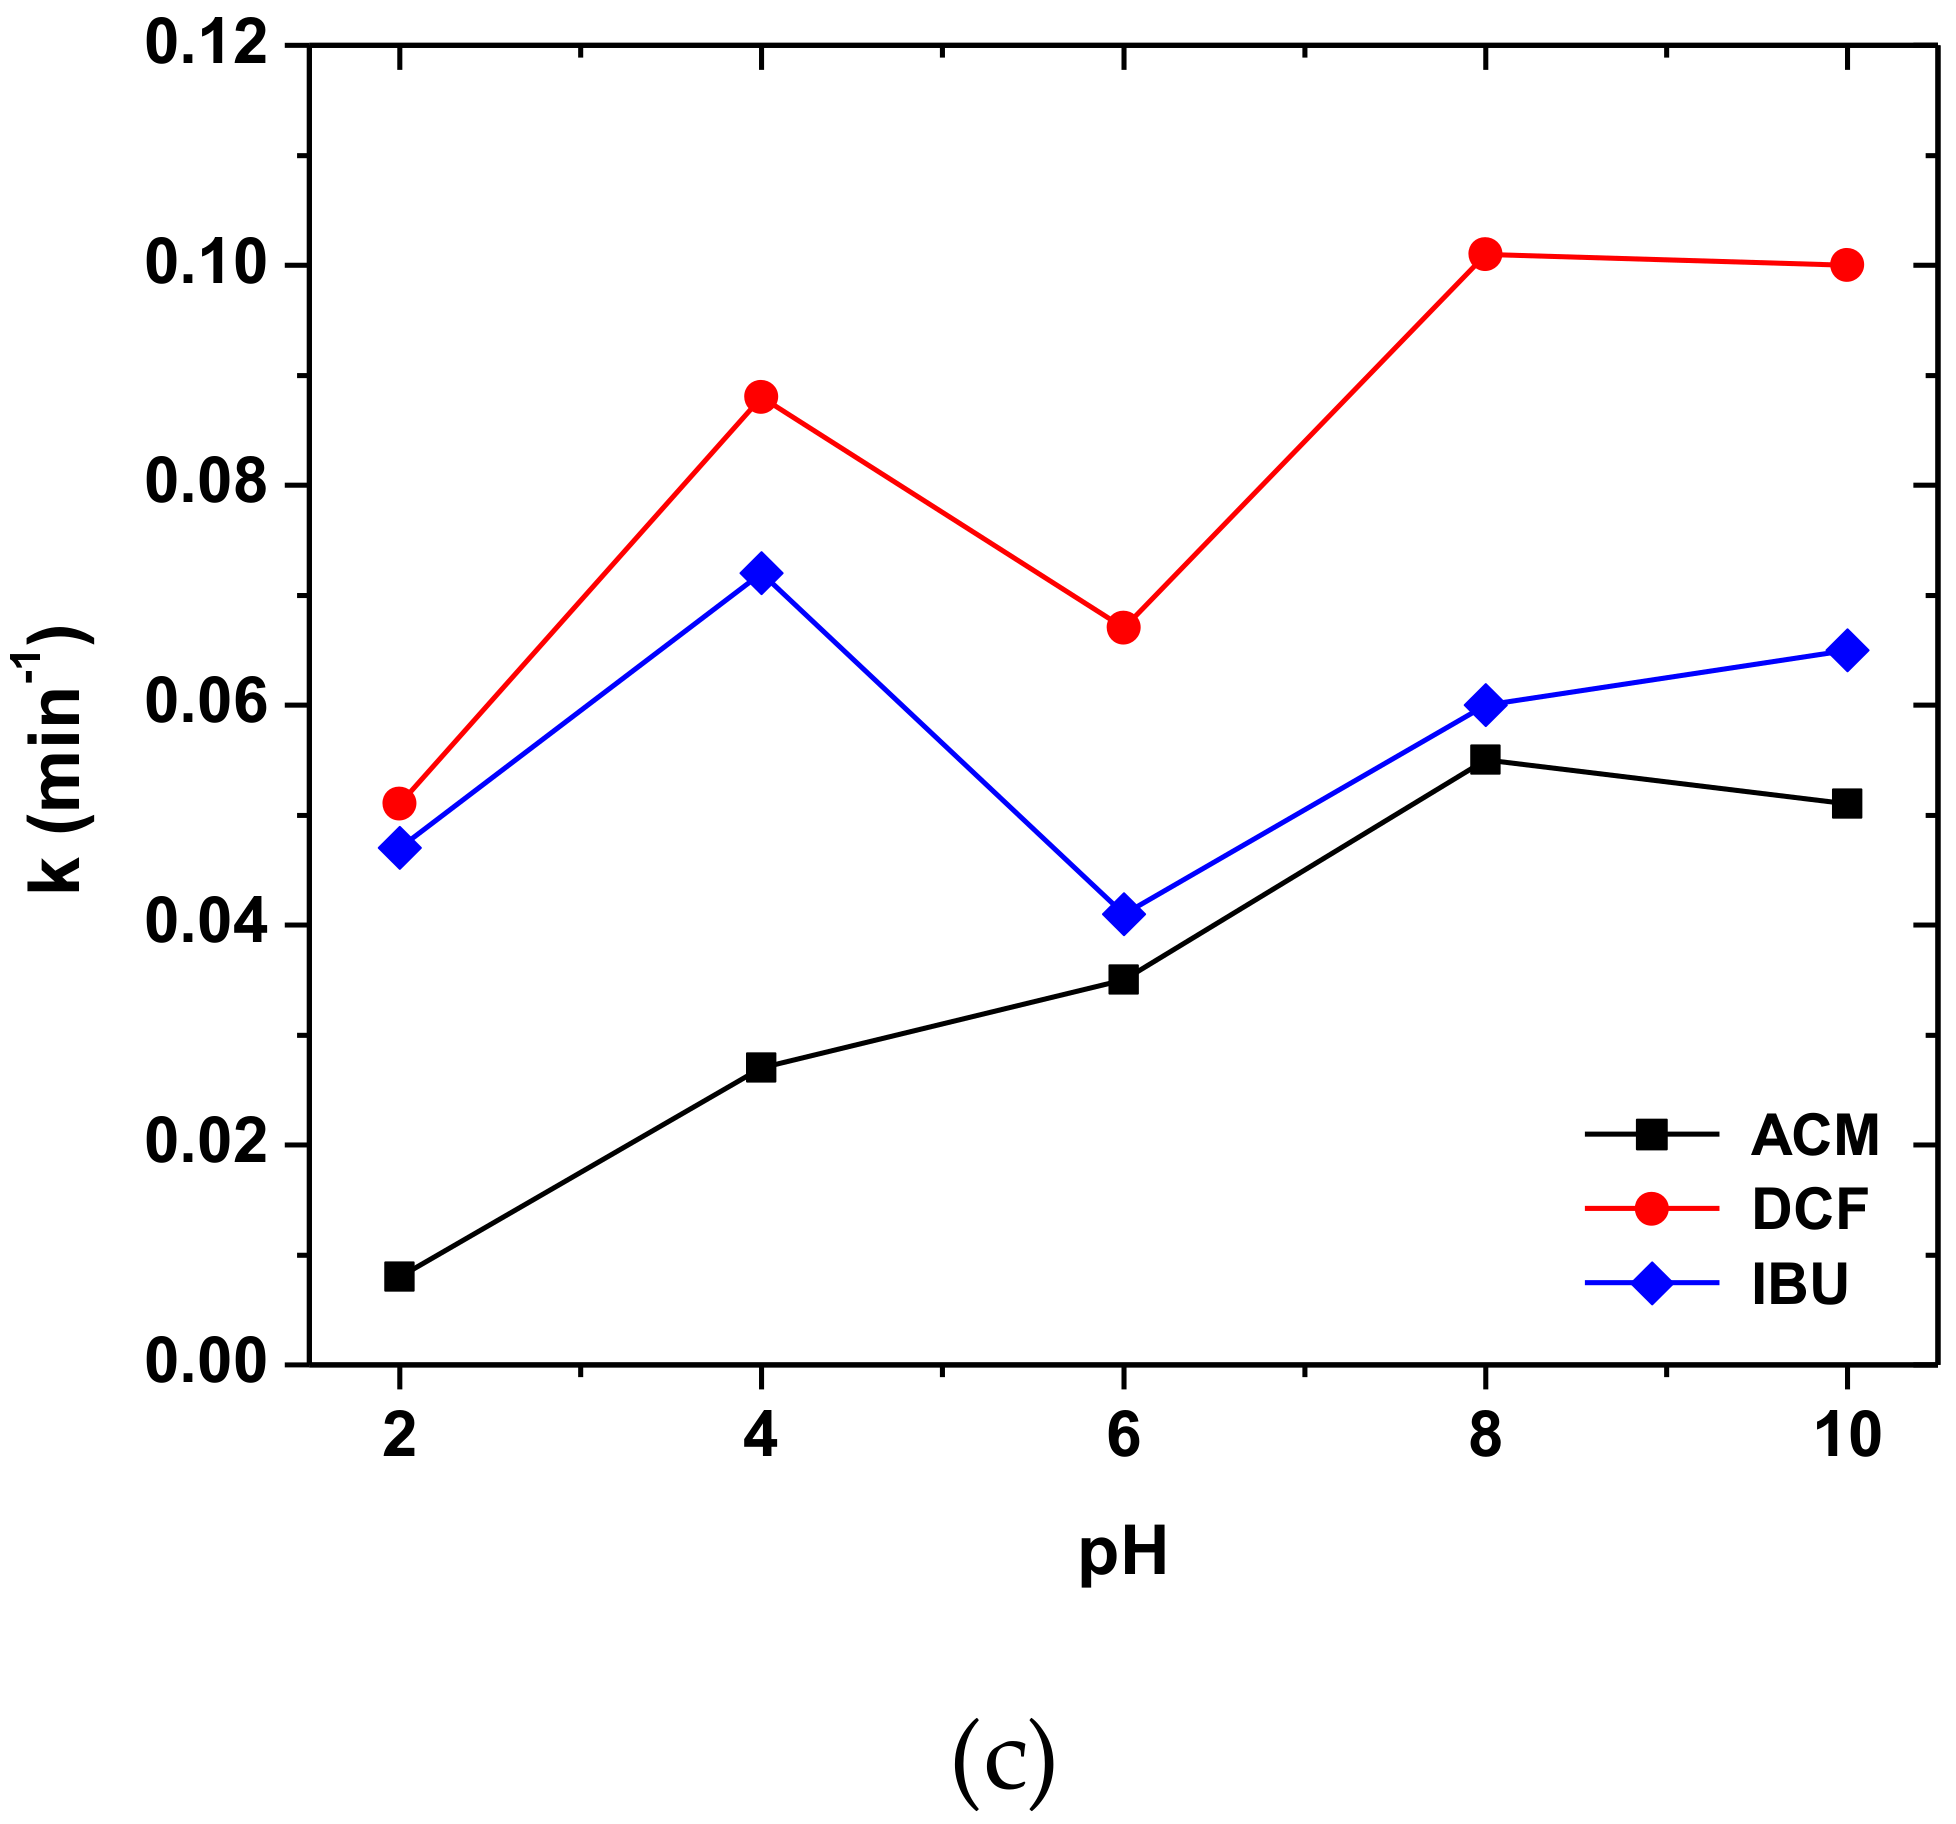
Different concentrations of PEF/TiO2 20% catalyst, ranging from 400 to 1000 mg L−1, were employed, in order to study the effect of catalyst’s concentration on the degradation of the mixture (Figure 6b). The detailed degradation curves are given in the Supplementary Materials (Figure S2). Generally, when increasing the concentration of the catalyst, the surface of the particles also increases, making available a higher number of active sites for adsorption and generation of the oxidant species, until an optimum catalyst mass corresponding to the maximum absorption of photons reaching the catalytic bed. Figure 6b represents the results of the above study. Obviously, until 800 mg L−1, as the concentration rises, there is an increase at the rate constant of each compound. Above the concentration until 800 mg L−1, the rate constant either reaches a plateau (for ACM) or decreases (for IBU and DCF).

2.2.4. Effect of pH

During the heterogeneous photocatalytic treatment, the pH of the semiconductor’s solution can be a determining factor for the efficiency of the whole procedure. The pH value affects the charge of the catalyst’s surface, as well as the reactant’s charge and cause either electrostatic repulsion or attraction between them [51,52]. In our case, TiO2 is amphoteric and consequently and its point of zero charge (pzc) is widely reported at pH ∼6.7. Therefore the TiO2 surface is positively charged in acidic media (pH < 6.7), whereas it is negatively charged under alkaline conditions (pH > 6.7) [53]. Additionally, the PEF polymeric immobilization of TiO2 may be charged as either negative or positive, since its furanic ring or carboxyl groups are pH dependent. For example, the carboxylic acid groups are feasibly ionized to release the protons under basic condition and the carboxylate anion and the proton tend to combine under acidic condition [54].
As presented at Figure 6c, the effect of pH on the photocatalytic degradation of the anti-inflammatory drug mixture was studied for pH values ranging from two to 10. The effect of pH for each drug is also given at Supplementary Materials (Figure S3), expressed as degradation curves. For very acidic conditions (pH 2) the degradation kinetics are obviously slow for all the studied compounds. This is probably attributed to the combined effect of the protonation process and the H+ excess in the solution, which does not favor the generation of hydroxyl radicals [55]. For ACM the degradation kinetic increases by the increase of pH until pH 8. For very basic pH, there is a small decrease. The pKa of ACM is 9.71 [56], which means that it is presented in cationic form for pH < 9.71, therefore, when the catalyst is negatively charged (pH > 6.7), there is the maximum adsorption of ACM to the catalyst’s surface, which is pH 8 in our study. In the case of IBU, the higher reaction rate was observed for acidic pH (pH = 4), which is consistent with findings that acidic conditions favor IBU degradation [57]. IBU is a weakly acidic compound with pKa = 4.8 [58], so at pH values that exceeded its pKa, the molecule was present in its an-ionic form, which decreases the efficiency of the photocatalytic treatment.
Finally, for DCF, there were no significant differences as far as the degradation kinetic is concerned for pH, 4.8 and 10. The pKa of DCF is approximately 4.50 [59], so at pH 6, which is close to pzc of TiO2, it is probably negatively charged that does not favor the adsorption on the catalyst’s surface. The increase at pH 8 and 10, compared to pH 6, for IBU and DCF can be explained by the increase in generation of hydroxyl radicals, which is favoured at basic conditions [55]. For further experiments, the inherited pH (approximately pH = 4) was selected.

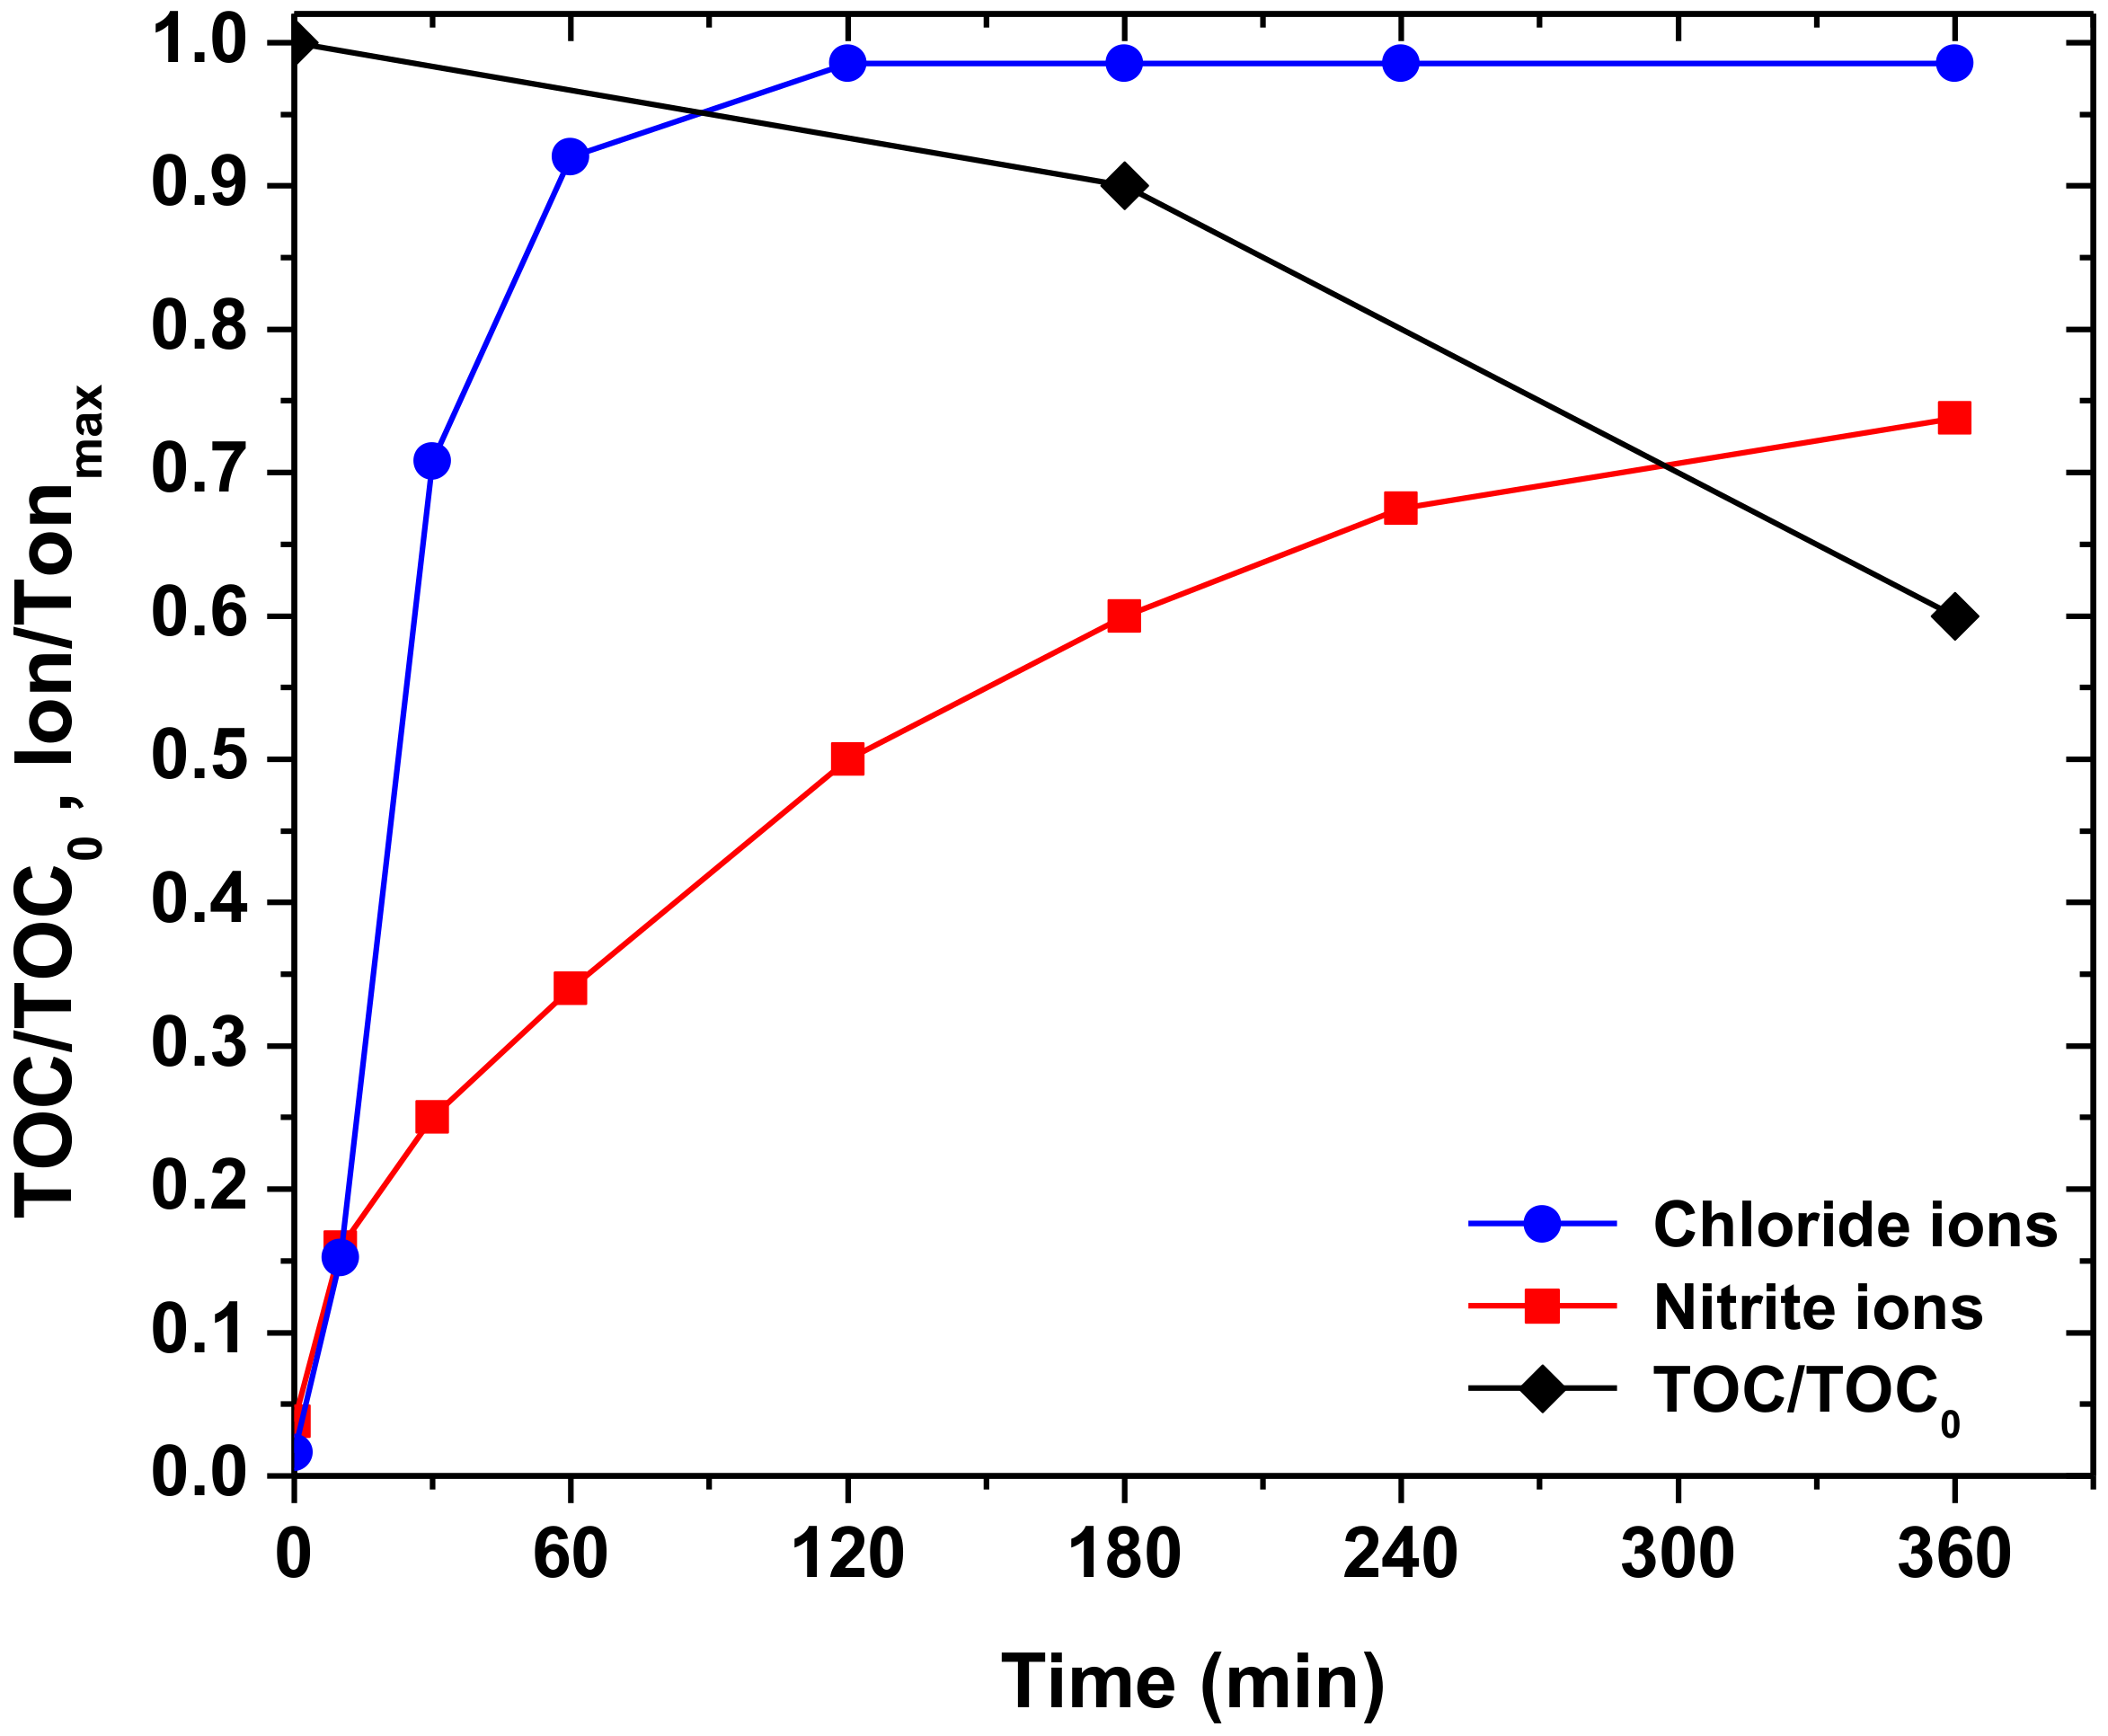
2.2.5. Mineralization Process

In order to assess the efficiency of PEF/TiO2 20% for the degradation of the anti-inflammatory drug mixture, mineralization studies were conducted. The concentration of each drug was 5 mg L−1, while the concentration of the catalyst was 600 mg L−1. The mineralization was studied for 360 min of irradiation (Figure 7). Although, all compounds degrade quite fast (during the first 90 min of treatment), TOC removal follows a slow rate reaching approximately 50% decrease after 360 min, demonstrating that the photocatalytic treatment needs prolonged irradiation times for leading to complete mineralization. This is probably due to the transformation products formed from the degradation of parent compounds. The chloride ions released from the degradation of DCF, reaches almost 100% from the first 120 min of treatment, probably indicating that the transformation products released are chloride-free or that the transformation products of DCF also degrade quickly. Nitrite ions were also released during the photocatalytic treatment, from the degradation of DCF and ACM. Their release reached approximately 70% at the 240 min of irradiation, while no nitrate ions are observed.

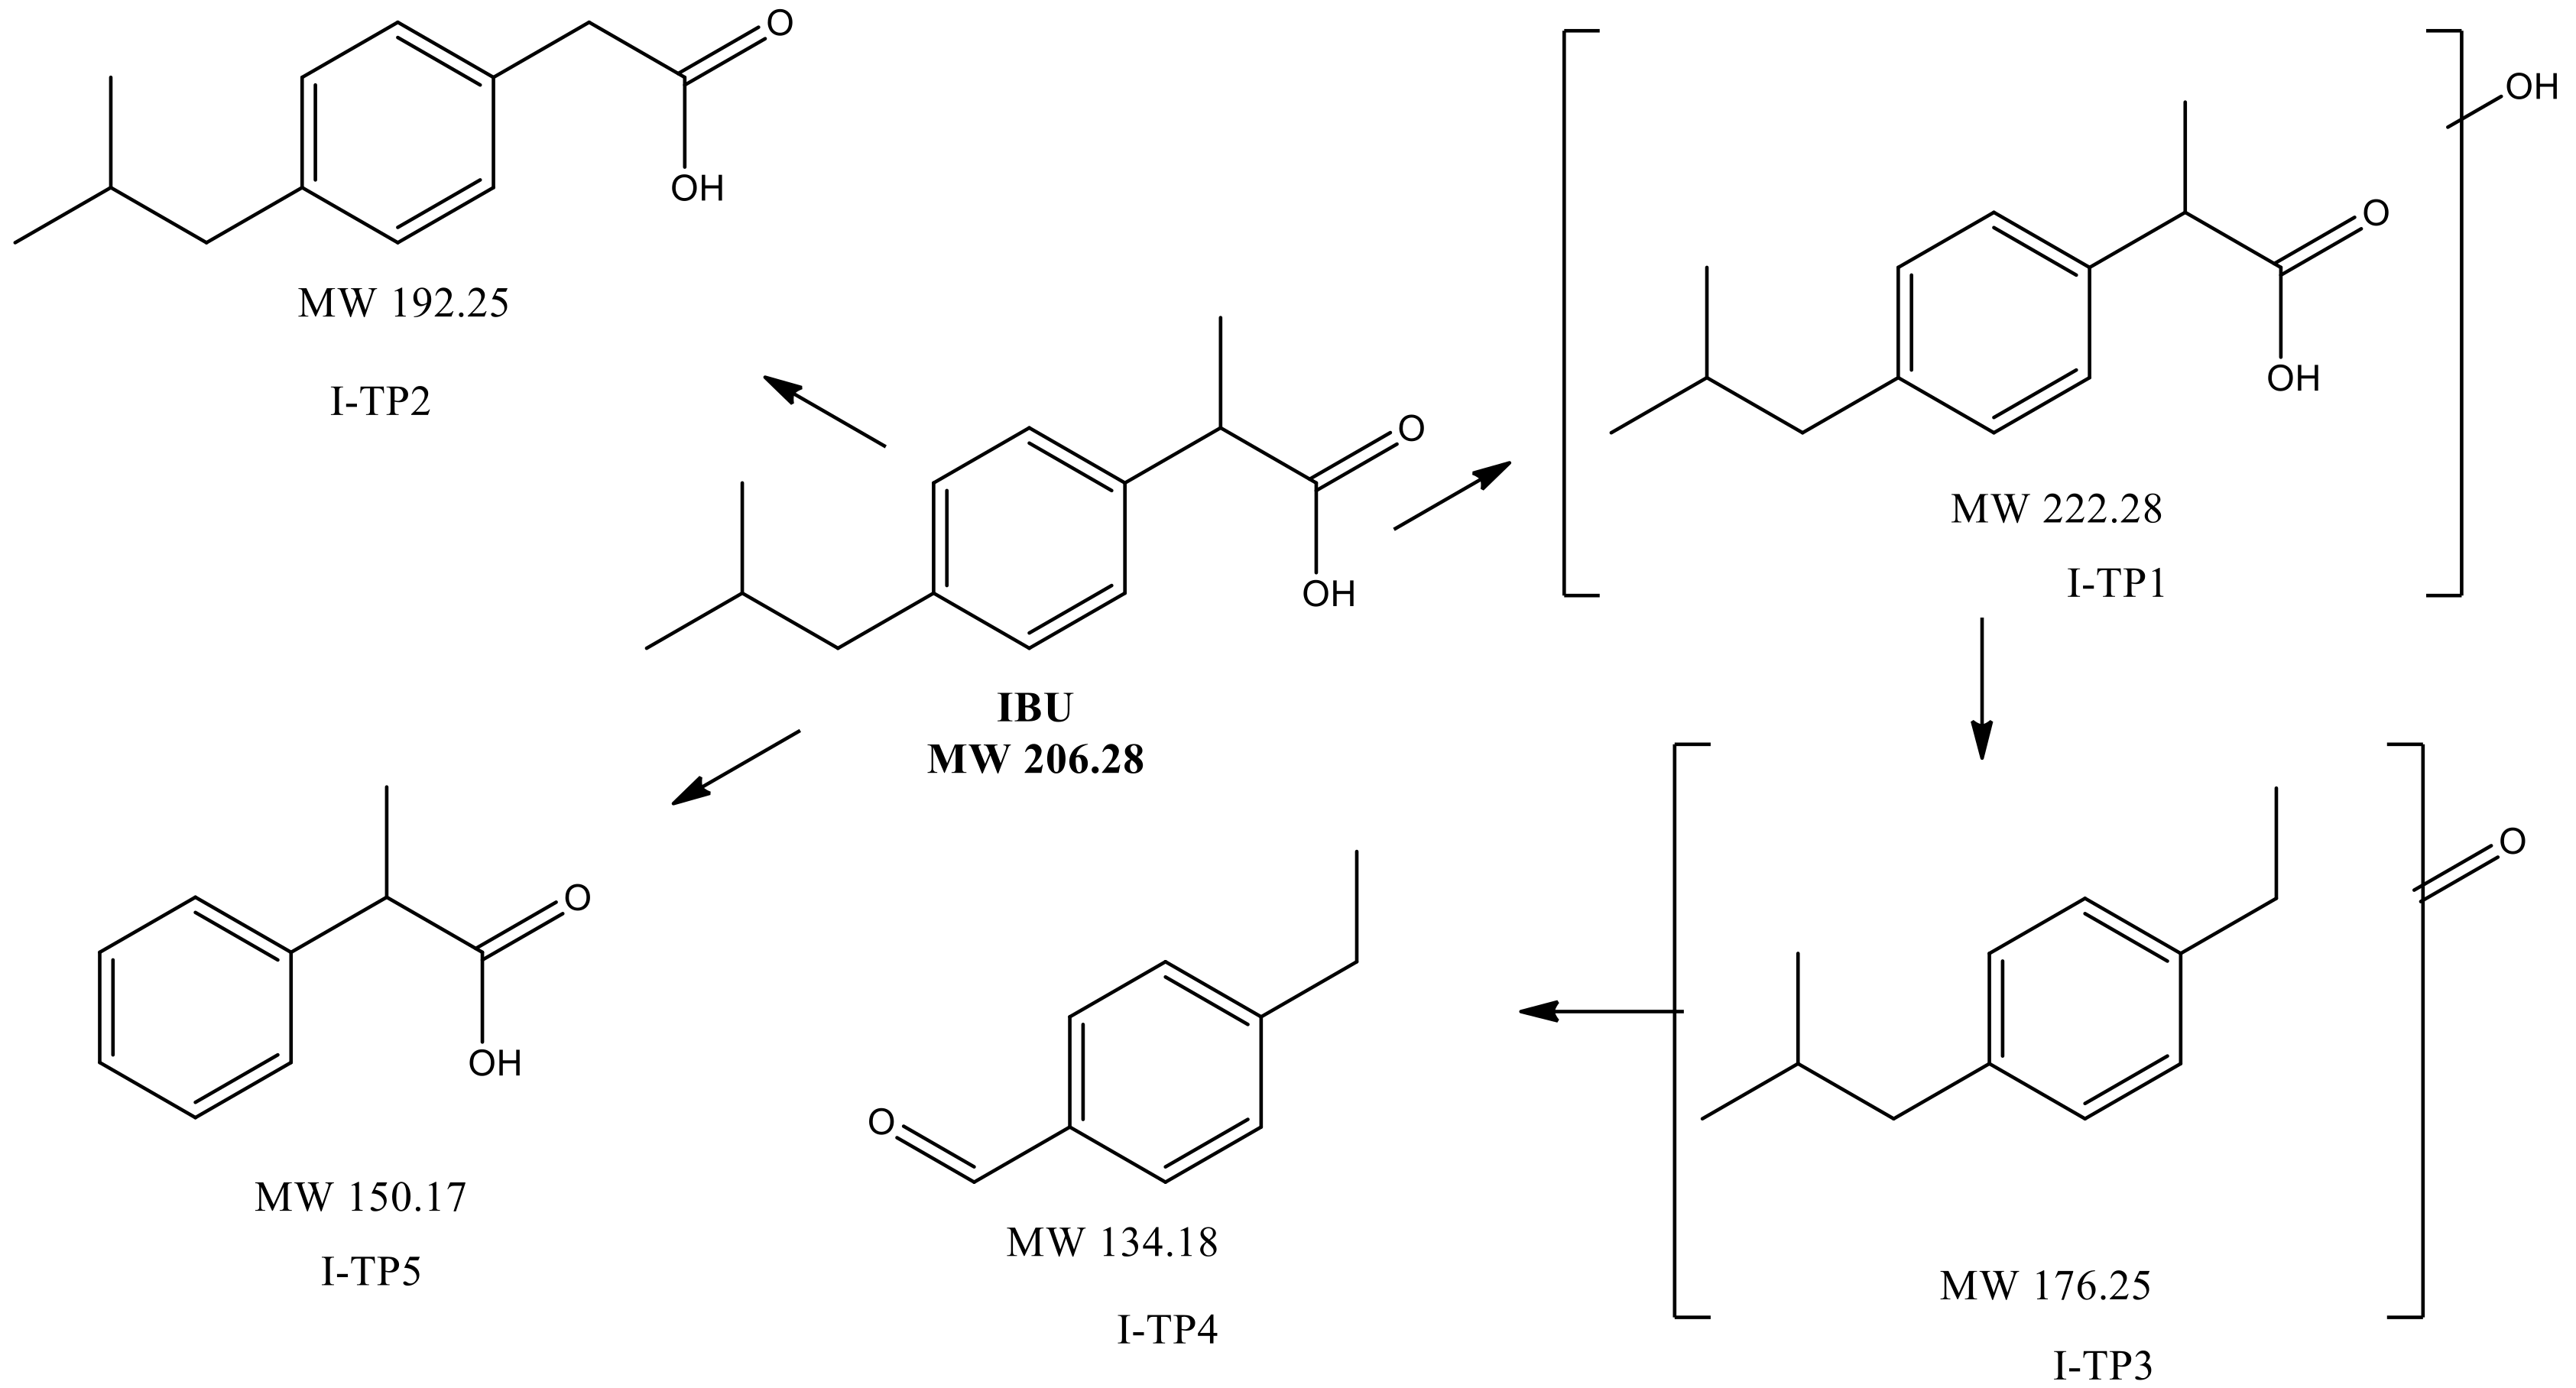
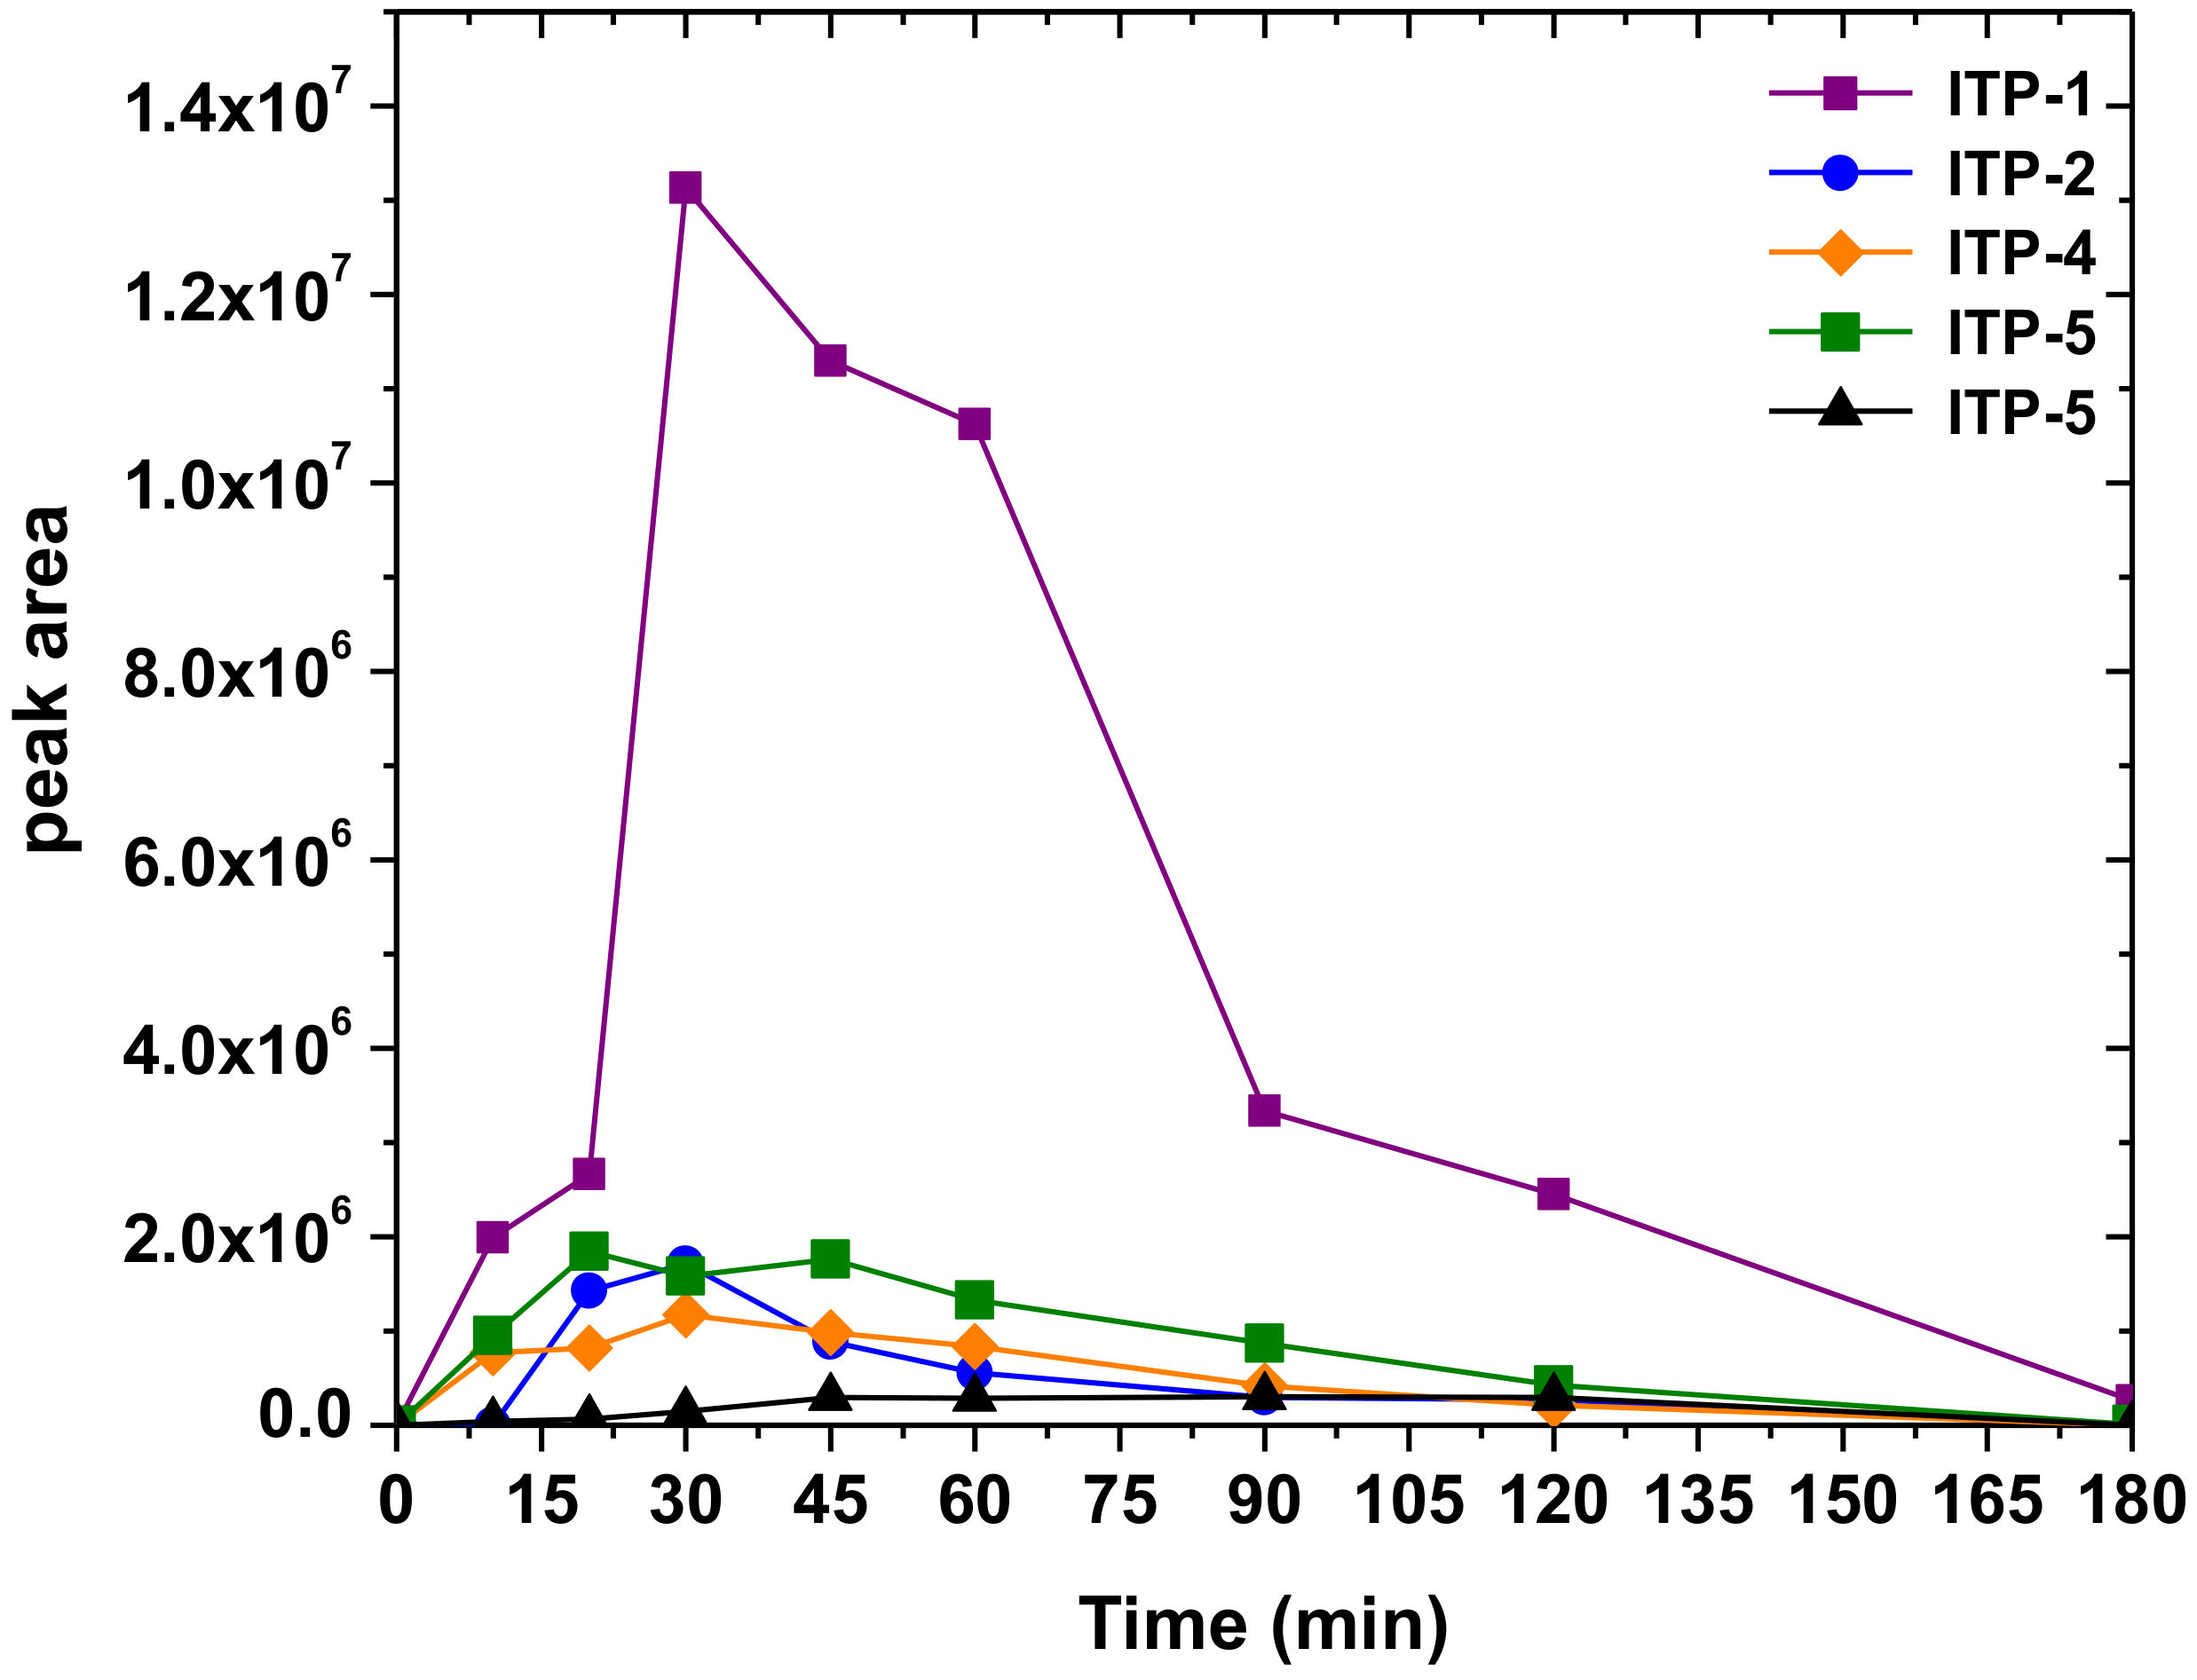
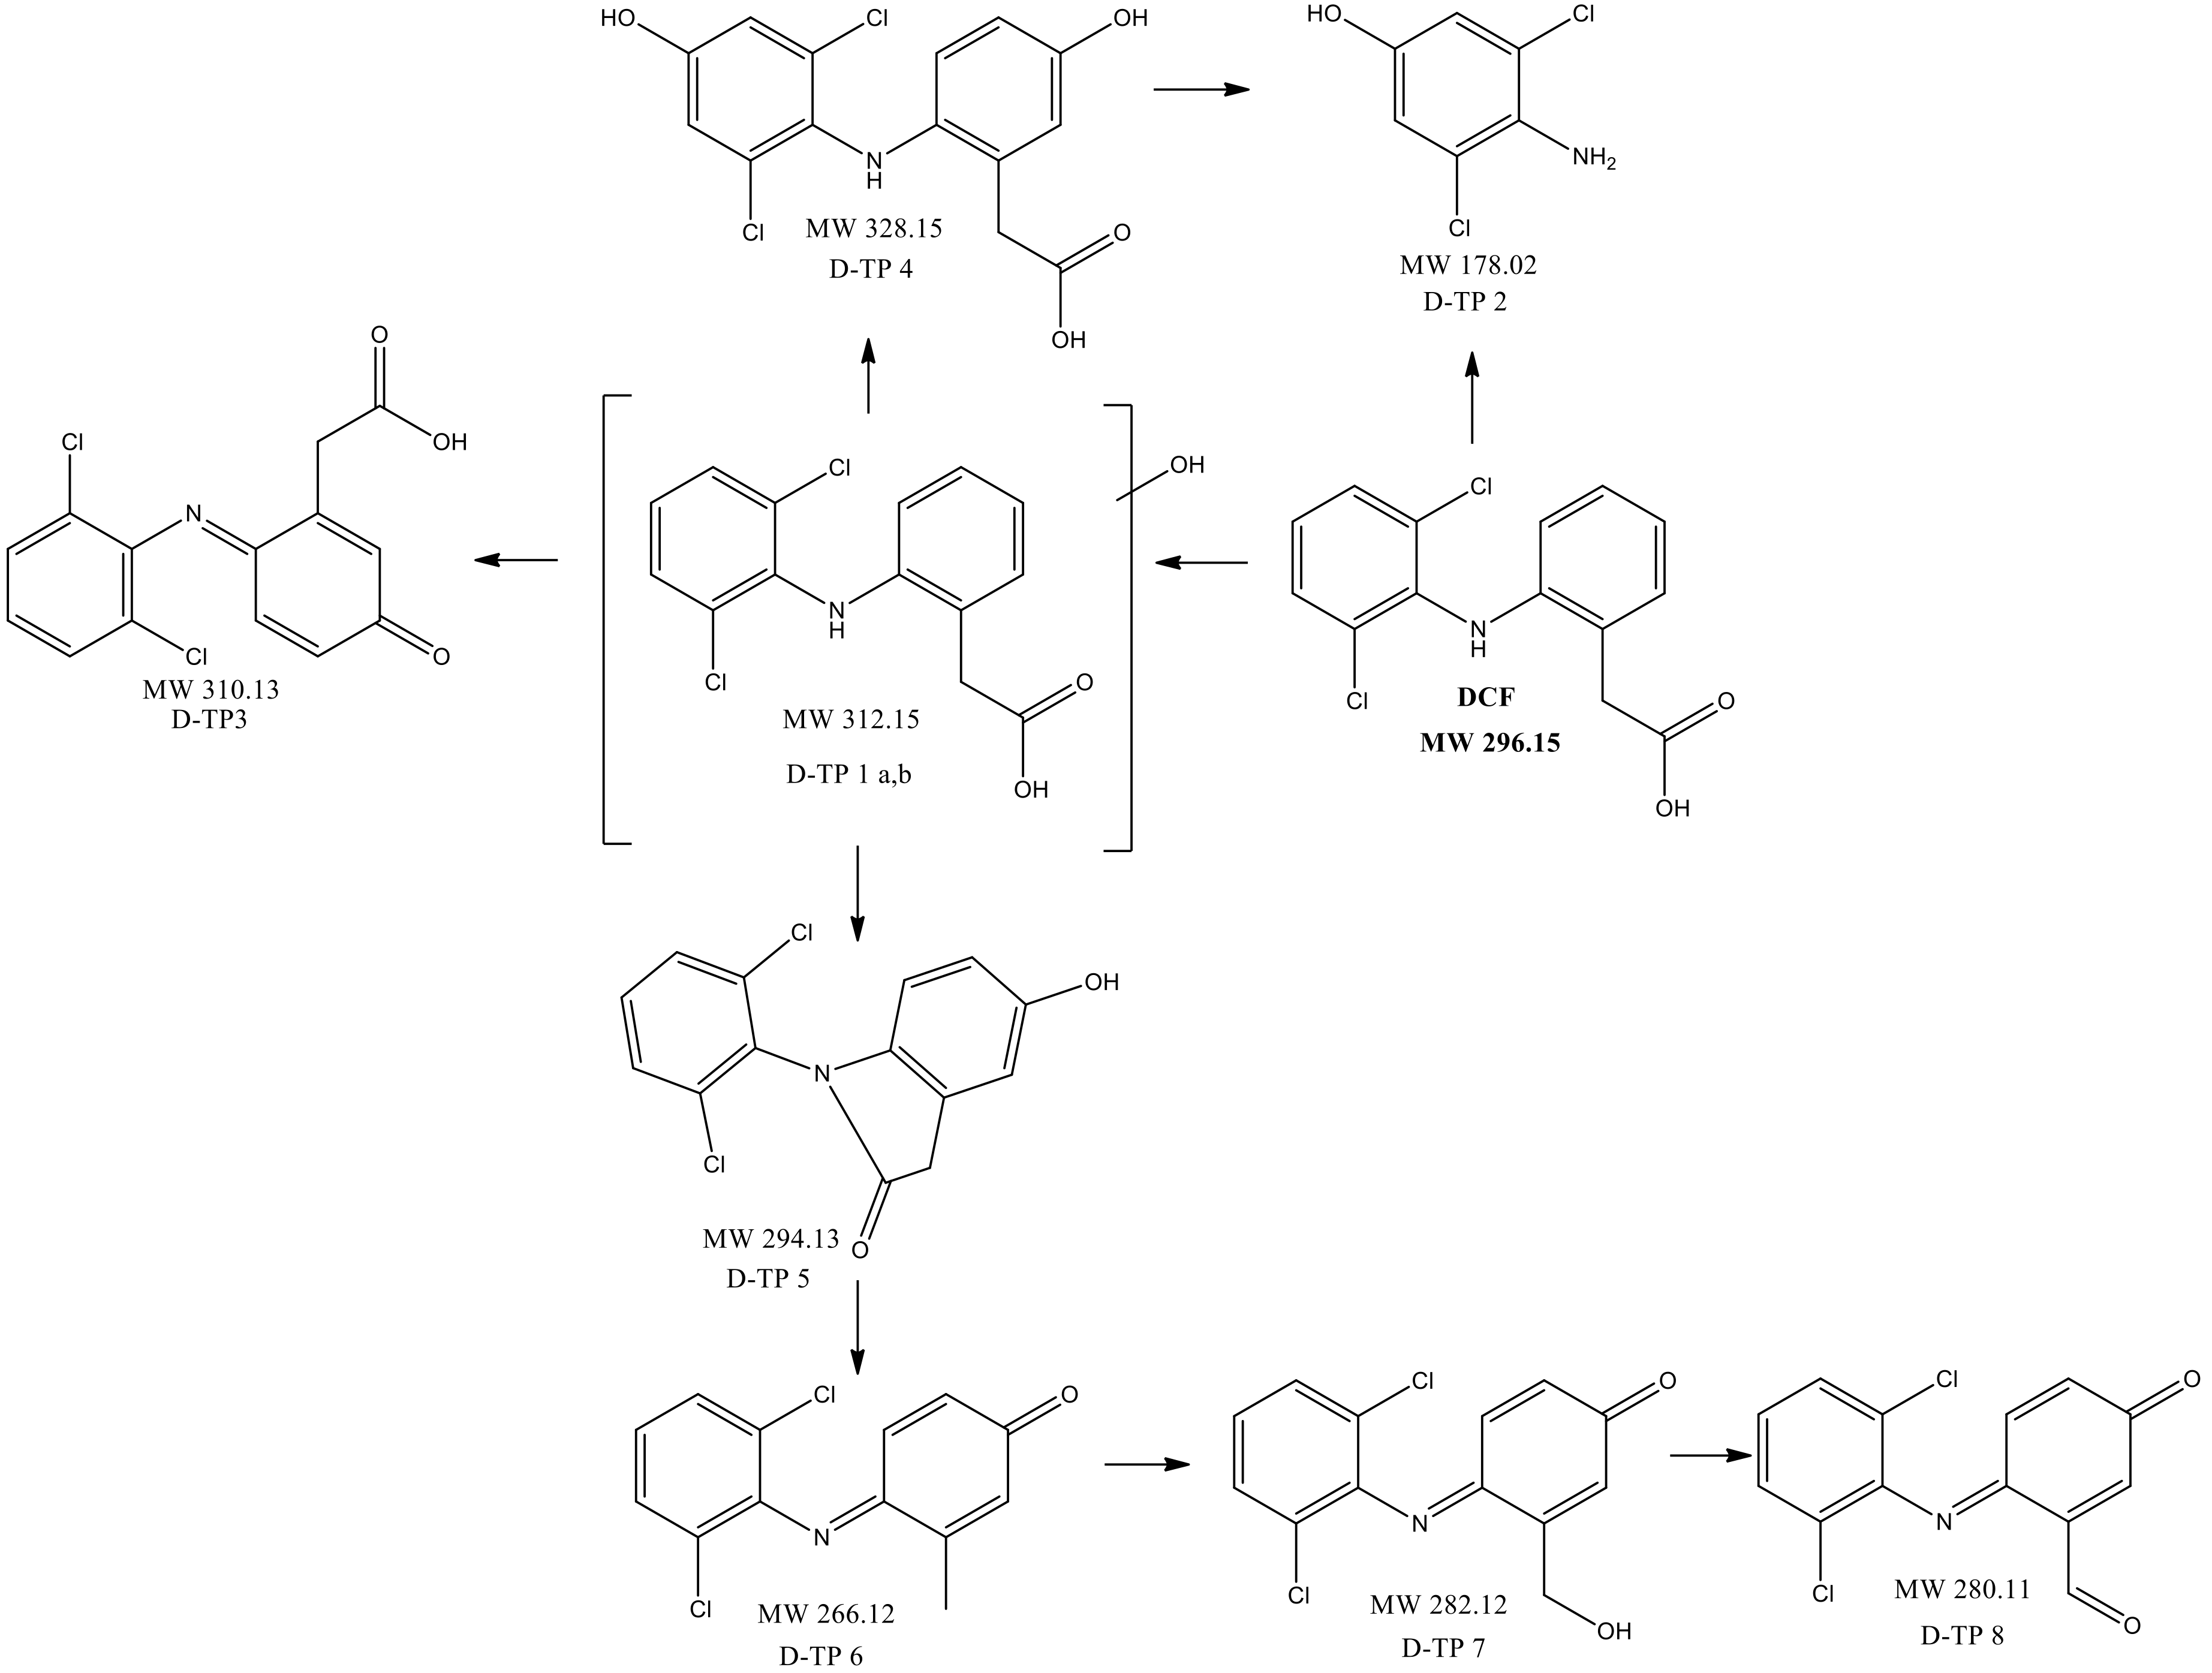
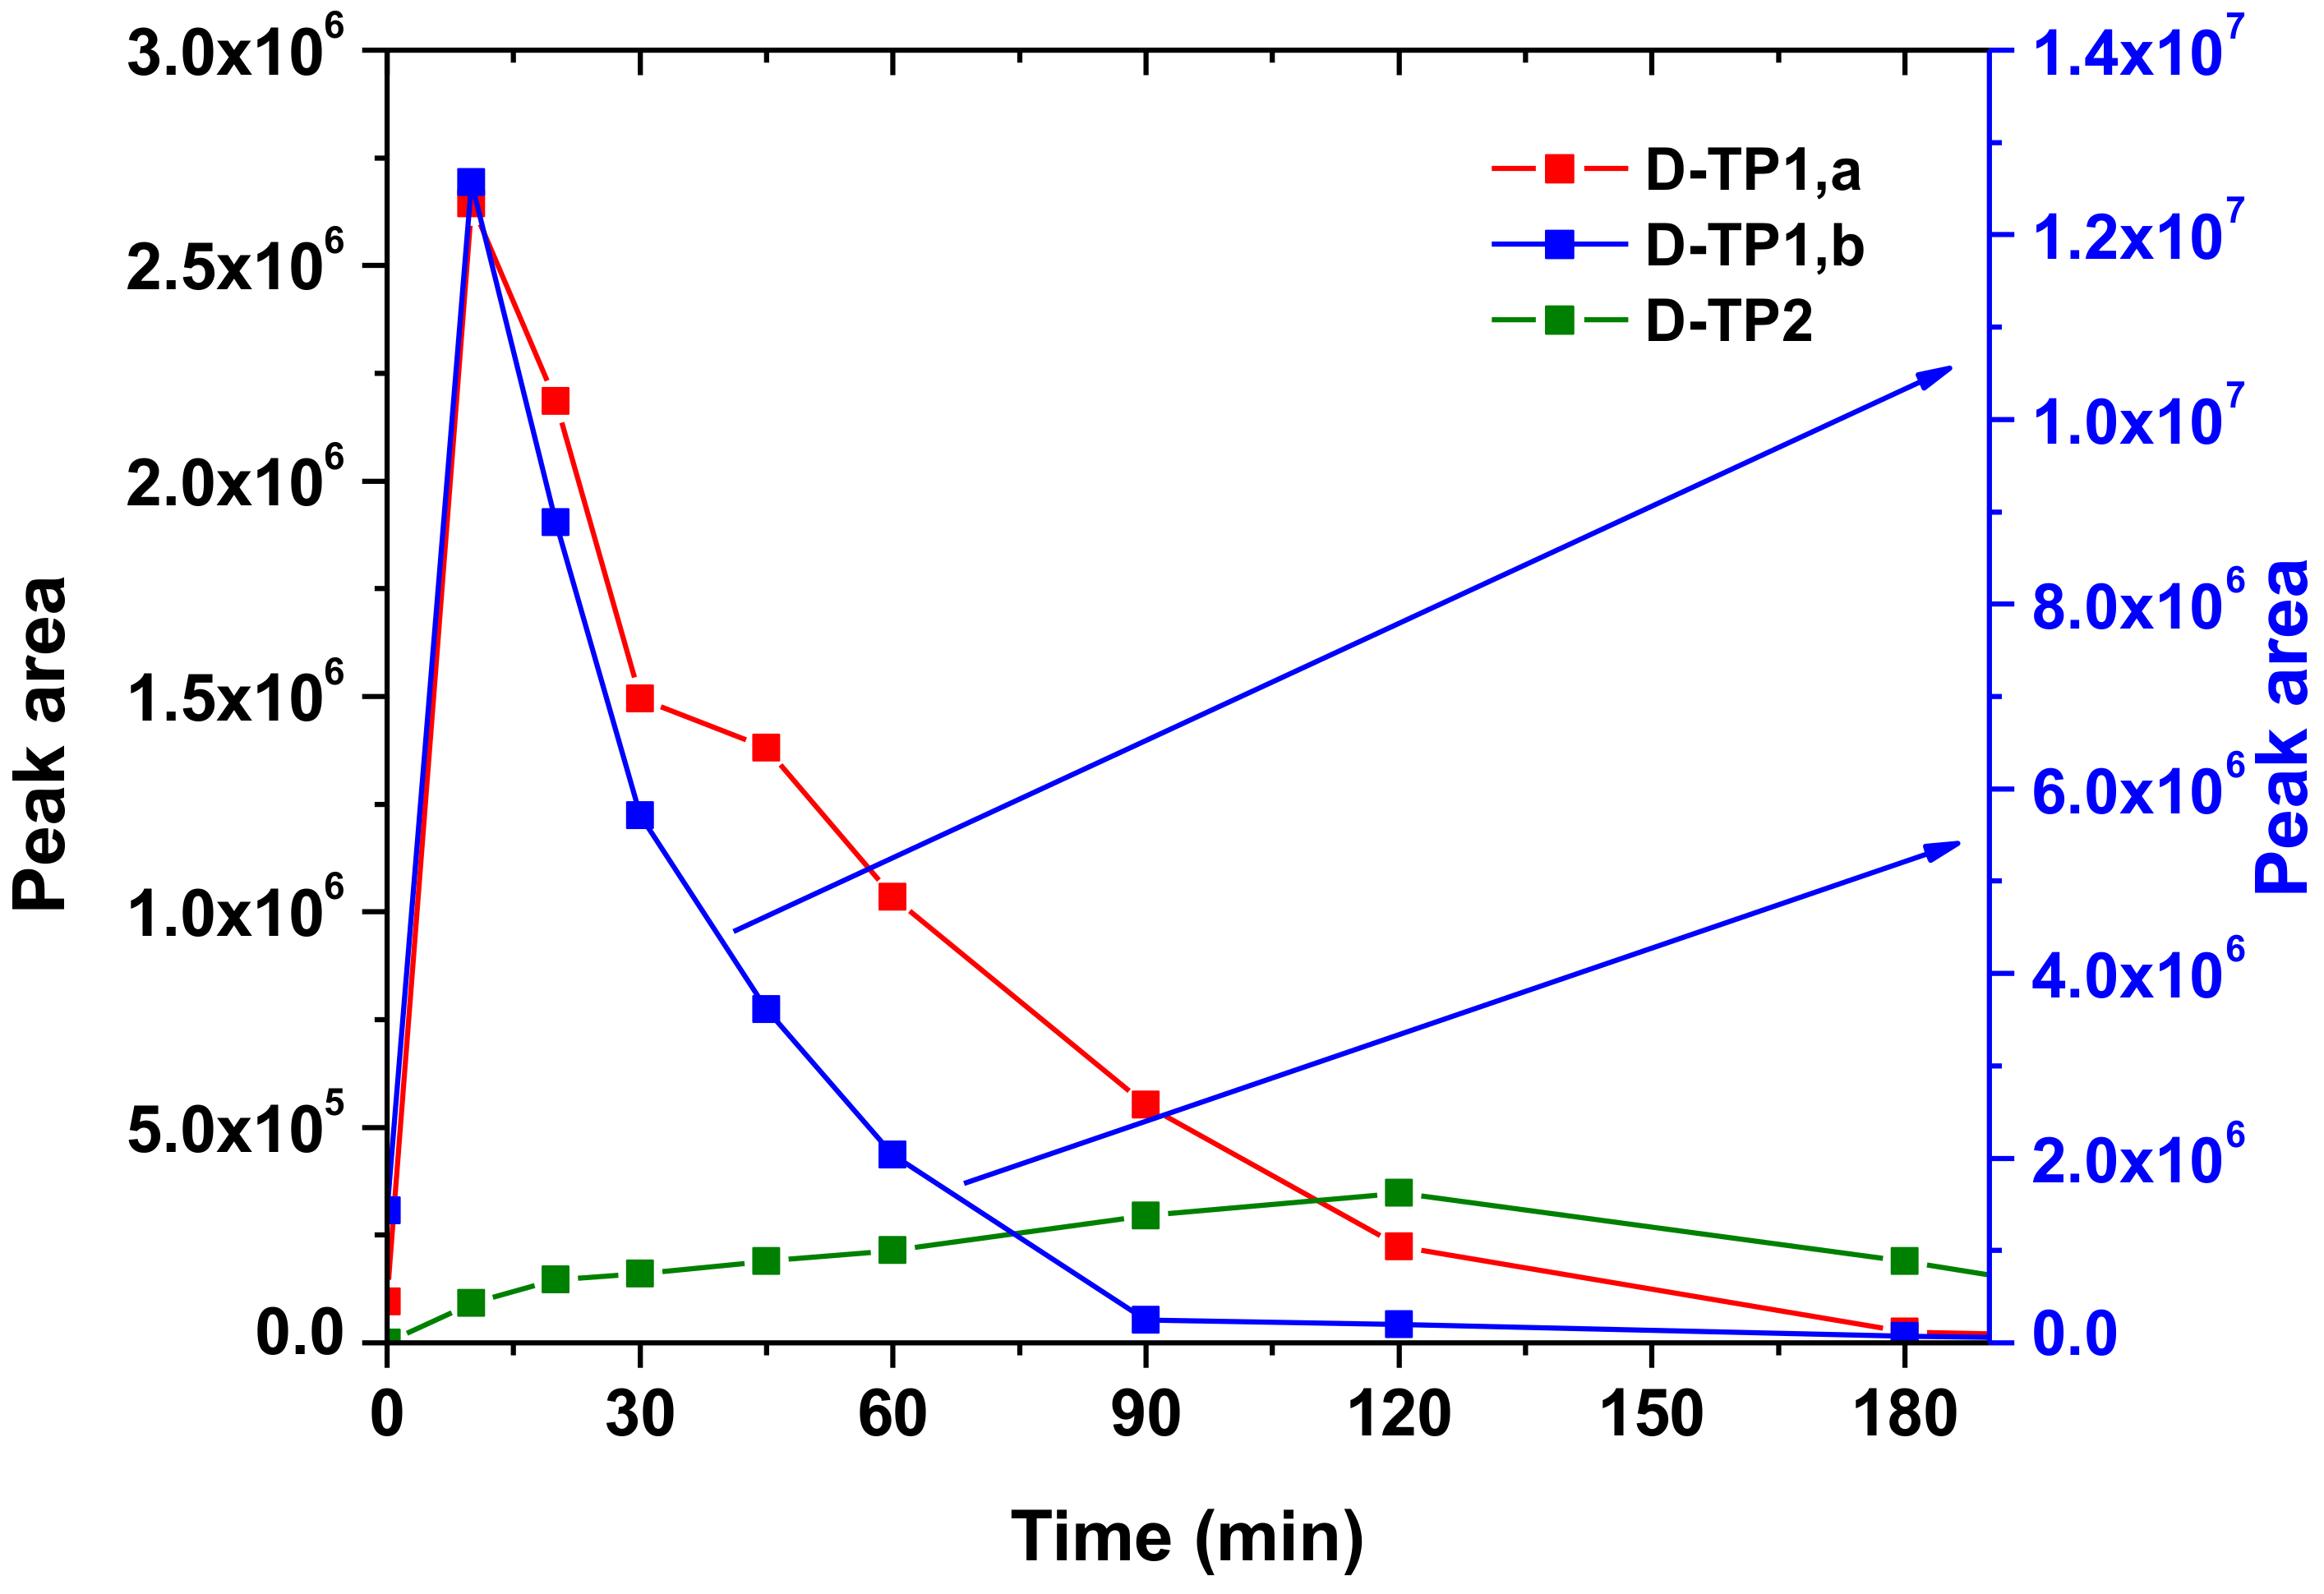
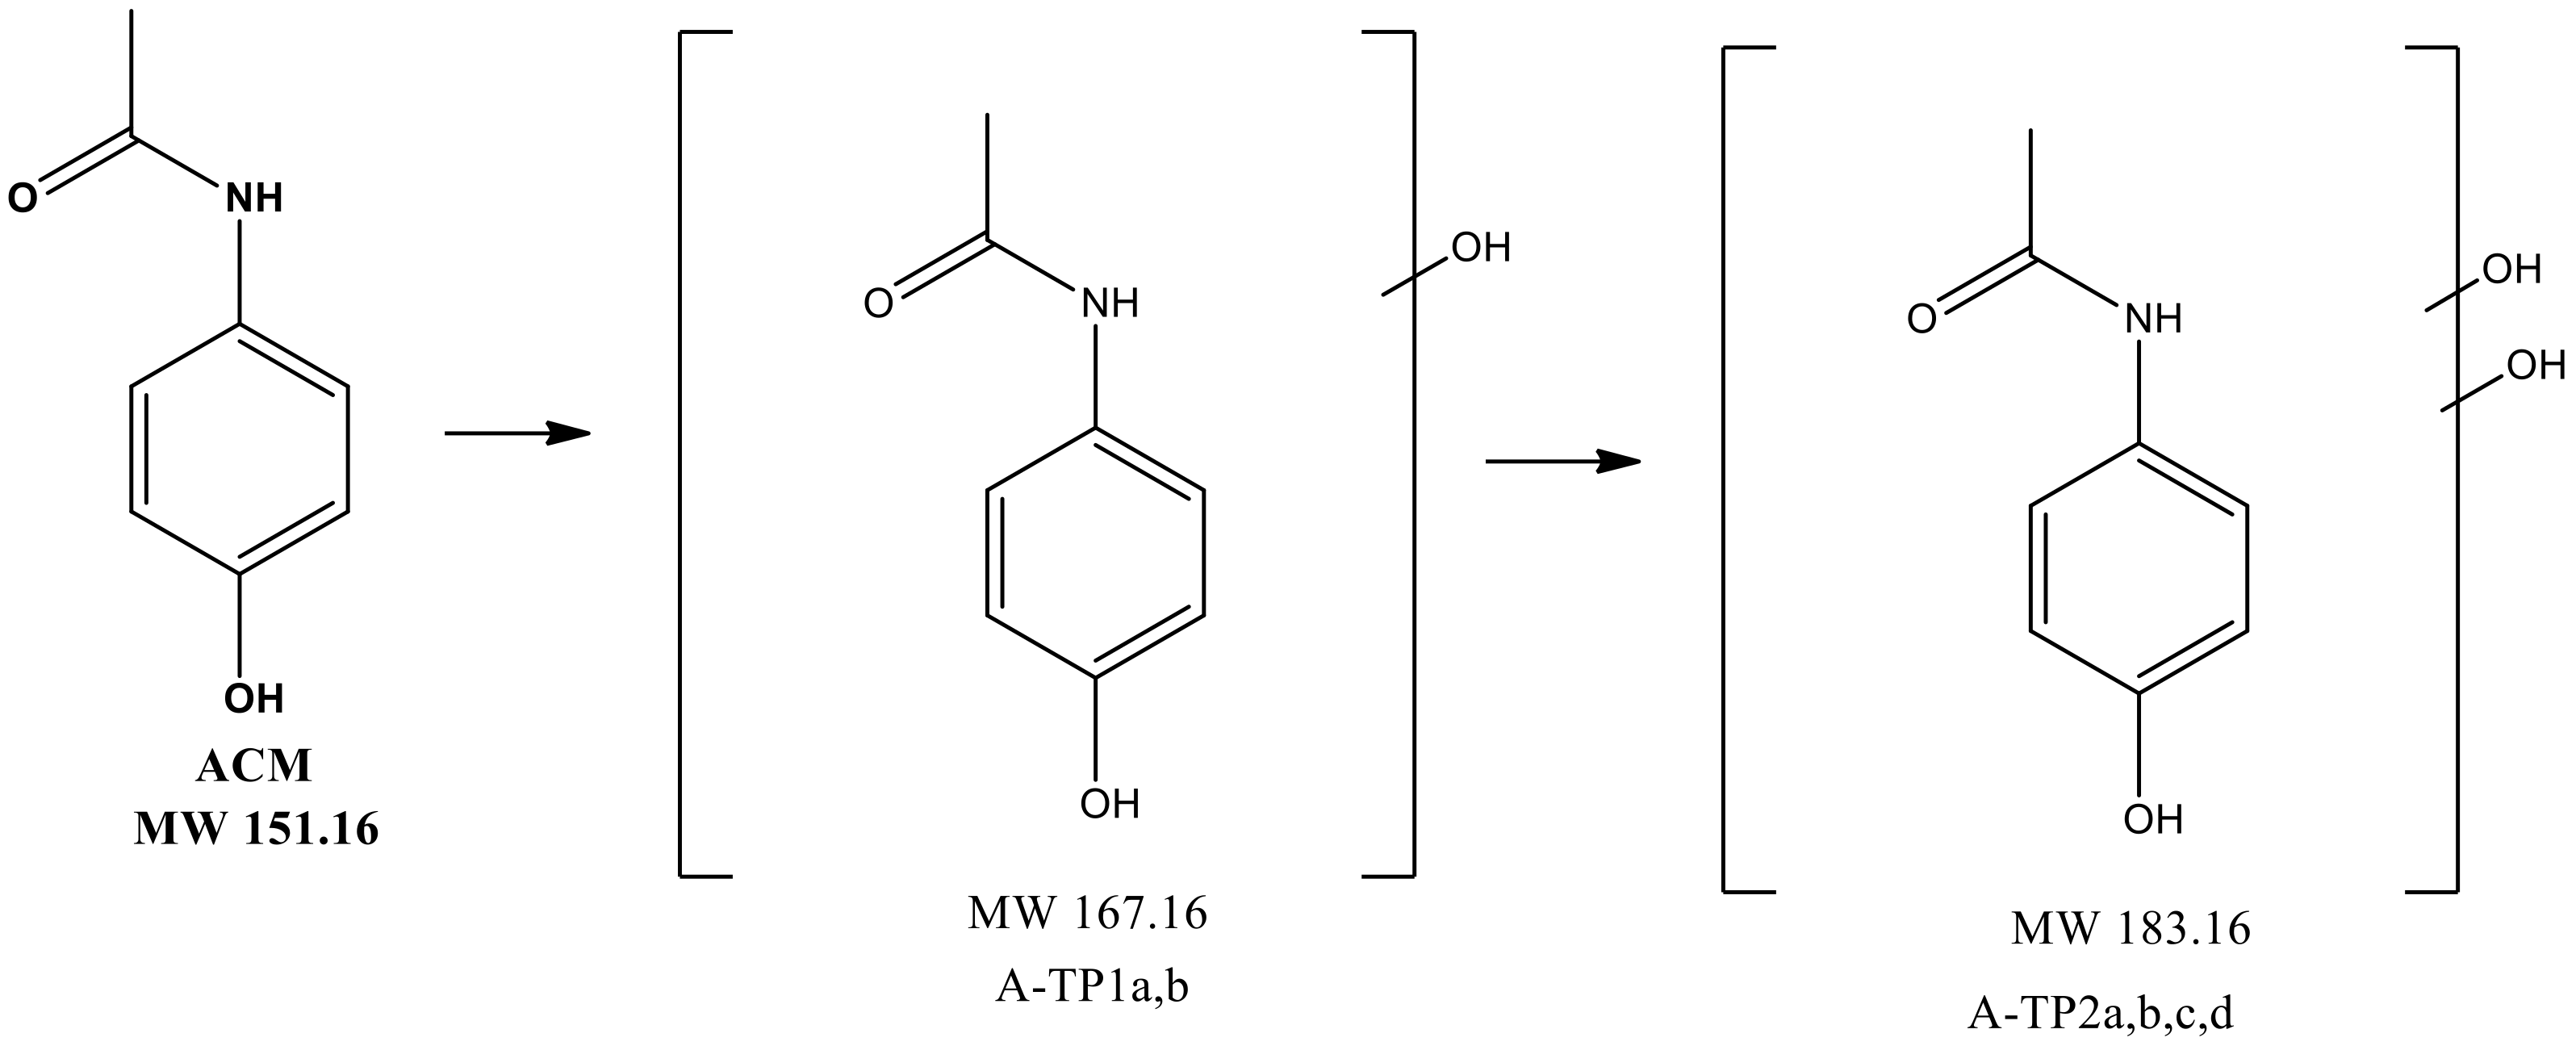
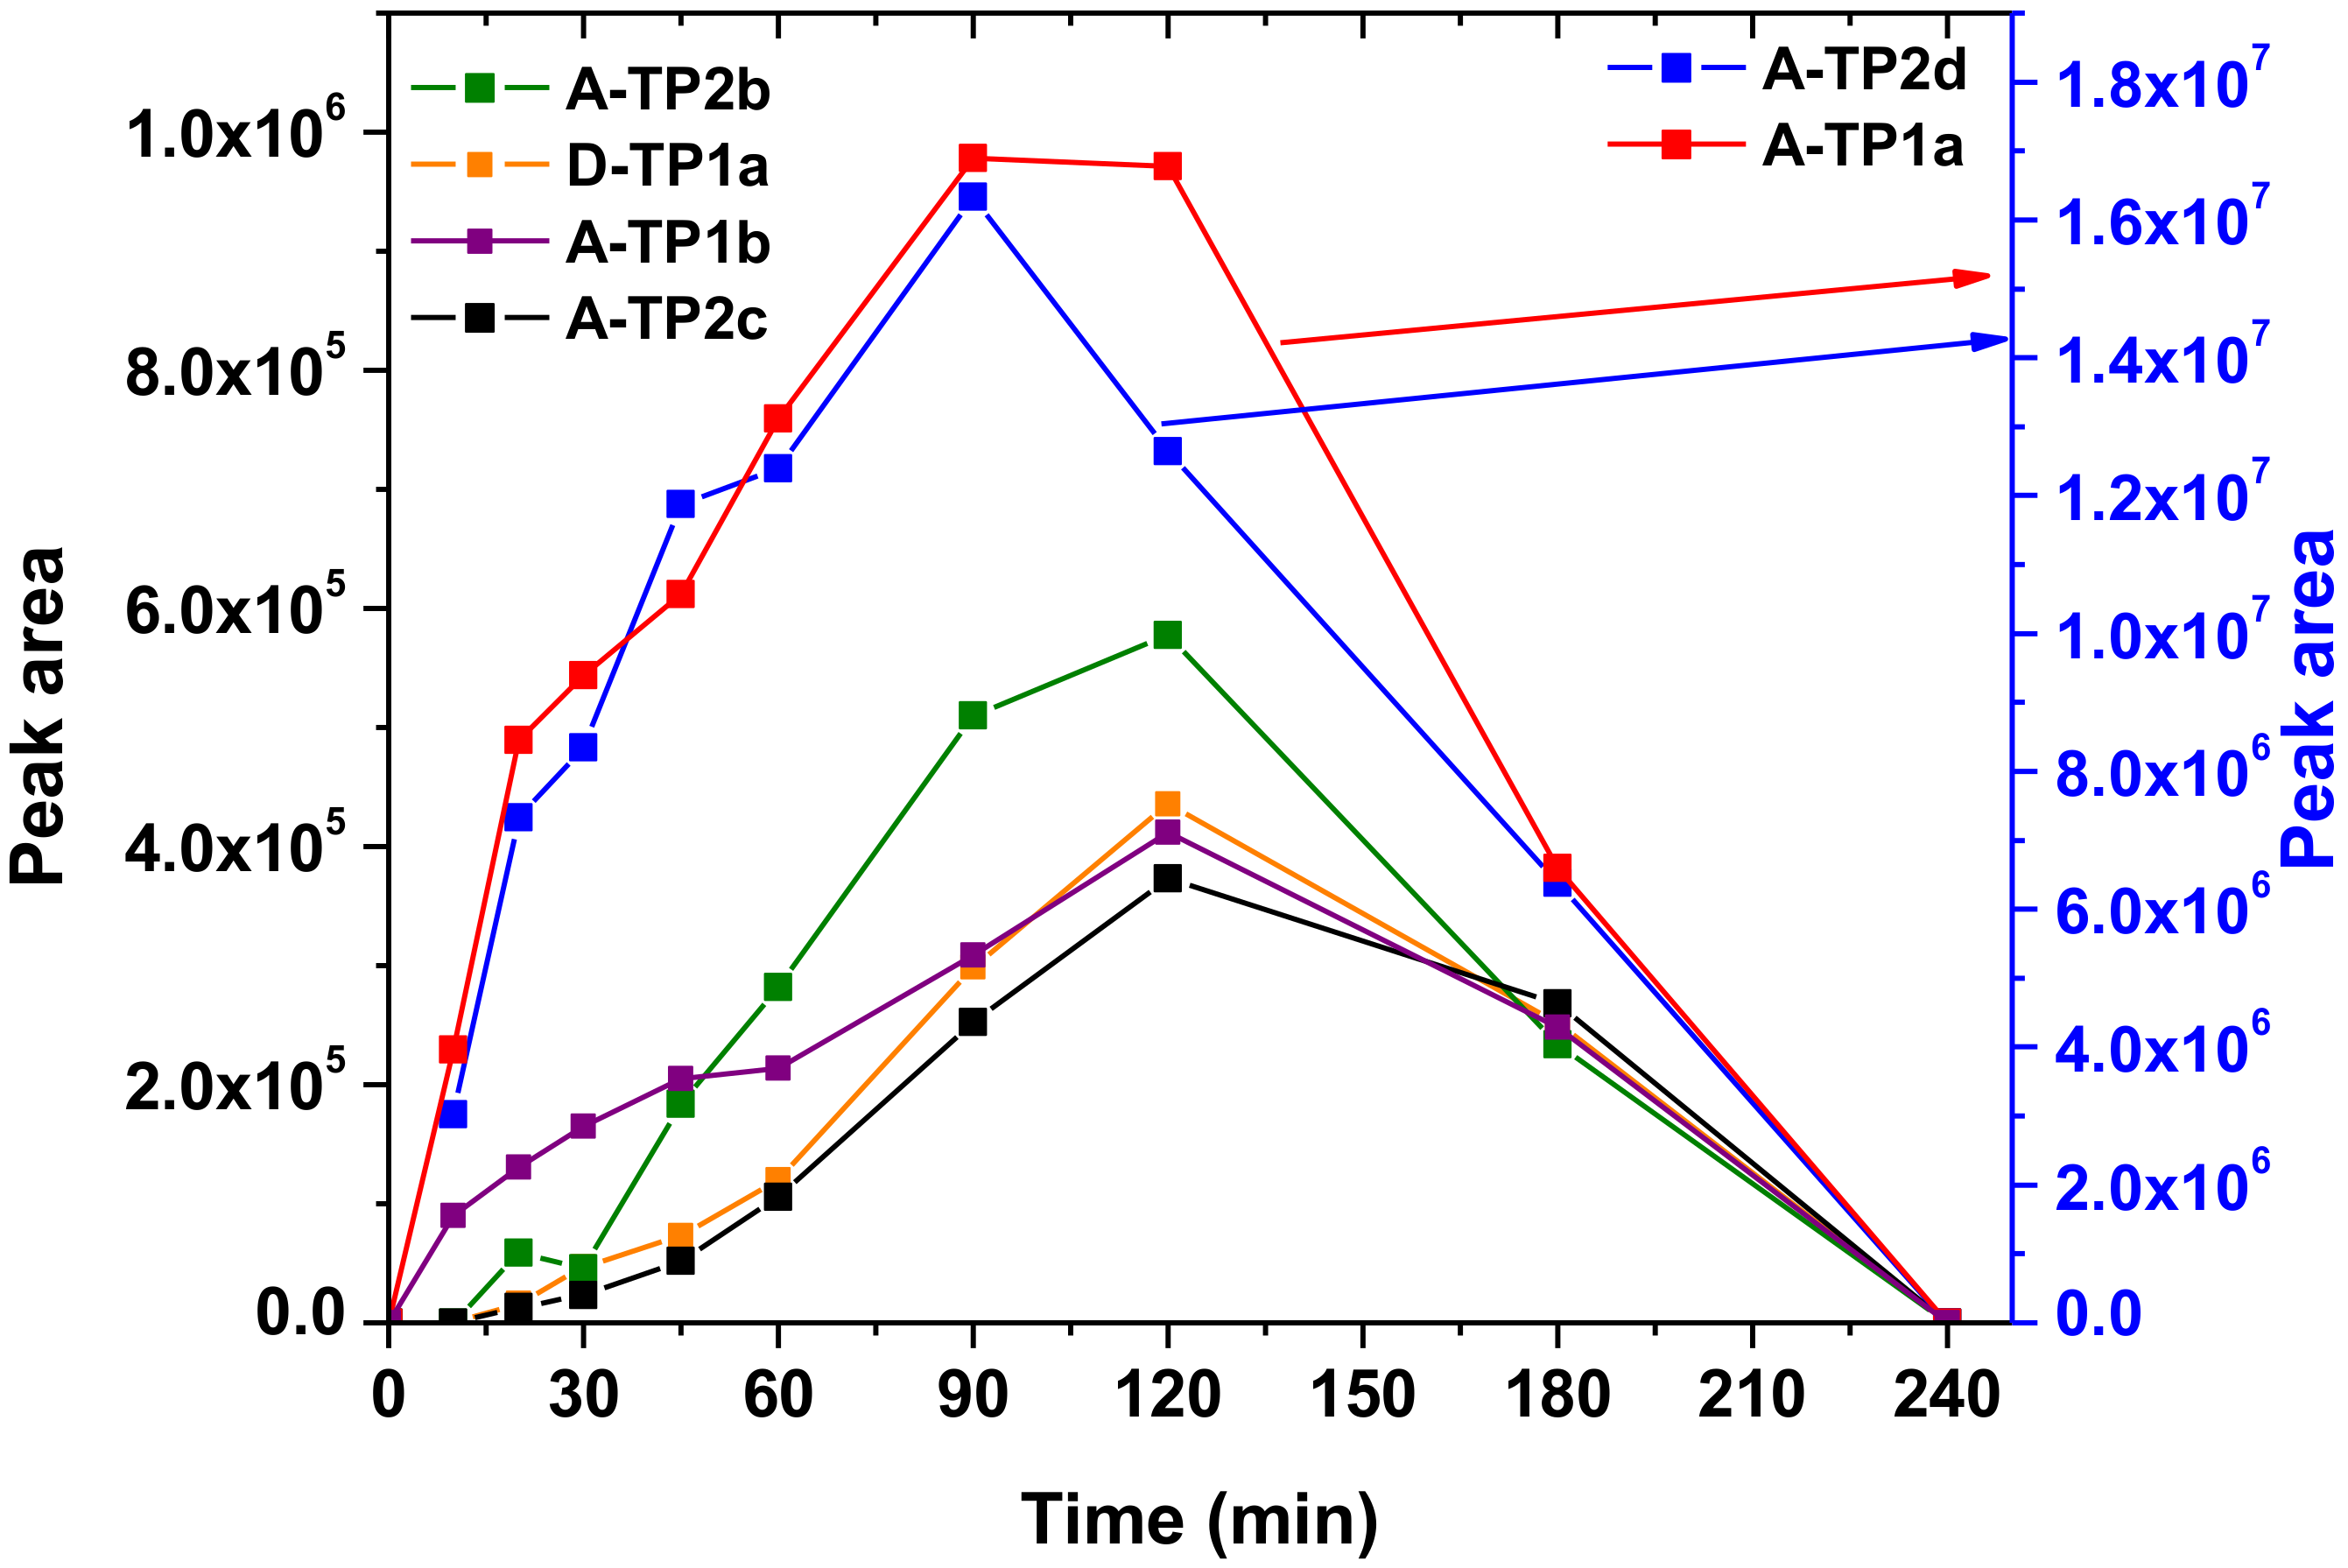
2.2.6. By-Product Evaluation

An attempt to identify the TPs generated by the heterogeneous photocatalytic degradation of the anti-inflammatory drug mixture by PEF/TiO2 20 wt% under SSL was also conducted. The data obtained by high-resolution mass spectra, are given by Table 2. In this study, five TPs generated during IBU photodegradation were identified (Figure 8).
According to the generated TPs, IBU mostly goes under degradation by hydroxylation, demethylation, decarboxylation, cleavage of isobutyl moiety, and oxidation of hydroxyl groups. The TPs generated from the degradation of IBU are in accordance to those obtained in previous studies by the oxidation techniques [60,61,62,63,64,65].
Initially, HO• attack IBP molecule to form mono-hydroxylated species (I-TP1). The above TP, induced decarboxylation and formation of I-TP3, which was further transformed to I-TP4. Additionally, a methyl group of IBP molecule was attacked by HO• to form a demethylated intermediate (I-TP2). In another third pathway, detachment of isobutyl group occurs, which leads to the formation of 2-phenylpropanoic acid (I-TP5). The evolution profiles of the above TPs are given in Figure 9. TPs emerged within the first 15 min of irradiation and remained abundant in the solution for 120 min of the applied.
In the case of DCF, nine TPs were identified (Figure 10). DCF transformation under oxidizing experimental conditions appears to proceed mainly by oxidation and hydroxylation reactions between chloroaniline and phenylacetic acid. The reaction of HO• with the aromatic ring forms a resonance-stabilized carbon-centered radical with the subsequent elimination of hydrogen radical, leading to the formation of the mono hydroxylated species (D-TP1,a,b). These mono hydroxylated TPs were further oxidized, resulting in the production of D-TP4 and D-TP5, while D-TP6 and their decarboxylated derivatives were formed by the loss of their carboxylic moiety. TP6 was probably further transformed to D-TP7 and D-TP8. Furthermore, the presence of D-TP3 suggests that one (of the four) monohydroxylated derivatives is further oxidized into the correspondent keto-derivative. Additionally, the formation of D-TP2 indicates the cleavage of the C–N bond of DCF as a preferential route, which originated from a series of C–N cleavage products. D-TP1,a,b and D-TP2 were mainly detected, at higher relative intensities compared to the other TPs, so only their evolution profiles were obtained, depicted in Figure 11. All are detected by the first 10 min of the process. D-TP2 has a maximum at 120 min. D-TP1,a,b decrease after the first 10 min, reaching undetectable levels at 180 min. The proposed degradation pathway has also been indicated by several studies regarding DCF oxidation [66,67].
In this study, hydroxylation can be considered as the main pathway of ACM transformation, since both the mono and di-hydroxylated derivatives of ACM have been identified (A-TP1,a,d and A-TP2,a,b,c,d) (Figure 12). The oxidation and subsequent degradation of ACM via hydroxylation is also proposed by several studies over ACM degradation [68,69].
The generated TPs present a peak at 120 min and are eliminated completely at 240 min of the photocatalytic procedure, as indicated in Figure 13.
All in all, the generated HO• from PEF/TiO2 20% TiO2 under SSL, appear to be the main reactive specie to the photocatalytic degradation of all the three studied compounds in the anti-inflammatory drug mixture.

2.2.7. Reusability Studies

From practical point of view, the stability of photocatalysts is an essential qualification feature. For this reason, the reusability of PEF/TiO2 20% wt% was studied in three utilization cycles under simulated solar irradiation. The experimental procedure was similar to that described in Section 3.5, but in this case, after each reaction, the material was rinsed with water and dried in an oven at 50 °C for 8 h before being reused in two additional consecutive photocatalytic experiments. It can be found that there is no significant change in the rate constants of the three target drugs in the three consecutive experiments. According to the results a reduction in the rate constant between 12% and 18% was observed in the third run with respect to the second run for all the studied compounds, indicating the good stability of these materials under the applied reaction conditions, which is attributed to the enhanced binding nature of PEF towards TiO2.

3. Materials and Methods

3.1. Materials

2,5-furan dicarboxylic acid (purum 97%), ethylene glycol anhydrous 99.8% (EG), tetrabutyltitanate (TBT) catalyst of analytical grade, Ibuprofen (IBU), acetaminophen (ACM) and diclofenac (DCF) sodium were obtained from Sigma-Aldrich (Steinheim, Germany). Titanium dioxide P25 from Evonik (Marl, Germany) (particle size 20–30 nm; crystal structure: ~80% anatase and 20% rutile; surface area: 56 m2/g, zero point of charge ~6.3–6.8) was used as photocatalyst. LC-MS-grade methanol was supplied by Merck (Athens, Greece). Ultrapure water for the experiments was obtained from a Millipore Waters Milli-Q water purification system (Merck SA Hellas, Athens, Greece).

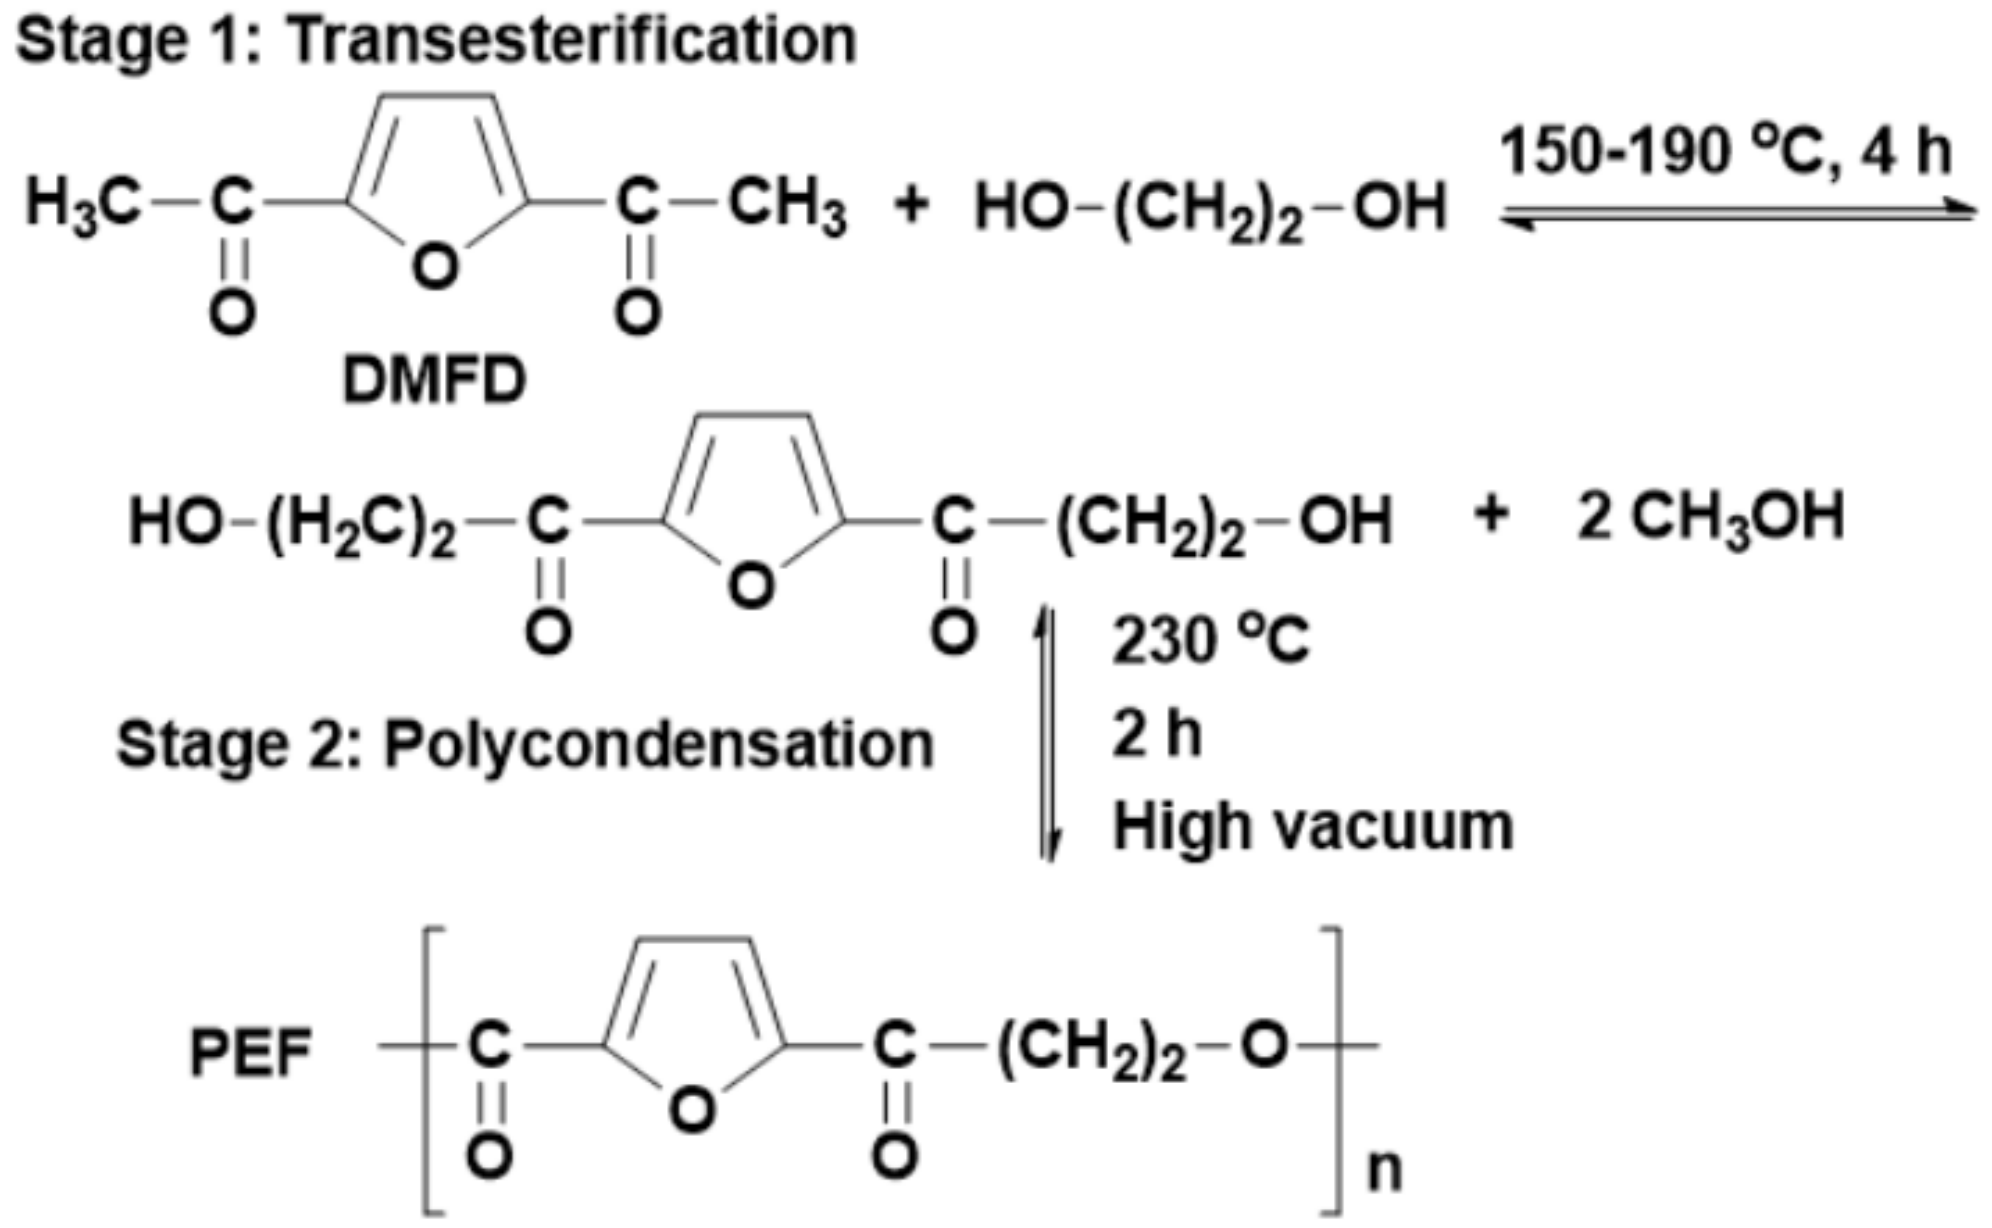
3.2. Polyester Synthesis

PEF was synthesized through the two-stage melt polycondensation (esterification and polycondensation) in a glass batch reactor, as described in our previous work [70]. 2,5-dimethylfuran-dicarboxylate (DMFD) was prepared using 2,5-FDCA, anhydrous methanol and concentrated sulfuric acid, as described previously [70]. DMFD and ethylene glycol in a molar ratio of diester/diol = 1/2.2 were charged into the reaction tube of the polyesterification apparatus with 400 ppm of TBT. The reaction mixture was heated at 150 °C under argon flow for 2 h and stirring speed 350 rpm, at 160 °C for an additional 2 h and finally at 170 °C for 1 h. This first step (transesterification) is considered complete after the collection of almost all the theoretical amount of CH3OH, which was removed from the reaction mixture by distillation and collected in a graduate cylinder. In the second step of polycondensation, vacuum (5.0 Pa) was applied slowly over a time of about 30 min to remove the excess of diol, to avoid excessive foaming and to minimize oligomer sublimation, which is a potential problem during the melt polycondensation. The temperature was gradually increased (1 h) to 220 °C, while stirring speed was also increased to 720 rpm. The reaction continued at this temperature for 2 h. Subsequently, the temperature was increased to 230 °C for 2 h and to 240 °C for an additional 1 h. After the polycondensation reaction was completed, the polyesters were removed from the reactor, milled, and washed with dissolution in TFA/chloroform 1/4 v/v and precipitation in cold methanol.

3.3. Photocatalyst Preparation

PEF nanocomposites with TiO2 were prepared by the solution mixing method, with a mixture of dicloromethane/chloroform/trifluoroacetic acid as a mutual solvent. The desired amount of nanofiller was first added into the solvent at a concentration of 1 mg/mL, and the mixture was subjected to sonication for 1 h to obtain a uniform dispersion. At the same time, PEF was completely dissolved in the solvent mixture at a concentration of 20 mg/mL. The PEF solution was then mixed with the nanofiller suspension followed by stirring and sonication for 30 min. The solvent was allowed to evaporate in air for three days with slight stirring for the first day and then at 50 °C for two days under a vacuum. After complete solvent removal, the nanocomposites were obtained in the form of powder. Powder was melt pressed in a hot press at 220 °C for 10 min in order to obtain films with 1 mm thickness. According to this procedure PEF/nTiO2 nanocomposite films containing 5, 10, 15, and 20 wt% TiO2 were obtained.

3.4. Photocatalyst Characterization

Number-average molecular weight (Mn) of PEF was measured by Gel permeation chromatography (GPC) using a Waters 150 °C apparatus (Milford, MA, USA) equipped with differential refractometer as a detector and three ultrastyragel (103, 104, 105 Å) columns in series. Hexafluoroisopropanol was used as mobile phase at a flow rate 0.5 mL/min at 40 °C. Calibration was performed using polystyrene standards with a narrow molecular weight distribution.
Fourier transform infrared spectroscopy (FTIR) spectra of all the samples were obtained using a Perkin-Elmer FTIR spectrometer (Dresden, Germany), model Spectrum One, with the use of KBr discs. The IR spectra were obtained in absorbance mode and in the spectral region of 400–4000 cm−1 using a resolution of 4 cm−1 and 64 co-added scans.
Wide-Angle X-ray Diffraction (WAXD) patterns of the samples were recorded using a MiniFlex II XRD system from Rigaku Co (Chalgrove, Oxford, UK), with CuKα radiation (λ = 0.154 nm) in the angle 2θ range from 5 to 60 degrees.
For thermal analysis measurements a Perkin-Elmer (Dresden, Germany), Pyris Diamond differential scanning calorimetry (DSC), coupled with an Intracooler 2P cooling accessory, was used. Samples of 10 ± 0.1 mg sealed in aluminium pans were used to test the thermal behavior of the polyesters. The samples were heated from 30 °C to 300 °C in a 20 mL/min flow of N2 with heating rate 20 °C/min in order to observe the melting temperature of the as received polyesters. The samples first were held at that temperature for 2 min, then quenched and rescanned again until 300 °C.
Thermogravimetric analysis (TGA) measurements were carried out by a STA 449C (Netzsch-Gerätebau, GmbH, Selb, Germany) thermal analyzer from room temperature up to 600 °C with 20 °C/min heating rate and 30 mL/min flow of N2 (99.9%).
Scanning electron microscopy (SEM) was carried out using a JEOL JMS-840A scanning microscope (Tubney WoodsAbingdon, Oxfordshire, UK) was equipped with an energy-dispersive X-ray (EDX) Oxford ISIS 300 micro-analytical system.

3.5. Photocatalytic Degradation Experiments

Photocatalytic experiments under UV-Vis irradiation were carried out in a solar simulator Atlas Suntest CPS+ (Linsengericht, Germany). Illumination was provided with a xenon lamp (1.5 kW) at an irradiance of 700 W m−2. Irradiation experiments were performed using a Pyrex glass reactor containing 100 mL of aqueous solutions, at various amounts of catalyst (400–1000 mg L−1), while the pH ranged from two to 10. The effect of pH was studied by adjusting the solutions with HCl 0.01M and NaOH 0.01 M. Higher initial concentration of drugs (5 mg L−1 of each) than the typical values found in environmental samples has been selected in the experiments in order to obtain slower kinetics and to facilitate the follow-up of the mineralization. The suspensions were kept in the dark for 30 min, prior to illumination, to reach adsorption equilibrium onto the semiconductor surface. Samples were taken at different time intervals, they were filtered on syringe nylon membrane filters (0.22 μm pore-size) and they were analyzed by LC-MS, as described in the following sections.

3.6. Analytical Procedures

3.6.1. Kinetic Studies

Drug concentrations were quantified by a HPLC system consisted of a SIL 20A autosampler and a LC-20AB pump both from Shimadzu (Kyoto, Japan). The analytical column used was a C18, 150 × 4.6 mm with 3.5 μm particle size (Pathfinder, Shimadzu Scientific Instruments, Columbia, SC, USA) thermostated at 40 °C. The detector used was SPD 20A DAD coupled in a series with the LC-MS 2010EV mass selective detector, equipped with an atmospheric pressure electrospray ionization source (ESI) in a negative ionization (ΝΙ) and positive ionization (PΙ) mode. A mixture of LC-MS grade water −0.1% formic acid and methanol with a flow rate of 0.4 mL min−1 was used as eluent. The time program of the binary mobile phase was: initially 40% methanol, after 5 min changed to 95% methanol and kept stable for 5 min, finally returned to 40% methanol at 12 min. The injection volume was 20 μL and the total run analysis lasted 15 min. The drying gas was operated at flow 10 L min−1 at 200 °C. The nebulizing pressure was 100 psi, the capillary voltage −3500 V for negative ionization and 4500 V for positive ionization, while the fragmentation voltage was set at 1.65 V. DCF and ACM were detected at PΙ mode, with retention time 10.23 and 3.97 min and 296 and 151 m/z precursor molecular ions, respectively. IBU was detected at ΝΙ mode at 11.43 min retention time and 205 m/z precursor molecular ion, respectively.

3.6.2. By-Product Evaluation

The intermediates formed during the drug mixture photodegradation were characterized by an LTQ Orbitrap Discovery MS high-resolution system operating in the positive and negative ionization mode. The chromatographic analysis was run on an Acquality UPLC HSS T3 column (100 × 2.1 mm, 1.8 μm, Waters, Milford, MA, USA) maintained at a constant temperature of 40 °C. Water (phase A) and methanol (phase B) was used as mobile phases at a flow rate of 500 L min−1. A linear gradient progressed from 90% A (initial conditions) to 0% A in 14 min, followed by a linear gradient to 90% A in 20 min. The ESI-source parameters were as follows: Sheath and auxiliary gas flow rate 40 and eight (nitrogen, arbitrary units), respectively; source voltage at 3.60 kV; capillary temperature was maintained at 320 °C. For the fragmentation study, the voltage of the HCD collision cell was set at 40 eV. A resolving power of 30,000 was applied and the Orbitrap mass analyzer was externally calibrated (mass accuracy within ±5 ppm). Chemical compositions and accurate masses of the protonated molecules and their fragments were calculated by Xcalibur software (ThermoFisher Scientific, Waltham, MA, USA).

3.6.3. Mineralization Studies

In order to evaluate the efficiency of the photocatalytic procedure, total organic carbon (TOC) on filtered suspensions (0.22 μm), was evaluated by a Shimadzu TOC V-csh Analyzer equipped with a non-dispersive infrared detector. Ion chromatography (Metrohm) was also used, equipped with an automatic sampler was used for the determination of NO2, NO3, and Cl ions. The analytical column used was a Metrosep A Supp 4 (250 × 4.0 mm) with 9 μm particle size. The eluent used was Na2CO3 1.8 mM-NaHCO3 1.7 mM with a flow rate of 1 mL min−1. The total run analysis lasted 20 min, while the injection volume was 20 μL.

4. Conclusions

Effective photocatalysts have been prepared using biobased poly(ethylene furanoate) polymer and high concentrations of TiO2 nanoparticles. As was found from SEM-EDX analysis, the dispersion of nanoparticles was fine inside the polymer matrix and its thermal stability was substantially enhanced. The crystal structure of PEF was not affected from TiO2 addition due to the lack of interactions between inorganic nanoparticles and organic polymer matrix. Photodegradation experiments were also conducted for a mixture commonly found in wastewaters, anti-inflammatory/analgesic drug mixture. The parameters affecting the photodegradation procedure were optimized for the most efficient synthesized photocatalyst (20% PEF/TiO2) and mineralization study was conducted. TOC removal reaches 50% decrease after 360 min of photocatalytic procedure, demonstrating that the photocatalytic treatment needs prolonged irradiation times for leading to complete mineralization. Finally, the TPs generated during the procedure were identified by high-resolution mass spectrometry and their evolution profiles were given. Reutilization experiments proved that the 20% PEF/TiO2 have good stability and reusability. The present study provides some important new insights for the use of PEF/TiO2 materials as promising alternatives to powder TiO2 catalysts for the degradation of organic contaminants.

Supplementary Materials

The following are available online at https://0-www-mdpi-com.brum.beds.ac.uk/1420-3049/24/3/564/s1, Figure S1: Effect of drug concentration (C(PEF/TiO2 20 wt% = 600 mg L−1); (a) ACM; (b) IBU; (c) DCF.; Figure S2: The effect PEF/TiO2 20 wt% loading (C0(drug) = 5 mg L-1); (a) ACM; (b) IBU; (c) DCF; Figure S3: Effect of pH, during photocatalytic treatment (Co(drug) = 5 mg L−1, C((PEF/TiO2 20 wt%) = 600 mg L); (a) ACM; (b) IBU; (c) DCF.

Author Contributions

Methodology, A.K.; Validation, A.K., Z.T.; Investigation, A.K., Z.T., G.Z.K.; Writing-Original Draft Preparation, A.K., G.Z.K, D.N.B., D.A.L.; Writing-Review & Editing, A.K., G.Z.K, D.N.B., D.A.L.; Supervision, D.A.L.; Project Administration, D.A.L.

Funding

This research has been co-financed -via a programme of State Scholarships Foundation (IKY)- by the European Union (European Social Fund-ESF) and Greek national funds through the action entitled ”Strengthening Human Resources Research Potential via Doctorate Research” in the framework of the Operational Programme ”Human Resources Development Program, Education and Lifelong Learning” of the National Strategic Reference Framework (NSRF) 2014–2020.

Conflicts of Interest

The authors declare no conflict of interest.

References

  1. Nevárez-Martínez, M.C.; Kobylanski, M.P.; Mazierski, P.; Wółkiewicz, J.; Trykowski, G.; Malankowska, A.; Kozak, M.; Espinoza-Montero, P.J.; Zaleska-Medynska, A. Self-organized TiO2 nanotube arrays for efficient photocatalytic degradation of toluene. Molecules 2017, 22, 564. [Google Scholar] [CrossRef] [PubMed]
  2. Nevárez-Martínez, M.C.; Mazierski, P.; Kobylański, M.P.; Szczepańska, G.; Trykowski, G.; Malankowska, A.; Kozak, M.; Espinoza-Montero, P.J.; Zaleska-Medynska, A. Growth, structure, and photocatalytic properties of hierarchical V2O5-TiO2 nanotube arrays obtained from the one-step anodic oxidation of Ti-V alloys. Molecules 2017, 22, 580. [Google Scholar] [CrossRef] [PubMed]
  3. Pablos, C.; Marugán, J.; Van Grieken, R.; Dunlop, P.S.M.; Hamilton, J.W.J.; Dionysiou, D.D.; Byrne, J.A. Electrochemical enhancement of photocatalytic disinfection on aligned Ti and nitrogen doped TiO2 nanotubes. Molecules 2017, 22, 704. [Google Scholar] [CrossRef] [PubMed]
  4. Shuang, S.; Zhang, Z. The effect of annealing treatment and atom layer deposition to au/pt nanoparticles-decorated TiO2 nanorods as photocatalysts. Molecules 2018, 23, 525. [Google Scholar] [CrossRef] [PubMed]
  5. Cheng, Y.; Yang, H.; Yang, Y.; Huang, J.; Wu, K.; Chen, Z.; Wang, X.; Lin, C.; Lai, Y. Progress in TiO2 nanotube coatings for biomedical applications: A review. J. Mater. Chem. B 2018, 6, 1862–1886. [Google Scholar] [CrossRef]
  6. Wang, Q.; Huang, J.-Y.; Li, H.-Q.; Zhao, A.Z.-J.; Wang, Y.; Zhang, K.-Q.; Sun, H.-T.; Lai, Y.-K. Recent advances on smart TiO2 nanotube platforms for sustainable drug delivery applications. Int. J. Nanomed. 2017, 12, 151–165. [Google Scholar] [CrossRef] [PubMed]
  7. Wang, Q.; Huang, J.-Y.; Li, H.-Q.; Chen, Z.; Zhao, A.Z.-J.; Wang, Y.; Zhang, K.-Q.; Sun, H.-T.; Al-Deyab, S.S.; Lai, Y.-K. TiO2 nanotube platforms for smart drug delivery: A review. Int. J. Nanomed. 2016, 11, 4819–4834. [Google Scholar]
  8. Lai, Y.; Lin, L.; Pan, F.; Huang, J.; Song, R.; Huang, Y.; Lin, C.; Fuchs, H.; Chi, L. Bioinspired patterning with extreme wettability contrast on TiO2 nanotube array surface: A versatile platform for biomedical applications. Small 2013, 9, 2945–2953. [Google Scholar] [CrossRef]
  9. Han, H.; Bai, R. Highly effective buoyant photocatalyst prepared with a novel layered-TiO2 configuration on polypropylene fabric and the degradation performance for methyl orange dye under UV-Vis and vis lights. Sep. Purif. Technol. 2010, 73, 142–150. [Google Scholar] [CrossRef]
  10. Byrne, J.A.; Eggins, B.R.; Brown, N.M.D.; McKinney, B.; Rouse, M. Immobilisation of TiO2 powder for the treatment of polluted water. Appl. Catal. B Environ. 1998, 17, 25–36. [Google Scholar] [CrossRef]
  11. Sriwong, C.; Wongnawa, S.; Patarapaiboolchai, O. Photocatalytic activity of rubber sheet impregnated with TiO2 particles and its recyclability. Catal. Commun. 2008, 9, 213–218. [Google Scholar] [CrossRef]
  12. Anderson, M.A.; Gieselmann, M.J.; Xu, Q. Titania and alumina ceramic membranes. J. Membr. Sci. 1988, 39, 243–258. [Google Scholar] [CrossRef]
  13. Cruz, N.K.O.; Semblante, G.U.; Senoro, D.B.; You, S.-J.; Lu, S.-C. Dye degradation and antifouling properties of polyvinylidene fluoride/titanium oxide membrane prepared by sol-gel method. J. Taiwan Inst. Chem. Eng. 2014, 45, 192–201. [Google Scholar] [CrossRef]
  14. Sarasidis, V.; Patsios, S.; Karabelas, A. A hybrid photocatalysis–ultrafiltration continuous process: The case of polysaccharide degradation. Sep. Purif. Technol. 2011, 80, 73–80. [Google Scholar] [CrossRef]
  15. Song, H.; Shao, J.; He, Y.; Liu, B.; Zhong, X. Natural organic matter removal and flux decline with PEG–TiO2-doped pvdf membranes by integration of ultrafiltration with photocatalysis. J. Membr. Sci. 2012, 405, 48–56. [Google Scholar] [CrossRef]
  16. Zhang, X.; Wang, D.K.; Lopez, D.R.S.; da Costa, J.C.D. Fabrication of nanostructured TiO2 hollow fiber photocatalytic membrane and application for wastewater treatment. Chem. Eng. J. 2014, 236, 314–322. [Google Scholar] [CrossRef]
  17. Hir, Z.A.M.; Moradihamedani, P.; Abdullah, A.H.; Mohamed, M.A. Immobilization of TiO2 into polyethersulfone matrix as hybrid film photocatalyst for effective degradation of methyl orange dye. Mater. Sci. Semicond. Process. 2017, 57, 157–165. [Google Scholar] [CrossRef]
  18. Körstgens, V.; Pröller, S.; Buchmann, T.; Moseguí González, D.; Song, L.; Yao, Y.; Wang, W.; Werhahn, J.; Santoro, G.; Roth, S.V.; et al. Laser-ablated titania nanoparticles for aqueous processed hybrid solar cells. Nanoscale 2015, 7, 2900–2904. [Google Scholar] [CrossRef] [Green Version]
  19. Magalhães, F.; Moura, F.C.C.; Lago, R.M. TiO2/ldpe composites: A new floating photocatalyst for solar degradation of organic contaminants. Desalination 2011, 276, 266–271. [Google Scholar] [CrossRef]
  20. Shan, A.Y.; Ghazi, T.I.M.; Rashid, S.A. Immobilisation of titanium dioxide onto supporting materials in heterogeneous photocatalysis: A review. Appl. Catal. A Gen. 2010, 389, 1–8. [Google Scholar] [CrossRef]
  21. Singh, S.; Mahalingam, H.; Singh, P.K. Polymer-supported titanium dioxide photocatalysts for environmental remediation: A review. Appl. Catal. A Gen. 2013, 462–463, 178–195. [Google Scholar] [CrossRef]
  22. Papageorgiou, G.Z.; Papageorgiou, D.G.; Terzopoulou, Z.; Bikiaris, D.N. Production of bio-based 2,5-furan dicarboxylate polyesters: Recent progress and critical aspects in their synthesis and thermal properties. Eur. Polym. J. 2016, 83, 202–229. [Google Scholar] [CrossRef]
  23. Cho, H.J.; Jee, J.P.; Kang, J.Y.; Shin, D.Y.; Choi, H.G.; Maeng, H.J.; Cho, K.H. Cefdinir solid dispersion composed of hydrophilic polymers with enhanced solubility, dissolution, and bioavailability in rats. Molecules 2017, 22, 280. [Google Scholar] [CrossRef] [PubMed]
  24. Diwan, D.; Shinkai, K.; Tetsuka, T.; Cao, B.; Arai, H.; Koyama, T.; Hatano, K.; Matsuoka, K. Synthetic assembly of mannose moieties using Polym. Chem. and the biological evaluation of its interaction towards concanavalin a. Molecules 2017, 22, 157. [Google Scholar] [CrossRef] [PubMed]
  25. El-Taweel, S.H.; Al-Ahmadi, A.O.; Alhaddad, O.; Okasha, R.M. Cationic cyclopentadienyliron complex as a novel and successful nucleating agent on the crystallization behavior of the biodegradable phb polymer. Molecules 2018, 23, 2703. [Google Scholar] [CrossRef] [PubMed]
  26. Lei, M.; Wang, X. Biodegradable polymers and stem cells for bioprinting. Molecules 2016, 21, 539. [Google Scholar] [CrossRef]
  27. Montanari, E.; Di Meo, C.; Oates, A.; Coviello, T.; Matricardi, P. Pursuing intracellular pathogens with hyaluronan. From a ‘pro-infection’ polymer to a biomaterial for ‘trojan horse’ systems. Molecules 2018, 23, 939. [Google Scholar] [CrossRef]
  28. RǍdulescu, M.; Holban, A.M.; MogoantǍ, L.; BǍlşeanu, T.A.; Mogoşanu, G.D.; Savu, D.; Popescu, R.C.; FufǍ, O.; Grumezescu, A.M.; Bezirtzoglou, E.; et al. Fabrication, characterization, and evaluation of bionanocomposites based on natural polymers and antibiotics for wound healing applications. Molecules 2016, 21, 761. [Google Scholar] [CrossRef]
  29. Tong, X.; Ma, Y.; Li, Y. Biomass into chemicals: Conversion of sugars to furan derivatives by catalytic processes. Appl. Catal. A Gen. 2010, 385, 1–13. [Google Scholar] [CrossRef]
  30. Gandini, A. Furans as offspring of sugars and polysaccharides and progenitors of a family of remarkable polymers: A review of recent progress. Polym. Chem. 2010, 1, 245–251. [Google Scholar] [CrossRef]
  31. Eerhart, A.J.J.E.; Faaij, A.P.C.; Patel, M.K. Replacing fossil based pet with biobased pef; process analysis, energy and ghg balance. Energy Environ. Sci. 2012, 5, 6407–6422. [Google Scholar] [CrossRef]
  32. Langlet, M.; Kim, A.; Audier, M.; Herrmann, J. Sol-gel preparation of photocatalytic TiO2 films on polymer substrates. J. Sol-Gel Sci. Technol. 2002, 25, 223–234. [Google Scholar] [CrossRef]
  33. Desbiolles, F.; Malleret, L.; Tiliacos, C.; Wong-Wah-Chung, P.; Laffont-Schwob, I. Occurrence and ecotoxicological assessment of pharmaceuticals: Is there a risk for the mediterranean aquatic environment? Sci. Total Environ. 2018, 639, 1334–1348. [Google Scholar] [CrossRef] [PubMed]
  34. Fekadu, S.; Alemayehu, E.; Dewil, R.; Van der Bruggen, B. Pharmaceuticals in freshwater aquatic environments: A comparison of the african and european challenge. Sci. Total Environ. 2018. [Google Scholar] [CrossRef] [PubMed]
  35. McCance, W.; Jones, O.; Edwards, M.; Surapaneni, A.; Chadalavada, S.; Currell, M. Contaminants of emerging concern as novel groundwater tracers for delineating wastewater impacts in urban and peri-urban areas. Water Res. 2018. [Google Scholar] [CrossRef] [PubMed]
  36. Pullagurala, V.L.R.; Rawat, S.; Adisa, I.O.; Hernandez-Viezcas, J.A.; Peralta-Videa, J.R.; Gardea-Torresdey, J.L. Plant uptake and translocation of contaminants of emerging concern in soil. Sci. Total Environ. 2018, 636, 1585–1596. [Google Scholar] [CrossRef] [PubMed]
  37. Terzopoulou, Z.; Karakatsianopoulou, E.; Kasmi, N.; Majdoub, M.; Papageorgiou, G.Z.; Bikiaris, D.N. Effect of catalyst type on recyclability and decomposition mechanism of poly(ethylene furanoate) biobased polyester. J. Anal. Appl. Pyrolysis 2017, 126, 357–370. [Google Scholar] [CrossRef]
  38. Achilias, D.S.; Chondroyiannis, A.; Nerantzaki, M.; Adam, K.-V.; Terzopoulou, Z.; Papageorgiou, G.Z.; Bikiaris, D.N. Solid state polymerization of poly(ethylene furanoate) and its nanocomposites with SiO2 and TiO2. Macromol. Mater. Eng. 2017, 302, 1700012. [Google Scholar] [CrossRef]
  39. Bikiaris, D.N.; Terzopoulou, Z.; Karakatsianopoulou, E.; Tsanaktsis, V.; Kasmi, N.; Nikolaidis, N.; Kostoglou, M.; Papageorgiou, G.Z.; Lambropoulou, D.A. Effect of catalyst type on molecular weight increase and coloration of poly(ethylene furanoate) biobased polyester during melt polycondensation. Polym. Chem. 2017, 8, 6895–6908. [Google Scholar]
  40. Tsanaktsis, V.; Papageorgiou, D.G.; Exarhopoulos, S.; Bikiaris, D.N.; Papageorgiou, G.Z. Crystallization and polymorphism of poly (ethylene furanoate). Cryst. Growth Des. 2015, 15, 5505–5512. [Google Scholar] [CrossRef]
  41. Khan, S.; Cho, H.; Kim, D.; Han, S.S.; Lee, K.H.; Cho, S.-H.; Song, T.; Choi, H. Defect engineering toward strong photocatalysis of nb-doped anatase TiO2: Computational predictions and experimental verifications. Appl. Catal. B Environ. 2017, 206, 520–530. [Google Scholar] [CrossRef]
  42. Buser, H.-R.; Poiger, T.; Müller, M.D. Occurrence and environmental behavior of the chiral pharmaceutical drug ibuprofen in surface waters and in wastewater. Environ. Sci. Technol. 1999, 33, 2529–2535. [Google Scholar] [CrossRef]
  43. Ziylan, A.; Ince, N.H. The occurrence and fate of anti-inflammatory and analgesic pharmaceuticals in sewage and fresh water: Treatability by conventional and non-conventional processes. J. Hazard. Mater. 2011, 187, 24–36. [Google Scholar] [CrossRef] [PubMed]
  44. Ikehata, K.; Jodeiri Naghashkar, N.; Gamal El-Din, M. Degradation of aqueous pharmaceuticals by ozonation and advanced oxidation processes: A review. Ozone Sci. Eng. 2006, 28, 353–414. [Google Scholar] [CrossRef]
  45. Do, Q.C.; Kim, D.-G.; Ko, S.-O. Catalytic activity enhancement of a Fe3O4@SiO2 yolk-shell structure for oxidative degradation of acetaminophen by decoration with copper. J. Clean. Prod. 2018, 172, 1243–1253. [Google Scholar] [CrossRef]
  46. Chen, P.; Zhang, Q.; Su, Y.; Shen, L.; Wang, F.; Liu, H.; Liu, Y.; Cai, Z.; Lv, W.; Liu, G. Accelerated photocatalytic degradation of diclofenac by a novel cqds/biocooh hybrid material under visible-light irradiation: Dechloridation, detoxicity, and a new superoxide radical model study. Chem. Eng. J. 2018, 332, 737–748. [Google Scholar] [CrossRef]
  47. Wang, Y.; Liu, H.; Liu, G.; Xie, Y.; Gao, S. Oxidation of diclofenac by potassium ferrate (VI): Reaction kinetics and toxicity evaluation. Sci. Total Environ. 2015, 506, 252–258. [Google Scholar] [CrossRef] [PubMed]
  48. Modirshahla, N.; Behnajady, M.A.; Ghanbary, F. Decolorization and mineralization of C.I. Acid yellow 23 by fenton and photo-fenton processes. Dyes Pigment. 2007, 73, 305–310. [Google Scholar] [CrossRef]
  49. Lucas, M.S.; Peres, J.A. Decolorization of the azo dye reactive black 5 by fenton and photo-fenton oxidation. Dyes Pigment. 2006, 71, 236–244. [Google Scholar] [CrossRef]
  50. Tamimi, M.; Qourzal, S.; Barka, N.; Assabbane, A.; Ait-Ichou, Y. Methomyl degradation in aqueous solutions by fenton’s reagent and the photo-fenton system. Sep. Purif. Technol. 2008, 61, 103–108. [Google Scholar] [CrossRef]
  51. Tizaoui, C.; Mezughi, K.; Bickley, R. Heterogeneous photocatalytic removal of the herbicide clopyralid and its comparison with uv/h2o2 and ozone oxidation techniques. Desalination 2011, 273, 197–204. [Google Scholar] [CrossRef]
  52. Hamad, H.A.; Sadik, W.A.; Abd El-latif, M.M.; Kashyout, A.B.; Feteha, M.Y. Photocatalytic parameters and kinetic study for degradation of dichlorophenol-indophenol (dcpip) dye using highly active mesoporous tio2 nanoparticles. J. Environ. Sci. 2016, 43, 26–39. [Google Scholar] [CrossRef] [PubMed]
  53. Kormann, C.; Bahnemann, D.W.; Hoffmann, M.R. Photolysis of chloroform and other organic molecules in aqueous titanium dioxide suspensions. Environ. Sci. Technol. 1991, 25, 494–500. [Google Scholar] [CrossRef]
  54. 5Moon, Y.-E.; Jung, G.; Yun, J.; Kim, H.-I. Poly(vinyl alcohol)/poly(acrylic acid)/TiO2/graphene oxide nanocomposite hydrogels for ph-sensitive photocatalytic degradation of organic pollutants. Mater. Sci. Eng. B 2013, 178, 1097–1103. [Google Scholar]
  55. Konstantinou, I.K.; Albanis, T.A. TiO2-assisted photocatalytic degradation of azo dyes in aqueous solution: Kinetic and mechanistic investigations. Appl. Catal. B Environ. 2004, 49, 1–14. [Google Scholar] [CrossRef]
  56. Malakootian, M.; Pourshaban-Mazandarani, M.; Hossaini, H.; Ehrampoush, M.H. Preparation and characterization of TiO2 incorporated 13x molecular sieves for photocatalytic removal of acetaminophen from aqueous solutions. Process Saf. Environ. Prot. 2016, 104, 334–345. [Google Scholar] [CrossRef]
  57. Guedidi, H.; Reinert, L.; Lévêque, J.-M.; Soneda, Y.; Bellakhal, N.; Duclaux, L. The effects of the surface oxidation of activated carbon, the solution ph and the temperature on adsorption of ibuprofen. Carbon 2013, 54, 432–443. [Google Scholar] [CrossRef]
  58. Sun, Q.; Peng, Y.-P.; Chen, H.; Chang, K.-L.; Qiu, Y.-N.; Lai, S.-W. Photoelectrochemical oxidation of ibuprofen via Cu2O-doped TiO2 nanotube arrays. J. Hazard. Mater. 2016, 319, 121–129. [Google Scholar] [CrossRef]
  59. Zhang, H.; Zhang, P.; Ji, Y.; Tian, J.; Du, Z. Photocatalytic degradation of four non-steroidal anti-inflammatory drugs in water under visible light by P25-TiO2/tetraethyl orthosilicate film and determination via ultra performance liquid chromatography electrospray tandem mass spectrometry. Chem. Eng. J. 2015, 262, 1108–1115. [Google Scholar] [CrossRef]
  60. Méndez-Arriaga, F.; Esplugas, S.; Giménez, J. Photocatalytic degradation of non-steroidal anti-inflammatory drugs with TiO2 and simulated solar irradiation. Water Res. 2008, 42, 585–594. [Google Scholar] [CrossRef]
  61. Madhavan, J.; Grieser, F.; Ashokkumar, M. Combined advanced oxidation processes for the synergistic degradation of ibuprofen in aqueous environments. J. Hazard. Mater. 2010, 178, 202–208. [Google Scholar] [CrossRef] [PubMed]
  62. Caviglioli, G.; Valeria, P.; Brunella, P.; Sergio, C.; Attilia, A.; Gaetano, B. Identification of degradation products of ibuprofen arising from oxidative and thermal treatments. J. Pharm. Biomed. Anal. 2002, 30, 499–509. [Google Scholar] [CrossRef]
  63. Quintana, J.B.; Weiss, S.; Reemtsma, T. Pathways and metabolites of microbial degradation of selected acidic pharmaceutical and their occurrence in municipal wastewater treated by a membrane bioreactor. Water Res. 2005, 39, 2654–2664. [Google Scholar] [CrossRef] [PubMed]
  64. Winkler, M.; Lawrence, J.R.; Neu, T.R. Selective degradation of ibuprofen and clofibric acid in two model river biofilm systems. Water Res. 2001, 35, 3197–3205. [Google Scholar] [CrossRef]
  65. Marco-Urrea, E.; Pérez-Trujillo, M.; Vicent, T.; Caminal, G. Ability of white-rot fungi to remove selected pharmaceuticals and identification of degradation products of ibuprofen by trametes versicolor. Chemosphere 2009, 74, 765–772. [Google Scholar] [CrossRef] [PubMed]
  66. Michael, I.; Achilleos, A.; Lambropoulou, D.; Torrens, V.O.; Pérez, S.; Petrović, M.; Barceló, D.; Fatta-Kassinos, D. Proposed transformation pathway and evolution profile of diclofenac and ibuprofen transformation products during (sono)photocatalysis. Appl. Catal. B Environ. 2014, 147, 1015–1027. [Google Scholar] [CrossRef]
  67. Calza, P.; Sakkas, V.A.; Medana, C.; Baiocchi, C.; Dimou, A.; Pelizzetti, E.; Albanis, T. Photocatalytic degradation study of diclofenac over aqueous TiO2 suspensions. Appl. Catal. B Environ. 2006, 67, 197–205. [Google Scholar] [CrossRef]
  68. Hamdi El Najjar, N.; Touffet, A.; Deborde, M.; Journel, R.; Karpel Vel Leitner, N. Kinetics of paracetamol oxidation by ozone and hydroxyl radicals, formation of transformation products and toxicity. Sep. Purif. Technol. 2014, 136, 137–143. [Google Scholar] [CrossRef]
  69. Jallouli, N.; Elghniji, K.; Trabelsi, H.; Ksibi, M. Photocatalytic degradation of paracetamol on TiO2 nanoparticles and TiO2/cellulosic fiber under UV and sunlight irradiation. Arab. J. Chem. 2017, 10, S3640–S3645. [Google Scholar] [CrossRef]
  70. Papageorgiou, G.Z.; Tsanaktsis, V.; Bikiaris, D.N. Synthesis of poly (ethylene furandicarboxylate) polyester using monomers derived from renewable resources: Thermal behavior comparison with pet and pen. Phys. Chem. Chem. Phys. 2014, 16, 7946–7958. [Google Scholar]
Scheme 1. Synthesis of PEF with the two-step polycondensation reaction.
Molecules 24 00564 sch001
Figure 1. SEM micrographs and Ti mapping of (a) PEF/TiO2 5%, (b) PEF/TiO2 10%, (c) PEF/TiO2 15%, and (d) PEF/TiO2 20%.
Molecules 24 00564 g001
Figure 2. X-ray diffraction patterns of PEF and its nanocomposites with TiO2.
Molecules 24 00564 g002
Figure 3. FTIR spectra of PEF and its nanocomposites with TiO2.
Molecules 24 00564 g003
Figure 4. (a) DSC thermograms and (b) TGA thermograms of PEF and its nanocomposites with TiO2.
Molecules 24 00564 g004
Figure 5. Effect of TiO2 amount immobilization at the efficiency of the anti-inflammatory drug mixture degradation under SSL, (a) ACM; (b) IBU; (c) DCF; (d) variation of degradation kinetic rate (k) versus TiO2 % content, (Co(drug) = 5 mg L−1); and (C(catalyst) = 600 mg L−1).
Molecules 24 00564 g005
Figure 6. The effect of operational parameters on degradation kinetic rate (k) of anti-inflammatory drug mixture, (a) effect of mixture concentration (C(PEF/TiO2 20 wt% = 600 mg L−1); (b) effect of catalyst loading (Co(drug) = 5 mg L−1); and (c) effect of pH, during photocatalytic treatment (Co(drug) = 5 mg L−1, C((PEF/TiO2 20wt %) = 600 mg L−1).
Molecules 24 00564 g006aMolecules 24 00564 g006b
Figure 7. The effect of operational parameters on degradation kinetic rate (k) of anti-inflammatory drug mixture, (a) effect of mixture concentration (C(PEF/TiO2 20 wt% = 600 mg L−1); (b) effect of catalyst loading (Co(drug) = 5 mg L−1); and (c) effect of pH, during photocatalytic treatment (Co(drug) = 5 mg L−1, C((PEF/TiO2 20 wt%) = 600 mg L−1).
Molecules 24 00564 g007
Figure 8. TPs products generated from IBU by PEF/TiO2 20 wt% under SSL.
Molecules 24 00564 g008
Figure 9. Evolution profiles of TPs generated from IBU by PEF/TiO2 20 wt% under SSL, C0(drug) = 5 mg L−1, and C(PEF/TiO2 20 wt%) = 600 mg L−1.
Molecules 24 00564 g009
Figure 10. TPs products generated from DCF by PEF/TiO2 20 wt% under SSL.
Molecules 24 00564 g010
Figure 11. Evolution profiles of TPs generated from DCF by PEF/TiO2 20 wt% under SSL, C0(drug) = 5 mg L−1, and C(PEF/TiO2 20 wt%) = 600 mg L−1.
Molecules 24 00564 g011
Figure 12. TPs products generated from ACM by PEF/TiO2 20 wt% under SSL.
Molecules 24 00564 g012
Figure 13. Evolution profiles of TPs generated from ACM by PEF/TiO2 20 wt% under SSL.
Molecules 24 00564 g013
Table 1. DSC data (ΔH0m = 137 J/g [42]), Ti (initiation of degradation temperature), Tmax (temperature where degradation occurs on the fastest rate) and solid residue of PEF and its nanocomposites with TiO2.
SampleTm (oC)Tg (oC)ΔHm (J/g)Xc (%)Ti (oC)Tmax (oC)Residue at 550 °C (%)
PEF213.888.046.1733.70390.3416.27.0
PEF/TiO2 5%213.888.345.9133.51385.0424.814.6
PEF/TiO2 10%211.488.444.9832.83384.7426.717.8
PEF/TiO2 15%211.389.138.6328.20397.0426.028.5
PEF/TiO2 20%211.590.230.2122.05406.2433.331.2
Table 2. High resolution mass spectra data for IBU, DCF, and ACM and their identified TPs derived from mass spectrometric analysis.
tR
(min)
Code NamePseudo-Molecular Ion FormulaTheoretical
m/z [m − H]
Experimental
m/z [m − H]
RDBEΔ
(ppm)
14.41IBUC13 H17 O2205.1229205.12335.54.844
12.56I-TP1C13 H17 O3221.1178221.11835.54.880
12.50I-TP2C12 H15 O2191.1072191.10785.55.985
12.02I-TP3C12 H15 O175.1123175.11295.56.615
9.45I-TP4C9 H9 O133.0653133.06605.59.082
8.87I-TP5C9 H9 O2149.0603149.06105.58.681
tR
(min)
Code NamePseudo-Molecular Ion FormulaTheoretical
m/z [m + H]+
Experimental
m/z [m + H]+
RDBEΔ
(ppm)
14.26DCFC14H12Cl2NO2296.0245296.02338.5−2.231
12.38D-TP1aC14 H12 O3 N Cl2311.0116312.01808.5−2.805
12.96D-TP1bC14 H12 O3 N Cl2311.0116312.01808.5−2.805
8.81D-TP2C6 H6 O N Cl2177.9825177.98123.5−5.033
16.84D-TP3C14H10O3NCl2310.0038310.00269.5−2.016
6.15D-TP4C14H12O4 NCl2328.0138328.01328.5−1.798
15.96D-TP5C14H10O2NCl2294.0089294.00729.5−3.777
11.98D-TP6C13H10ONCl2266.0167266.01238.5−4.120
14.02D-TP7C13H10O2NCl2282.0062282.00748.5−3.229
12.70D-TP8C13H8Cl2NO2280.0013280.005590.941
5.18ACMC8 H10 O2 N152.0712152.06964.5−6.609
4.48A-TP1aC8 H10 O3 N168.0661168.06474.5−4.877
4.70A-TP1bC8 H10 O3 N168.0661168.06474.5−4.877
3.30A-TP2aC8 H10 O4 N184.0610184.05984.5−3.446
3.80A-TP2bC8 H10 O4 N184.0610184.05984.5−3.446
3.98A-TP2cC8 H10 O4 N184.0610184.05984.5−3.446
4.65A-TP2dC8 H10 O4 N184.0610184.05984.5−3.446

