Study on Hypoglycemic Effect of the Drug Pair of Astragalus Radix and Dioscoreae Rhizoma in T2DM Rats by Network Pharmacology and Metabonomics

Abstract
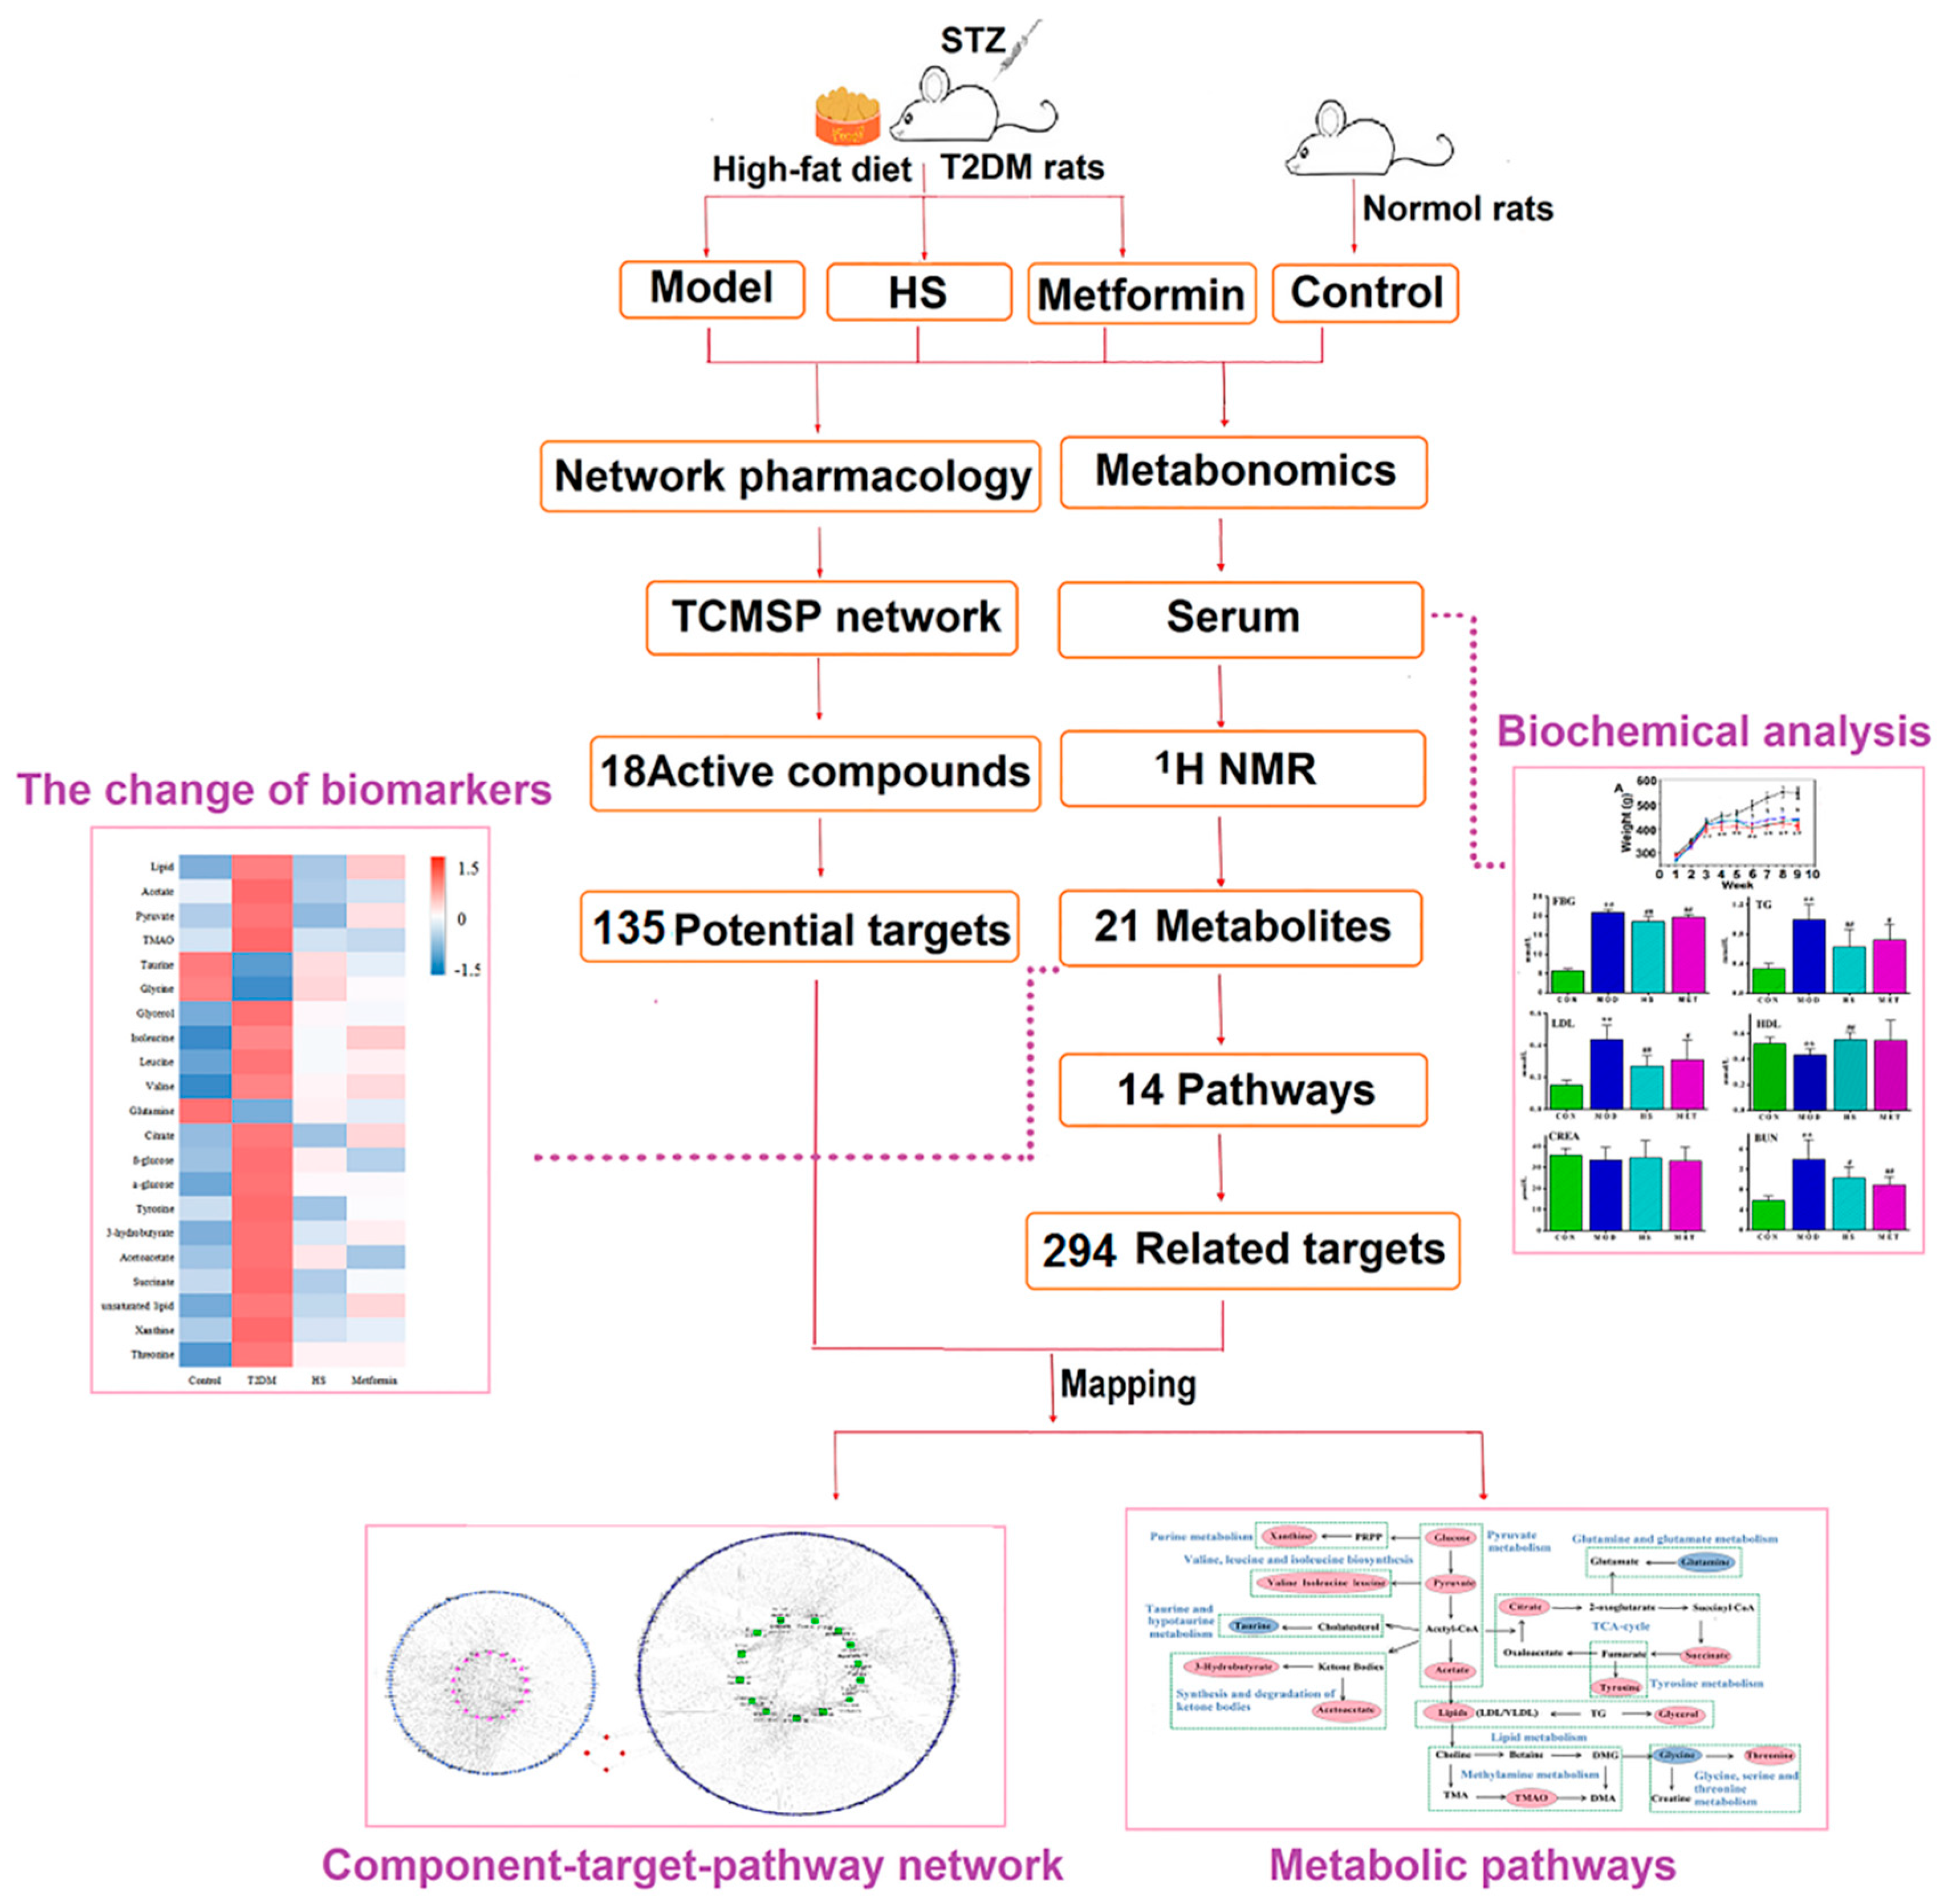
:1. Introduction
2. Results
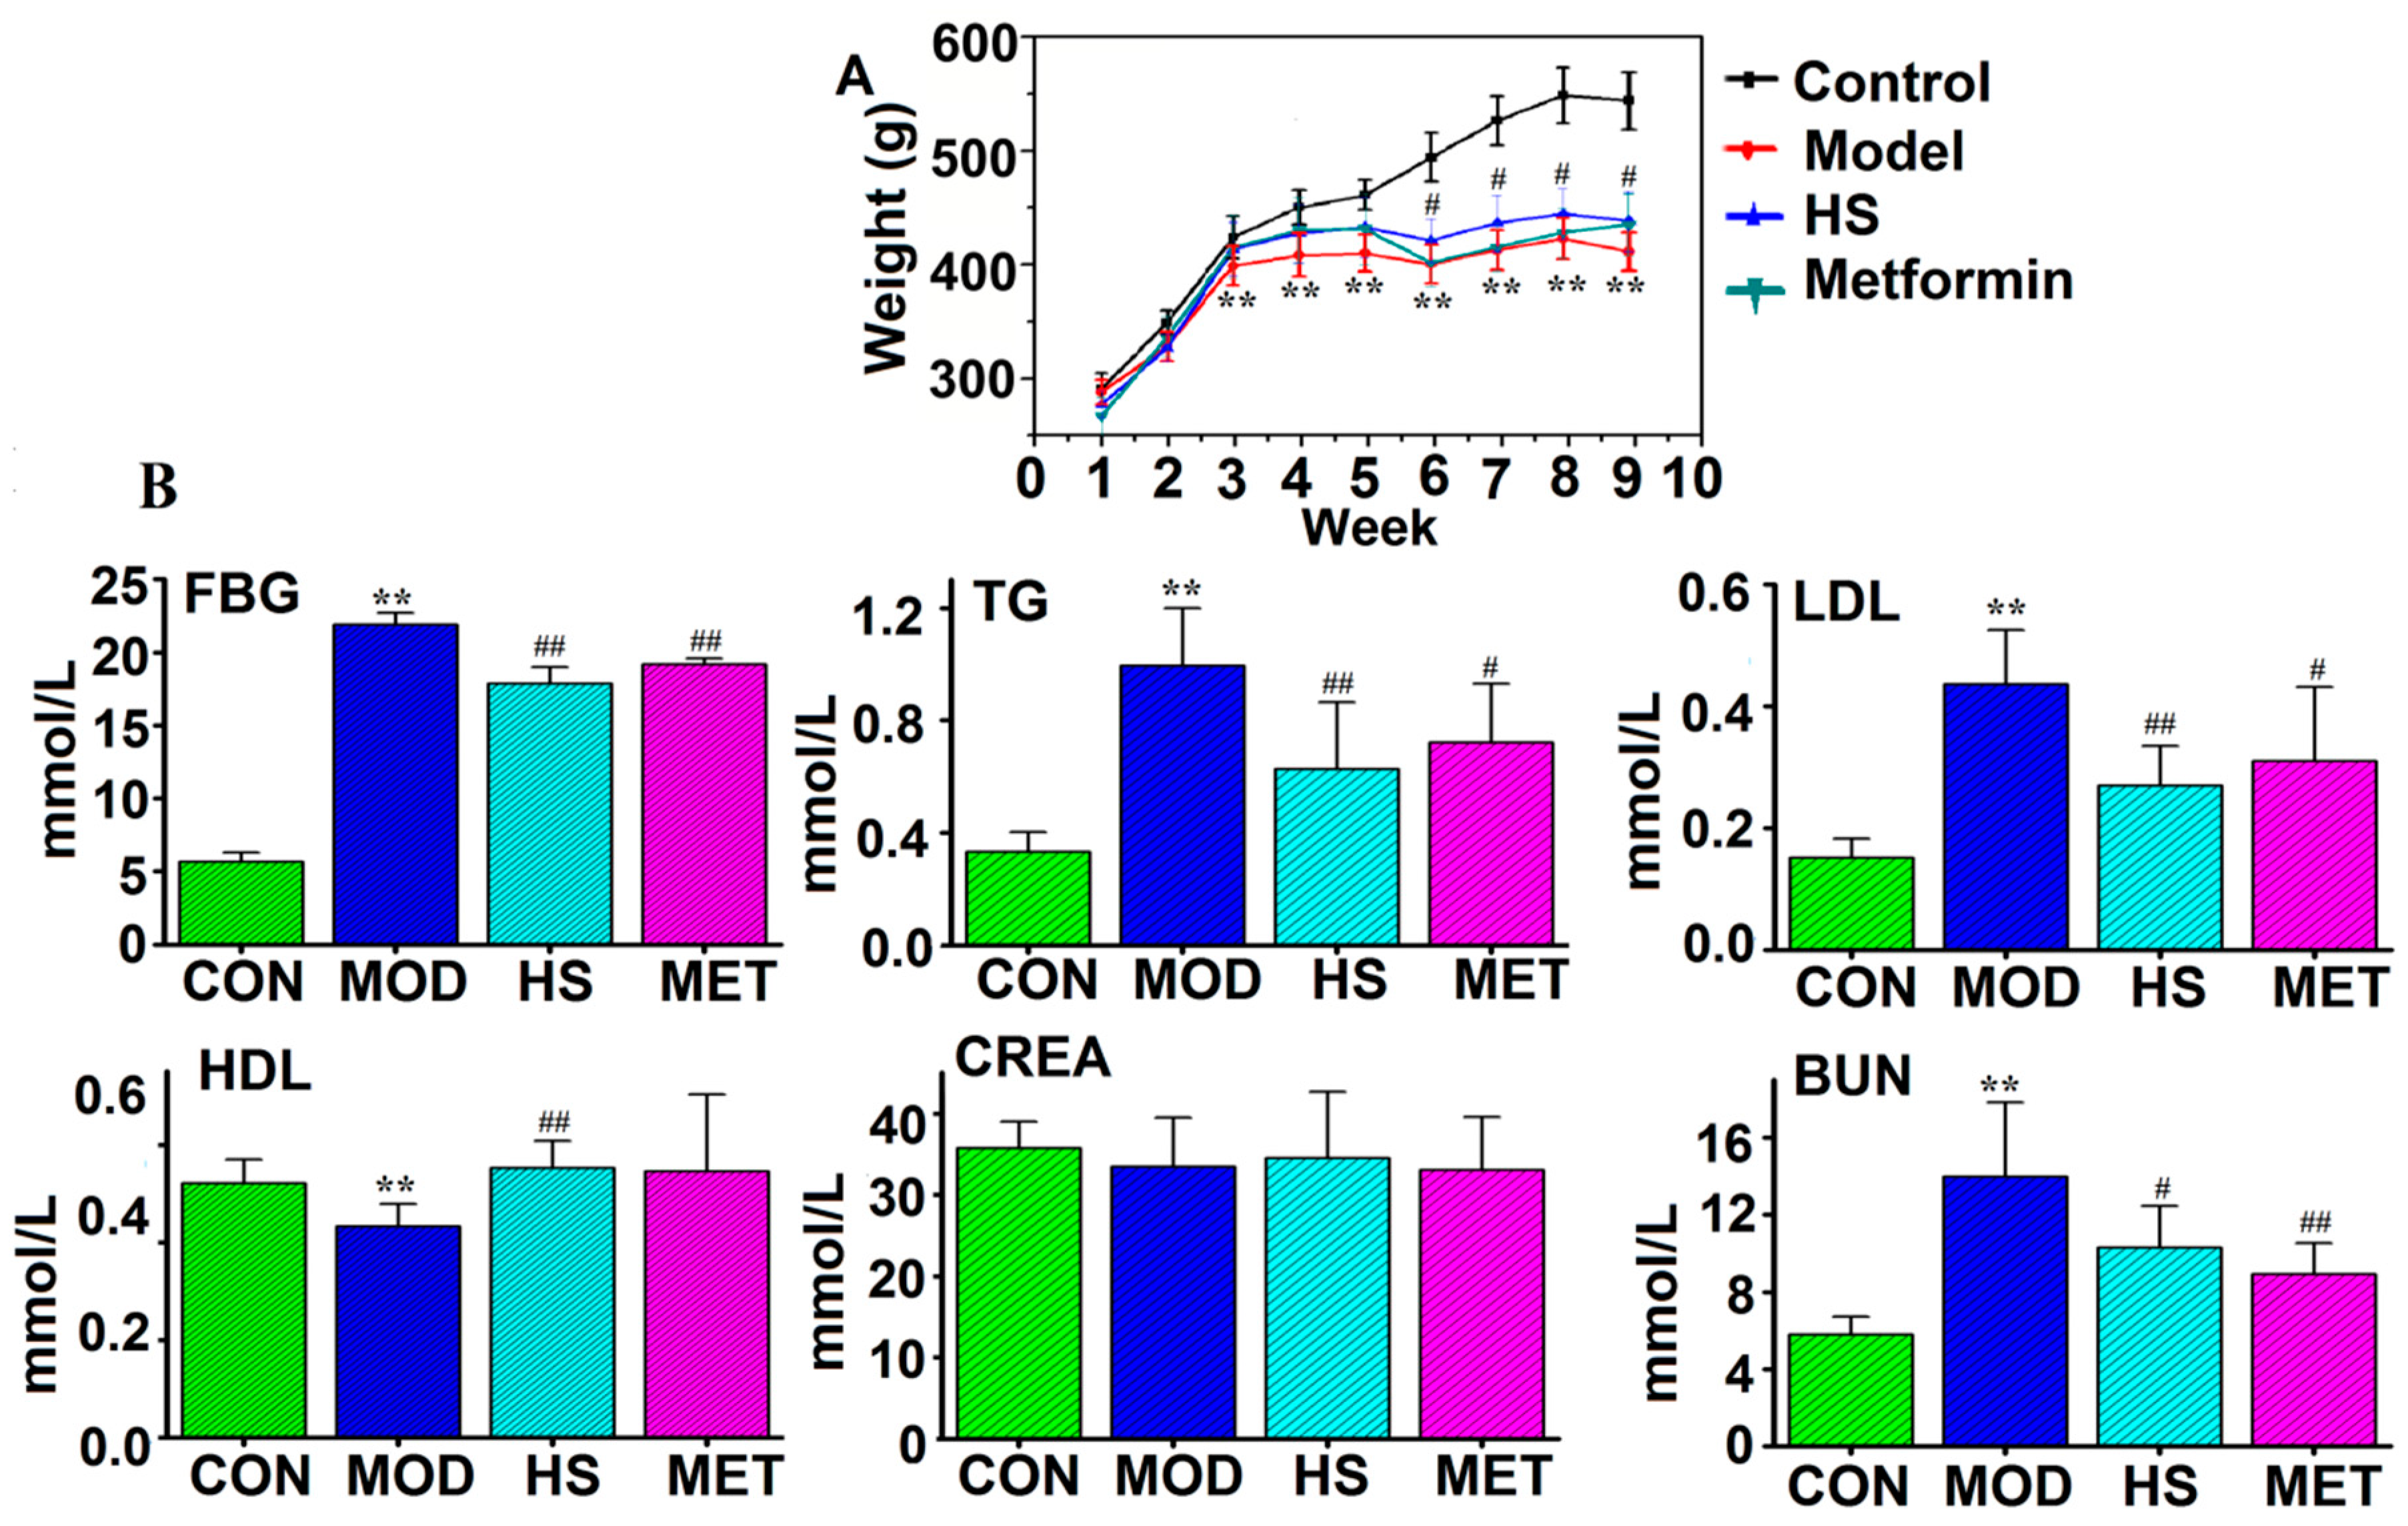
2.1. FBG, Biochemical Parameters, and Histopathological Observations
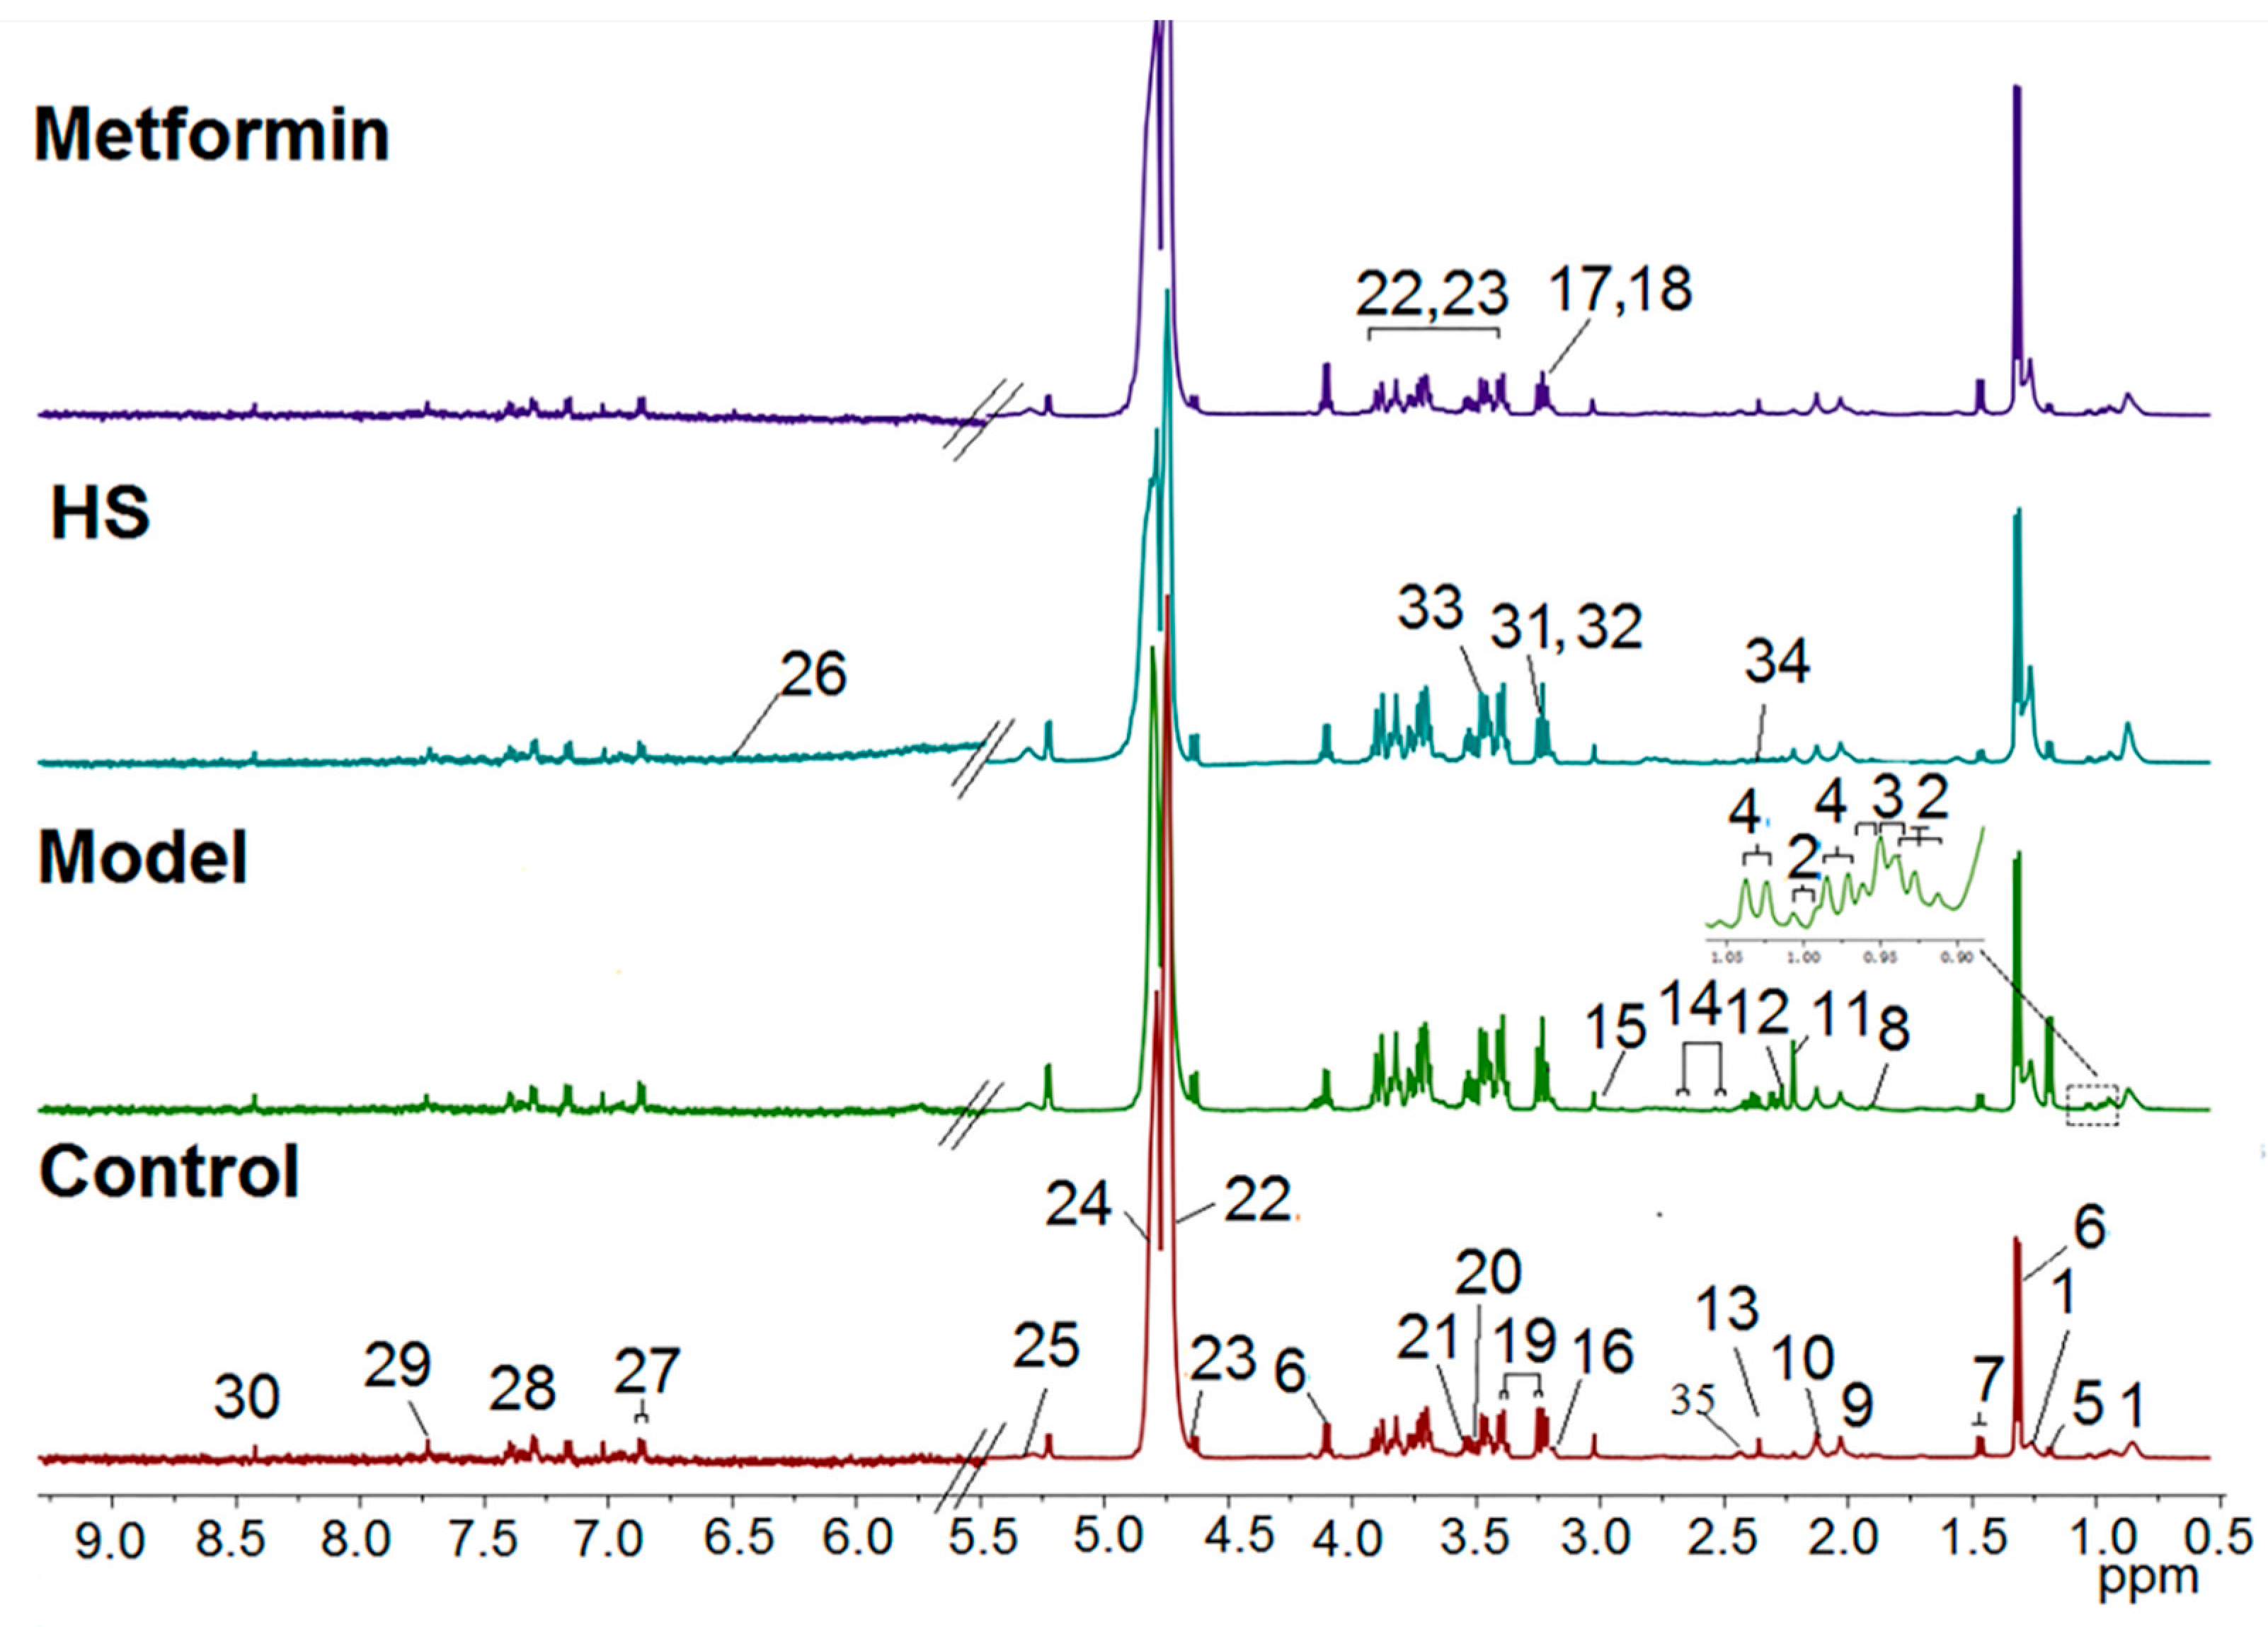
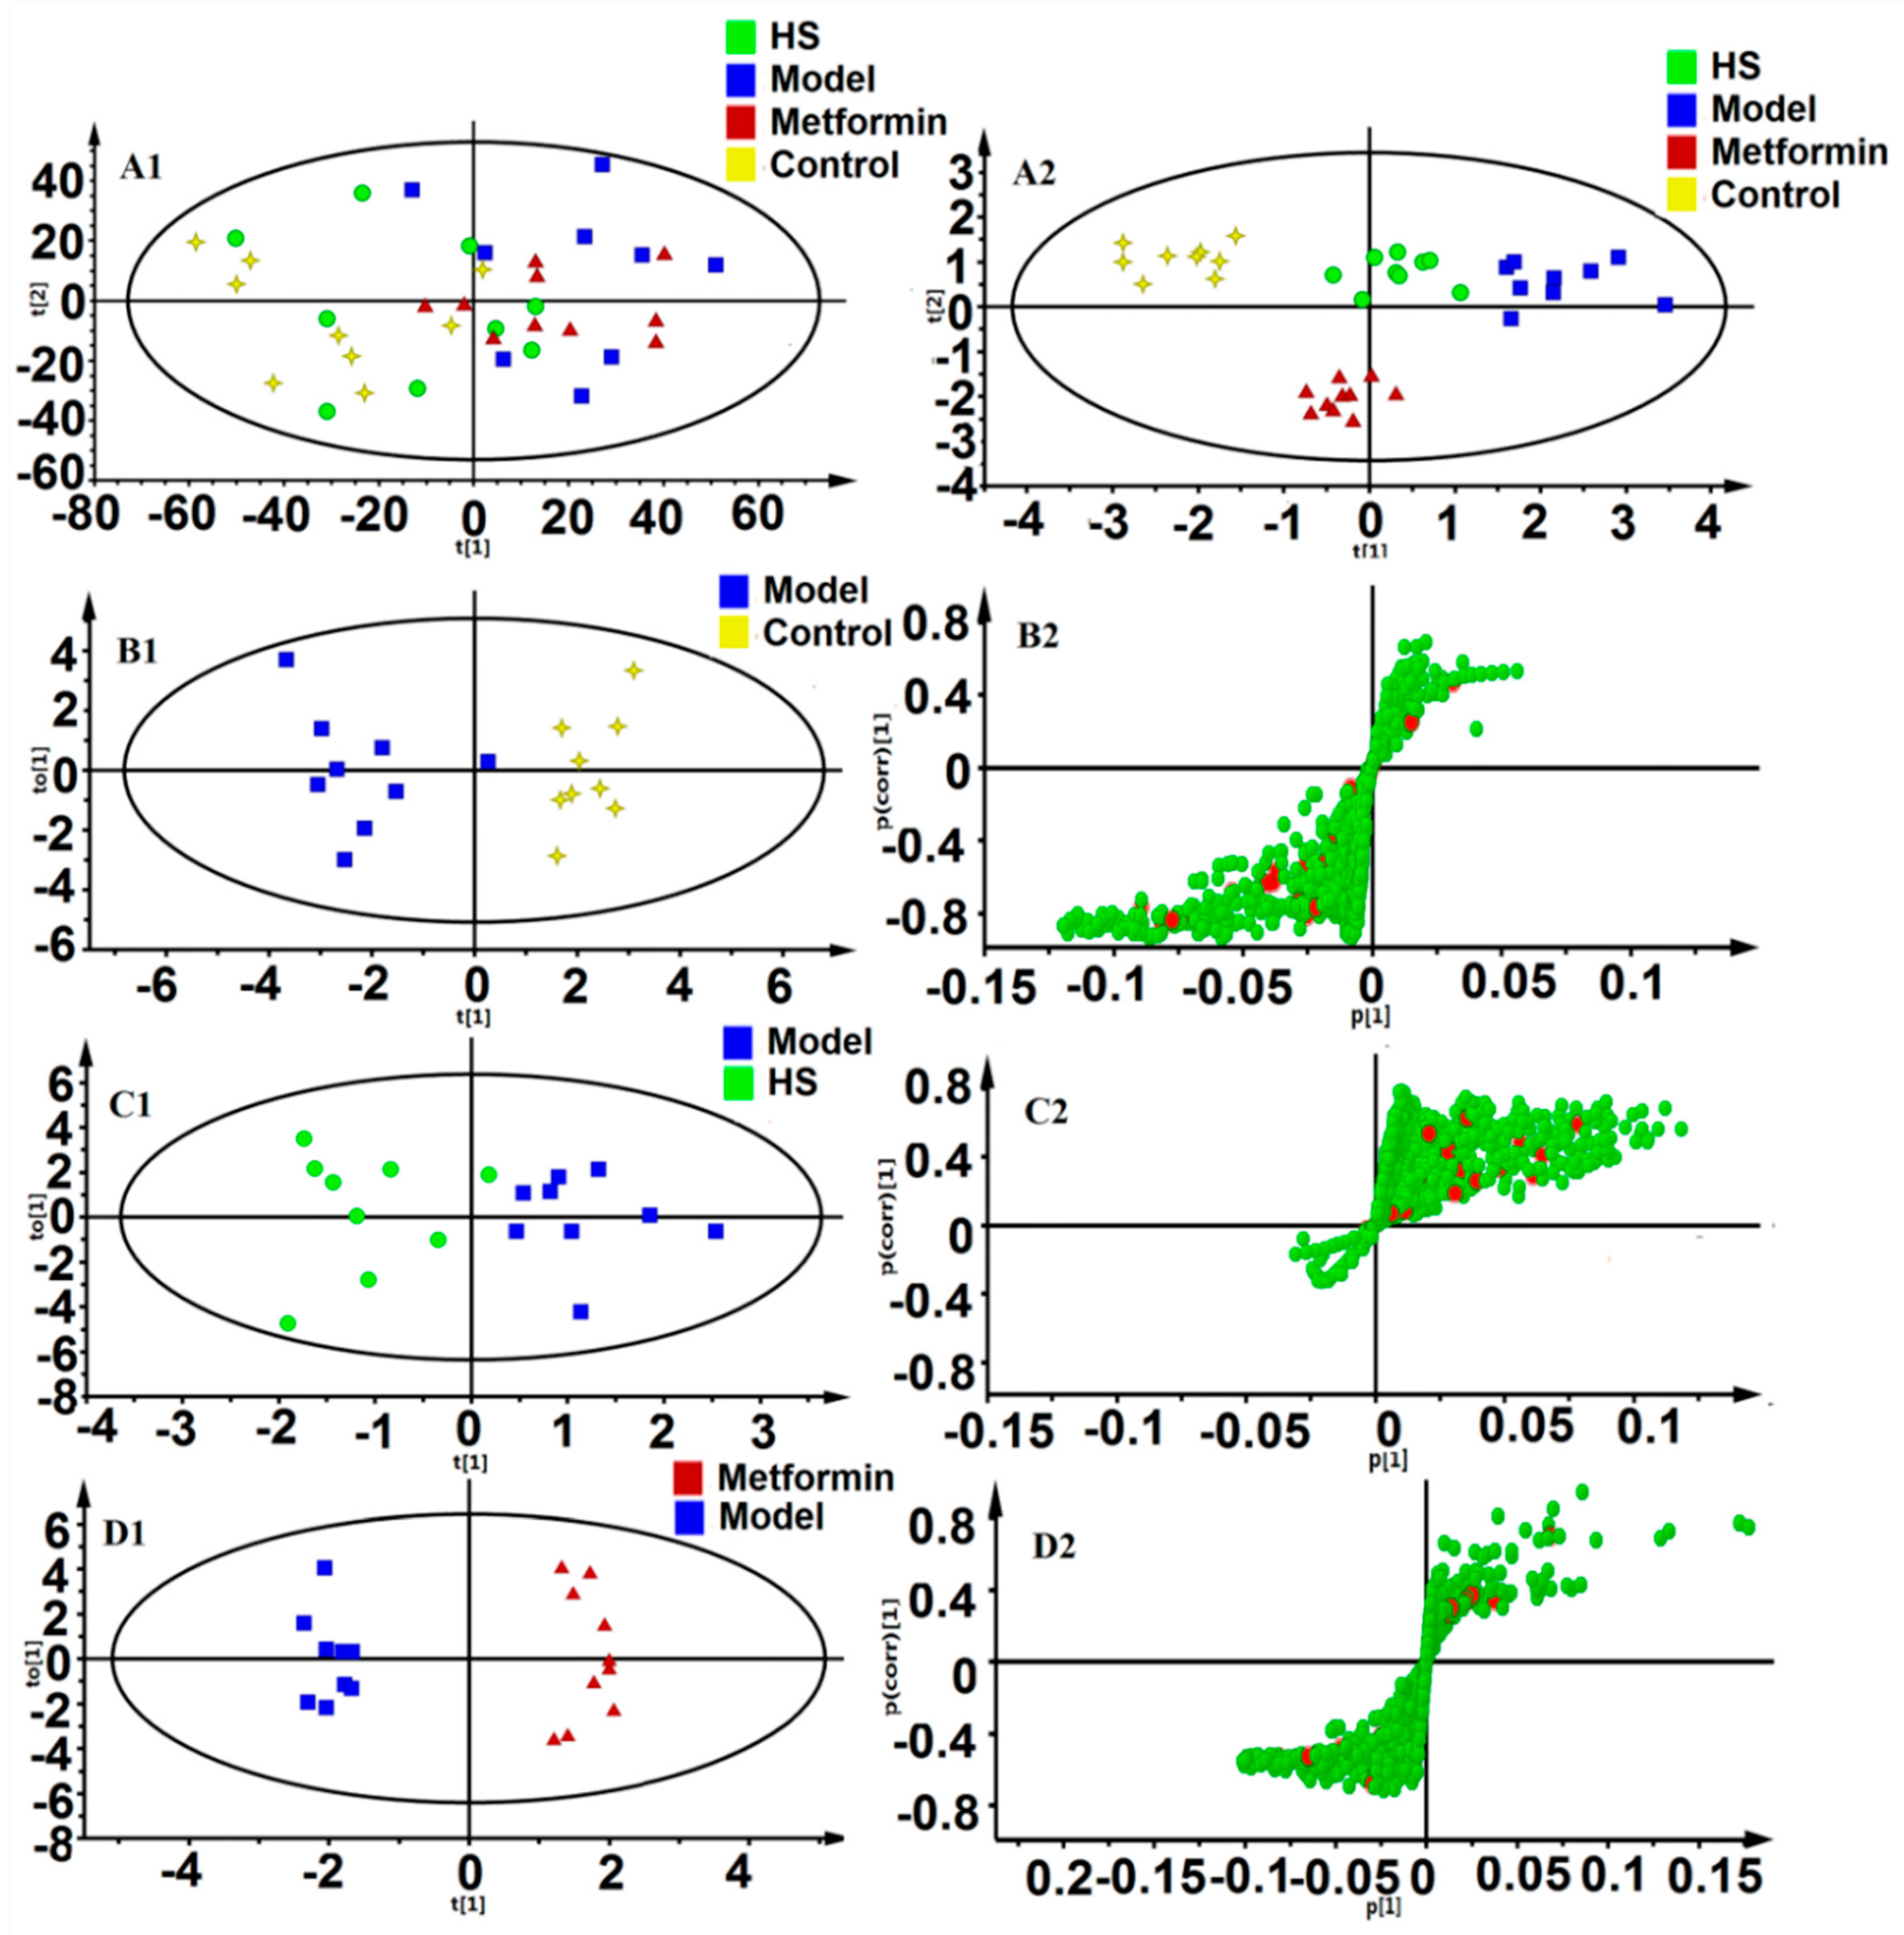
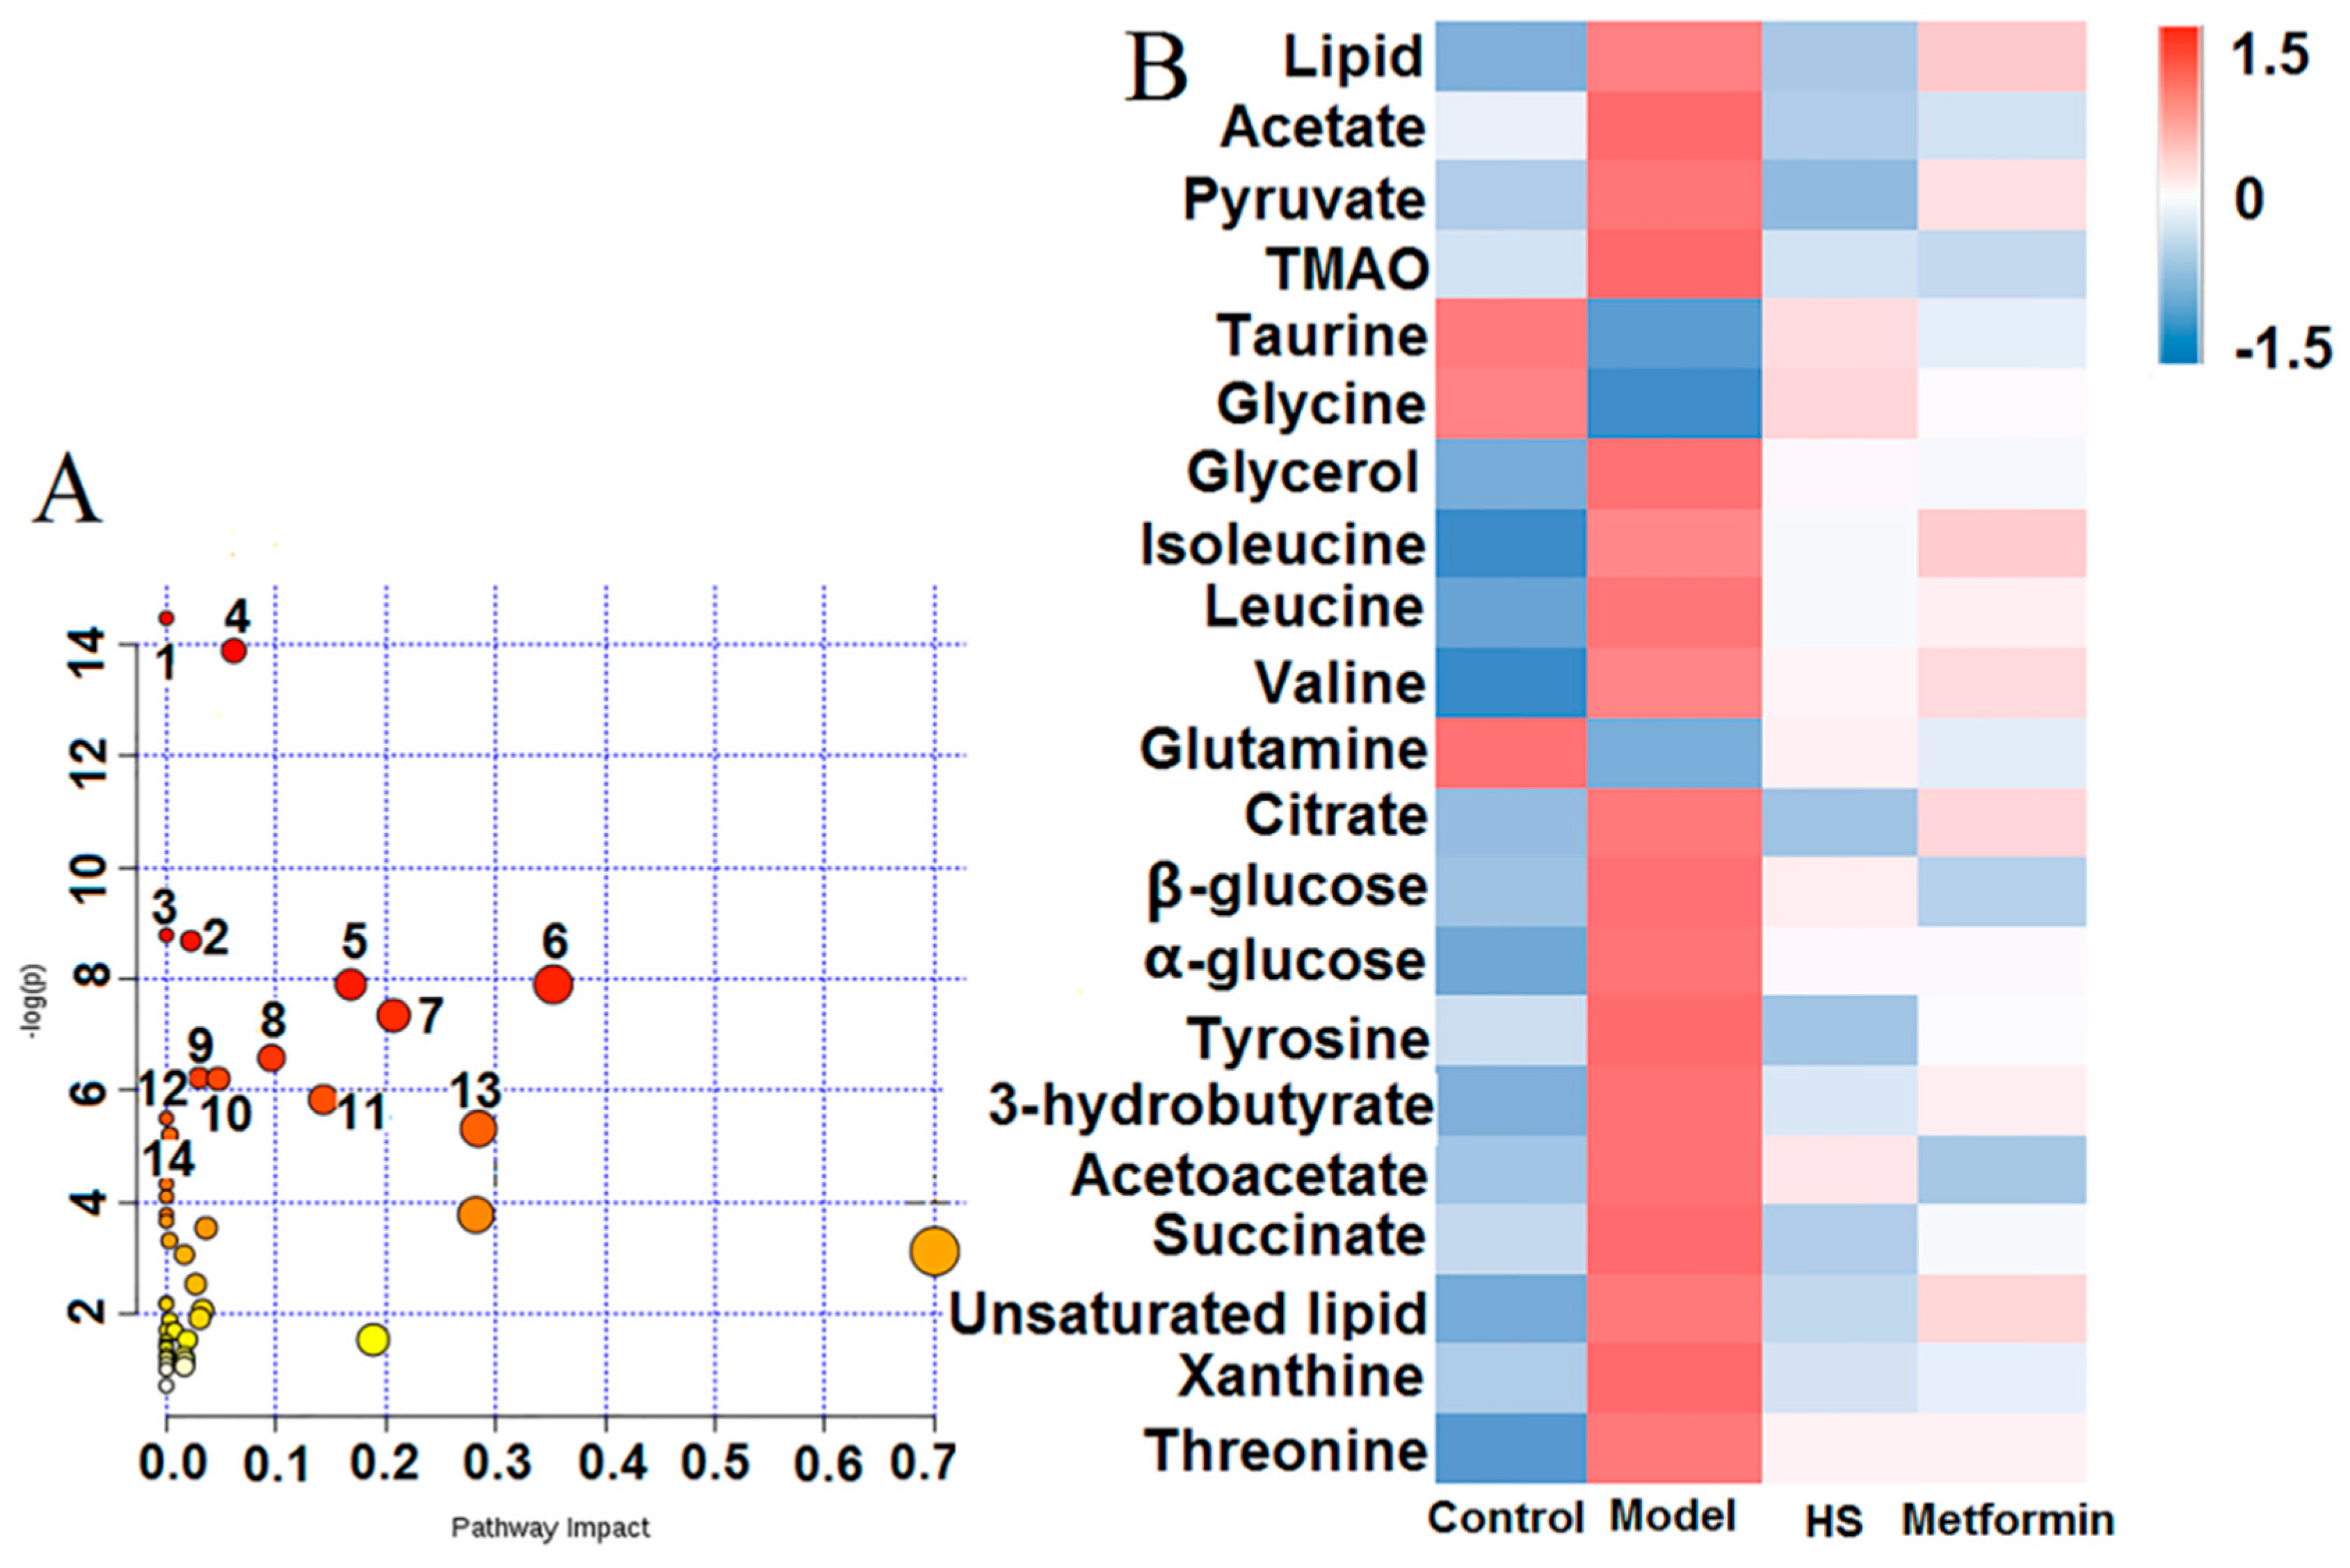
2.2. Pattern Recognition Analysis and Identification of Biomarker
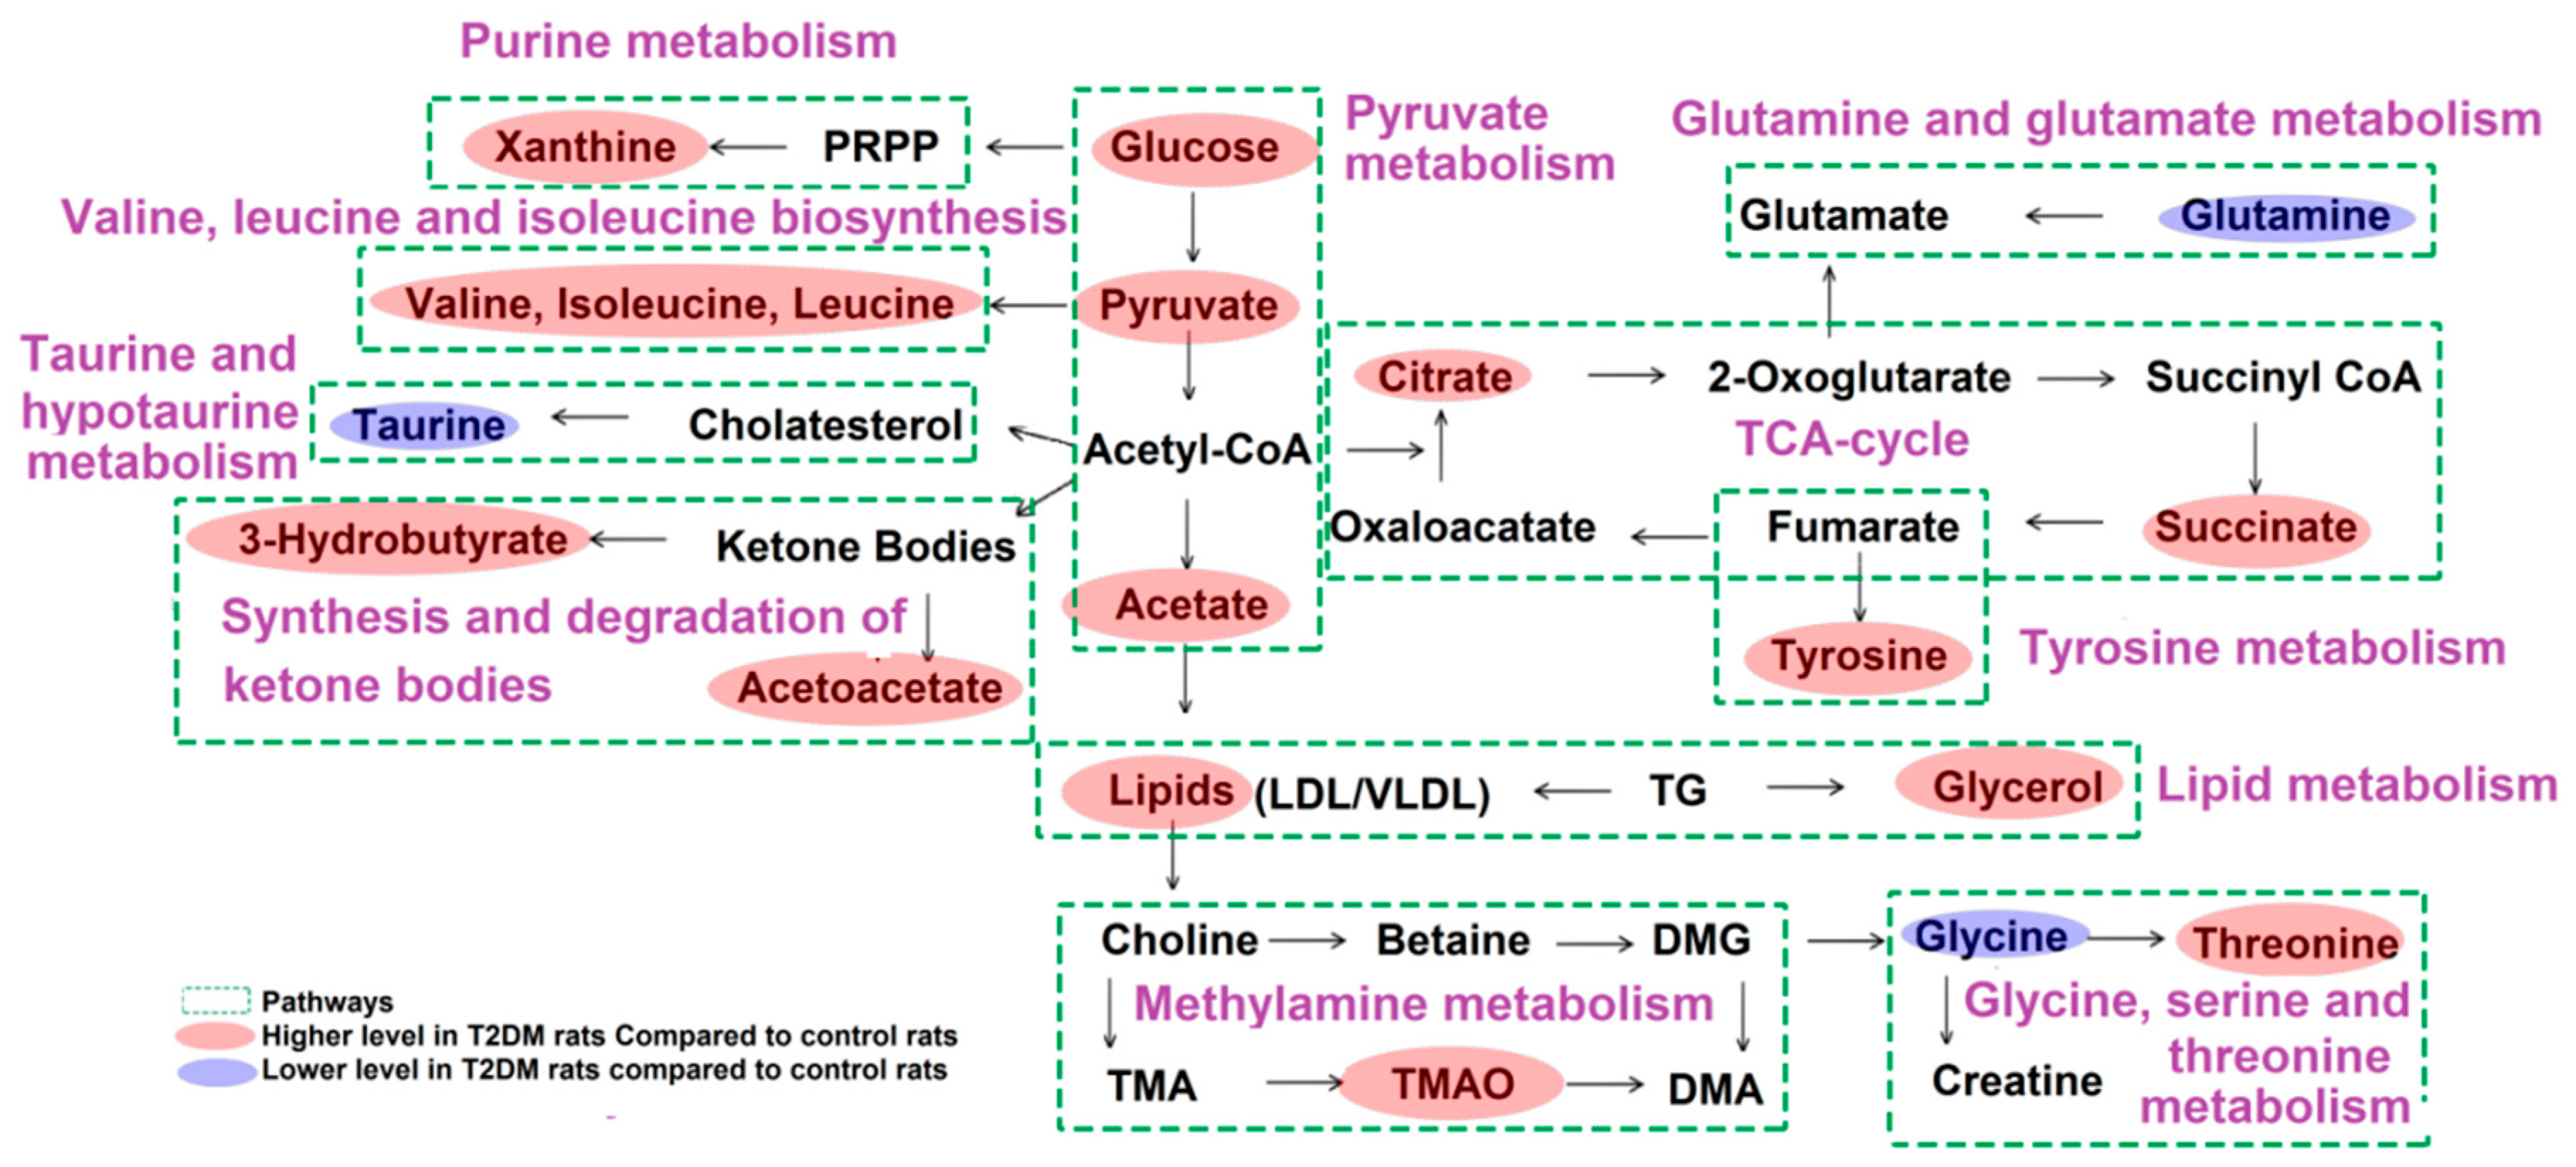
2.3. Metabolic Pathways and Targets Analysis
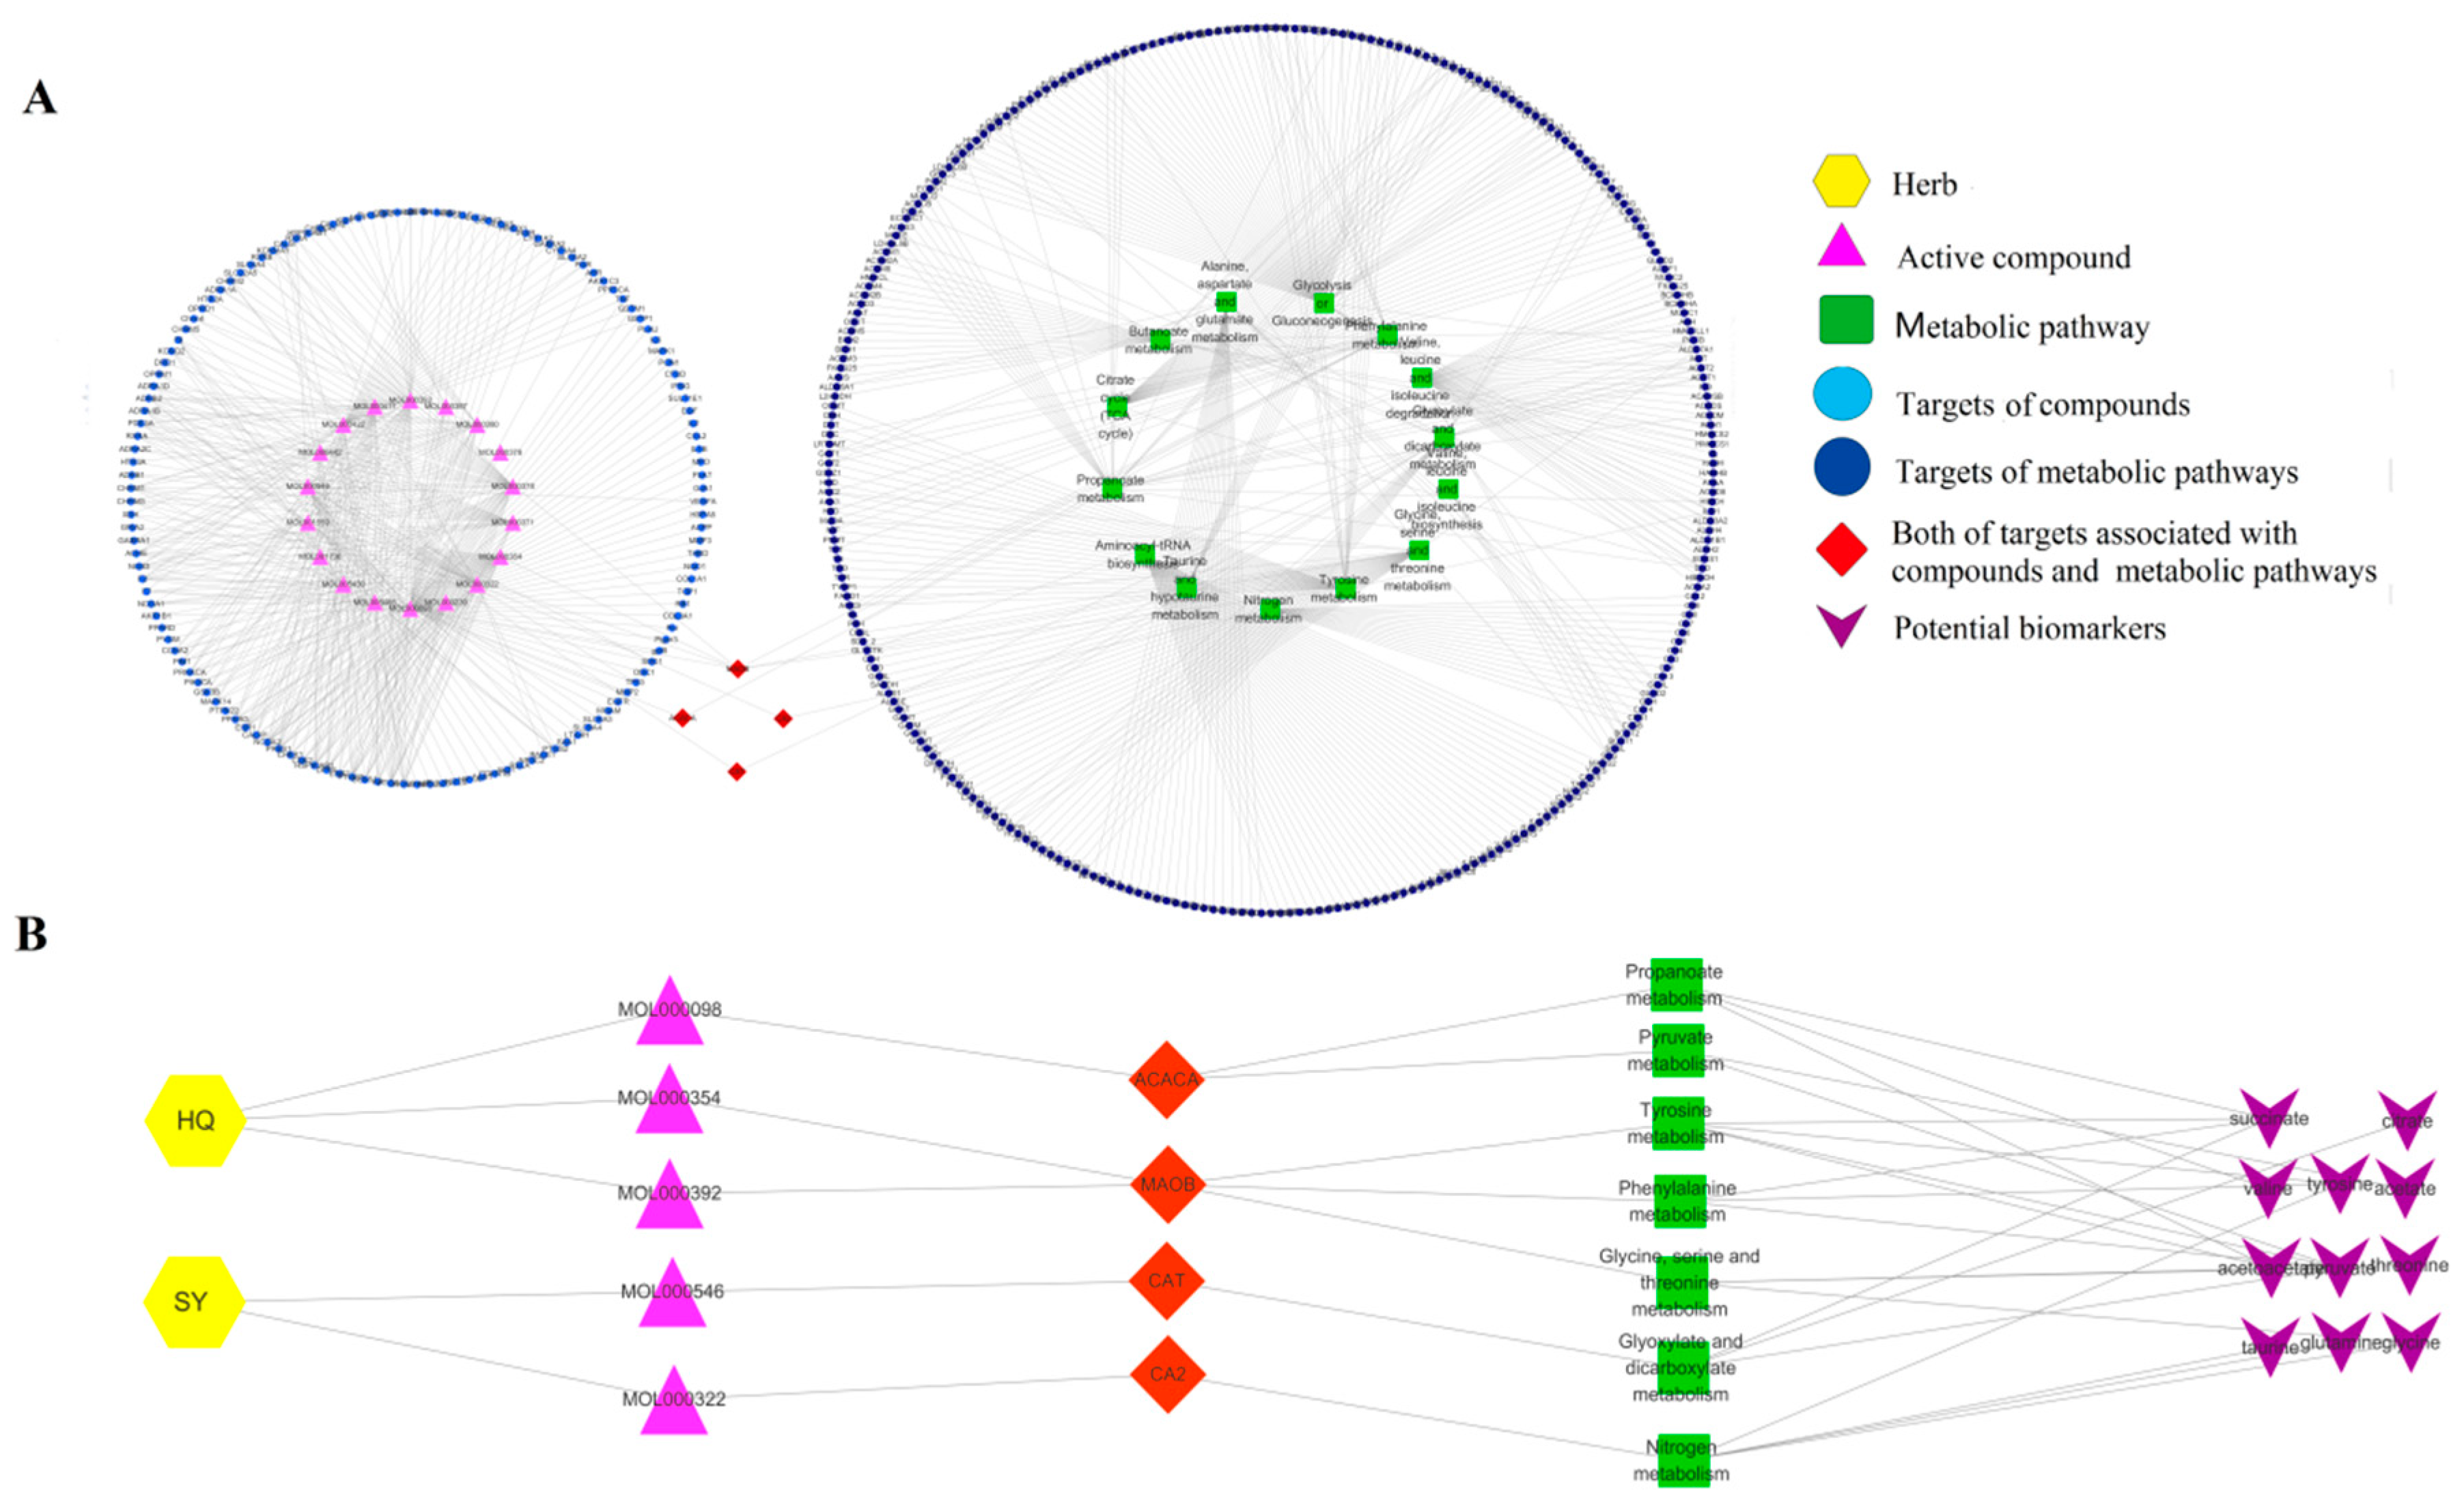
2.4. Network Construction
3. Discussion
4. Materials and Methods
4.1. Reagents and Instruments
4.2. Preparation of HQ and SY
4.3. Animal Care and Experiments
4.4. Biochemical Analysis
4.5. Serum Sample Preparation and NMR Assay
4.6. Data Processing
4.7. Pathway Enrichment Analysis of Biomarkers and Network Construction
4.8. Finding Chemical Composition of HS, Screening out Candidate Gene
4.9. Combining Network Pharmacology and Metabonomics Analyses
5. Conclusions
Supplementary Materials
Author Contributions
Funding
Acknowledgments
Conflicts of Interest
References
- Guariguata, L.; Whiting, D.; Hambleton, I.; Beagley, J.; Linnenkamp, U.; Shaw, J. Global estimates of diabetes prevalence for 2013 and projections for 2035. Diabetes Res. Clin. Pract. 2014, 103, 137–149. [Google Scholar] [CrossRef]
- Akash, M.S.H.; Rehman, K.; Chen, S. Role of inflammatory mechanisms in pathogenesis of type 2 diabetes mellitus. J. Cell. Biochem. 2013, 114, 525–531. [Google Scholar] [CrossRef] [PubMed]
- Evans, J.L.; Goldfine, I.D.; Maddux, B.A.; Grodsky, G.M. Oxidative Stress and Stress-Activated Signaling Pathways: A Unifying Hypothesis of Type 2 Diabetes. Endocr. Rev. 2002, 23, 599–622. [Google Scholar] [CrossRef] [Green Version]
- Jin, T.; Liu, L. Minireview: The Wnt Signaling Pathway Effector TCF7L2 and Type 2 Diabetes Mellitus. Mol. Endocrinol. 2008, 22, 2383–2392. [Google Scholar] [CrossRef] [Green Version]
- Nathan, D.M. Diabetes: Advances in Diagnosis and Treatment. JAMA 2015, 314, 1052–1062. [Google Scholar] [CrossRef]
- Giorgino, F.; Laviola, L.; Leonardini, A.; Natalicchio, A. GLP-1: A new approach for type 2 diabetes therapy. Res. Clin. Pract. 2005, 74, S152–S155. [Google Scholar] [CrossRef]
- Go, H.K.; Rahman, M.M.; Kim, G.B.; Na, C.S.; Song, C.H.; Kim, J.S.; Kim, S.J.; Kang, H.S. Antidiabetic Effects of Yam (Dioscorea batatas) and Its Active Constituent, Allantoin, in a Rat Model of Streptozotocin-Induced Diabetes. Nutrients 2015, 7, 8532–8544. [Google Scholar] [CrossRef]
- Zou, F.; Mao, X.Q.; Wang, N.; Liu, J.; Ou-Yang, J.P. Astragalus polysaccharides alleviates glucose toxicity and restores glucose homeostasis in diabetic states via activation of AMPK. Acta Pharmacol. Sin. 2009, 30, 1607–1615. [Google Scholar] [CrossRef] [Green Version]
- Chen, C.; Zhou, S.; Meng, Q.G. A molecular docking study of Rhizoma Atractylodis and Rhizoma Atractylodis Macrocephalae herbal pair with respect to type 2 diabetes mellitus. J. Tardit. Chin. Med. 2018, 5, 185–198. [Google Scholar] [CrossRef]
- Geng, M.; Chen, H.Y.; Tong, Z.Q.; Wang, J.H.; Hu, Y.Z.; Hao, Y.F. Research of combination therapy with Huangqi and Shanyao on MLP-STZ induced diabetic mice. J. Reg. Anat. Oper. Surg. 2012, 21, 465–469. [Google Scholar]
- Wu, L.R.; Liu, W.B.; Ye, Y.J. Experimental research of the drug pair of Astragalus and Chinese Yam on hypoglycemic and antioxidant. Res. Pract. Chin. Med. 2018, 32, 23–26. [Google Scholar]
- Beckonert, O.; Keun, H.C.; Ebbels, T.M.D.; Bundy, J.; Holmes, E.; Lindon, J.C.; Nicholson, J.K. Metabolic profiling, metabolomic and metabonomic procedures for NMR spectroscopy of urine, plasma, serum and tissue extracts. Nat. Protoc. 2007, 2, 2692–2703. [Google Scholar] [CrossRef]
- Chen, R.; Liao, C.; Guo, Q.; Wu, L.; Zhang, L.; Wang, X. Combined systems pharmacology and fecal metabonomics to study the biomarkers and therapeutic mechanism of type 2 diabetic nephropathy treated with Astragalus and Leech. RSC Adv. 2018, 8, 27448–27463. [Google Scholar] [CrossRef] [Green Version]
- Espina, J.R.; Shockcor, J.P.; Herron, W.J.; Car, B.D.; Contel, N.R.; Ciaccio, P.J.; Lindon, J.C.; Holmes, E.; Nicholson, J.K. Detection of in vivo biomarkers of phospholipidosis using NMR-based metabonomic approaches. Magn. Reson. Chem. 2001, 39, 559–565. [Google Scholar] [CrossRef]
- Van der Graaf, M.; Janssen, S.W.; van Asten, J.J.; Hermus, A.R.; Sweep, C.G.; Pikkemaat, J.A.; Martens, G.J. Metabolic profile of the hippocampus of Zucker Diabetic Fatty rats assessed by in vivo 1H magnetic resonance spectroscopy. NMR Biomed. 2004, 17, 405–410. [Google Scholar] [CrossRef]
- Carter, P.; Gray, L.J.; Troughton, J.; Khunti, K.; Davies, M.J. Fruit and vegetable intake and incidence of type 2 diabetes mellitus: Systematic review and meta-analysis. BMJ 2010, 341, c4229. [Google Scholar] [CrossRef]
- Zhang, S.; Gowda, G.N.; Asiago, V.; Shanaiah, N.; Barbas, C.; Raftery, D. Correlative and quantitative 1H-NMR-based metabolomics reveals specific metabolic pathway disturbances in diabetic rats. Anal. Biochem. 2008, 383, 76–84. [Google Scholar] [CrossRef]
- Kim, S.H.; Yang, S.O.; Kim, H.S.; Kim, Y.; Park, T.; Choi, H.K. 1H-nuclear magnetic resonance spectroscopy-based metabolic assessment in a rat model of obesity induced by a high-fat diet. Anal. Bioanal. Chem. 2009, 395, 1117–1124. [Google Scholar] [CrossRef]
- Mediani, A.; Abas, F.; Maulidiani, M.; Sajak, A.A.B.; Khatib, A.; Tan, C.P.; Ismail, I.S.; Shaari, K.; Ismail, A.; Lajis, N.H. Metabolomic analysis and biochemical changes in the urine and serum of streptozotocin-induced normal- and obese-diabetic rats. J. Physiol. Biochem. 2018, 74, 403–416. [Google Scholar] [CrossRef]
- Abu Bakar, M.H.; Sarmidi, M.R.; Cheng, K.K.; Khan, A.A.; Suan, C.L.; Huri, H.Z.; Yaakob, H. Metabolomics—The complementary field in systems biology: A review on obesity and type 2 diabetes. Mol. BioSyst. 2015, 11, 1742–1774. [Google Scholar] [CrossRef]
- Corpeleijn, E.; Saris, W.H.M.; Blaak, E.E. Metabolic flexibility in the development of insulin resistance and type 2 diabetes: Effects of lifestyle. Obes. Rev. 2009, 10, 178–193. [Google Scholar] [CrossRef]
- Adeva, M.M.; Calviño, J.; Souto, G.; Donapetry, C. Insulin resistance and the metabolism of branched-chain amino acids in humans. Amino Acids 2012, 43, 171–181. [Google Scholar] [CrossRef]
- Zulak, K.G.; Weljie, A.M.; Vogel, H.J.; Facchini, P.J. Quantitative 1H-NMR metabolomics reveals extensive metabolic reprogramming of primary and secondary metabolism in elicitor-treated opium poppy cell cultures. BMC Plant Boil. 2008, 8, 5. [Google Scholar] [CrossRef]
- Lynch, C.J.; Adams, S.H. Branched-chain amino acids in metabolic signalling and insulin resistance. Nat. Rev. Endocrinol. 2014, 10, 723–736. [Google Scholar] [CrossRef] [Green Version]
- Newgard, C.B.; An, J.; Bain, J.R.; Muehlbauer, M.J.; Stevens, R.D.; Lien, L.F.; Haqq, A.M.; Shah, S.H.; Arlotto, M.; Slentz, C.A.; et al. A branched-chain amino acid-related metabolic signature that differentiates obese and lean humans and contributes to insulin resistance. Cell Metab. 2009, 9, 311–326. [Google Scholar] [CrossRef]
- Tizianello, A.; De Ferrari, G.; Garibotto, G.; Gurreri, G.; Robaudo, C. Renal metabolism of amino acids and ammonia in subjects with normal renal function and in patients with chronic renal insufciency. J. Clin. Investig. 1980, 65, 1162–1173. [Google Scholar] [CrossRef]
- Greenfield, J.R.; Farooqi, I.S.; Keogh, J.M.; Henning, E.; Habib, A.M.; Blackwood, A.; Reimann, F.; Holst, J.J.; Gribble, F.M. Oral glutamine increases circulating glucagon-like peptide 1, glucagon, and insulin concentrations in lean, obese, and type 2 diabetic subjects. Am. J. Clin. Nutr. 2009, 89, 106–113. [Google Scholar] [CrossRef]
- Gheni, G.; Ogura, M.; Iwasaki, M.; Yokoi, N.; Minami, K.; Nakayama, Y.; Harada, K.; Hastoy, B.; Wu, X.; Takahashi, H.; et al. Glutamate acts as a key signal linking glucose metabolism to incretin/cAMP action to amplify insulin secretion. Cell Rep. 2014, 9, 661–673. [Google Scholar] [CrossRef]
- Wang, W.; Wu, Z.; Dai, Z.; Yang, Y.; Wang, J.; Wu, G. Glycine metabolism in animals and humans: Implications for nutrition and health. Amino Acids 2013, 45, 463–477. [Google Scholar] [CrossRef]
- Soloway, S.; Stetten, D. The metabolism of choline and its conversion to glycine in the rat. J. Boil. Chem. 1953, 204, 207–214. [Google Scholar]
- Filla, L.A.; Yuan, W.; Feldman, E.L.; Li, S.; Edwards, J.L. Global Metabolomic and Isobaric Tagging Capillary Liquid Chromatography–Tandem Mass Spectrometry Approaches for Uncovering Pathway Dysfunction in Diabetic Mouse Aorta. J. Proteome Res. 2014, 13, 6121–6134. [Google Scholar] [CrossRef]
- Williams, R.E.; Lenz, E.M.; Rantalainen, M.; Wilson, I.D. The comparative metabonomics of age-related changes in the urinary composition of male Wistar-derived and Zucker (fa/fa) obese rats. Mol. BioSyst. 2006, 2, 193. [Google Scholar] [CrossRef]
- Nandhini, A.T.A.; Thirunavukkarasu, V.; Anuradha, C.V. Taurine modifies insulin signaling enzymes in the fructose-fed insulin resistant rats. Diabetes Metab. 2005, 31, 337–344. [Google Scholar] [CrossRef]
- Tang, W.W.; Wang, Z.; Levison, B.S.; Koeth, R.A.; Britt, E.B.; Fu, X.; Wu, Y.; Hazen, S.L. Intestinal microbial metabolism of phosphatidylcholine and cardiovascular risk. N. Engl. J. Med. 2013, 368, 1575–1584. [Google Scholar] [CrossRef]
- Koeth, R.A.; Wang, Z.; Levison, B.S.; Buffa, J.A.; Org, E.; Sheehy, B.T.; Britt, E.B.; Fu, X.; Wu, Y.; Li, L.; et al. Intestinal microbiota metabolism of l-carnitine, a nutrient in red meat, promotes atherosclerosis. Nat. Med. 2013, 19, 576–585. [Google Scholar] [CrossRef] [Green Version]
- Dowell, F.J.; Hamilton, C.A.; McMurray, J.; Reid, J.L. Effects of a Xanthine Oxidase/Hypoxanthine Free Radical and Reactive Oxygen Species Generating System on Endothelial Function in New Zealand White Rabbit Aortic Rings. J. Cardiovasc. Pharmacol. 1993, 22, 792–797. [Google Scholar] [CrossRef]
- Galat, J.A.; Robinson, A.V.; Rhodes, R.S. Oxygen free radical mediated renal dysfunction. J. Surg. Res. 1989, 46, 520–525. [Google Scholar] [CrossRef]
- Linas, S.L.; Whittenburg, D.; Repine, J.E. Role of xanthine oxidase in ischemia/reperfusion injury. Am. J. Physiol. Physiol. 1990, 258, F711–F716. [Google Scholar] [CrossRef]
- Luo, D.X.; Tong, D.J.; Rajput, S.; Wang, C.; Liao, D.F.; Cao, D.; Maser, E. Targeting acetyl-CoA carboxylases: Small molecular inhibitors and their therapeutic potential. Recent Pat. Anti-Cancer Drug Discov. 2012, 7, 168–184. [Google Scholar] [CrossRef]
- Sundaresan, A.; Radhiga, T.; Pugalendi, K.V. Effect of ursolic acid and Rosiglitazone combination on hepatic lipid accumulation in high fat diet-fed C57BL/6J mice. Eur. J. Pharmacol. 2014, 741, 297–303. [Google Scholar] [CrossRef]
- Boone, A.N.; Rodrigues, B.; Brownsey, R.W. Multiple-site phosphorylation of the 280 kDa isoform of acetyl-CoA carboxylase in rat cardiac myocytes: Evidence that cAMP-dependent protein kinase mediates effects of β-adrenergic stimulation. Biochem. J. 1999, 341, 347–354. [Google Scholar] [CrossRef]
- Ondreicka, R.; Beno, I.; Cerna, O.; Granicova, E.; Staruchowa, M.; Volkova, K.; Bobek, P.; Tatara, M. Relation between levels of vitamins C, E, A and beta-carotene and activity of antioxidant enzymes in the blood. Bratisl. Lek. Listy 1998, 99, 250–255. [Google Scholar]
- Matés, J.M.; Pérez-Gómez, C.; De Castro, I.N. Antioxidant enzymes and human diseases. Clin. Biochem. 1999, 32, 595–603. [Google Scholar] [CrossRef]
- Gaetani, G.; Ferraris, A.; Rolfo, M.; Mangerini, R.; Arena, S.; Kirkman, H. Predominant role of catalase in the disposal of hydrogen peroxide within human erythrocytes. Blood 1996, 87, 1595–1599. [Google Scholar] [CrossRef] [Green Version]
- Goto, T.; Shirakawa, H.; Furukawa, Y.; Komai, M. Decreased expression of carbonic anhydrase isozyme II, rather than of isozyme VI, in submandibular glands in long-term zinc-deficient rats. Br. J. Nutr. 2008, 99, 248–253. [Google Scholar] [CrossRef] [Green Version]
- Kumpulainen, T. Immunohistochemical Localization of Human Carbonic Anhydrase Isozymes. Ann. N. Y. Acad. Sci. 1984, 429, 359–368. [Google Scholar] [CrossRef]
- Ghosh, C.; Banik, G.D.; Maity, A.; Som, S.; Chakraborty, A.; Selvan, C.; Ghosh, S.; Pradhan, S. Oxygen-18 isotope of breath CO2 linking to erythrocytes carbonic anhydrase activity: A biomarker for pre-diabetes and type 2 diabetes. Sci. Rep. 2015, 5, 8137. [Google Scholar] [CrossRef]
- Cawthon, R.M.; Breakefield, X.O. Differences in A and B forms of monoamine oxidase revealed by limited proteolysis and peptide mapping. Nature 1979, 281, 692–694. [Google Scholar] [CrossRef]
- Kalgutkar, A.S.; Dalvie, D.K.; Castagnoli, N.; Taylor, T.J. Interactions of Nitrogen-Containing Xenobiotics with Monoamine Oxidase (MAO) Isozymes A and B: SAR Studies on MAO Substrates and Inhibitors. Chem. Res. Toxicol. 2001, 14, 1139–1162. [Google Scholar] [CrossRef]
- Ganic, E.; Johansson, J.K.; Bennet, H.; Fex, M.; Artner, I. Islet-specific monoamine oxidase A and B expression depends on MafA transcriptional activity and is compromised in type 2 diabetes. Biochem. Biophys. Res. Commun. 2015, 468, 629–635. [Google Scholar] [CrossRef]
- Chen, R.; Wang, J.; Liao, C.; Ma, N.; Zhang, L.; Wang, X. 1H-NMR studies on serum metabonomic changes over time in a kidney-Yang deficiency syndrome model. RSC Adv. 2017, 7, 34251–34261. [Google Scholar] [CrossRef]
- Psihogios, N.G.; Gazi, I.F.; Elisaf, M.S.; Seferiadis, K.I.; Bairaktari, E.T. Gender-related and age-related urinalysis of healthy subjects by NMR-based metabonomics. NMR Biomed. 2008, 21, 195–207. [Google Scholar] [CrossRef]
- Ru, J.; Li, P.; Wang, J.; Zhou, W.; Li, B.; Huang, C.; Li, P.; Guo, Z.; Tao, W.; Yang, Y.; et al. TCMSP: A database of systems pharmacology for drug discovery from herbal medicines. J. Cheminform. 2014, 6, 13. [Google Scholar] [CrossRef]
- Hopkins, A.L. Network biology illuminates our understanding of drug action. Nat. Biotechnol. 2007, 25, 1110–1111. [Google Scholar] [CrossRef]
Sample Availability: Samples of the compounds are available from the authors. |


| No. | Metabolites | Chemical Shift(ppm) | VIP | Control/Model | Model/HS | Model/Metformin |
|---|---|---|---|---|---|---|
| 1 | lipid | 0.85(m), 0.88(m), 1.57(m), 2.22(m), 1.26(m) | 1.92 | ↑ * | ↓ # | - |
| 2 | acetate | 1.92(s) | 1.01 | ↑ * | ↓ # | ↓ # |
| 3 | pyruvate | 2.37(s) | 2.87 | ↑ * | ↓ # | ↓ # |
| 4 | TMAO | 3.27(s) | 1.05 | ↑ * | ↓ # | ↓ ## |
| 5 | taurine | 3.27(t), 3.43(t) | 2.76 | ↓ * | ↑ # | ↑ # |
| 6 | glycine | 3.54(s) | 2.23 | ↓ ** | ↑ # | ↑ ## |
| 7 | glycerol | 3.54(dd), 3.66(dd) | 1.41 | ↑ ** | ↓ # | ↓ ## |
| 8 | isoleucine | 0.93(t), 1.00(d), 1.96(m) | 1.02 | ↑ ** | ↓ # | - |
| 9 | leucine | 0.95(d), 0.97(d), 1.72(m), 3.65(dd) | 1.06 | ↑ * | ↓ # | - |
| 10 | valine | 0.98(d), 1.03(d), 2.26(d), 3.60(d) | 1.03 | ↑ ** | ↓ # | ↓ # |
| 11 | glutamine | 2.41 (m) | 1.03 | ↓ ** | ↑ # | ↑ ## |
| 12 | citrate | 2.52(d), 2.67(d) | 1.06 | ↑ * | ↓ # | - |
| 13 | β-glucose | 3.24(dd), 3.4(t), 3.46(ddd), 3.49(t),3.90(dd), 4.64(d) | 1.75 | ↑ * | - | ↓ # |
| 14 | α-glucose | 3.53(dd), 3.72(dd), 3.76(dd), 3.83(ddd), 5.23(d) | 2.89 | ↑ ** | ↓ # | ↓ # |
| 15 | tyrosine | 3.94, 6.89(d), 7.18(d) | 1.04 | ↑ * | ↓ # | ↓ ## |
| 16 | 3-hydrobutyrate | 1.20(d), 2.31(dd), 2.41(dd) | 2.37 | ↑ * | ↓ # | ↓ # |
| 17 | acetoacetate | 2.28 (s) | 1.52 | ↑ ** | ↓ # | ↓ ## |
| 18 | succinate | 2.40 (s) | 1.22 | ↑ ** | ↓ # | ↓ ## |
| 19 | unsaturated lipid | 5.32 (m) | 1.28 | ↑ * | ↓ # | - |
| 20 | xanthine | 7.75 (s) | 1.01 | ↑ * | ↓ * | ↓ * |
| 21 | threonine | 3.56(dd) | 2.39 | ↑ ** | ↓ * | ↓ * |
| No. | Pathway Name | Total | Hits | p | Impact |
|---|---|---|---|---|---|
| 1 | Aminoacyl-tRNA biosynthesis | 75 | 7 | 5.21 × 10⁻⁷ | 0 |
| 2 | Valine, leucine and isoleucine biosynthesis | 27 | 5 | 9.34 × 10⁻⁷ | 0.06148 |
| 3 | Nitrogen metabolism | 39 | 4 | 1.53 × 10⁻⁴ | 0 |
| 4 | Valine, leucine and isoleucine degradation | 40 | 4 | 1.69 × 10⁻⁴ | 0.02232 |
| 5 | Citrate cycle (TCA cycle) | 20 | 3 | 3.7 × 10⁻⁴ | 0.16797 |
| 6 | Taurine and hypotaurine metabolism | 20 | 3 | 3.7 × 10⁻⁴ | 0.35252 |
| 7 | Alanine, aspartate and glutamate metabolism | 24 | 3 | 6.45×10⁻⁴ | 0.20703 |
| 8 | Glycolysis or Gluconeogenesis | 31 | 3 | 0.0014 | 0.09576 |
| 9 | Propanoate metabolism | 35 | 3 | 0.00198 | 0.02982 |
| 10 | Tyrosine metabolism | 76 | 4 | 0.00201 | 0.04724 |
| 11 | Butanoate metabolism | 40 | 3 | 0.00292 | 0.1432 |
| 12 | Phenylalanine metabolism | 45 | 3 | 0.0041 | 0 |
| 13 | Glycine, serine and threonine metabolism | 48 | 3 | 0.00492 | 0.28435 |
| 14 | Glyoxylate and dicarboxylate metabolism | 50 | 3 | 0.00553 | 0.00326 |
© 2019 by the authors. Licensee MDPI, Basel, Switzerland. This article is an open access article distributed under the terms and conditions of the Creative Commons Attribution (CC BY) license (http://creativecommons.org/licenses/by/4.0/).
Share and Cite
Guo, Q.; Niu, W.; Li, X.; Guo, H.; Zhang, N.; Wang, X.; Wu, L. Study on Hypoglycemic Effect of the Drug Pair of Astragalus Radix and Dioscoreae Rhizoma in T2DM Rats by Network Pharmacology and Metabonomics. Molecules 2019, 24, 4050. https://0-doi-org.brum.beds.ac.uk/10.3390/molecules24224050
Guo Q, Niu W, Li X, Guo H, Zhang N, Wang X, Wu L. Study on Hypoglycemic Effect of the Drug Pair of Astragalus Radix and Dioscoreae Rhizoma in T2DM Rats by Network Pharmacology and Metabonomics. Molecules. 2019; 24(22):4050. https://0-doi-org.brum.beds.ac.uk/10.3390/molecules24224050
Chicago/Turabian StyleGuo, Qian, Wanlin Niu, Xuejia Li, Hongru Guo, Na Zhang, Xiufeng Wang, and Lirong Wu. 2019. "Study on Hypoglycemic Effect of the Drug Pair of Astragalus Radix and Dioscoreae Rhizoma in T2DM Rats by Network Pharmacology and Metabonomics" Molecules 24, no. 22: 4050. https://0-doi-org.brum.beds.ac.uk/10.3390/molecules24224050