Article

Construction of Quantitative Structure Activity Relationship (QSAR) Models to Predict Potency of Structurally Diversed Janus Kinase 2 Inhibitors

1
Thailand Center of Excellence for Life Sciences (Public Organization), Ministry of Science and Technology, Bangkok 10400, Thailand
2
Department of Social and Applied Science, College of Industrial Technology, King Mongkut’s University of Technology North Bangkok, Bangkok 10800, Thailand
*
Author to whom correspondence should be addressed.
Submission received: 5 November 2019 / Revised: 24 November 2019 / Accepted: 28 November 2019 / Published: 1 December 2019

Abstract

:
Janus kinase 2 (JAK2) inhibitors represent a promising therapeutic class of anticancer agents against many myeloproliferative disorders. Bioactivity data on pIC 50 of 2229 JAK2 inhibitors were employed in the construction of quantitative structure-activity relationship (QSAR) models. The models were built from 100 data splits using decision tree (DT), support vector machine (SVM), deep neural network (DNN) and random forest (RF). The predictive power of RF models were assessed via 10-fold cross validation, which afforded excellent predictive performance with R 2 and RMSE of 0.74 ± 0.05 and 0.63 ± 0.05, respectively. Moreover, test set has excellent performance of R 2 (0.75 ± 0.03) and RMSE (0.62 ± 0.04). In addition, Y-scrambling was utilized to evaluate the possibility of chance correlation of the predictive model. A thorough analysis of the substructure fingerprint count was conducted to provide insights on the inhibitory properties of JAK2 inhibitors. Molecular cluster analysis revealed that pyrazine scaffolds have nanomolar potency against JAK2.

1. Introduction

Cancer exerts a great impact on the quality of life and is a leading cause of death worldwide. Although cancer chemotherapy, one of the major medical advances in the last few decades, is directed toward certain macromolecules to treat cancer, it cannot efficiently discriminate between normally dividing cell and tumor cells, leading to unwanted toxic side effects. However, targets are usually located in tumor cells, thus providing a high specificity toward tumor cells and broader therapeutic window with less toxicity is beneficial. Therefore, targeted therapy represents a promising approach to cancer therapy [1]. Generally an ideal therapeutic target should not only be susceptible to specific inhibition by small ligands but tumor cells also more dependent on the activity of the target than normal cells [2].
Janus kinase 2 (JAK2) is a member of the Janus family of tyrosine kinase, which plays an important role in many cellular signaling pathways [3,4]. It is a nonreceptor tyrosine kinase that relays signals from cytokine receptors to downstream targets, including the transcription factors STAT3 and STAT5. When it is activated, this family of enzymes increase tumor cell proliferation and growth, induce antiapoptotic effects and promote angiogenesis as well as metastasis [5,6]. Therefore, the inhibition of JAK2 would greatly reduce the activity of tyrosine kinase and compounds achieving such effects are known as JAK2 inhibitors [7].
JAK inhibitors are important class of targeted therapy that interfere with specific cell signaling pathways, which allows target-specific therapy for selected malignancies. Many of the JAK inhibitors are known to interfere with the JAK-STAT pathways, which have an implication in the treatment of different types of cancers and inflammatory diseases [8,9,10,11]. JAK inhibitors can be found in FDA approved drugs and clinical trials. For example, Ruxolitinib, an orally bioavailable selective inhibitor of JAK2, inhibits the proliferation of JAK2 [12]. Lestautinib, an orally bio-available polyaromatic indolocarbozole alkaloid, is a tyrosine kinase inhibitor that is currently in clinical trials and assigned Investigational New Drug (IND) number 76431 [13].
Quantitative structure activity relationship (QSAR) is an approach for elucidating the origin of biological activity with their respective chemical compounds represented as descriptors. The QSAR models can reveal molecular features that are essential for active compounds and that can subsequently be used as therapeutic agents [14]. Several QSAR models were developed in the hope to drive the novel compounds with better properties against kinase [15,16,17,18,19,20,21,22]. To understand the origin and bioactivities of JAK inhibitors, models were developed with the hope to identify important pharmacophores and substructures using pharmacophores and 3D QSAR [23,24,25,26,27,28,29,30,31,32,33,34,35]. Due to the polypharmacological nature of compounds, multi-target QSAR models have been also developed to handle the interaction of multiple targets of JAK inhibitors. Although pharmacophores and 3D QSAR models, as well as multi-target QSAR models [36,37] and tools [38] are essential in understanding structure-activity relationship of JAK2 inhibitors, the ability of the those models to predict unknown bioactivity properties depends largely on the size of training sets. Extrapolation power of the model, where the model predicts accurately with confidence and credibility, depends on how well the training data represent the unknown compounds. Therefore, QSAR model will have a small applicability domain and low general predictability if they are based on a small data set.
Here we propose a large-scale QSAR investigation for predicting JAK2 inhibitors. Several statistical methods were used to build regression models in which inhibitors were represented as highly interpretable substructure fingerprint descriptors to understand the underlying JAK2 inhibitory activity, which is performed according to the guidelines of Organisation for Economic Cooperation and Development (OECD) [39]. This may provide important insights into the structural basis for the inhibition of JAK2, which may aid in the fight against cancer, in particular myeloproliferative neoplasms.

2. Results

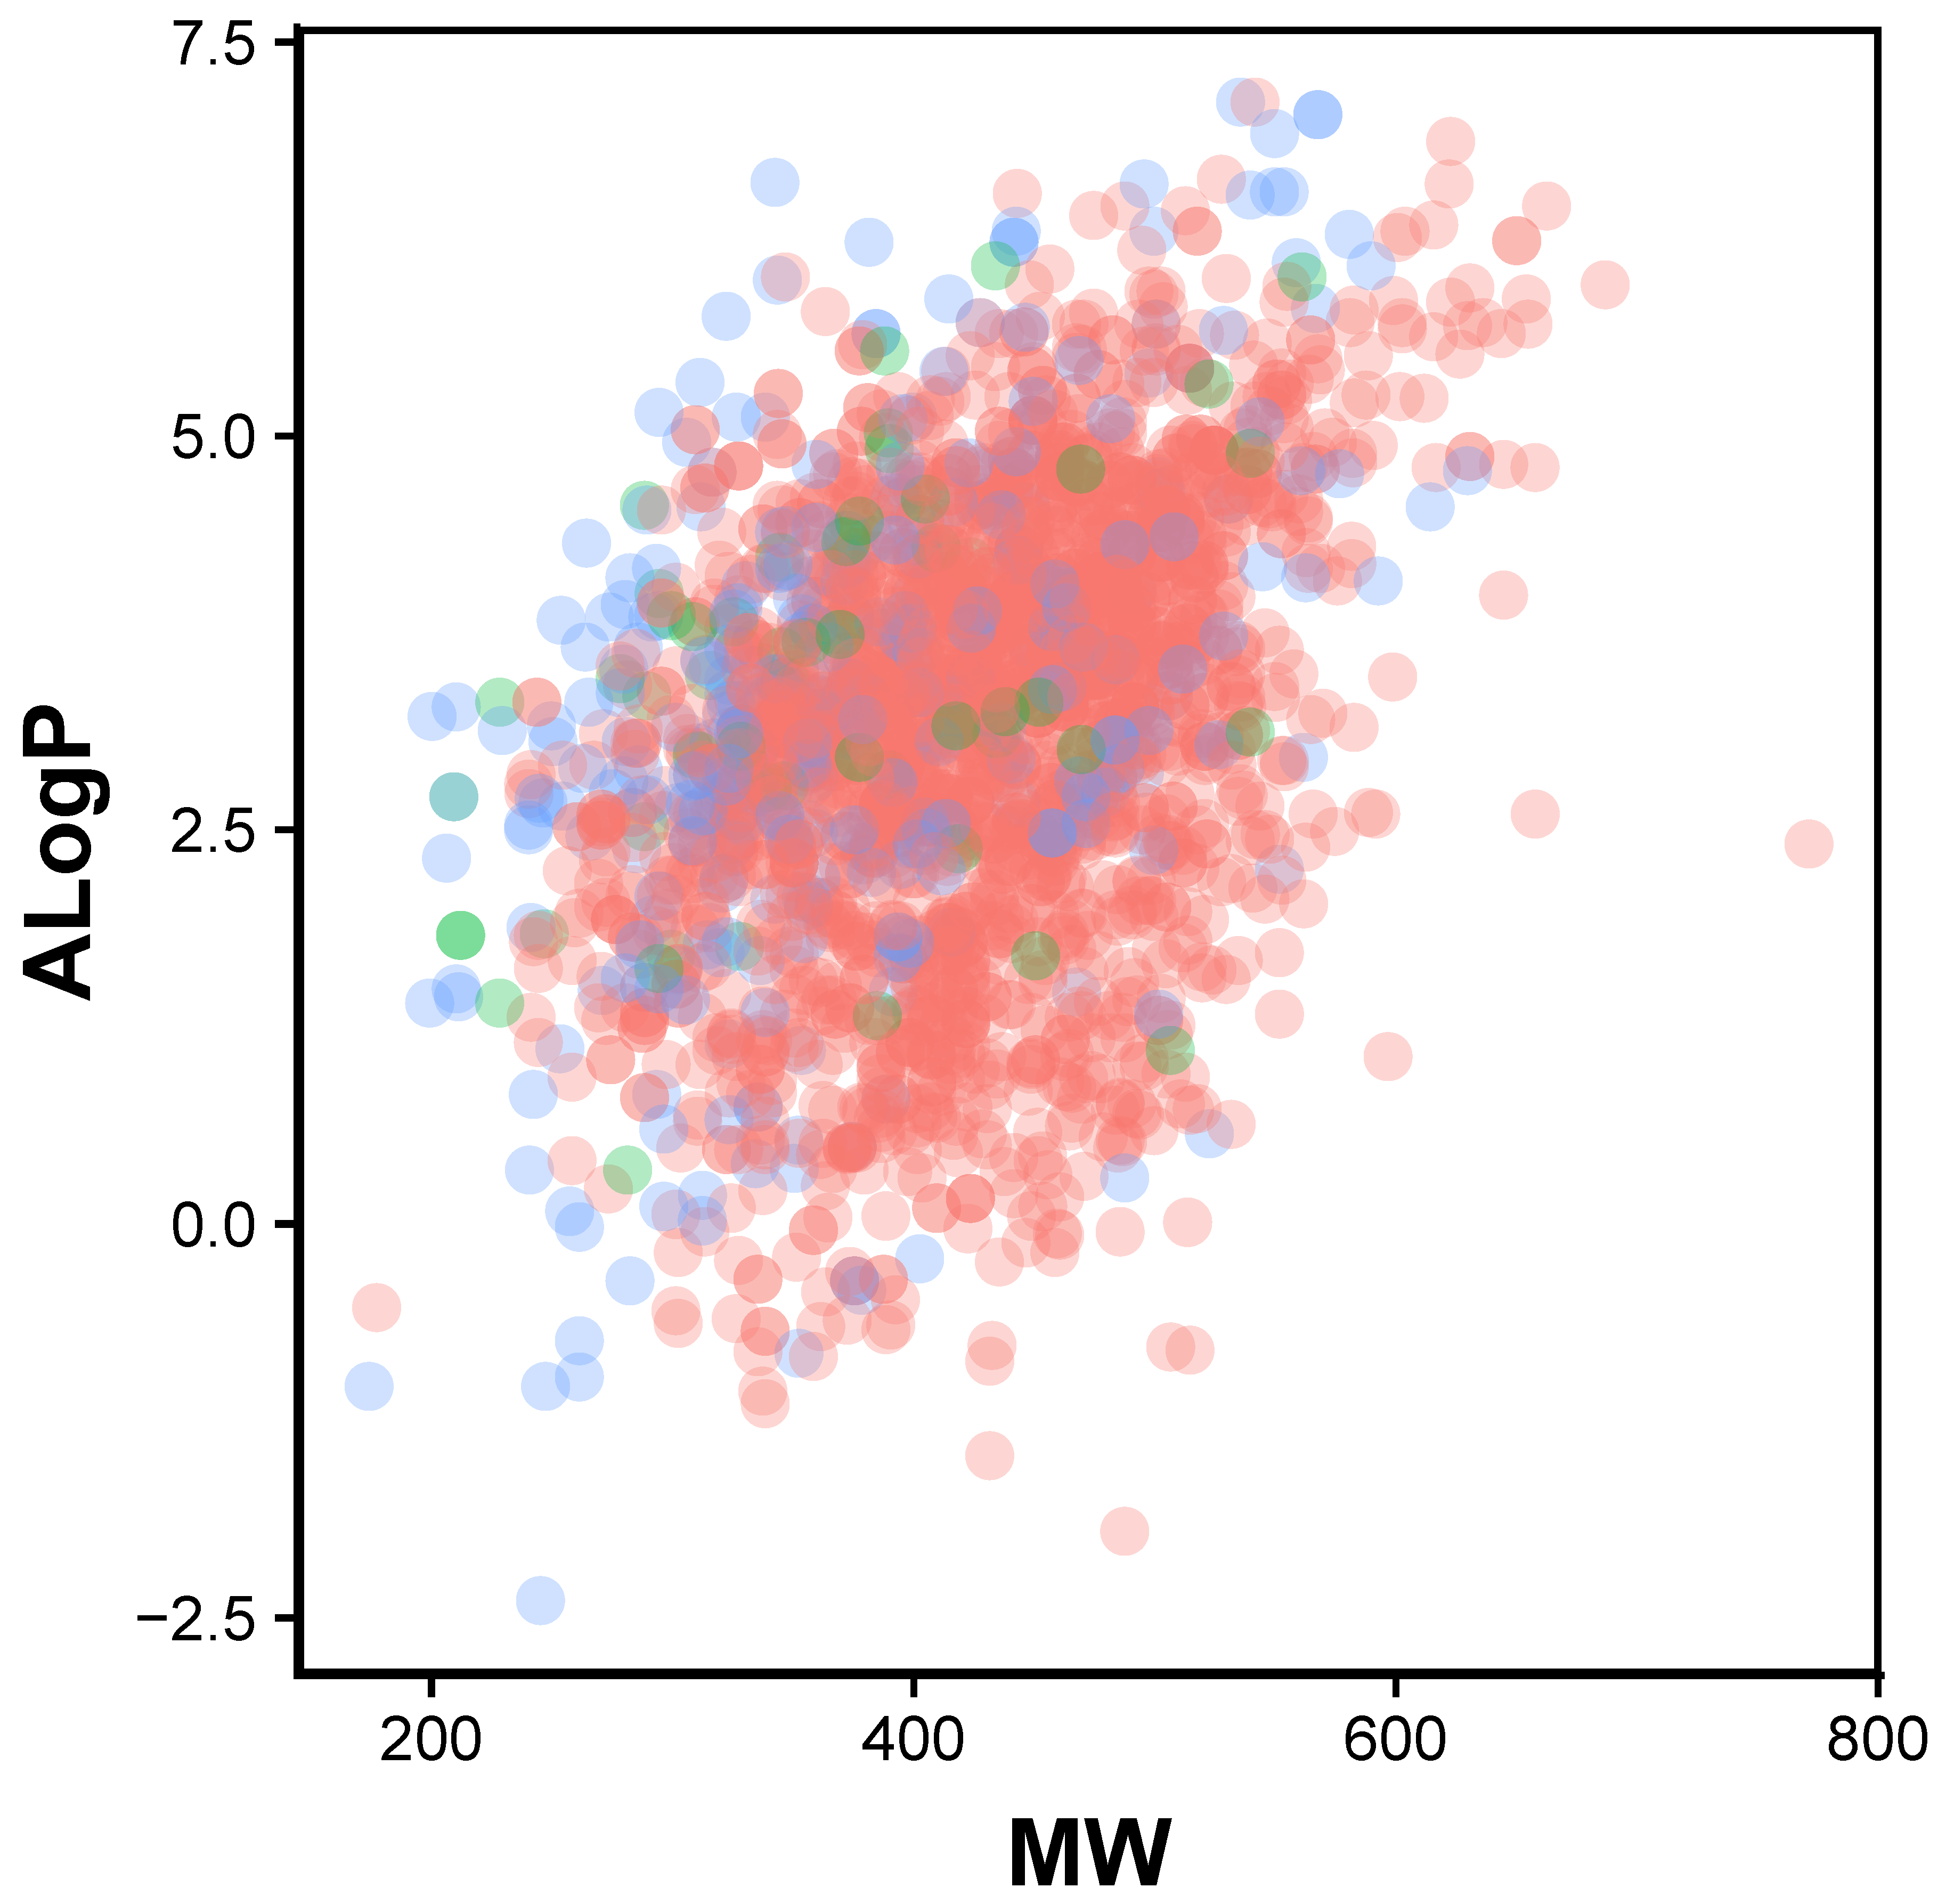
2.1. Chemical Space of JAK2 Inhibitors
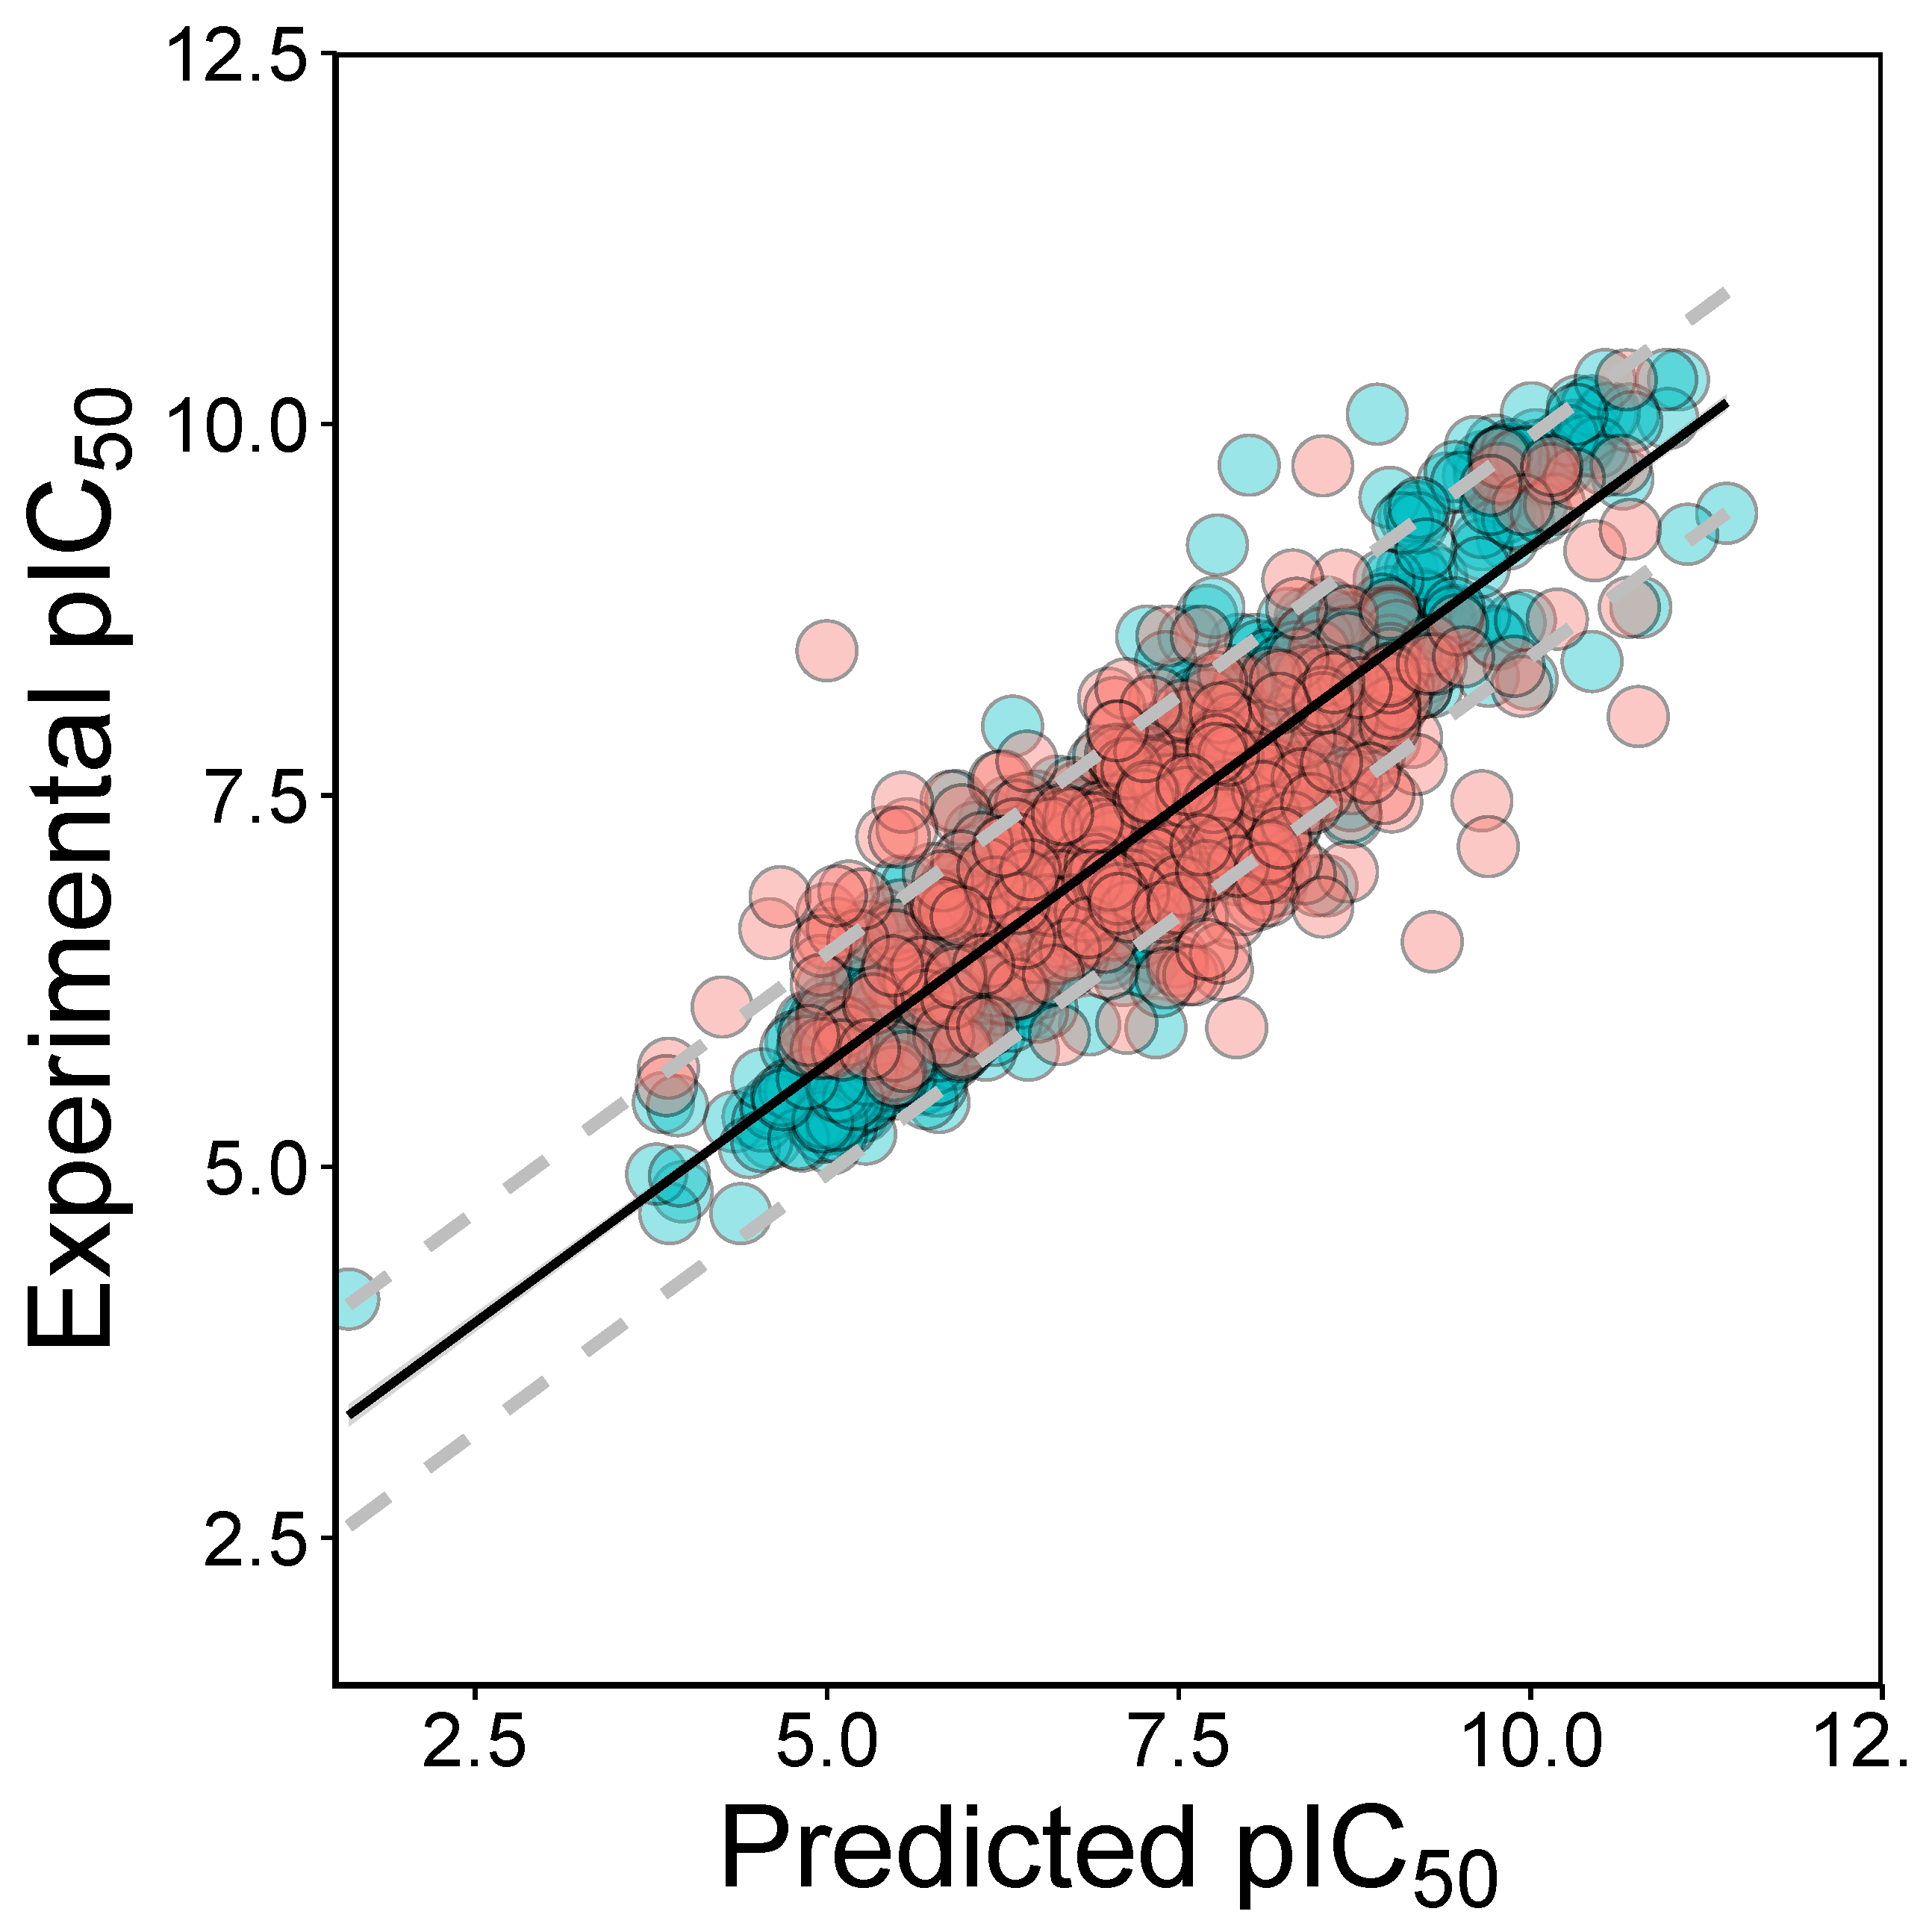
In order to provide the chemical space of JAK2 inhibitors, Lipinski’s rule-of-five descriptors are analyzed. This may provide insights on the origin of inhibitory properties of compounds. Lipinski’s rule-of-five descriptor consisted of molecular weight (MW), octanol-water partition coefficient (ALogP), number of hydrogen bond donors (nHBDon) and number of hydrogen bond acceptors (nHBAcc). Scatter plot of ALogP vs MW of the JAK2 inhibitors coloured by activities is shown in Figure 1. It can be seen that most of the compounds lie in the space of approximately 300 to 500 Da (MW) and 2.5 to 4 (AlogP). A boxplot of AlogP, nHBAcc, nHBDon and MW broken down by activity group is shown in Figure 2. Based on the boundaries of the boxes, there is no differences between the three bioactivity classes for nHBdon and ALogP. However, there is a weak trend of differences between the bioactivity groups for nHBAcc and MW, suggesting the active bioactivity classes higher nHBAcc and MW values. The results may suggest that the most desirable region for bioactivity is MW > 400, AlogP < 3 and nHBAcc > 6 (Figure 2).

2.2. QSAR Modeling

Usage of substructure fingerprint descriptors allows us to pinpoint the substructures that are important for modulating activity of JAK2. In order to get rid of the redundancy among the descriptors, the substructures were filtered using a cutoff threshold set at 0.70. As previously mentioned, the initial data set was split into a training set and test set, where the former represented 80% of the data set while the latter constituted the remaining 20% of the data set. To avoid the random seed, data splitting was performed for 100 iterations where each split was used to create a predictive model. The mean and standard deviation of the resulting predictive performance ( R 2 , RMSE, r m 2 and Δ r m 2 ) were computed.
QSAR models were developed with various machine learning methods consisting of rule based models (DT), ensemble models (RF), non-linear models (SVM) and deep learning (DNN). As shown in the Table 1, the predictive performances of the training set provide R 2 of 0.65–0.75. The R 2 can be represented as intuitive metrics for ranking model and for intuitive comparison. The presence of irrelevant descriptors or overfitted model can be revealed by deterioration of predictive performance from 10-fold cross validation and a test set. A closer look at the models reveal that the bagging of trees improves the predictive performance over a single tree by reduction variance of the prediction. As seen in the Table 1, the R 2 of training set for RF is 0.75 ± 0.02 whereas for DT is 0.65 ± 0.02. SVM is an non-linear modeling technique which is considered to be powerful and highly flexible. The R 2 , RMSE, r m 2 and Δ r m 2 of the training set for SVM is 0.72 ± 0.02, 0.65 ± 0.02, 0.57 ± 0.04 and 0.26 ± 0.01, respectively. Recently, deep learning is an emerging technology in machine perception and natural language processing. The performance of DNN is higher than DT with R 2 of 0.59 ± 0.04 and RMSE = 0.82 ± 0.07. Table 2 showed the MAE of DT, SVM, DNN and RF. It can be seen that the order of error according to MAE is RF > SVM > DT > DNN for the training set. The error order is slightly different for the test set which is RF > SVM > DNN > DT. It can be seen that RF model is not overfitted to the training data which is indicated by the small gap between the training and test set MAE values. Several QSAR models on JAK2 were performed. The training set of 22, 31, 40, 42, 51 and 161 leads to the R 2 of 0.97 [28], 0.97 [23], 0.929 [27], 0.970 [26], 0.93 [25] and 0.869 [24], respectively. It can be seen that QSAR models built from lower training sets tend to have better performance. On the other hand, the QSAR built from a large data set using diverse chemical structures will have lower performance due to confounding factors. Nevertheless, QSAR models built from a large data set may have implication on the domain of applicability.
Scatter plots of R 2 versus Q 2 for the Y-permutated (i.e., Y-scrambled) datasets of JAK2 inhibitory properties is shown in Figure 3. It can be observed that the actual X-Y pair for the QSAR models of bioactivities (pIC 50 ) is clearly separated from the permutated X-Y pairs, ruling out the chance of correlation of the QSAR models [40].
The models built on JAK2 has an excellent performance for RF as judged from the cross-validation set and test set. The performance of the cross-validation set is R 2 = 0.74 ± 0.05 and RMSE = 0.63 ± 0.05. For the test set, the RF have higher predictive performance as deduced from R 2 (0.75 ± 0.03) and RMSE (0.65 ± 0.04). The model complies with the requirement of the threshold values proposed by Tropsha ( R 2 > 0.6 and Q 2 > 0.5) [41]. The margin between the R 2 of training set and R 2 of test set is 0.00, indicating that the model is reliable and predictive [42]. Figure 4 showed the experimental pIC 50 as a function of prediction from RF.

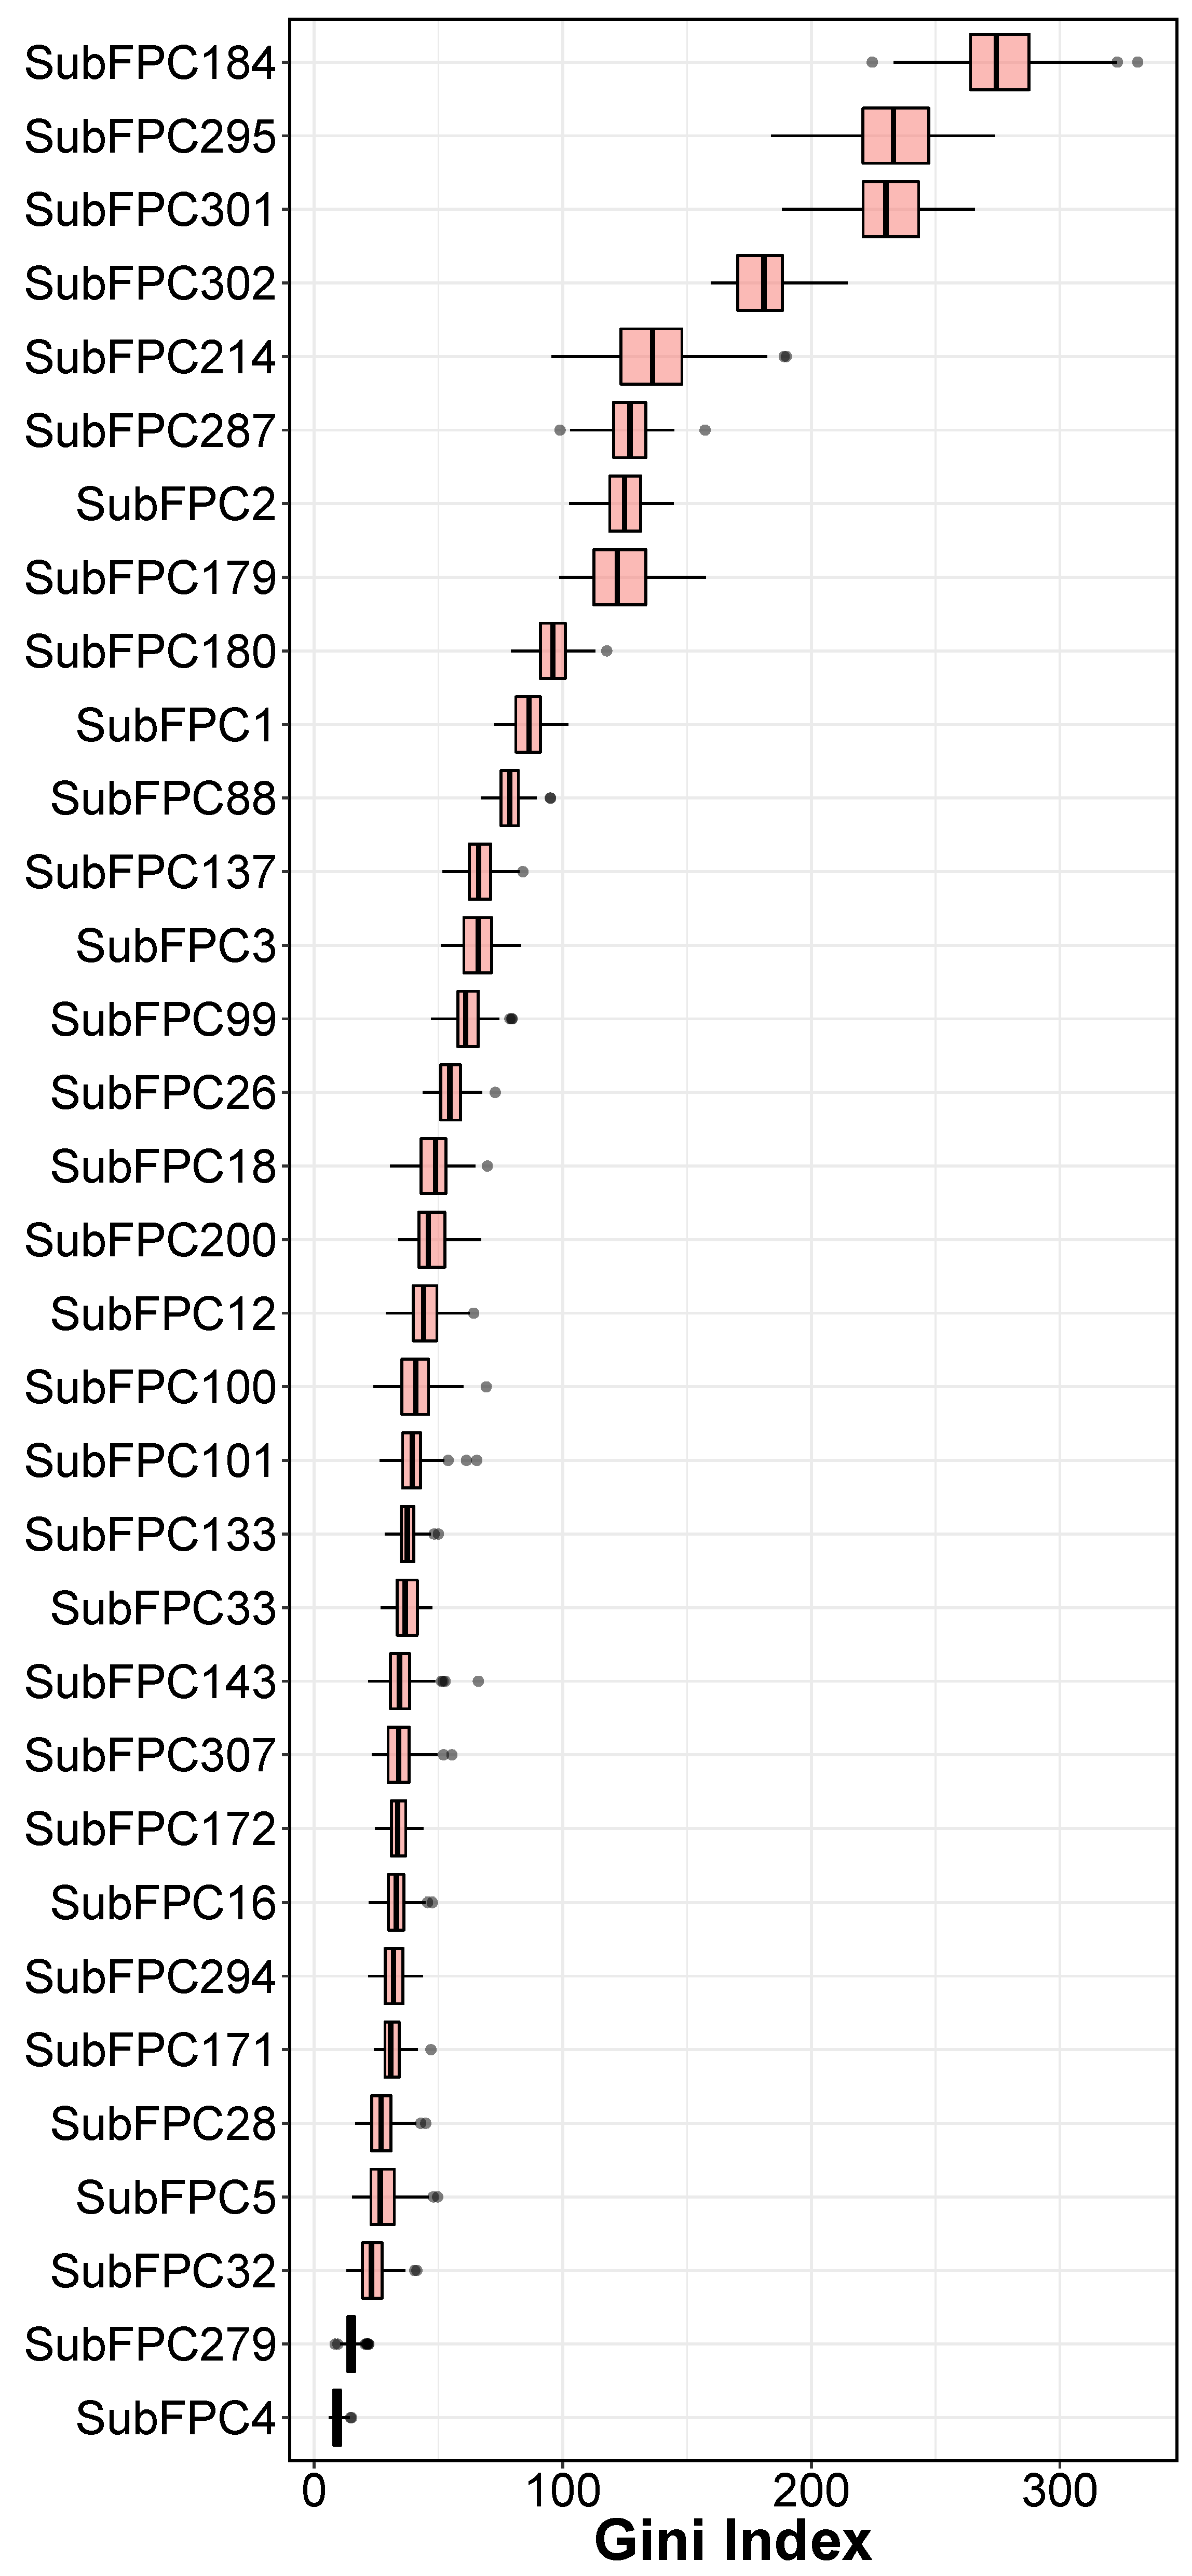
2.3. Interpretation of QSAR Models

The analysis of feature importance for different types of substructure fingerprints provides a better understanding of the JAK2 inhibitors. Table 3 showed a list of structure fingerprints and their descriptors that were utilized in the study. The efficient, effective and transparent Gini Index from RF was used to identity important features based on the predictive performance in Table 1. To avoid the bias of random seed in evaluating feature importance, the average and standard deviation values of Gini Index from 100 runs are used in the analysis. When interpreting the Gini Index, the high values have the most weight in dependent variables (pIC 50 ). From the Figure 5, it can be seen that, SubFPC184 (276.48 ± 20.19), SubFPC295 (233.71 ± 17.86), SubFPC301 (230.87 ± 16.51), SubFPC302 (180.49 ± 11.78) and SubFPC214 (136.28 ± 19.00) have the highest values of Gini Index, suggesting that these substructures in compounds could have substantial impact on potency, based on the QSAR model. Because the features which have the highest coefficient values have highest weight of increase in bioactivity value, SubFPC184 (Heteroaromatic) is one of the most important features in determining potency of JAK2. It can be observed that FDA approved drugs namely Ruxolitinib [43], Tofacitinib [44], Baricitinib [45], Fedratinib [46], have heteroaromatic pyrimidine ring, suggesting that heteroaromatic is an important substituent when designing novel drugs as JAK2 inhibitors. The second most important feature is SubFPC295 which represents C ONS bond in the chemical structures. This feature facilitates in non-convalent interaction between inhibitors and JAK2 [47]. The third most important feature is SubFPC301 (1,5-Tautomerizable). Tautomerizable heterocycles have recently emerged as an attractive class of inhibitors for JAK2. Indeed, Pyrazolo[1,5-a]pyrimidines are important classes of chemical compounds that display a wide range of biological activities, including ant-cancer by modulating JAK2 [48]. Lastly, SUBFPC302 (rotatable bond) and SubFPC214 (sulfonic derivative) are important to consider when designing novel JAK2 inhibitors with high potency.The analysis of a crystal structure showed that selectivity of protein inhibitors is controlled by a hydrophobic pocket via a rotatable bond in the compound skeleton [49]. This is in agreement with the fact that all of the clinical approved drugs that target JAK2 has at least one rotatable bond in their chemical structures.

2.4. Applicability Domain

The AD of the QSAR was defined as to assess the credibility of the model via the Williams plot, shown in Figure 6. The employed data set has in total 2229 compounds, which were partitioned into two separate subsets. The first subset consisted of 80% of the data set, which is used as training set while the second, set (20%) is used as a test set. Samples that represent the training set were highlighted as blue, whereas the test set was colored as red (Figure 6). The h* had a value of 0.034 for the QSAR model developed using RF. Clearly, it can be observed that almost all of the 2229 compounds are within the boundaries of applicability domain, indicating that the QSAR model had a well-defined AD. This may be because the training sample is based on various chemotypes, allowing the model to predict the test set with validity and credibility. On the other hand, there are a few compounds which lie outside the applicability domain of the model (Table S1).

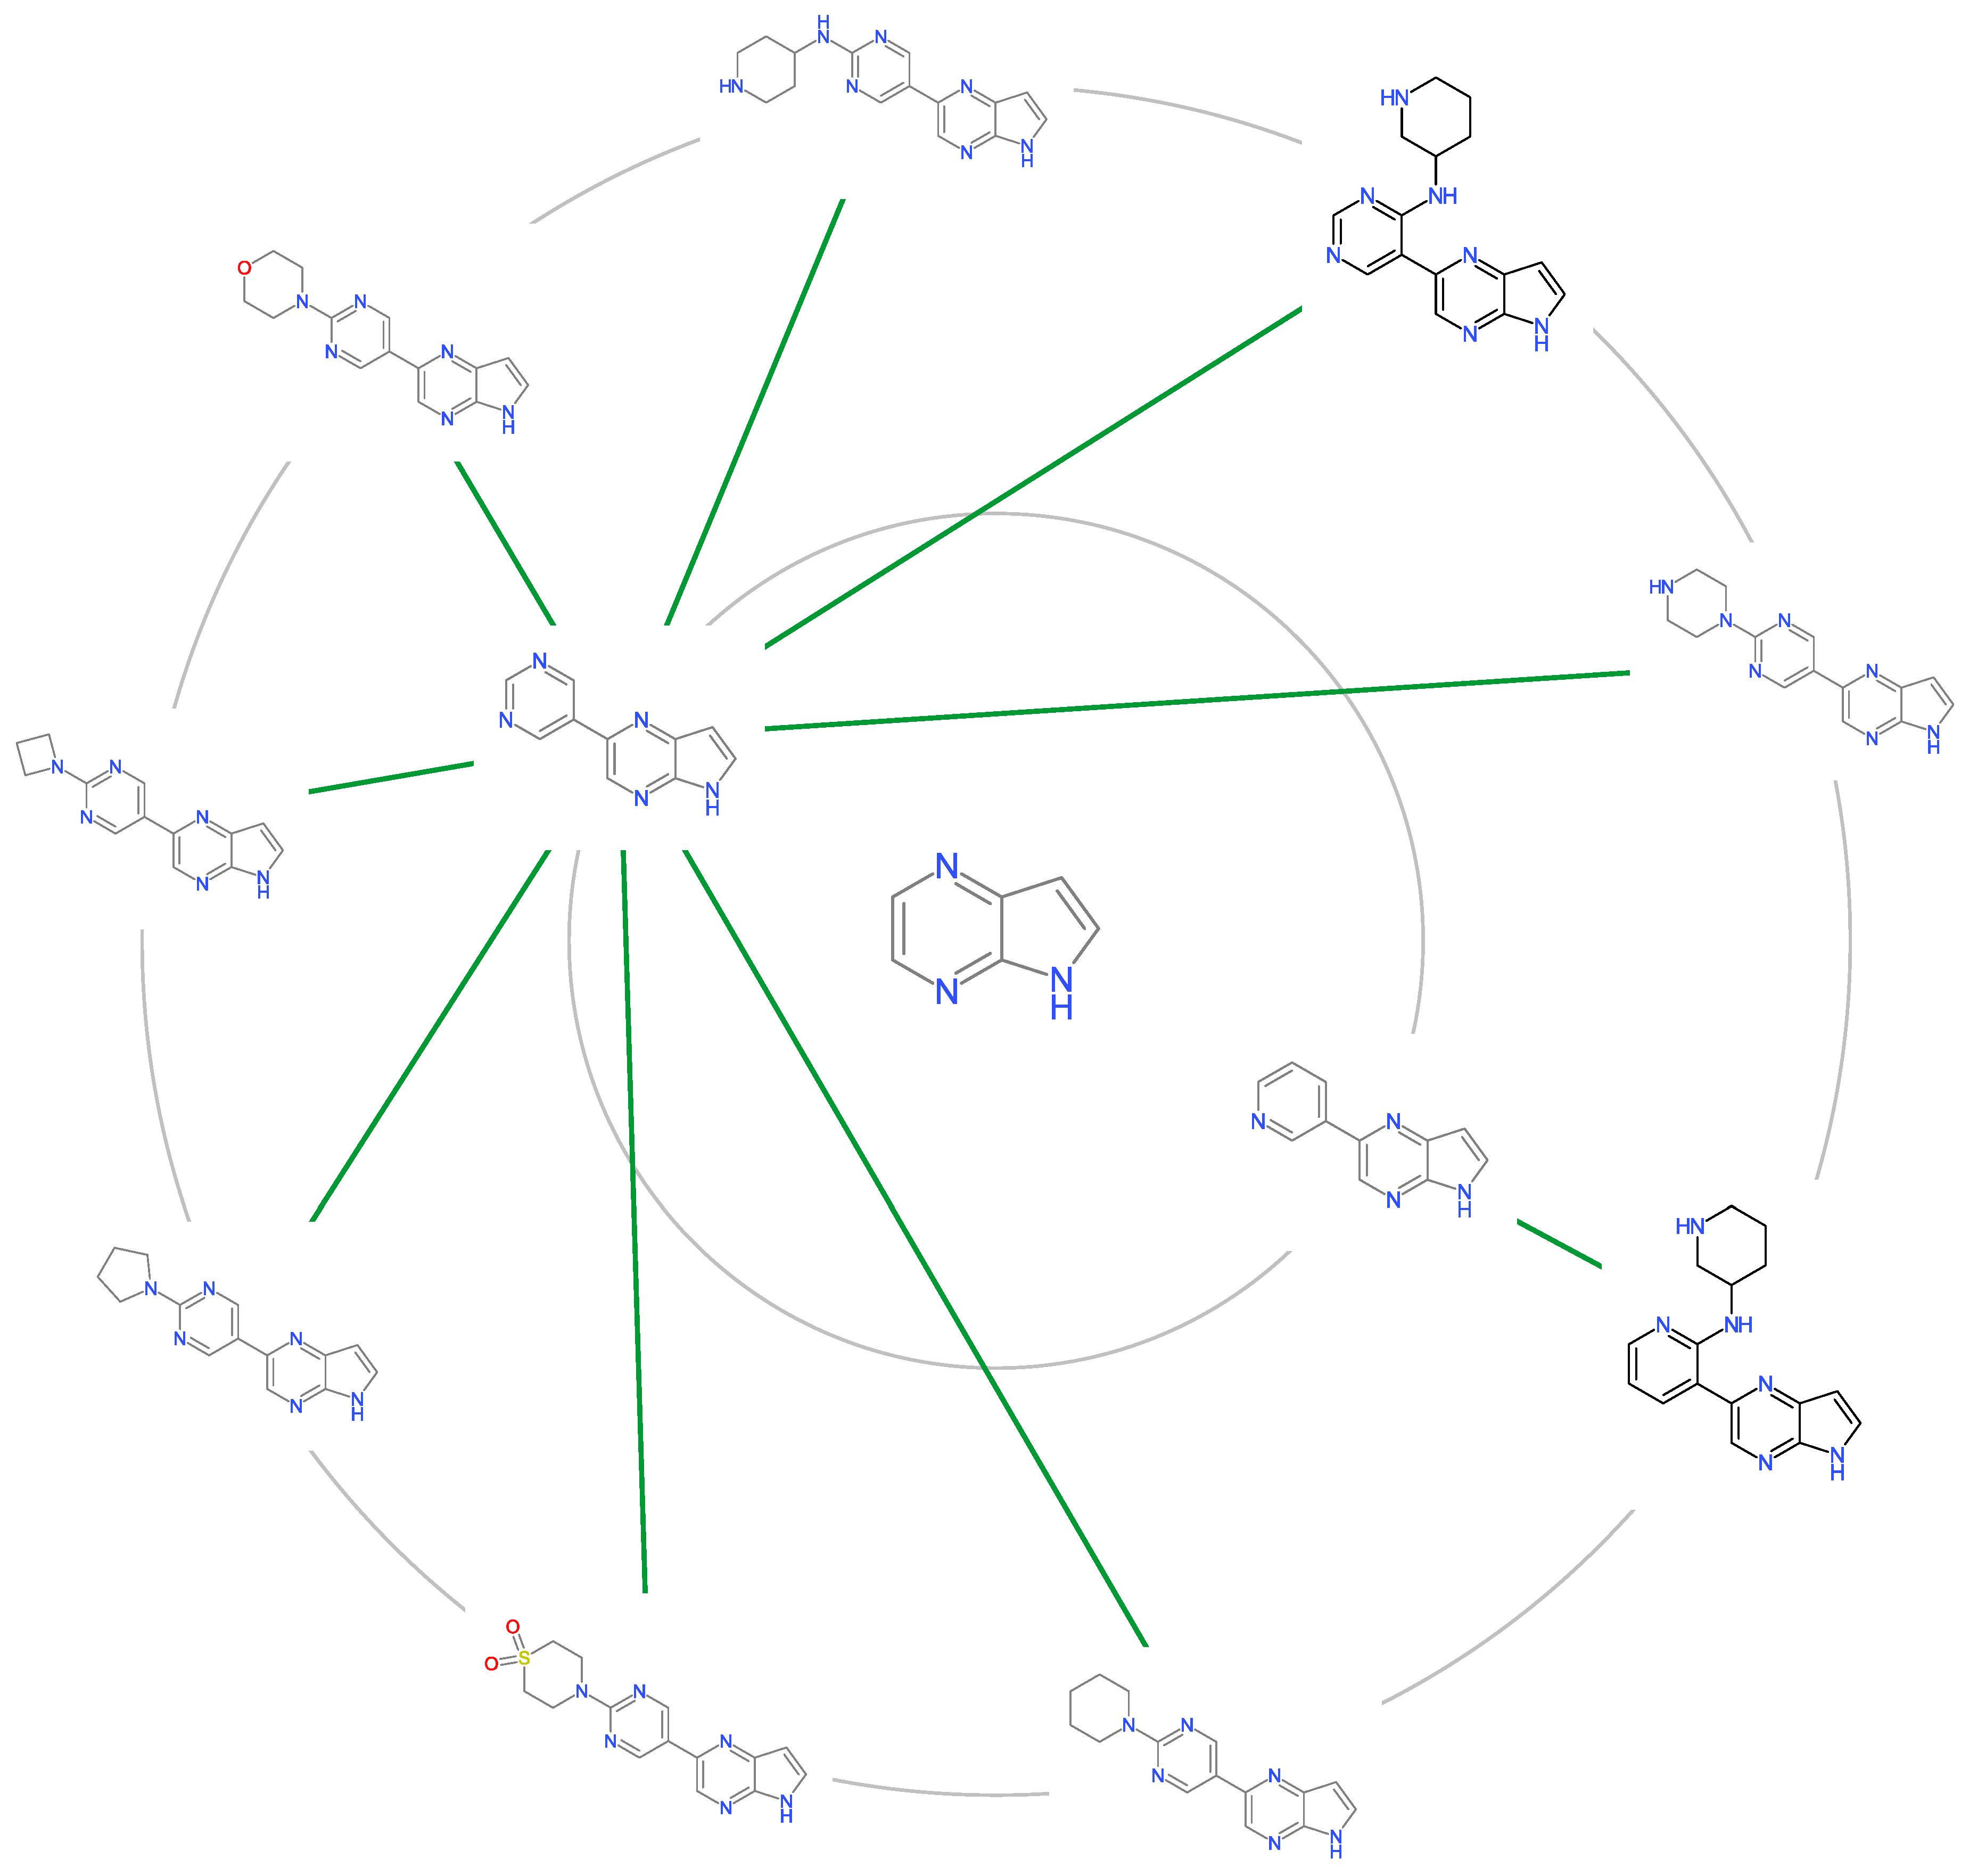
2.5. Molecular Cluster Analysis of JAK2 Inhibitors

To identify privileged scaffolds, cheminformatics approach was utilized to deduce privileged scaffolds giving rise to high inhibitory activities against JAK2. Privileged substructures are a concept introduced in which they are capable of making compounds that display potency for more than one receptor, providing viable alternatives when searching for new receptor inhibitors [50].
Scaffolds analysis is performed with the following steps: (1) compounds are clustered within the Tanimoto Similarity of 0.80 (2) clusters N > 19 are retained for further analysis (3) mean pIC 50 of each clusters are compared to the mean of JAK inhibitors (4) scaffolds are prioritized in terms of how much higher mean of the cluster when compared to mean of the dataset. Table 4 showed the mean pIC 50 of each cluster in which cluster 5 and 6 have a nanomolar potency. A few exemplars can be purchased for each scaffolds for future screening in designing potent drugs candidates against JAK2 (Figure 7).

3. Materials and Methods
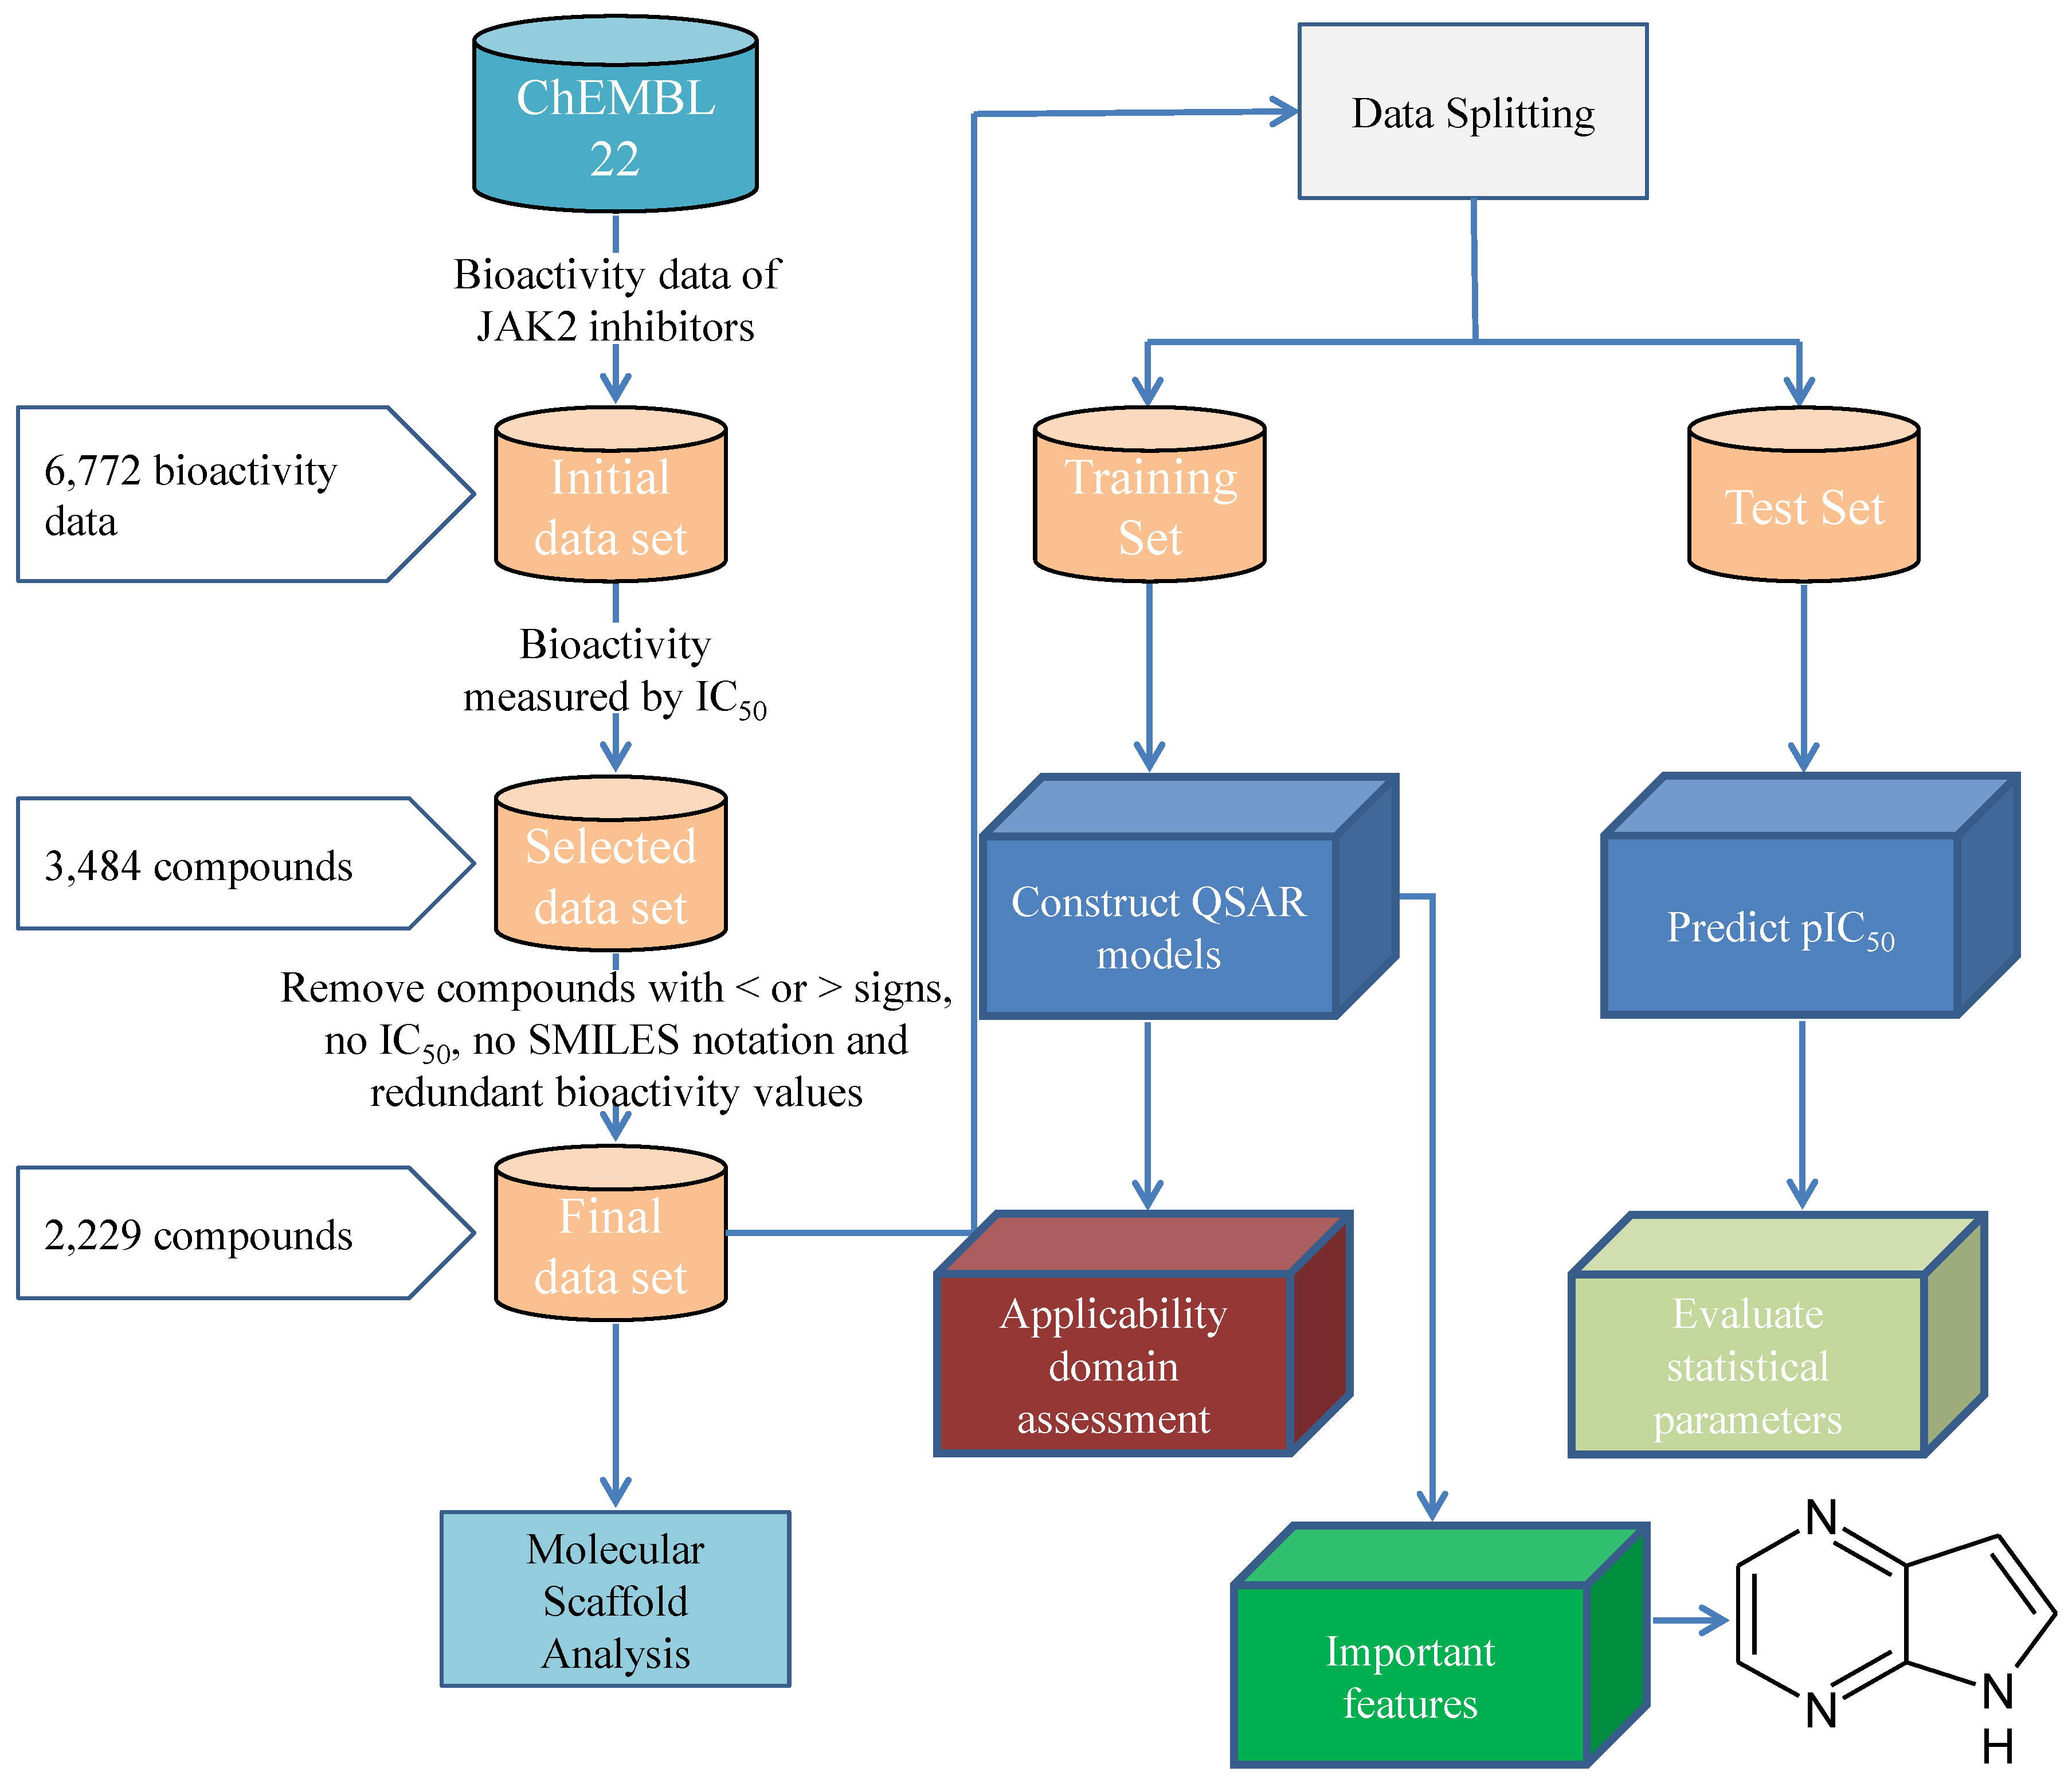
3.1. Data Set

A data set of inhibitors against the human JAK2 were compiled from the ChEMBL 22 database, which is comprised of a total number of 6772 bioactivity data points from 3906 compounds [51]. Compounds were treated with the QSAR curation workflow from Fourches et al. [52]. SMILES notations were treated with the ChemAxon’s Standardizer with the following options: Strip Salts, Aromatize, Clean 3D, Tautomerize, Neutralize, or Remove explicit hydrogens [53]. IC 50 was selected for further investigation from the initial data set which possess several bioactivity measurement units (including IC 50 , Ki, % activity, % inhibition, MIC, EC50 etc) because it constitutes largest subset with 3484 compounds. Moreover, compounds with without reported IC 50 values or having lesser/greater than signs were removed, resulting in 2229 compounds. The workflow for the JAK2 QSAR Modelling is shown in the Figure 8.

3.1.1. Description of Compounds

Understanding biological, chemical and physical properties of chemical compounds is a central issue in pharmaceutical bioinformatics. With what accuracy this bioactivity can be predicted solely depends on how chemical compounds are described. Several molecular descriptors have been introduced with the aim of finding the most suited descriptors to relate these properties [54,55,56,57,58]. Here, substructure fingerprint [59] count was utilized to describe the JAK2 inhibitors using PaDEL-Descriptor software [60].

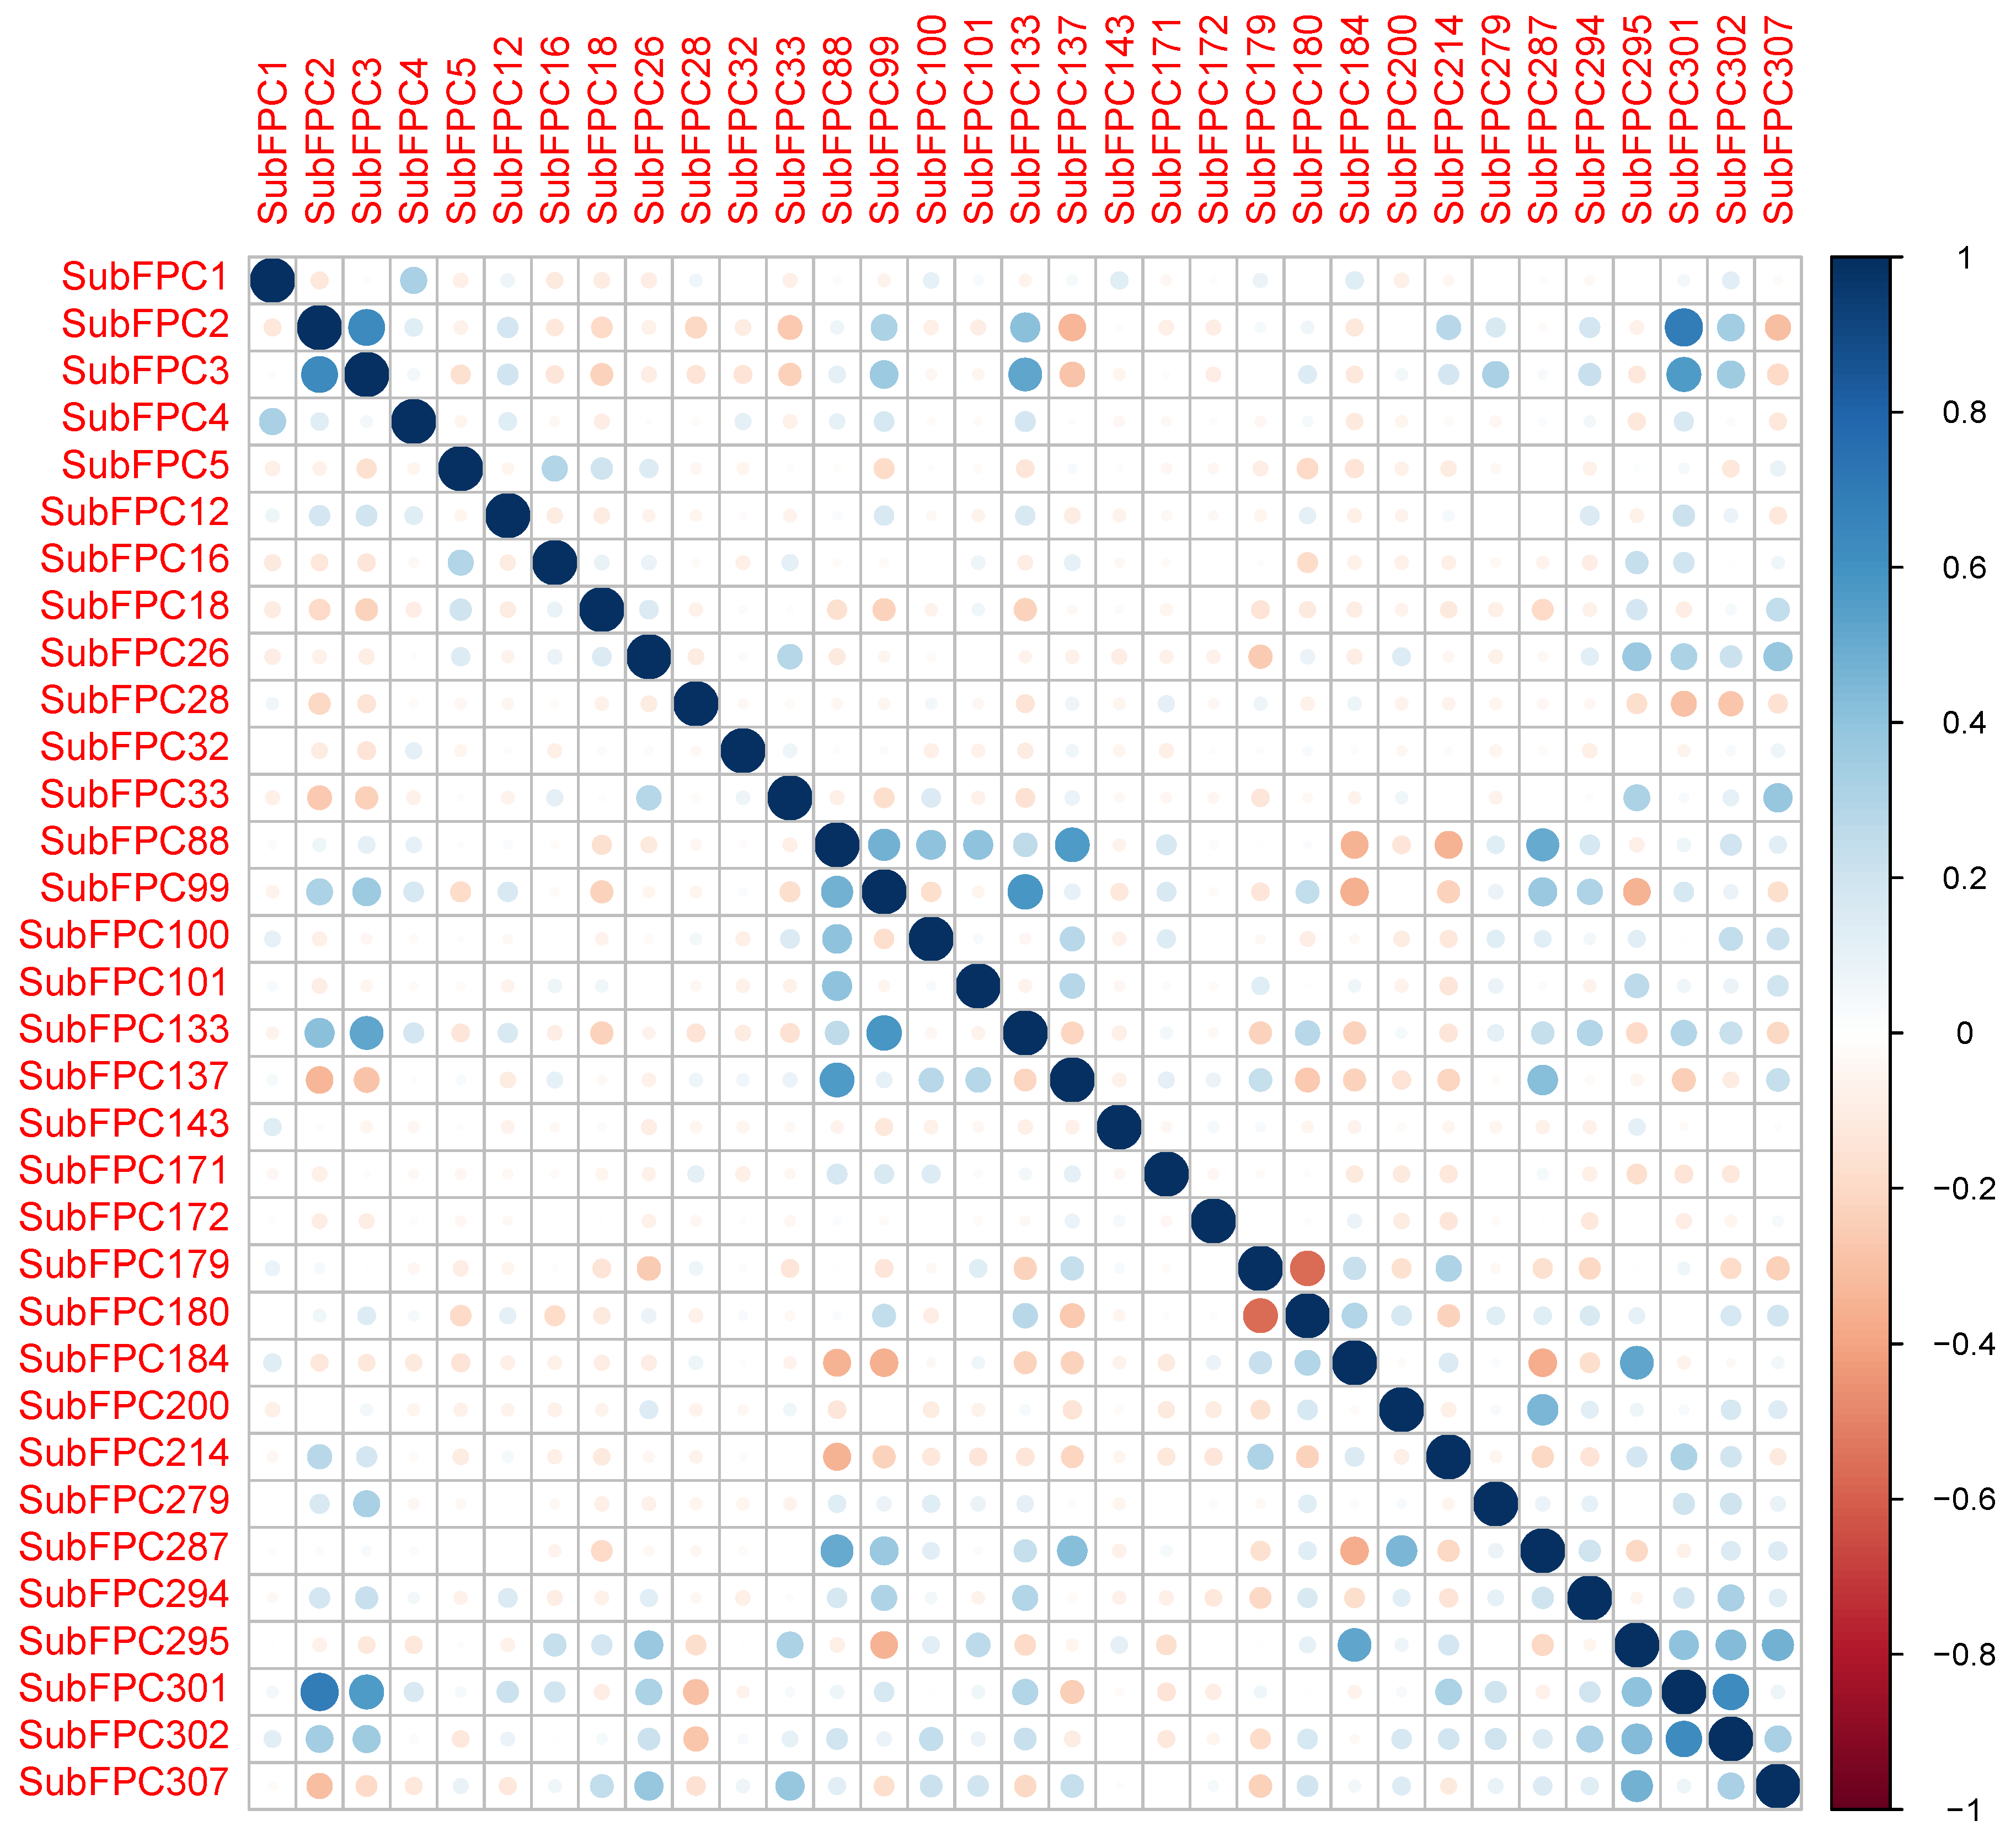
3.1.2. Feature Selection

Collinearity is a condition where a pair of descriptors have a substantial correlation with each other. In general, it is desirable to avoid data with highly correlated predictors. Not only do redundant predictors frequently add more complexity to the model than the information they provide to the model, which adds computational cost and time, but they also over-fit the model [61,62]. Over-fitting means the model will usually have poor accuracy when predicting a new sample. Additionally, it also affects the interpretation of descriptors because the resulting coefficient estimates or feature usages are highly unstable [63]. In general, a Pearson’s correlation coefficient of 0.7 is an indicator of high collinearity among predictors [64]. Thus, cor function from the R package stats was used to calculate correlations among descriptors. To obtain filtered descriptors with all pairwise correlations less than 0.7, the findCorrelation function from the R package caret with a cutoff at 70% was used [65]. The remaining descriptors used in the study are shown in the Figure 9.

3.1.3. Data Splitting

To avoid the bias that may arise from a single split when creating training models [66], predictive models were constructed from each of the 100 independent data splitting and the mean and standard deviation values of statistical parameters were reported. The dataset was randomly split (80%/20%) into training and independent test set. The sample function from the R base package was used to split the data [67]. Briefly, the sample function from R based is utilized to provide index numbers of rows for 80% as a training index from the whole data set. To obtain the training set, the training data index obtained from the sample function is utilized as index number to extract rows using brackets while the remaining rows (20%) were used as testing set.

3.1.4. Multivariate Analysis

Supervised learning enables the model to make prediction about unseen or future data by learning from labeled training data. Regression models were constructed for the prediction of the continuous response variables as a function of predictors.
Decision Tree (DT) is a rule-based algorithm in which construction involves top steps, which are growing and pruning. Growing starts from root node which are branches out to form internal nodes. Internal nodes represent descriptors, branches describe descriptors value sand leaf nodes represent dependent variables (i.e., pIC 50 ). The tree is reduced to a set of rules, which are eliminated via pruning for simplification. Advantage of pruning is that it reduces the complexity of the formed free and reduces the chance of over fitting. The rpart function from the R package rpart was used to build the QSAR models [68].
Support vector machine (SVM) is a machine learning that can be used to perform both classification and regression in which kernel function is used to map the data into high dimensional feature space. Commonly used guassian radial basis was used to build the model. The svm function from R package e1071 was utilized to build QSAR models [69].
Deep neural network (DNN) is a method that imitate human brain comprising networks of interconnected neurons that function in relaying message in the form of electrochemical signals. DNN maps inputs to a target through a deep sequence of simple data transformations. The sequential model from R package keras was used to build QSAR models [70].
Random forest (RF) is an ensemble model that is comprised of multiple decision trees. Optimal tuning parameters (i.e., mtry) for RF were obtained by training the model with different ranges accompanied with 10-fold cross-validation. The randomForest function from the R package randomForest is used [71].

3.2. Validation of QSAR Models

Model validation is an essential process for assessing the performance of the predictive model. The following statistical metrics were used to evaluate the performance of the QSAR models: coefficient of determination ( R 2 ) [72], root mean squared error (RMSE) [73], r m 2 [74] and Δ r m 2 [74] as well as mean absolue error (MAE) [75]. The R 2 and RMSE are commonly utilized metric to assess the model performance. r m 2 and Δ r m 2 metrics were used to verify the robustness of the proposed QSAR model where an acceptable QSAR model should give r m 2 > 0.5. Furthermore, 10-fold cross-validation, test set validation and Y-scrambling test were used to verify the predictive performance of the QSAR models.
The 10-fold cross-validation technique is one of the most frequent statistical evaluation in which 10 percent of data is left out as a test set while the remaining data is used to build model (Q 2 ) [76]. This process is iterated until all the data has been left out as a test set. Y-scrambling test was also undertaken to assess the relationship between R 2 and Q 2 to rule of the possibility of chance correlation [40]. The original Y-dependent variable (i.e., pIC 50 ) was randomly shuffled with respect to their associated independent variables (i.e., fingerprint descriptors).

3.3. Applicability Domain Analysis

The applicability domain is an essential concept in QSAR which can be used to estimate the uncertainty in prediction of a particular molecule based on the distance to the compounds used to build the model [77]. Leverage approach was utilized to identify whether a new compound will lie within or outside the domain, which was previously described [78]. The leverage is the distance between a molecule and the centroid of the space of training set. If a compound has standardized error of greater than 3 or less than -3 or higher than h * then the prediction the compound is unreliable. The h * can be computed using the following equation:
h * = 3 ( p + 1 ) n
where p is the number of substructure fingerprint count and n is the number of samples in the training set.

3.4. Molecular Cluster Analysis

Binning clustering was utilized to cluster compounds in which the Tanimoto similarity cutoff is set at 0.8 to ensure that similar chemotypes are clustered in each group. The cmp.cluster function from the R package ChemmineR was employed to cluster the chemical structures [79]. Singletons were excluded as they do not provide information. The top cluster biased towards activity is annotated based on the Murcko Framework and displayed using the Scaffold Hunter [80].

4. Conclusions

Computational approaches for predicting the activities of JAK2 inhibitors can facilitate drug discovery efforts by saving cost and time. QSAR modeling was performed using the substructure fingerprint descriptors as an input to determine the importance on the inhibitory properties of the JAK2, which provided excellent predictive performance for both cross-validation and the test set. By utilizing the Gini Index of RF, heteroaromatic substituents (i.e. heteroaromatic ring, 1,5-tautomerizable hetrocyclis and rotatable bond) are shown to have significant weight in improving the potency of the JAK2 inhibitors. Molecular cluster analysis revealed that pyrazine scaffolds have nanomolar potency against JAK2. Such insights can provide a better understanding of the origin of the JAK2 inhibitory properties and may be used as a reference for designing novel modulators.

Supplementary Materials

The following are available online at https://0-www-mdpi-com.brum.beds.ac.uk/1420-3049/24/23/4393/s1, Table S1: Compounds falling outside the applicability domain of the model as deduced from the Williams plot.

Author Contributions

Conceptualization: of overall study, N.J.: of data preprocessing, S.S. Data analysis: S.S., N.J. Writing: original draft preparation, S.S., N.J.; Reviewing and Editing, N.J.; all authors approved the final submitted manuscript.

Funding

The work was financially supported by Science and Technology Research Institute, King Mongkut’s University of Technology North Bangkok (Grant No. KMUTNB-62-DRIVE-029).

Conflicts of Interest

The authors declare no conflict of interest regarding the publication of this paper.

Abbreviations

The following abbreviations are used in this manuscript:
JAK2Janus Kinase 2
QSARQuantitative Structure-Activity Relationship
DTDecision Tree
SVMSupport Vector Machine
DNNDeep Neural Network
RFRandom Forest
RMSERoot Mean Square Error
CVCross Validation
OECDOrganisation for Economic Cooperation and Development
MWMolecular Weight
ALogPOctanol-Water Partition Coefficient
nHBDonNumber of Hydrogen Bond Donors
nHBAccNumber of Hydrogen Bond Acceptors

References

  1. Miao, Q.; Ma, K.; Chen, D.; Wu, X.; Jiang, S. Targeting tropomyosin receptor kinase for cancer therapy. Eur. J. Med. Chem. 2019. [Google Scholar] [CrossRef] [PubMed]
  2. Yu, H.; Jove, R. The STATs of cancer—New molecular targets come of age. Nat. Rev. Cancer 2004, 4, 97–105. [Google Scholar] [CrossRef] [PubMed]
  3. Meyer, S.C. Mechanisms of resistance to JAK2 inhibitors in myeloproliferative neoplasms. Hematol. Clin. 2017, 31, 627–642. [Google Scholar] [CrossRef] [PubMed]
  4. Quintás-Cardama, A. The role of Janus kinase 2 (JAK2) in myeloproliferative neoplasms: Therapeutic implications. Leuk. Res. 2013, 37, 465–472. [Google Scholar] [CrossRef]
  5. Ghoreschi, K.; Laurence, A.; O’Shea, J.J. Selectivity and therapeutic inhibition of kinases: To be or not to be? Nat. Immunol. 2009, 10, 356–360. [Google Scholar] [CrossRef]
  6. Britschgi, A.; Radimerski, T.; Bentires-Alj, M. Targeting PI3K, HER2 and the IL-8/JAK2 axis in metastatic breast cancer: Which combination makes the whole greater than the sum of its parts? Drug Resist. Updat. 2013, 16, 68–72. [Google Scholar] [CrossRef]
  7. Verma, A.; Kambhampati, S.; Parmar, S.; Platanias, L.C. Jak family of kinases in cancer. Cancer Metastasis Rev. 2003, 22, 423–434. [Google Scholar] [CrossRef]
  8. Chen, Q.; Luo, H.; Zhang, C.; Chen, Y.P.P. Bioinformatics in protein kinases regulatory network and drug discovery. Math. Biosci. 2015, 262, 147–156. [Google Scholar] [CrossRef]
  9. Singh, P.K.; Singh, H.; Silakari, O. Kinases inhibitors in lung cancer: From benchside to bedside. Biochim. Et Biophys. Acta (BBA)-Rev. Cancer 2016, 1866, 128–140. [Google Scholar] [CrossRef]
  10. Santos, F.P.; Verstovsek, S. Therapy with JAK2 inhibitors for myeloproliferative neoplasms. Hematol. Clin. 2012, 26, 1083–1099. [Google Scholar] [CrossRef]
  11. Santos, F.P.; Verstovsek, S. JAK2 inhibitors: Are they the solution? Clin. Lymphoma Myeloma Leuk. 2011, 11, S28–S36. [Google Scholar] [CrossRef] [PubMed]
  12. Harrison, C.; Kiladjian, J.J.; Al-Ali, H.K.; Gisslinger, H.; Waltzman, R.; Stalbovskaya, V.; McQuitty, M.; Hunter, D.S.; Levy, R.; Knoops, L.; et al. JAK inhibition with ruxolitinib versus best available therapy for myelofibrosis. N. Engl. J. Med. 2012, 366, 787–798. [Google Scholar] [CrossRef] [PubMed]
  13. Hatzimichael, E.; Georgiou, G.; Benetatos, L.; Briasoulis, E. Gene mutations and molecularly targeted therapies in acute myeloid leukemia. Am. J. Blood Res. 2013, 3, 29–51. [Google Scholar] [PubMed]
  14. Simeon, S.; Möller, R.; Almgren, D.; Li, H.; Phanus-umporn, C.; Prachayasittikul, V.; Bülow, L.; Nantasenamat, C. Unraveling the origin of splice switching activity of hemoglobin β-globin gene modulators via QSAR modeling. Chemom. Intell. Lab. Syst. 2016, 151, 51–60. [Google Scholar] [CrossRef]
  15. Hao, C.-Z.; Xia, S.-W.; Wang, H.; Xue, J.; Yu, L. Using 3D-QSAR and molecular docking insight into inhibitors binding with complex-associated kinases CDK8. J. Mol. Struct. 2018, 1173, 498–511. [Google Scholar] [CrossRef]
  16. Aouidate, A.; Ghaleb, A.; Ghamali, M.; Ousaa, A.; Choukrad, M.; Sbai, A.; Bouachrine, M.; Lakhlifi, T. 3D QSAR studies, molecular docking and ADMET evaluation, using thiazolidine derivatives as template to obtain new inhibitors of PIM1 kinase. Comput. Biol. Chem. 2018, 74, 201–211. [Google Scholar] [CrossRef]
  17. Divya, V.; Pushpa, V.; Sarithamol, S.; Manoj, K. Computational approach for generating robust models for discovering novel molecules as Cyclin Dependent Kinase 4 inhibitors. J. Mol. Graph. Model. 2018, 82, 48–58. [Google Scholar] [CrossRef]
  18. Shahin, R.; Mansi, I.; Swellmeen, L.; Alwidyan, T.; Al-Hashimi, N.; Al-Qarar’h, Y.; Shaheen, O. Ligand-based computer aided drug design reveals new tropomycin receptor kinase a (TrkA) inhibitors. J. Mol. Graph. Model. 2018, 80, 327–352. [Google Scholar] [CrossRef]
  19. Schöning, V.; Krähenbühl, S.; Drewe, J. The hepatotoxic potential of protein kinase inhibitors predicted with Random Forest and Artificial Neural Networks. Toxicol. Lett. 2018, 299, 145–148. [Google Scholar] [CrossRef]
  20. Rampogu, S.; Son, M.; Baek, A.; Park, C.; Rana, R.M.; Zeb, A.; Parameswaran, S.; Lee, K.W. Targeting natural compounds against HER2 kinase domain as potential anticancer drugs applying pharmacophore based molecular modelling approaches. Comput. Biol. Chem. 2018, 74, 327–338. [Google Scholar] [CrossRef]
  21. Li, D.D.; Meng, X.F.; Wang, Q.; Yu, P.; Zhao, L.G.; Zhang, Z.P.; Wang, Z.Z.; Xiao, W. Consensus scoring model for the molecular docking study of mTOR kinase inhibitor. J. Mol. Graph. Model. 2018, 79, 81–87. [Google Scholar] [CrossRef] [PubMed]
  22. Jasuja, H.; Chadha, N.; Singh, P.K.; Kaur, M.; Bahia, M.S.; Silakari, O. Putative dual inhibitors of Janus kinase 1 and 3 (JAK1/3): Pharmacophore based hierarchical virtual screening. Comput. Biol. Chem. 2018, 76, 109–117. [Google Scholar] [CrossRef] [PubMed]
  23. Singh, K.D.; Karthikeyan, M.; Kirubakaran, P.; Nagamani, S. Pharmacophore filtering and 3D-QSAR in the discovery of new JAK2 inhibitors. J. Mol. Graph. Model. 2011, 30, 186–197. [Google Scholar] [CrossRef] [PubMed]
  24. Jasuja, H.; Chadha, N.; Kaur, M.; Silakari, O. Dual inhibitors of Janus kinase 2 and 3 (JAK2/3): Designing by pharmacophore-and docking-based virtual screening approach. Mol. Divers. 2014, 18, 253–267. [Google Scholar] [CrossRef] [PubMed]
  25. Singh, K.D.; Naveena, Q.; Karthikeyan, M. Jak2 inhibitor–a jackpot for pharmaceutical industries: A comprehensive computational method in the discovery of new potent Jak2 inhibitors. Mol. BioSystems 2014, 10, 2146–2159. [Google Scholar] [CrossRef]
  26. Gade, D.R.; Kunala, P.; Raavi, D.; Reddy, P.K.; Prasad, R.V. Structural insights of JAK2 inhibitors: Pharmacophore modeling and ligand-based 3D-QSAR studies of pyrido-indole derivatives. J. Recept. Signal Transduct. 2015, 35, 189–201. [Google Scholar] [CrossRef]
  27. Wu, X.; Wan, S.; Zhang, J. Three Dimensional Quantitative Structure-Activity Relationship of 5H-Pyrido [4, 3-b] indol-4-carboxamide JAK2 Inhibitors. Int. J. Mol. Sci. 2013, 14, 12037–12053. [Google Scholar] [CrossRef]
  28. Chekkara, R.; Susithra, E.; Kandakatla, N.; Gorla, V.R.; Tenkayala, S.R. Pharmacophore generation and atom-based 3D-QSAR analysis of substituted aromatic bicyclic compounds containing pyrimidine and pyridine rings as Janus kinase 2 (JAK2) inhibitors. J. Chem. Pharm. Res. 2014, 6, 1146–1152. [Google Scholar]
  29. Chekkara, R.; Gorla, V.R.; Tenkayala, S.R.; Susithra, E. 2, 4-Diamino-1, 3, 5-Triazine Derivatives as Janus Kinase 2 (JAK2) inhibitors: Pharmacophore modeling, atom-based 3d-qsar and molecular docking study. Indo Am. J. Pharm. Res. 2015, 5, 2127–2135. [Google Scholar]
  30. Yao, T.T.; Xie, J.F.; Liu, X.G.; Cheng, J.L.; Zhu, C.Y.; Zhao, J.H.; Dong, X.W. Integration of pharmacophore mapping and molecular docking in sequential virtual screening: Towards the discovery of novel JAK2 inhibitors. RSC Adv. 2017, 7, 10353–10360. [Google Scholar] [CrossRef]
  31. Sathe, R.Y.; Kulkarni, S.A.; Sella, R.N.; Madhavan, T. Computational identification of JAK2 inhibitors: A combined pharmacophore mapping and molecular docking approach. Med. Chem. Res. 2015, 24, 1449–1467. [Google Scholar] [CrossRef]
  32. Itteboina, R.; Ballu, S.; Sivan, S.K.; Manga, V. Molecular docking, 3D QSAR and dynamics simulation studies of imidazo-pyrrolopyridines as janus kinase 1 (JAK 1) inhibitors. Comput. Biol. Chem. 2016, 64, 33–46. [Google Scholar] [CrossRef] [PubMed]
  33. Rajeswari, M.; Santhi, N.; Bhuvaneswari, V. Pharmacophore and Virtual Screening of JAK3 inhibitors. Bioinformation 2014, 10, 157. [Google Scholar] [CrossRef] [PubMed] [Green Version]
  34. Wang, J.L.; Cheng, L.P.; Wang, T.C.; Deng, W.; Wu, F.H. Molecular modeling study of CP-690550 derivatives as JAK3 kinase inhibitors through combined 3D-QSAR, molecular docking, and dynamics simulation techniques. J. Mol. Graph. Model. 2017, 72, 178–186. [Google Scholar] [CrossRef] [PubMed]
  35. Sang, Y.L.; Duan, Y.T.; Qiu, H.Y.; Wang, P.F.; Makawana, J.A.; Wang, Z.C.; Zhu, H.L.; He, Z.X. Design, synthesis, biological evaluation and molecular docking of novel metronidazole derivatives as selective and potent JAK3 inhibitors. RSC Adv. 2014, 4, 16694–16704. [Google Scholar] [CrossRef]
  36. Marzaro, G.; Chilin, A.; Guiotto, A.; Uriarte, E.; Brun, P.; Castagliuolo, I.; Tonus, F.; González-Díaz, H. Using the TOPS-MODE approach to fit multi-target QSAR models for tyrosine kinases inhibitors. Eur. J. Med. Chem. 2011, 46, 2185–2192. [Google Scholar] [CrossRef]
  37. Speck-Planche, A.; Cordeiro, M.N.D. Fragment-based in silico modeling of multi-target inhibitors against breast cancer-related proteins. Mol. Divers. 2017, 21, 511–523. [Google Scholar] [CrossRef]
  38. Ambure, P.; Halder, A.K.; González-Díaz, H.; Dias Soeiro Cordeiro, M.N.D. QSAR-Co: An Open Source Software for Developing Robust Multi-tasking or Multi-target Classification-Based QSAR Models. J. Chem. Inf. Model. 2019. [Google Scholar] [CrossRef]
  39. Kuseva, C.; Schultz, T.W.; Yordanova, D.; Tankova, K.; Kutsarova, S.; Pavlov, T.; Chapkanov, A.; Georgiev, M.; Gissi, A.; Sobanski, T.; et al. The implementation of RAAF in the OECD QSAR Toolbox. Regul. Toxicol. Pharmacol. 2019, 105, 51–61. [Google Scholar] [CrossRef]
  40. Eriksson, L.; Jaworska, J.; Worth, A.P.; Cronin, M.T.; McDowell, R.M.; Gramatica, P. Methods for reliability and uncertainty assessment and for applicability evaluations of classification-and regression-based QSARs. Environ. Health Perspect. 2003, 111, 1361. [Google Scholar] [CrossRef] [Green Version]
  41. Tropsha, A.; Gramatica, P.; Gombar, V.K. The importance of being earnest: Validation is the absolute essential for successful application and interpretation of QSPR models. QSAR Comb. Sci. 2003, 22, 69–77. [Google Scholar] [CrossRef]
  42. Eriksson, L.; Johansson, E. Multivariate design and modeling in QSAR. Chemom. Intell. Lab. Syst. 1996, 34, 1–19. [Google Scholar] [CrossRef]
  43. Mesa, R.A.; Yasothan, U.; Kirkpatrick, P. Ruxolitinib. Nat. Rev. Drug Discov. 2012, 11, 103–104. [Google Scholar] [CrossRef] [PubMed]
  44. Kaur, K.; Kalra, S.; Kaushal, S. Systematic review of tofacitinib: A new drug for the management of rheumatoid arthritis. Clin. Ther. 2014, 36, 1074–1086. [Google Scholar] [CrossRef] [PubMed]
  45. Markham, A. Baricitinib: First global approval. Drugs 2017, 77, 697–704. [Google Scholar] [CrossRef]
  46. Williams, R. Discontinued in 2013: Oncology drugs. Expert Opin. Investig. Drugs 2015, 24, 95–110. [Google Scholar] [CrossRef]
  47. Leroy, E.; Constantinescu, S.N. Rethinking JAK2 inhibition: Towards novel strategies of more specific and versatile janus kinase inhibition. Leukemia 2017, 31, 1023. [Google Scholar] [CrossRef]
  48. Jismy, B.; Allouchi, H.; Guillaumet, G.; Akssira, M.; Abarbri, M. An Efficient Synthesis of New 7-Trifluoromethyl-2, 5-disubstituted Pyrazolo [1, 5-a] pyrimidines. Synthesis 2018, 50, 1675–1686. [Google Scholar]
  49. Apsel, B.; Blair, J.A.; Gonzalez, B.; Nazif, T.M.; Feldman, M.E.; Aizenstein, B.; Hoffman, R.; Williams, R.L.; Shokat, K.M.; Knight, Z.A. Targeted polypharmacology: Discovery of dual inhibitors of tyrosine and phosphoinositide kinases. Nat. Chem. Biol. 2008, 4, 691. [Google Scholar] [CrossRef] [Green Version]
  50. Schnur, D.M.; Hermsmeier, M.A.; Tebben, A.J. Are target-family-privileged substructures truly privileged? J. Med. Chem. 2006, 49, 2000–2009. [Google Scholar] [CrossRef]
  51. Gaulton, A.; Bellis, L.J.; Bento, A.P.; Chambers, J.; Davies, M.; Hersey, A.; Light, Y.; McGlinchey, S.; Michalovich, D.; Al-Lazikani, B.; et al. ChEMBL: A large-scale bioactivity database for drug discovery. Nucleic Acids Res. 2012, 40, D1100–D1107. [Google Scholar] [CrossRef] [PubMed] [Green Version]
  52. Fourches, D.; Muratov, E.; Tropsha, A. Trust, but verify: On the importance of chemical structure curation in cheminformatics and QSAR modeling research. J. Chem. Inf. Model. 2010, 50, 1189–1204. [Google Scholar] [CrossRef] [PubMed]
  53. Standardizer. Version 15.9.14.0 Software; ChemAxon: Budapest, Hungary, 2010. [Google Scholar]
  54. Khan, A.U. Descriptors and their selection methods in QSAR analysis: Paradigm for drug design. Drug Discov. Today 2016, 21, 1291–1302. [Google Scholar]
  55. Tuppurainen, K. Frontier orbital energies, hydrophobicity and steric factors as physical QSAR descriptors of molecular mutagenicity. A review with a case study: MX compounds. Chemosphere 1999, 38, 3015–3030. [Google Scholar] [CrossRef]
  56. Abraham, M.H.; Acree, W.E., Jr. Descriptors for ions and ion-pairs for use in linear free energy relationships. J. Chromatogr. A 2016, 1430, 2–14. [Google Scholar] [CrossRef]
  57. Caron, G.; Reymond, F.; Carrupt, P.A.; Girault, H.H.; Testa, B. Combined molecular lipophilicity descriptors and their role in understanding intramolecular effects. Pharm. Sci. Technol. Today 1999, 2, 327–335. [Google Scholar] [CrossRef]
  58. Fey, N.; Orpen, A.G.; Harvey, J.N. Building ligand knowledge bases for organometallic chemistry: Computational description of phosphorus (III)-donor ligands and the metal–phosphorus bond. Coord. Chem. Rev. 2009, 253, 704–722. [Google Scholar] [CrossRef]
  59. Laggner, C. SMARTS Patterns for Functional Group Classification; Inte: Ligand Software-Entwicklungs und Consulting GmbH: Maria Enzersdorf, Austria, 2005. [Google Scholar]
  60. Yap, C.W. PaDEL-descriptor: An open source software to calculate molecular descriptors and fingerprints. J. Comput. Chem. 2011, 32, 1466–1474. [Google Scholar] [CrossRef]
  61. Cronin, M.T.; Schultz, T.W. Pitfalls in QSAR. J. Mol. Struct. 2003, 622, 39–51. [Google Scholar] [CrossRef]
  62. Tomaschek, F.; Hendrix, P.; Baayen, R.H. Strategies for addressing collinearity in multivariate linguistic data. J. Phon. 2018, 71, 249–267. [Google Scholar] [CrossRef]
  63. Tušar, T.; Gantar, K.; Koblar, V.; Ženko, B.; Filipič, B. A study of overfitting in optimization of a manufacturing quality control procedure. Appl. Soft Comput. 2017, 59, 77–87. [Google Scholar] [CrossRef]
  64. Booth, G.D.; Niccolucci, M.J.; Schuster, E.G. Identifying Proxy Sets in Multiple Linear Regression: An Aid to Better Coefficient Interpretation; Research Paper INT-470; United States Department of Agriculture, Forest Service: Ogden, UT, USA, 1994.
  65. Kuhn, M. Building predictive models in R using the caret package. J. Stat. Softw. 2008, 28, 1–26. [Google Scholar] [CrossRef] [Green Version]
  66. Puzyn, T.; Mostrag-Szlichtyng, A.; Gajewicz, A.; Skrzyński, M.; Worth, A.P. Investigating the influence of data splitting on the predictive ability of QSAR/QSPR models. Struct. Chem. 2011, 22, 795–804. [Google Scholar] [CrossRef] [Green Version]
  67. Team, R.C. R: A Language and Environment for Statistical Computing; R Foundation for Statistical Computing: Vienna, Austria, 2018. [Google Scholar]
  68. Therneau, T.; Atkinson, B.; Ripley, B.; Ripley, M.B. Package ‘rpart’. Available online: https://cran.r-project.org/web/packages/rpart/rpart.pdf (accessed on 20 April 2019).
  69. Dimitriadou, E.; Hornik, K.; Leisch, F.; Meyer, D.; Weingessel, A. Misc Functions of the Department of Statistics, Probability Theory Group (Formerly: E1071), TU Wien. Available online: https://cran.r-project.org/web/packages/e1071/e1071.pdf (accessed on 13 August 2019).
  70. Falbel, D.; Allaire, J.; Chollet, F.; Tang, Y.; Van Der Bijl, W.; Studer, M.; Keydana, S. Keras: R Interface to ‘Keras’. Available online: https://cran.r-project.org/web/packages/keras/keras.pdf (accessed on 15 August 2019).
  71. Liaw, A.; Wiener, M. Classification and regression by randomForest. R News, 3 December 2002; 18–22. [Google Scholar]
  72. Alexander, D.L.; Tropsha, A.; Winkler, D.A. Beware of R2: Simple, unambiguous assessment of the prediction accuracy of QSAR and QSPR models. J. Chem. Inf. Model. 2015, 55, 1316–1322. [Google Scholar] [CrossRef] [PubMed] [Green Version]
  73. Gramatica, P.; Sangion, A. A historical excursus on the statistical validation parameters for QSAR models: A clarification concerning metrics and terminology. J. Chem. Inf. Model. 2016, 56, 1127–1131. [Google Scholar] [CrossRef]
  74. Roy, K.; Chakraborty, P.; Mitra, I.; Ojha, P.K.; Kar, S.; Das, R.N. Some case studies on application of “rm2” metrics for judging quality of quantitative structure–activity relationship predictions: Emphasis on scaling of response data. J. Comput. Chem. 2013, 34, 1071–1082. [Google Scholar] [CrossRef]
  75. Roy, K.; Das, R.N.; Ambure, P.; Aher, R.B. Be aware of error measures. Further studies on validation of predictive QSAR models. Chemom. Intell. Lab. Syst. 2016, 152, 18–33. [Google Scholar] [CrossRef]
  76. Todeschini, R.; Ballabio, D.; Grisoni, F. Beware of unreliable Q 2! A comparative study of regression metrics for predictivity assessment of QSAR models. J. Chem. Inf. Model. 2016, 56, 1905–1913. [Google Scholar] [CrossRef]
  77. Shacham, M.; Brauner, N.; Cholakov, G.S.; Stateva, R.P. Identifying applicability domains for quantitative structure property relationships. In Computer Aided Chemical Engineering; Elsevier: Amsterdam, The Netherlands, 2007; Volume 24, pp. 327–332. [Google Scholar]
  78. Simeon, S.; Anuwongcharoen, N.; Shoombuatong, W.; Malik, A.A.; Prachayasittikul, V.; Wikberg, J.E.; Nantasenamat, C. Probing the origins of human acetylcholinesterase inhibition via QSAR modeling and molecular docking. PeerJ 2016, 4, e2322. [Google Scholar] [CrossRef]
  79. Cao, Y.; Charisi, A.; Cheng, L.C.; Jiang, T.; Girke, T. ChemmineR: A compound mining framework for R. Bioinformatics 2008, 24, 1733–1734. [Google Scholar] [CrossRef] [Green Version]
  80. Schäfer, T.; Kriege, N.; Humbeck, L.; Klein, K.; Koch, O.; Mutzel, P. Scaffold Hunter: A comprehensive visual analytics framework for drug discovery. J. Cheminf. 2017, 9, 28. [Google Scholar] [CrossRef] [PubMed] [Green Version]
Sample Availability: Samples of the compounds are not available from the authors.
Figure 1. Chemical space of JAK2 inhibitors are shown as actives (green), inactives (red) and intermediates (blue).
Molecules 24 04393 g001
Figure 2. Box plot of the Linpiski’s descriptors actives (green), inactives (red) and intermediates (blue).
Molecules 24 04393 g002
Figure 3. Y-scrambling plot of pIC 50 as obtained from QSAR models after feature selection. The scrambled models in which the pIC 50 were randomly shuffled while keeping the descriptor matrix intact. The scrambled models were coloured as pink while the real model was coloured as green.
Molecules 24 04393 g003
Figure 4. Experimental vs Predicted plot of pIC 50 as obtained from QSAR models after feature selection. The training set and test set are shown as blue circles and red circles.
Molecules 24 04393 g004
Figure 5. Gini Index of RF from selected descriptors.
Molecules 24 04393 g005
Figure 6. William plot for the QSAR model built using RF in which the horizontal dashed line represent ± 3 standardized residual and vertical dashed line represent warning leverage value (h*) of 0.034. The blue dots represent training set and the red dots represent test set.
Molecules 24 04393 g006
Figure 7. Scaffold Tree of Cluster 6 having nanomolar potency against JAK2.
Molecules 24 04393 g007
Figure 8. Workflow for the JAK2 QSAR Modelling.
Molecules 24 04393 g008
Figure 9. Intercorrelation matrix of the descriptors utilized for constructing the predictive models.
Molecules 24 04393 g009
Table 1. Performance summary of QSAR Models for predicting pIC 50 using DT, SVM, DNN and RF.
ModelsTraining Set 10-Fold CV Test Set
R 2 RMSE r m 2 Δ r m 2 R 2 RMSE r m 2 Δ r m 2 R 2 RMSE r m 2 Δ r m 2
DT0.65 ± 0.020.72 ± 0.020.65 ± 0.020.28 ± 0.01 0.45 ± 0.070.91 ± 0.060.40 ± 0.090.20 ± 0.06 0.29 ± 0.051.02 ± 0.040.28 ± 0.050.31 ± 0.05
SVM0.72 ± 0.010.65 ± 0.020.66 ± 0.020.26 ± 0.01 0.57 ± 0.050.80 ± 0.060.54 ± 0.040.33 ± 0.03 0.58 ± 0.050.79 ± 0.050.56 ± 0.030.33 ± 0.02
DNN0.59 ± 0.040.82 ± 0.070.57 ± 0.040.32 ± 0.03 0.47 ± 0.070.93 ± 0.080.43 ± 0.070.29 ± 0.08 0.49 ± 0.040.90 ± 0.060.47 ± 0.040.31 ± 0.05
RF0.75 ± 0.020.62 ± 0.020.69 ± 0.010.24 ± 0.01 0.74 ± 0.050.63 ± 0.050.67 ± 0.040.25 ± 0.03 0.75 ± 0.030.62 ± 0.040.68 ± 0.030.25 ± 0.02
Table 2. MAE of QSAR Models for DT, SVM, ANN and RF.
Models Training Set 10-Fold CV Test Set
MAE MAE MAE
DT 0.53 ± 0.02 0.65 ± 0.05 0.76 ± 0.03
SVM 0.42 ± 0.02 0.55 ± 0.04 0.54 ± 0.03
DNN 0.64 ± 0.06 0.71 ± 0.07 0.70 ± 0.05
RF 0.42 ± 0.01 0.43 ± 0.04 0.42 ± 0.02
Table 3. A list of top substructure fingerprints and their descriptions.
FingerprintsDescription
SubFPC1Primary Carbon
SubFPC2Secondary Carbon
SubFPC3Tertiary Carbon
SubFPC4Quaternary Carbon
SubFPC5Alkene
SubFPC12Alcohol
SubFPC16Dialkylether
SubFPC18Alkylarylether
SubFPC26Tertiary Aliphalitic Amine
SubFPC28Primary Aromatic Amine
SubFPC32Secondary Mixed Amine
SubFPC33Tertiary Mixed Amine
SubFPC88Carboxylic Acid derivative
SubFPC99Primary Amide
SubFPC100Secondary Amide
SubFPC101Tertiary Amide
SubFPC133Nitrile
SubFPC137Vinylogous Ester
SubFPC143Carbonic Acid Derivatives
SubFPC171Arylchloride
SubFPC172Arylfluoride
SubFPC179Hetero N basic H
SubFPC180Hetero N basic no H
SubFPC184Heteroaromatic
SubFPC200Sulfon
SubFPC214Sulfonic Derivative
SubFPC279Annelated Rings
SubFPC287Spiro
SubFPC294Trifluoromethyl
SubFPC295C ONS Bond
SubFPC3011,5-Tautomerizable
SubFPC302Rotatable Bond
SubFPC307Chiral Center Specified
Table 4. Summary of the mean and standard deviation of pIC 50 , MW and AlogP along with their respective chemical clusters.
Cluster No.pIC 50 NMWAlogP
17.30 ± 1.12876456.11 ± 75.653.87 ± 1.16
27.57 ± 0.68491432.38 ± 58.913.59 ± 0.95
37.70 ± 0.81137455.01 ± 43.351.68 ± 0.99
46.98 ± 0.5223333.59 ± 55.502.01 ± 1.01
59.76 ± 0.7558385.45 ± 33.551.11 ± 0.69
610.04 ± 0.3238461.42 ± 44.550.74 ± 0.98
76.48 ± 0.4125436.48 ± 34.562.33 ± 0.95
88.12 ± 1.0925441.67 ± 24.853.78 ± 0.50
96.06 ± 0.8520287.99 ± 30.951.30 ± 1.59
106.97 ± 0.4424283.09 ± 15.281.68 ± 0.48

