
Higher Levels of Low Molecular Weight Sulfur Compounds and Homocysteine Thiolactone in the Urine of Autistic Children

 , , and
Abstract
:1. Introduction
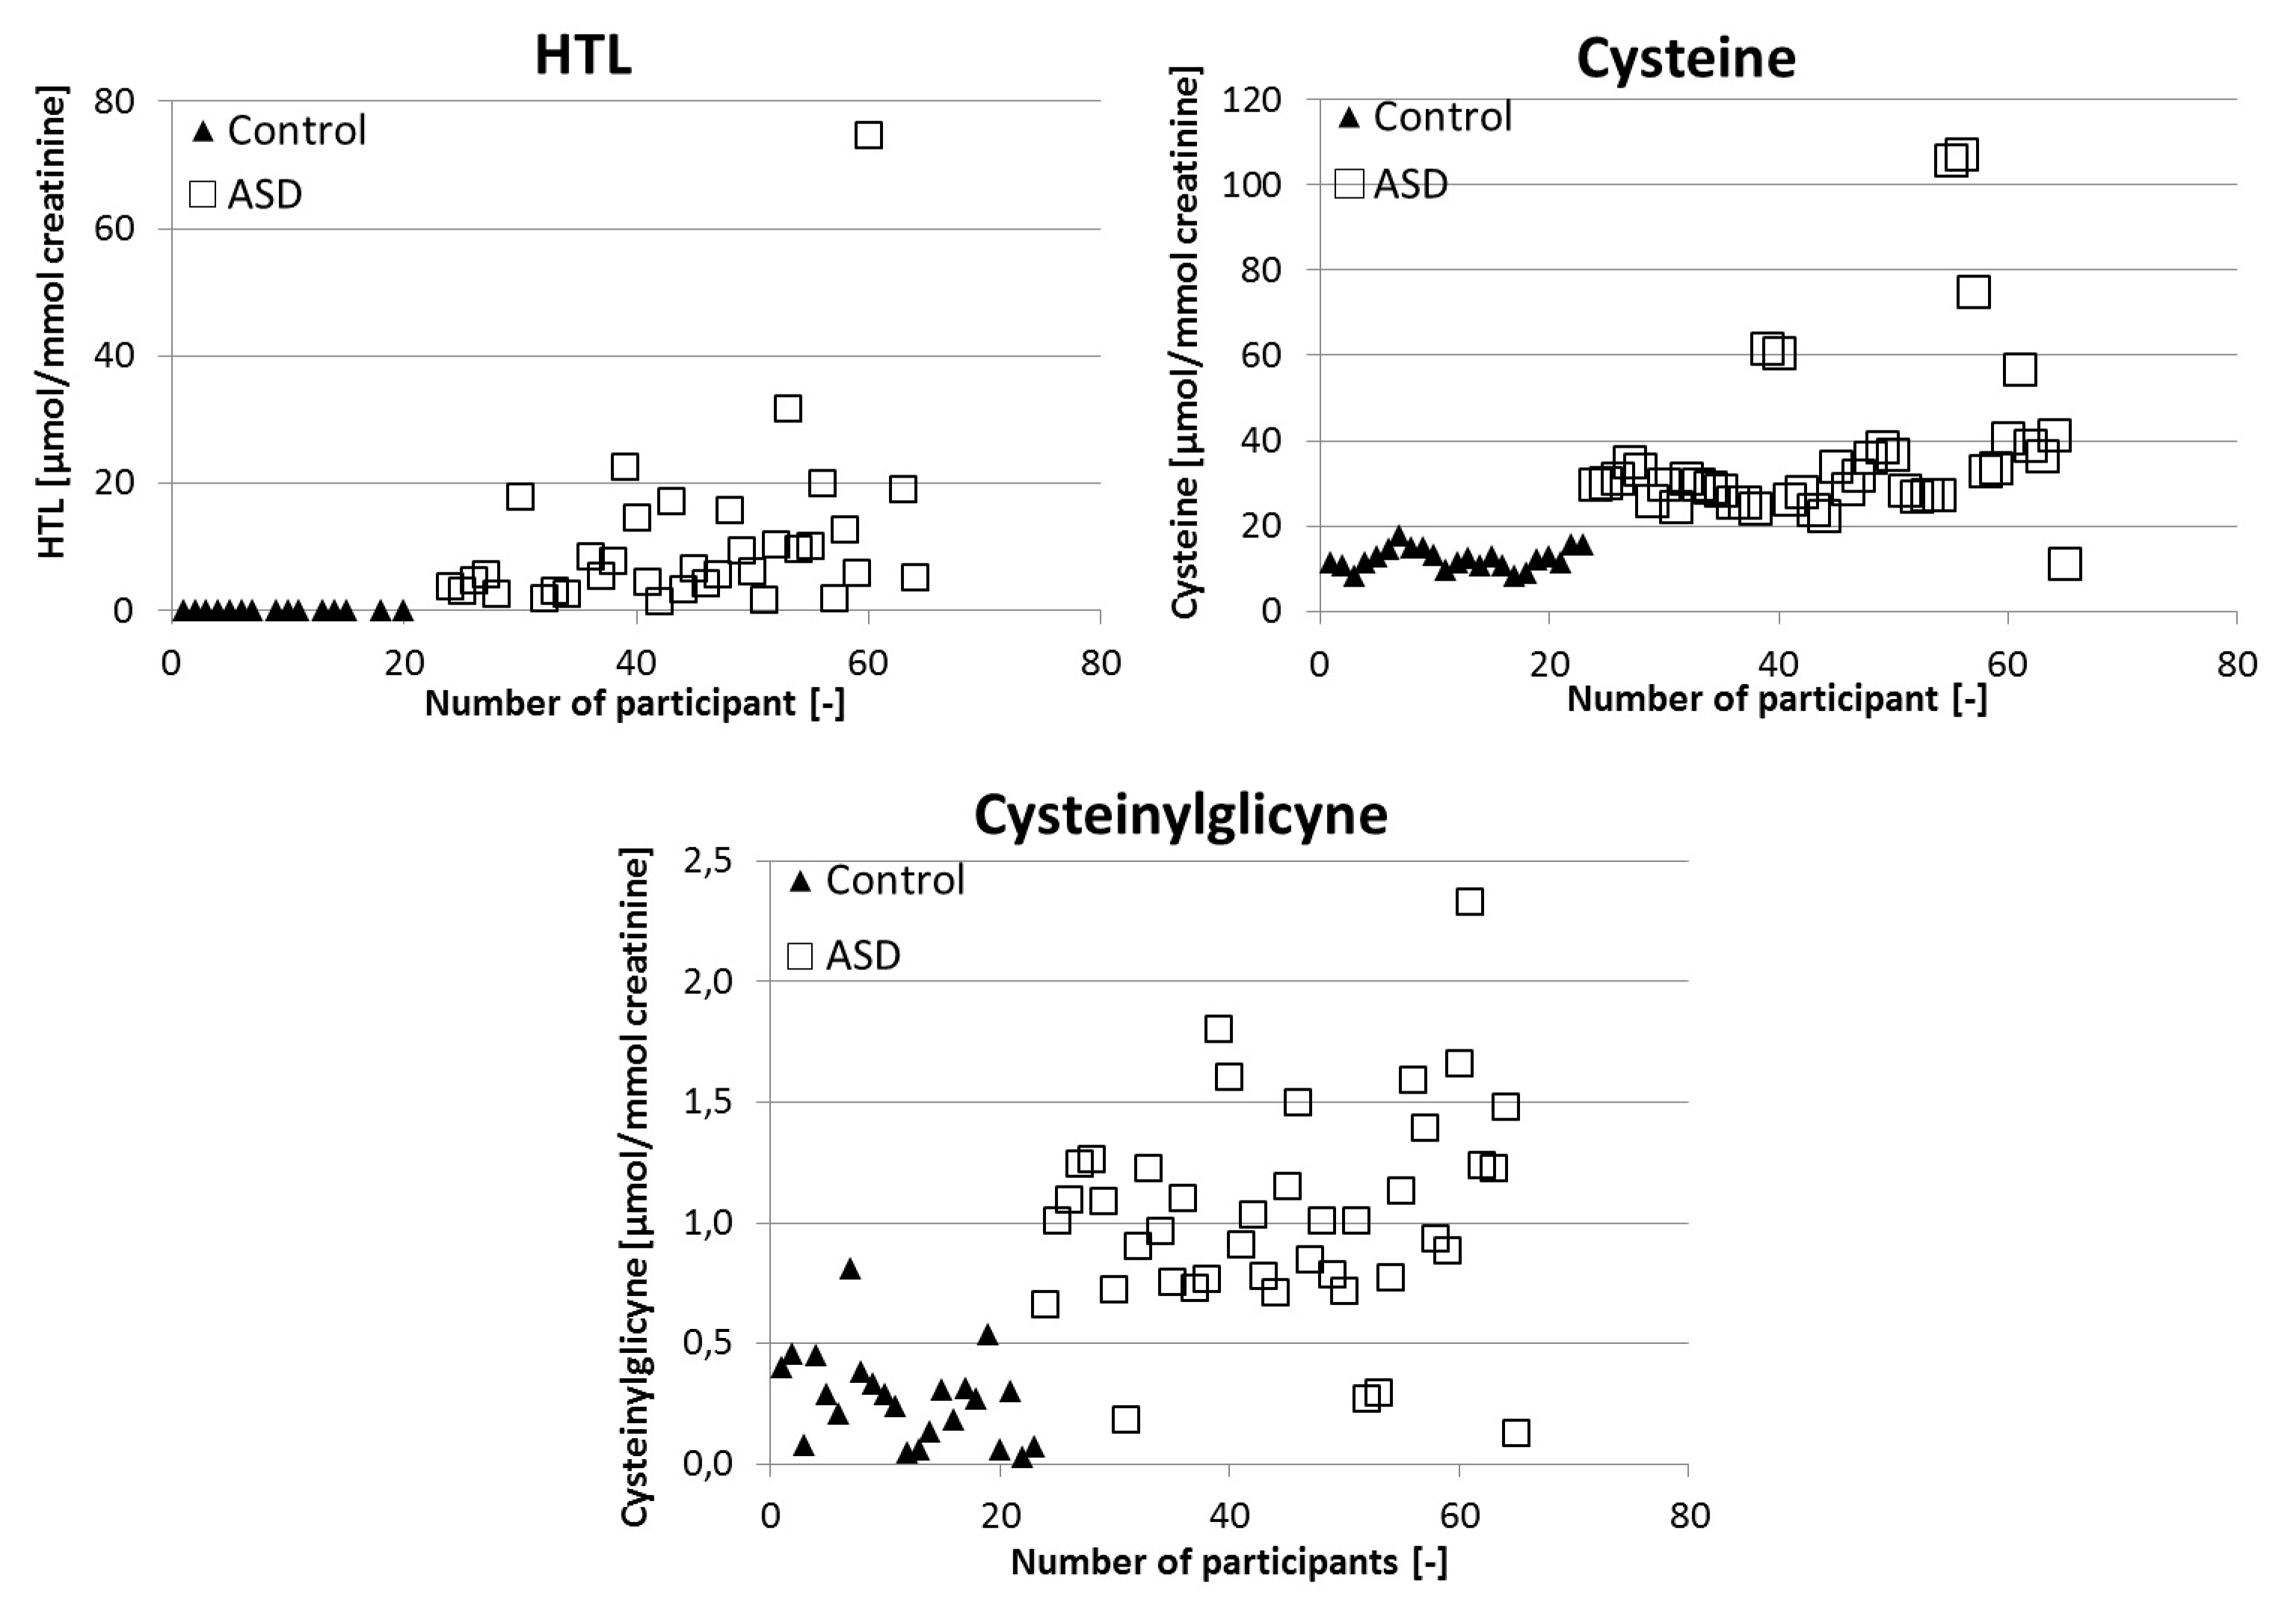
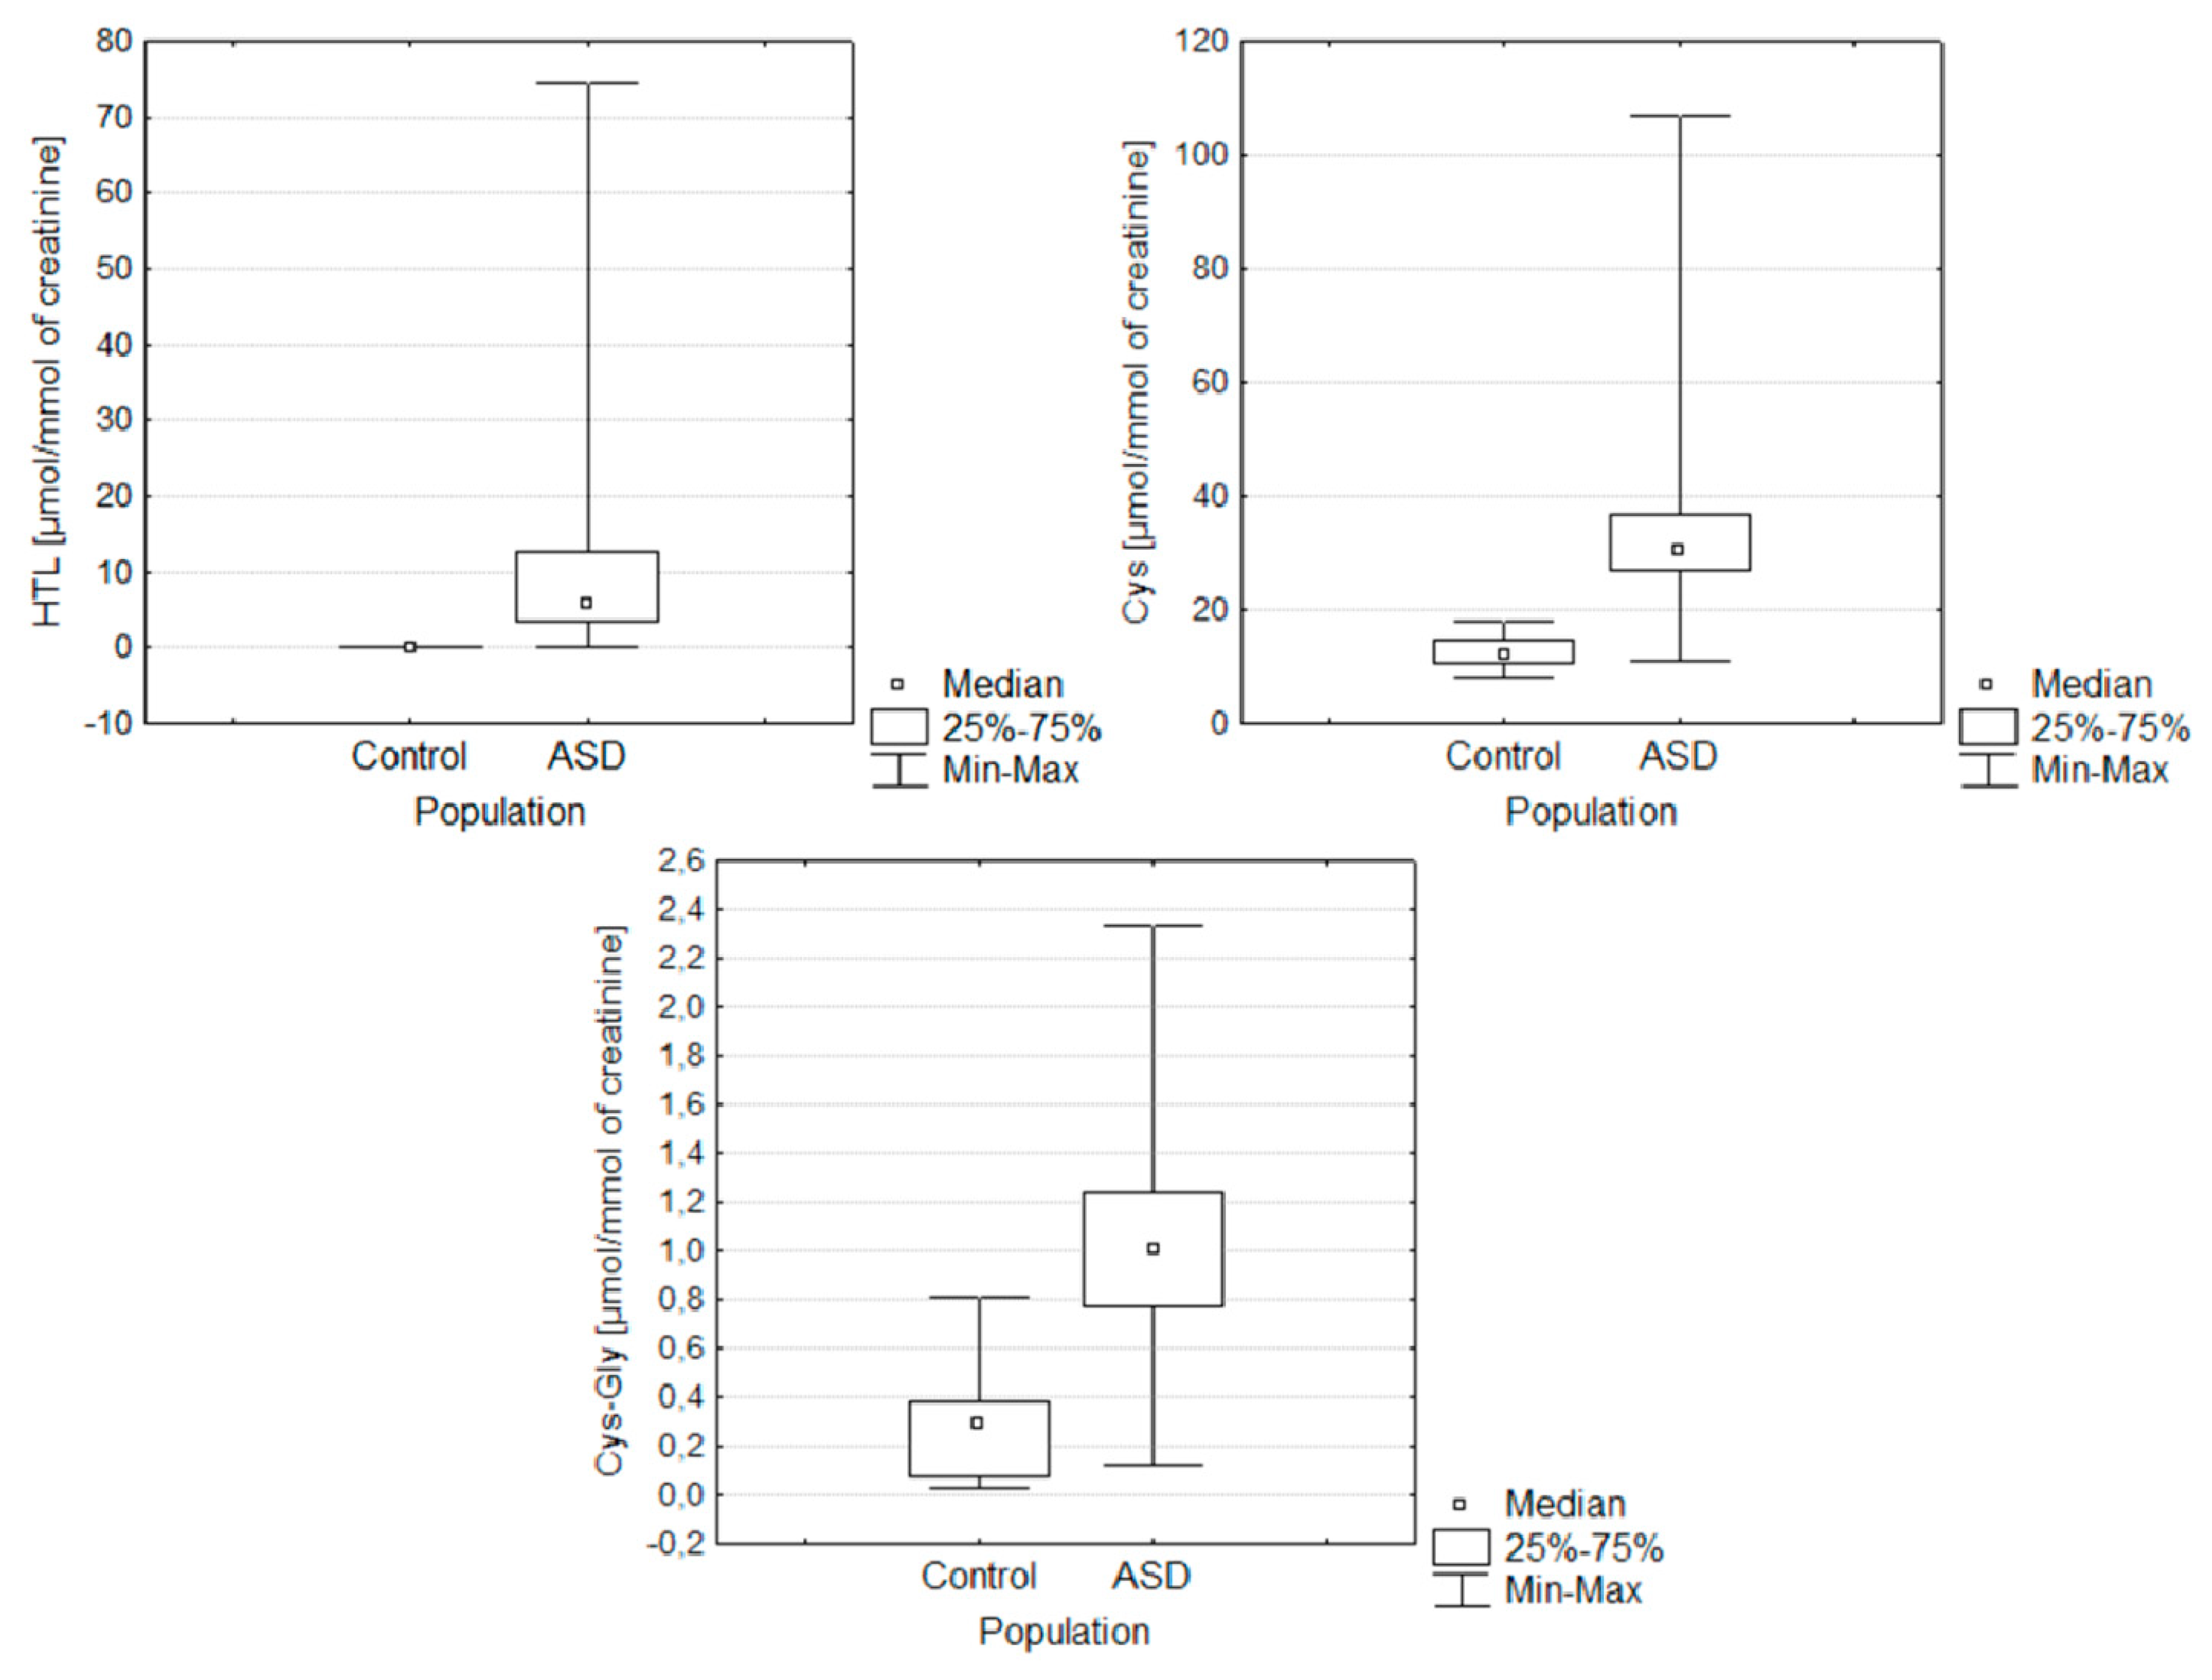
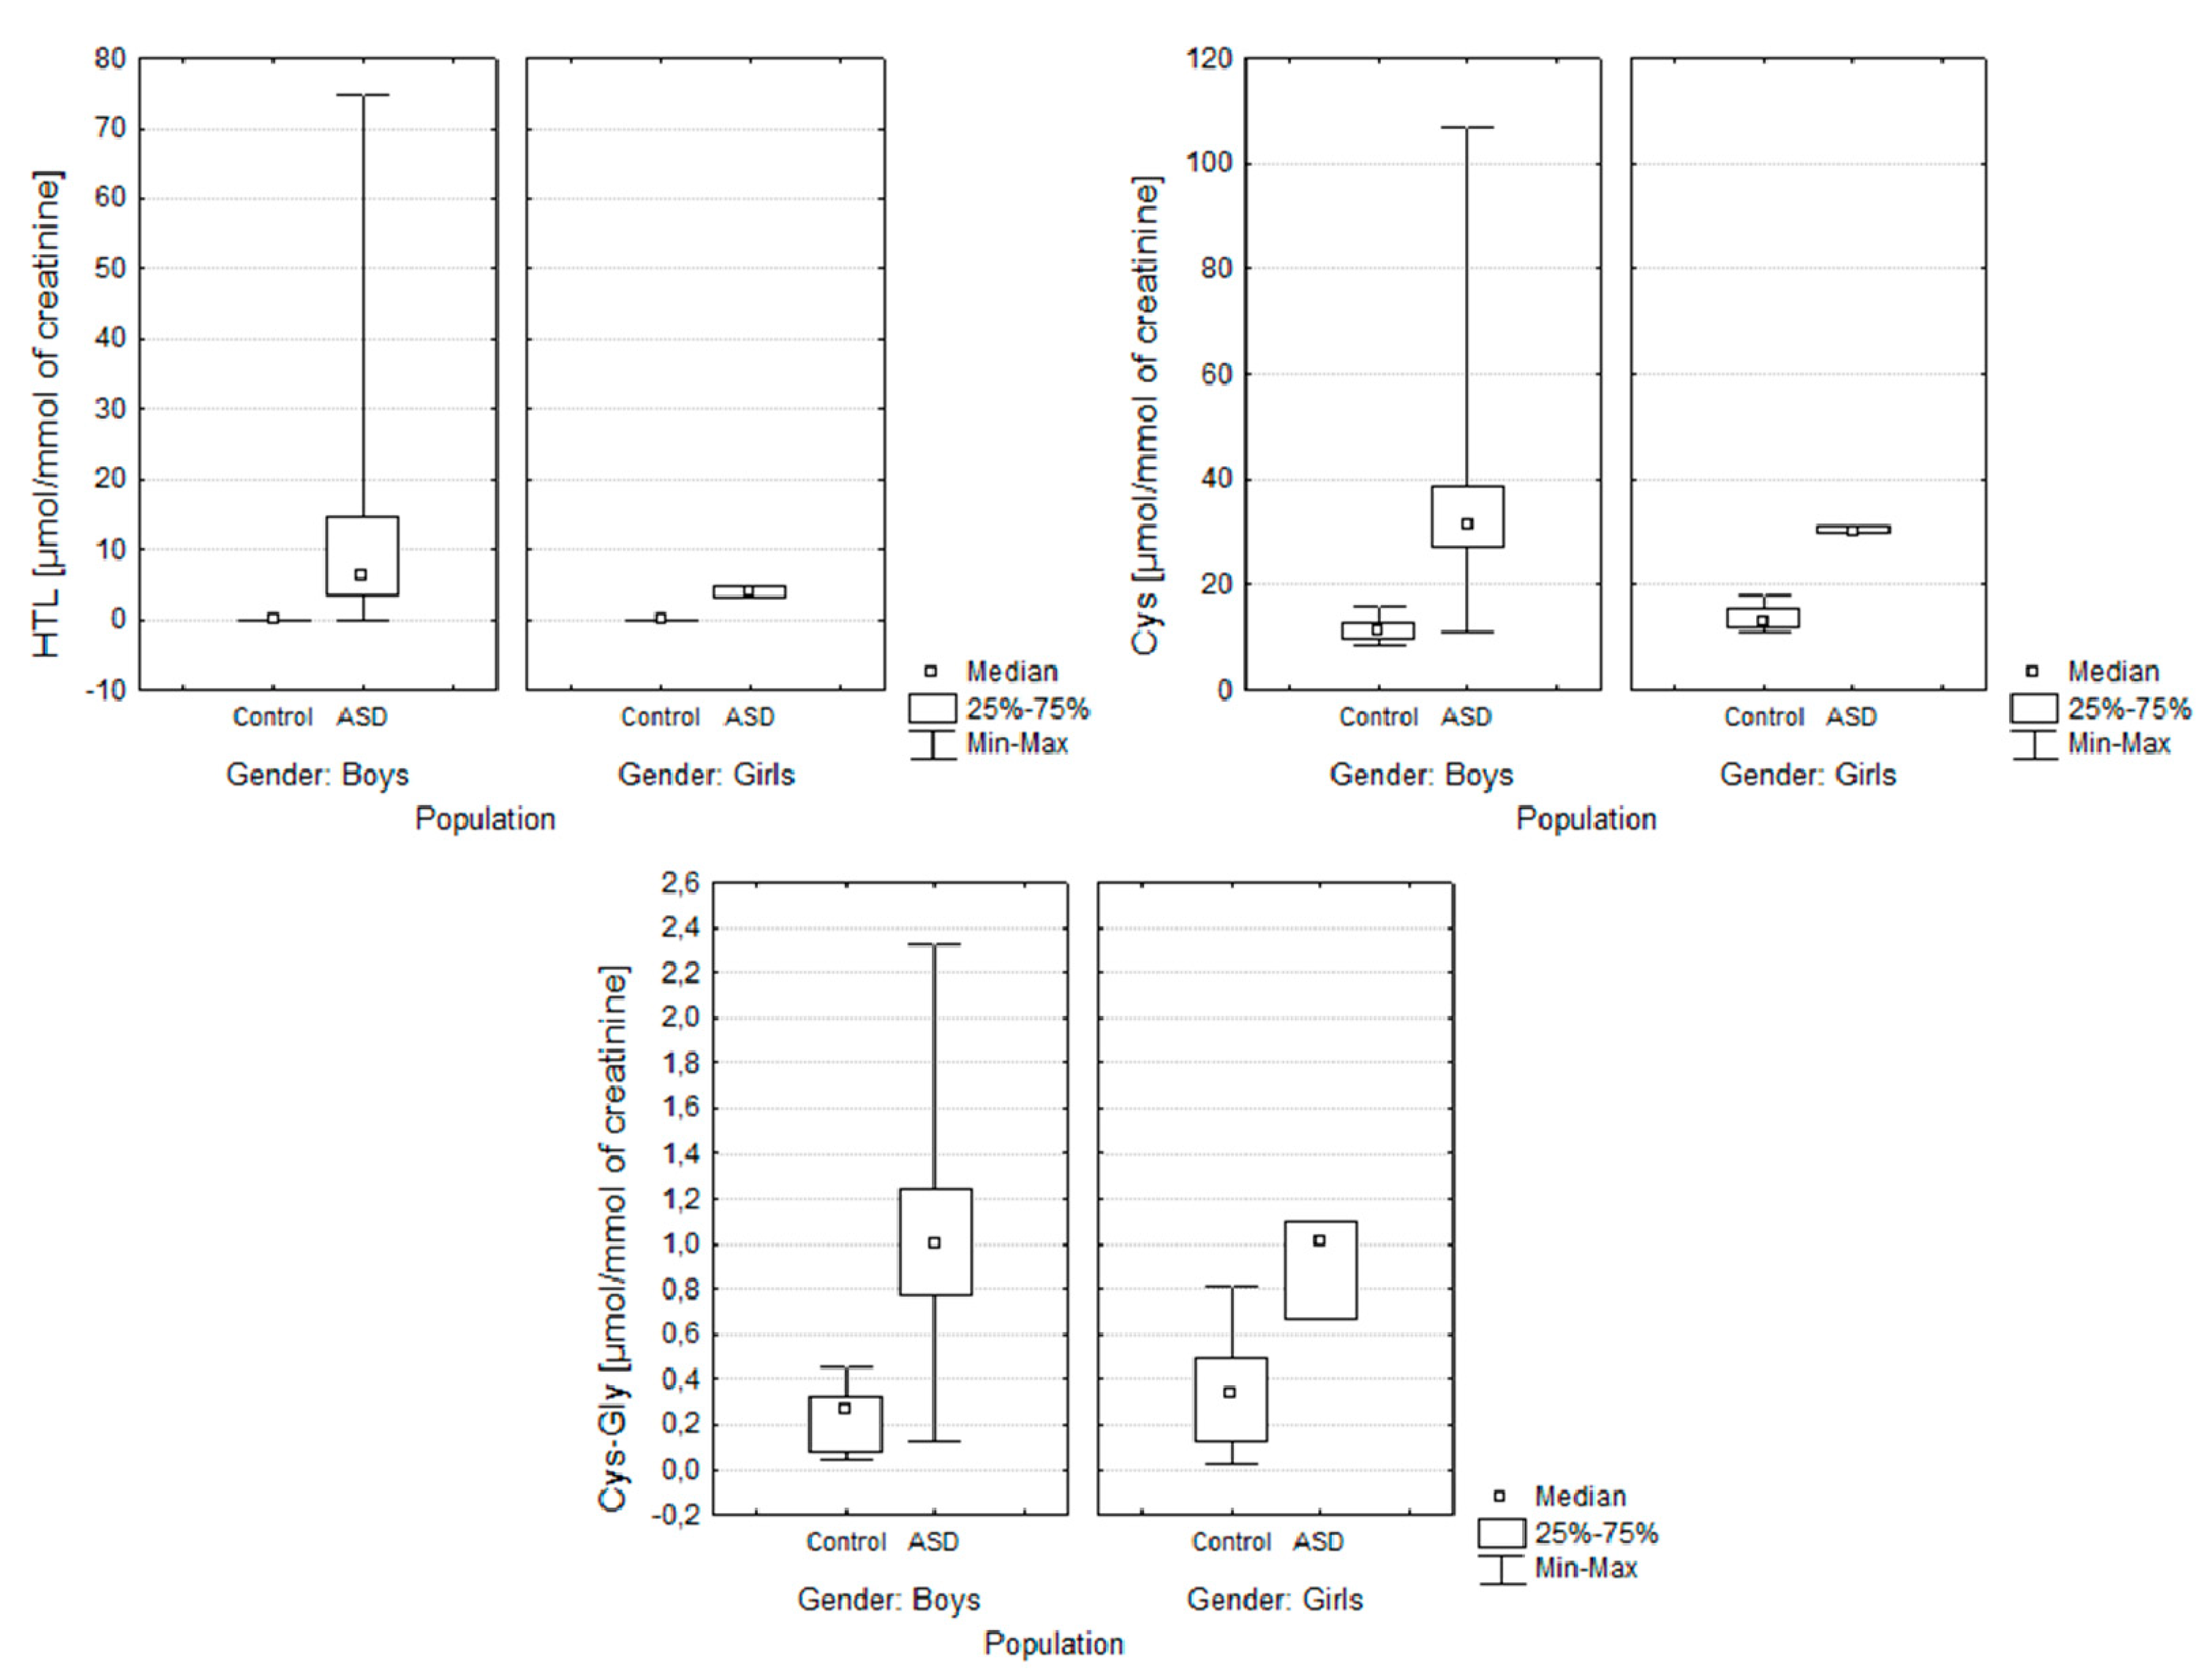
2. Results
3. Discussion
4. Materials and Methods
4.1. Patients and Sample Collection
4.2. Preparation of Urine Samples
4.2.1. Sample Preparation for Urinary HTL
4.2.2. Sample Preparation for Urinary Cys and CysGly
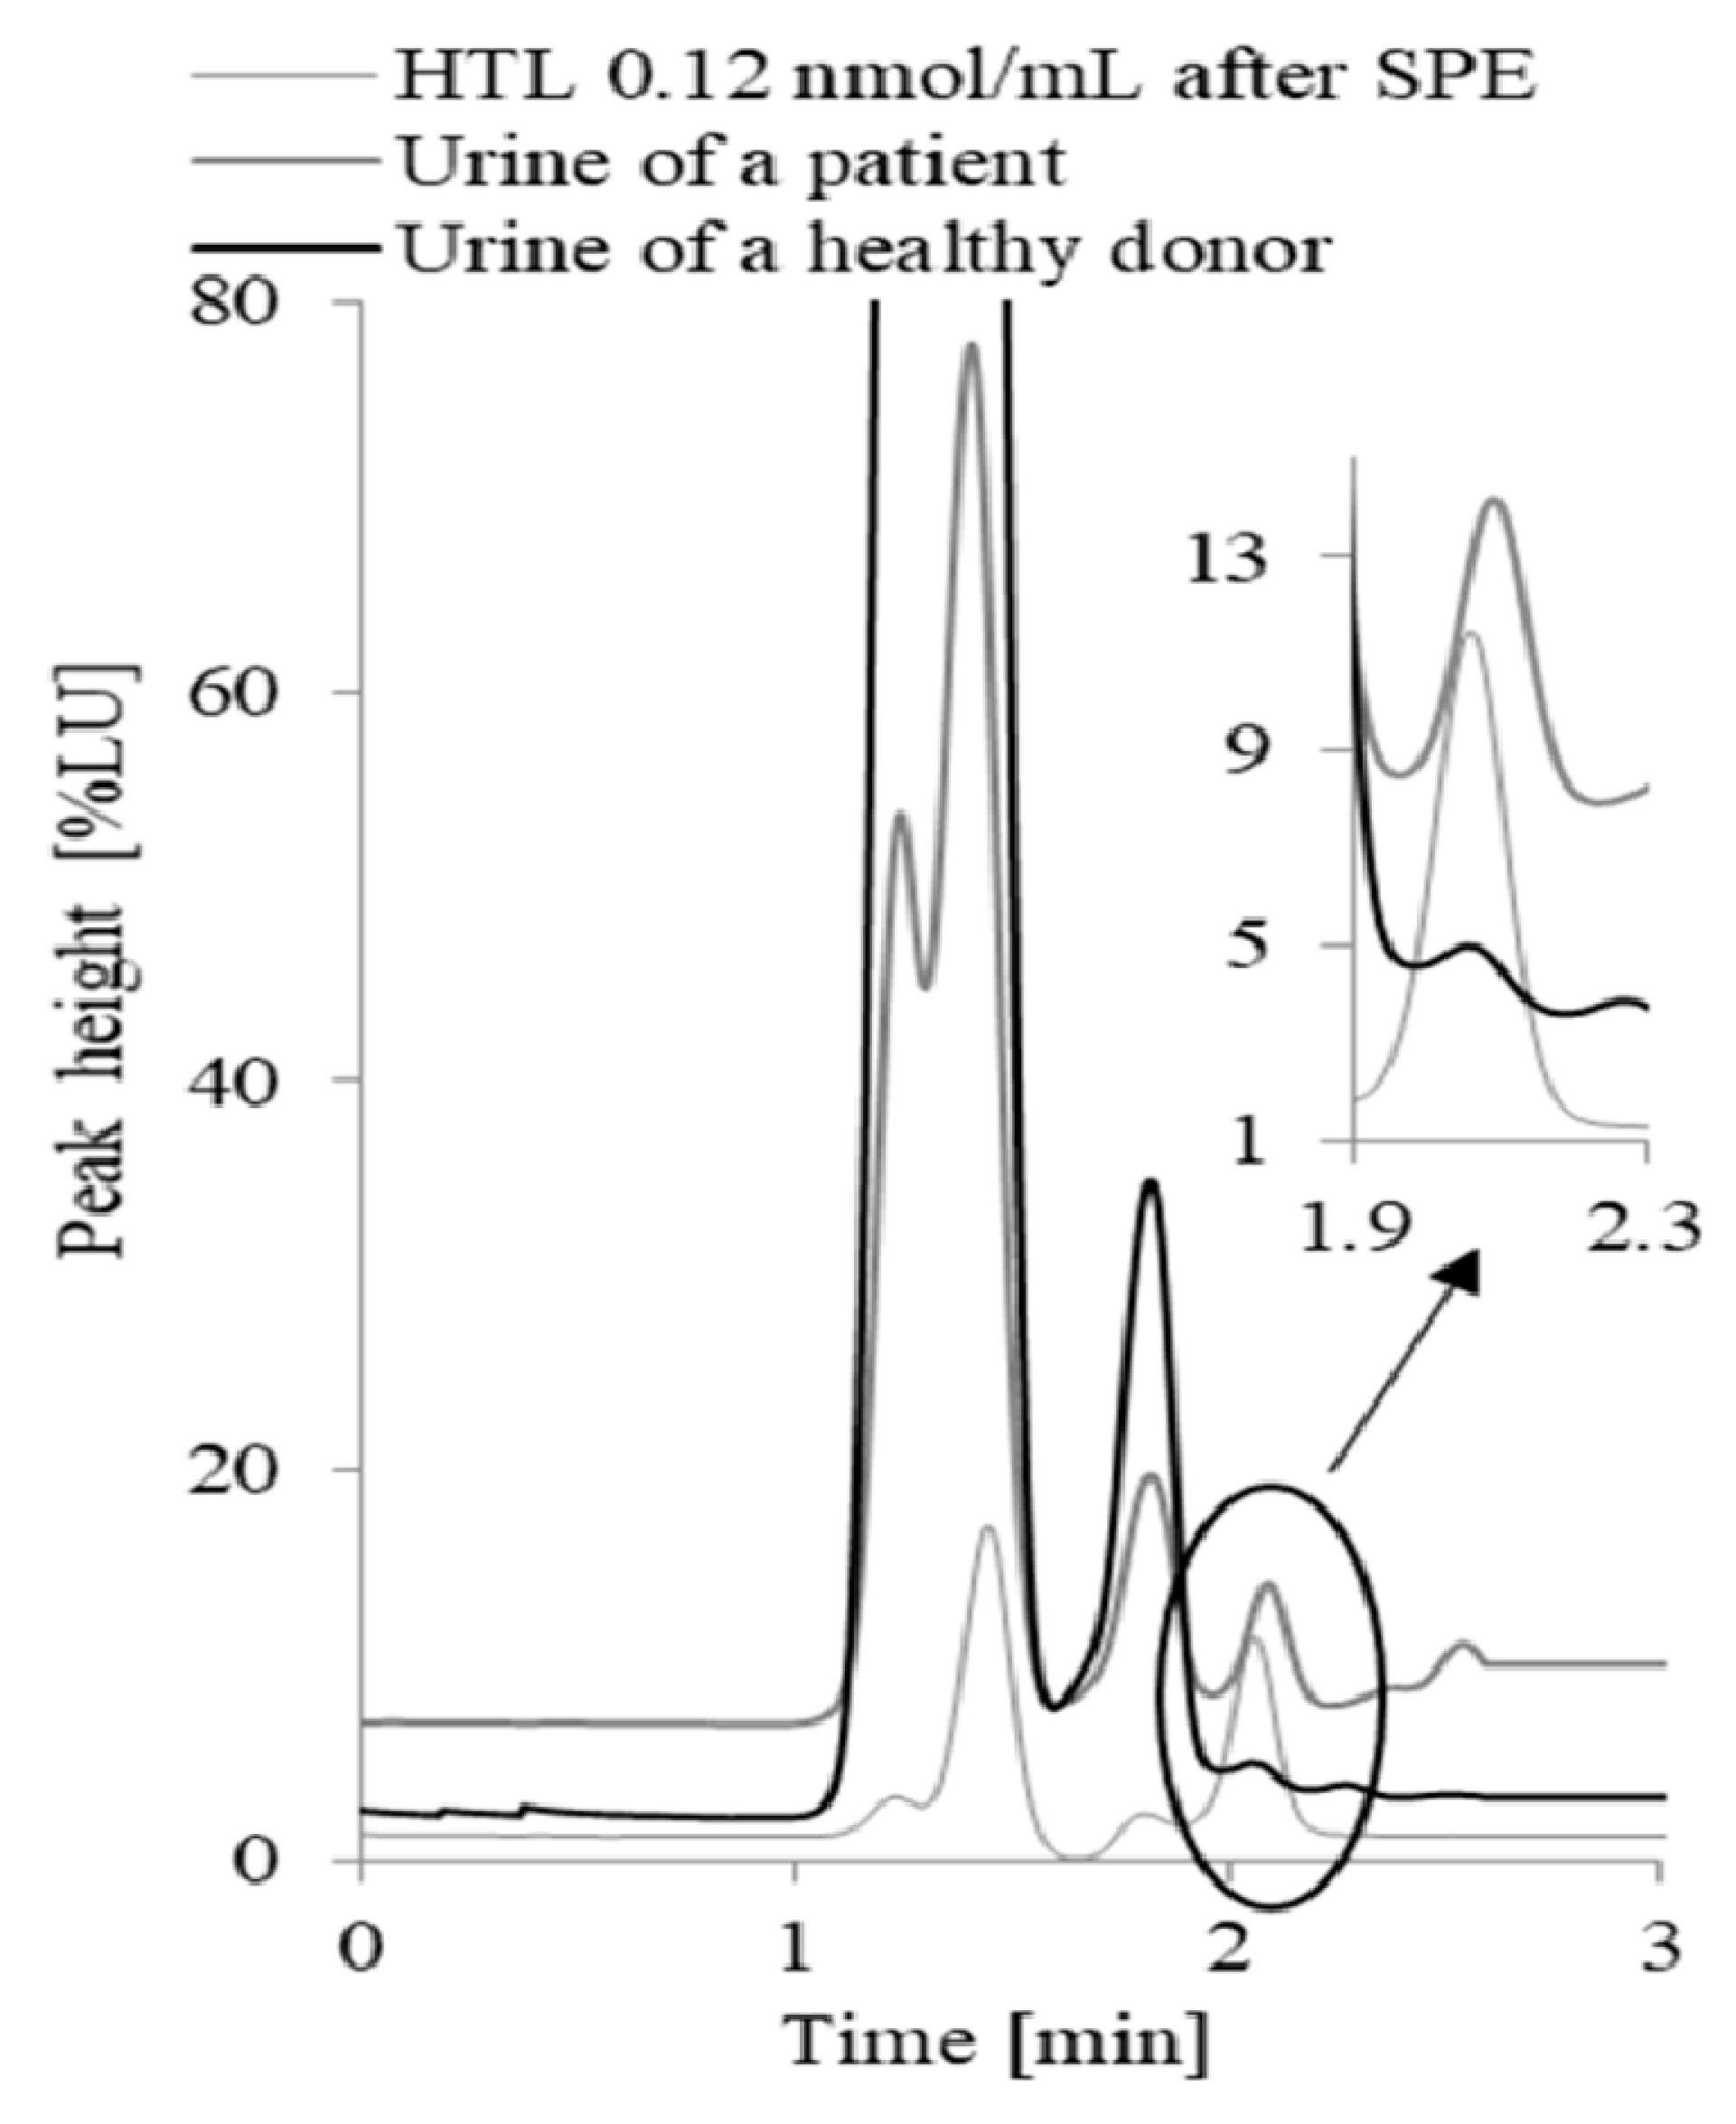
4.3. Analytical Methods
4.4. Urinary Creatinine Determination
4.5. Statistical Analysis
Author Contributions
Acknowledgments
Conflicts of Interest
Ethics Statement
Abbreviations
| ASD | autism spectrum disorder |
| BMI | body mass index |
| CBS | cystathionine β-synthase |
| CE | capillary electrophoresis |
| CMQT | 2-chloro-1-methylquinolinium tetrafluoroborate |
| Cys | cysteine |
| CysGly | cysteinylglycine |
| DAD | diode-array detector |
| γ-GluCys | γ-glutamylcysteine |
| GSH | glutathione |
| Hcy | homocysteine |
| HTL | homocysteine thiolactone |
| IQR | interquartile range |
| LOD | limit of detection |
| LOQ | limit of quantitation |
| MTHFR | methylenetetrahydrofolate reductase |
| RP-HPLC/UV–Vis | high-performance reverse phase liquid chromatography with spectrophotometric detection |
| SD | standard deviation |
| TCEP | tris(2-carboxyethyl)phosphine |
| UV | ultra-violet detection |
References
- American Psychiatric Association. Diagnostic and Statistical Manual of Mental Disorders (DSM-5), 5th ed.; American Psychiatric Association Publishing: Arlington, VA, USA, 2013. [Google Scholar]
- Kałużna-Czaplińska, J. Noninvasive urinary organic acids test to assess biochemical and nutritional individuality in autistic children. Clin. Biochem. 2011, 44, 686–691. [Google Scholar] [CrossRef] [PubMed]
- Bitar, T.; Mavel, S.; Emond, P.; Nadal-Desbarats, L.; Lefèvre, A.; Mattar, H.; Soufia, M.; Blasco, H.; Vourc’h, P.; Hleihel, W.; et al. Identification of metabolic pathway disturbances using multimodal metabolomics in autistic disorders in a Middle Eastern population. J. Pharmaceut. Biomed. 2018, 152, 57–65. [Google Scholar] [CrossRef] [PubMed]
- Ruggeri, B.; Sarkans, U.; Schumann, G.; Persico, A.M. Biomarkers in autism spectrum disorder: The old and the new. Psychopharmacology 2014, 231, 1201–1216. [Google Scholar] [CrossRef] [PubMed]
- Zheng, H.F.; Wang, W.-Q.; Li, X.-M.; Rauw, G.; Baker, G.B. Body fluid levels of neuroactive amino acids in autism spectrum disorders: A review of the literature. Amino Acids 2017, 49, 57–65. [Google Scholar] [CrossRef] [PubMed] [Green Version]
- Żurawicz, E.; Kałużna-Czaplińska, J. Analysis of amino acids in autism spectrum disorders. TRAC Trends Anal. Chem. 2015, 73, 91–118. [Google Scholar] [CrossRef]
- Kałużna-Czaplińska, J.; Michalska, M.; Rynkowski, J. Homocysteine level in urine of autistic and healthy children. Acta Biochim. Pol. 2011, 58, 31–34. [Google Scholar] [CrossRef]
- Himmelfarb, J.; McMenamin, E.; McMonagle, E. Plasma aminothiol oxidation in chronic hemodialysis patients. Kidney Int. 2002, 61, 705–716. [Google Scholar] [CrossRef] [Green Version]
- Kleinman, W.A.; Richie, J.P. Status of glutathione and other thiols and disulfides in human plasma. Biochem. Pharmacol. 2000, 60, 19–29. [Google Scholar] [CrossRef]
- Chwatko, G.; Boers, G.H.; Strauss, K.A.; Shih, D.M.; Jakubowski, H. Mutations in methylenetetrahydrofolate reductase or cystathionine β-synthase gene, or a high-methionine diet, increase homocysteine thiolactone levels in humans and mice. FASEB J. 2007, 21, 1707–1713. [Google Scholar] [CrossRef]
- Gu, W.; Lu, J.; Yang, G.; Dou, J.; Mu, Y.; Meng, J.; Pan, C. Plasma homocysteine thiolactone associated with risk of macrovasculopathy in Chinese patients with type 2 diabetes mellitus. Adv. Ther. 2008, 25, 914–924. [Google Scholar] [CrossRef]
- Borowczyk, K.; Piechocka, J.; Głowacki, R.; Dhar, I.; Midtun, Ø.; Tell, G.S.; Ueland, P.M.; Nygård, O.; Jakubowski, H. Urinary excretion of homocysteine thiolactone and the risk of acute myocardial infarction in coronary artery disease patients: The WENBIT trial. J. Int. Med. 2019, 285, 232–244. [Google Scholar] [CrossRef] [PubMed]
- Frye, R.E. Metabolic and mitochondrial disorders associated with epilepsy in children with autism spectrum disorder. Epilepsy Behav. 2015, 47, 147–157. [Google Scholar] [CrossRef] [PubMed] [Green Version]
- Cheng, N.; Rho, J.M.; Masino, S.A. Metabolic Dysfunction Underlying Autism Spectrum Disorder and Potential Treatment Approaches. Front. Mol. Neurosci. 2017, 10, 34. [Google Scholar] [CrossRef] [PubMed] [Green Version]
- Lipton, S.A.; Kim, W.K.; Choi, Y.B.; Kumar, S.; D’Emilia, D.M.; Rayudu, P.V.; Arnelle, D.R.; Stamler, J.S. Neurotoxicity associated with dual actions of homocysteine at the N-methyl-D-aspartate receptor. Proc. Natl. Acad. Sci. USA 1997, 94, 5923–5928. [Google Scholar] [CrossRef] [Green Version]
- Kruman, I.I.; Culmsee, C.; Chan, S.L.; Kruman, Y.; Guo, Z.; Penix, L.; Mattson, M.P. Homocysteine elicits a DNA damage response in neurons that promotesapoptosis and hypersensitivity to excitotoxicity. J. Neurosci. 2000, 20, 6920–6926. [Google Scholar] [CrossRef] [Green Version]
- Borowczyk, K.; Wyszczelska-Rokiel, M.; Kubalczyk, P.; Głowacki, R. Simultaneous determination of albumin and low-molecular-mass thiols in plasma by HPLC with UV detection. J. Chromatogr. B 2015, 981–982, 57–64. [Google Scholar] [CrossRef]
- Kuśmierek, K.; Głowacki, R.; Bald, E. Determination of total cysteamine in human plasma in the form of its 2-S-quinolinium derivative by high performance liquid chromatography. Anal. Bioanal. Chem. 2005, 382, 231–233. [Google Scholar] [CrossRef]
- Głowacki, R.; Bald, E.; Jakubowski, H. An on-column derivatization method for the determination of homocysteine-thiolactone and protein N-linked homocysteine. Amino Acids. 2011, 41, 187–194. [Google Scholar] [CrossRef]
- Furmaniak, P.; Kubalczyk, P.; Głowacki, R. Determination of homocysteine thiolactone in urine by field amplified sample injection and sweeping MEKC method with UV detection. J. Chromatogr. B 2014, 961, 36–41. [Google Scholar] [CrossRef]
- Wrońska, M.; Chwatko, G.; Borowczyk, K.; Piechocka, J.; Kubalczyk, P.; Głowacki, R. Application of GC-MS technique for the determination of homocysteine thiolactone in human urine. J. Chromatogr. B 2018, 1099, 18–24. [Google Scholar] [CrossRef]
- Jakubowski, H. Metabolism of homocysteine thiolactone in human cell cultures: Possible mechanism for pathological consequences of elevated homocysteine levels. J. Biol. Chem. 1997, 272, 1935–1942. [Google Scholar] [PubMed]
- Wishart, D.S.; Jewison, T.; Guo, A.C.; Wilson, M.; Knox, C.; Liu, Y.; Djoumbou, Y.; Mandal, R.; Aziat, F.; Dong, E.; et al. HMDB 3.0–The Human Metabolome Database in 2013. Nucleic Acids Res. 2013, 41, D801–D807. [Google Scholar] [CrossRef] [PubMed]
- Townsend, D.M.; Tew, K.D.; Tapiero, H. Sulfur containing amino acids and human disease. Biomed. Pharmacother. 2004, 58, 47–55. [Google Scholar] [CrossRef] [PubMed]
- Kuśmierek, K.; Bald, E. Analysis of major urinary aminothiols by high-performance liquid chromatography with ultraviolet detection. Acta Chromatogr. 2009, 21, 411–420. [Google Scholar] [CrossRef]
- Harper, A.E.; Benevenga, N.J.; Wohlheuter, R.M. Effects of ingestion of disproportionate amounts of amino acids. Physiol. Rev. 1970, 50, 428–458. [Google Scholar] [CrossRef]
- Benevenga, N.J.; Steele, R.D. Adverse effects of excessive consumption of amino acids. Annu. Rev. Nutr. 1984, 4, 157–181. [Google Scholar] [CrossRef]
- Fau, D.; Peret, J.; Hadjiisky, P. Effects of ingestion of high protein or excess methionine diets by rats for two years. J. Nutr. 1988, 118, 128–133. [Google Scholar] [CrossRef] [Green Version]
- Ghanizadeh, A. Increased glutamate and homocysteine and decreasedglutamine levels in autism: A review and strategies for future studies of aminoacids in autism. Dis. Markers 2013, 35, 281–286. [Google Scholar] [CrossRef] [Green Version]
- James, S.J.; Cutler, P.; Melnyk, S.; Jernigan, S.; Janak, L.; Gaylor, D.W.; Neubrander, J.A. Metabolic biomarkers of increased oxidative stress and impaired methylation capacity in children with autism. Am. J. Clin. Nutr. 2004, 80, 1611–1617. [Google Scholar] [CrossRef] [Green Version]
- Pasca, S.P.; Nemes, B.; Vlase, L.; Gagyi, C.E.; Dronca, E.; Miu, A.C.; Dronca, M. High levels of homocysteine and low serum paraoxonase 1 arylesterase activity in children with autism. Life Sci. 2006, 78, 2244–2248. [Google Scholar] [CrossRef]
- Kałużna-Czaplińska, J.; Michalska, M.; Rynkowski, J. Vitamin supplementation reduces the level of homocysteine in the urine of autistic children. Nutr. Res. 2011, 31, 318–321. [Google Scholar] [CrossRef] [PubMed]
- Williams, K.E.; Gibbons, B.G.; Schreck, K.A. Comparing selective eaters with and without developmental disabilities. J. Dev. Phys. Disabil. 2005, 17, 299–309. [Google Scholar] [CrossRef]
- Adams, J.B.; Holloway, C. Pilot study of a moderate dose multivitamin/mineral supplement for children with autistic spectrum disorder. J. Altern. Complem. Med. 2004, 10, 1033–1039. [Google Scholar] [CrossRef] [PubMed]
- Xia, R.R. Effectiveness of nutritional supplements for reducing symptoms in autism- spectrum disorder: A case report. J. Altern. Complem. Med. 2011, 17, 271–274. [Google Scholar] [CrossRef]
- Kałużna-Czaplińska, J.; Żurawicz, E.; Michalska, M.; Rynkowski, J. A focus on homocysteine in autism. Acta Biochim. Pol. 2013, 60, 137–142. [Google Scholar] [CrossRef] [PubMed]
- Han, Y.; Xi, Q.Q.; Dai, W.; Yang, S.H.; Gao, L.; Su, Y.Y.; Zhang, X. Abnormal transsulfuration metabolism and reduced antioxidant capacity in Chinese children with autism spectrum disorders. Int. J. Dev. Neurosci. 2015, 46, 27–32. [Google Scholar] [CrossRef] [PubMed]
- Jakubowski, H. Protein homocysteinylation: Possible mechanism underlying pathological consequences of elevated homocysteine levels. FASEB J. 1999, 13, 2277–2283. [Google Scholar] [CrossRef] [PubMed]
- Jakubowski, H. Homocysteine thiolactone: Metabolic origin and protein homocysteinylation in humans. J. Nutr. 2000, 130, 377S–381S. [Google Scholar] [CrossRef]
- Chwatko, G.; Jakubowski, H. Urinary excretion of homocysteine-thiolactone in humans. Clin. Chem. 2005, 51, 408–415. [Google Scholar] [CrossRef] [Green Version]
- Wada, M.; Nakamura, S.; Nakashima, K. HPLC analysis of homocysteine and related compounds, non-proteinogenic amino acids. In Non-Proteinogenic Amino Acids; Filip, N., Iancu, C.-E., Eds.; IntechOpen Limited: London, UK, 2018; pp. 11–29. [Google Scholar]
- Jakubowski, H. Pathophysiological consequences of homocysteine excess. J. Nutr. 2006, 136, 1741S–1749S. [Google Scholar] [CrossRef]
- Hustad, S.; Midttun, Ø.; Schneede, J.; Vollset, S.E.; Grotmol, T.; Ueland, P.M. The methylenetetrahydrofolate reductase 677C→T polymorphism as a modulator of a B vitamin network with major effects on homocysteine metabolism. Am. J. Hum. Genet. 2007, 80, 846–855. [Google Scholar] [CrossRef] [PubMed] [Green Version]
- Adams, M.; Lucock, M.; Stuart, J.; Fardell, S.; Baker, K.; Ng, X. Preliminary evidence for involvement of folate gene polymorphism 19bp deletion-DHFR in occurrence of autism. Neurosci. Lett. 2007, 422, 24–29. [Google Scholar] [CrossRef] [PubMed]
- James, S.J.; Melnyk, S.; Jernigan, S.; Pavliv, O.; Trusty, T.; Lehman, S.; Seidel, L.; Gaylor, D.W.; Cleves, M.A. A functional polymorphism in the reduced folate carrier gene and DANN hypomethylation in mothers of children with autism. Am. J. Med. Genet. B 2010, 153B, 1209–1220. [Google Scholar]
- Ramaekers, V.T.; Hausler, M.; Opladen, T.; Heimann, G.; Blau, N. Psychomotor retardation, spastic paraplegia, cerebellar ataxia, and dyskinesia associated with low 5-methyltetrahydrofolate in cerebrospinal fluid: A novel neurometabolic condition responding to folinic acid substitution. Neuropediatrics 2002, 33, 301–308. [Google Scholar] [CrossRef]
- Schmidt, R.J.; Hansen, R.L.; Hartiala, J.; Allayee, H.; Schmidt, L.C.; Tancredi, D.J.; Tassone, F.; Hertz-Picciotto, I. Prenatal vitamins, one-carbon metabolism gene variants, and risk for autism. Epidemiology 2011, 22, 476–485. [Google Scholar] [CrossRef] [Green Version]
- Reed, M.C.; Thomas, R.L.; Pavisic, J.; James, S.J.; Ulrich, C.M.; Nijhout, H.F. A mathematical model of glutathione metabolism. Theor. Biol. Med. Model. 2008, 5, 8. [Google Scholar] [CrossRef] [Green Version]
- Kidd, P.M. Autism, an extreme challenge to integrative medicine. Part II: Medical management. Altern. Med. Rev. 2002, 7, 472–499. [Google Scholar]
- Bakirdere, S.; Bramanti, E.; D’ulivo, A.; Yavuz Ataman, O.; Mester, Z. Speciation and determination of thiols in biological samples using high performance liquid chromatography-inductively coupled plasma-mass spectrometry and high performance liquid chromatography-Orbitrap MS. Anal. Chim. Acta 2010, 680, 41–47. [Google Scholar] [CrossRef]
- Kurochkin, I.; Khrameeva, E.; Tkachev, A.; Stepanova, V.; Vanyushkina, A.; Stekolshchikova, E.; Li, Q.; Zubkov, D.; Shichkova, P.; Halene, T.; et al. Metabolome signature of autism in the human prefrontal cortex. Commun. Biol. 2019, 2, 234. [Google Scholar] [CrossRef]
- Yap, I.K.S.; Angley, M.; Veselkov, K.A.; Holmes, E.; Lindon, J.C.; Nicholson, J.K. Urinary metabolic phenotyping differentiates children with autism from their unaffected siblings and age-matched controls. J. Proteome Res. 2010, 9, 2996–3004. [Google Scholar] [CrossRef] [Green Version]
- Alberti, A.; Pirrone, P.; Elia, M.; Waring, R.H.; Romano, C. Sulphation deficit in ‘low functioning’ autistic children: A pilot study. Biol. Psychiat. 1999, 46, 420–424. [Google Scholar] [CrossRef]
- James, S.J.; Melnyk, S.; Fuchs, G.; Reid, T.; Jernigan, S.; Pavliv, O.; Hubanks, A.; Gaylor, D.W. Efficacy of methylcobalamin and folinic acid treatment on glutathione redox status in children with autism. Am. J. Clin. Nutr. 2009, 89, 425–430. [Google Scholar] [CrossRef] [PubMed]
- World Health Organization. The ICD-10 Classification of Mental and Behavioural Disorders: Diagnostic Criteria for Research; World Health Organization: Geneva, Switzerland, 2003. [Google Scholar]
- Perrone, R.D.; Madias, N.E.; Levey, A.S. Serum creatinine as an index of renal function: New insights into old concepts. Clin. Chem. 1992, 38, 1933–1953. [Google Scholar] [CrossRef] [PubMed]
- Moller, E.; McIntosh, J.R.; Van Slyke, D.D. Studies of urea excretion. II. Relationship between urine volume and the rate of urea excretion by normal adults. J. Clin. Investig. 1928, 6, 427–465. [Google Scholar] [PubMed] [Green Version]
- Khalaf, A.N.; Bocker, J.; Kerp, L.; Petersen, K.G. Urine screening in outdoor volunteers: Day versus night versus 24 h collection. Clin. Chem. Lab Med. 1991, 29, 185–188. [Google Scholar] [CrossRef] [Green Version]
- Cohen, E.P.; Lemann, J., Jr. The role of the laboratory in evaluation of kidney function. Clin. Chem. 1991, 37, 785–796. [Google Scholar] [CrossRef]
- Kuśmierek, K.; Głowacki, R.; Bald, E. Analysis of urine for cysteine, cysteinylglycine, and homocysteine by high-performance liquid chromatography. Anal. Bioanal. Chem. 2006, 385, 855–860. [Google Scholar]
Sample Availability: Samples of the compounds are not available from the authors. |


| Name of Compound | Population | Mean | Conf. −95% | Conf. +95% | Median | Min. | Max. | Lower Quartile | Upper Quartile | Variance | Std.Dev. | Standard Error |
|---|---|---|---|---|---|---|---|---|---|---|---|---|
| Homocysteine thiolactone | ASD | 10.3024 | 5.9807 | 14.6241 | 5.8872 | 0.0024 | 74.6099 | 3.3839 | 12.7344 | 168.0128 | 12.9620 | 2.1309 |
| Control | 0.0079 | 0.0028 | 0.0130 | 0.0041 | 0.0003 | 0.0342 | 0.0011 | 0.0126 | 0.0001 | 0.0092 | 0.0024 | |
| Cysteine | ASD | 36.8925 | 30.8243 | 42.9608 | 30.6270 | 11.1375 | 107.502 | 27.0894 | 36.8070 | 379.1978 | 19.4730 | 3.0047 |
| Control | 12.3378 | 11.2617 | 13.4139 | 12.1620 | 8.3642 | 17.9055 | 10.7592 | 14.7696 | 6.1924 | 2.4885 | 0.5189 | |
| Cysteinylglycine | ASD | 1.0229 | 0.8877 | 1.1582 | 1.0070 | 0.1291 | 2.3290 | 0.7689 | 1.2367 | 0.1884 | 0.4340 | 0.0670 |
| Control | 0.2734 | 0.1924 | 0.3543 | 0.2920 | 0.0293 | 0.8082 | 0.0795 | 0.3847 | 0.0350 | 0.1872 | 0.0390 |
| Name of Compound | ASD | non-ASD | ASD vs non-ASD |
|---|---|---|---|
| Homocysteine thiolactone | 10.30 ± 2.13 | 7.90 ± 2.4×10⁻³ | Z = −5.42, p = 5.86×10⁻⁸ |
| Cysteine | 36.89 ± 3.00 | 12.34 ± 0.52 | Z = −6.41, p = 1.49×10⁻¹⁰ |
| Cysteinylglycine | 1.02 ± 0.07 | 0.27 ± 0.04 | Z = −5.72, p = 1.06×10⁻⁸ |
| ASD Group | Control Group | |
|---|---|---|
| Total participants | 41 | 24 |
| Male | 38 (92.7%) | 16 (66.7%) |
| Female | 3 (7.3%) | 8 (33.3%) |
© 2020 by the authors. Licensee MDPI, Basel, Switzerland. This article is an open access article distributed under the terms and conditions of the Creative Commons Attribution (CC BY) license (http://creativecommons.org/licenses/by/4.0/).
Share and Cite
Gątarek, P.; Rosiak, A.; Borowczyk, K.; Głowacki, R.; Kałużna-Czaplińska, J. Higher Levels of Low Molecular Weight Sulfur Compounds and Homocysteine Thiolactone in the Urine of Autistic Children. Molecules 2020, 25, 973. https://0-doi-org.brum.beds.ac.uk/10.3390/molecules25040973
Gątarek P, Rosiak A, Borowczyk K, Głowacki R, Kałużna-Czaplińska J. Higher Levels of Low Molecular Weight Sulfur Compounds and Homocysteine Thiolactone in the Urine of Autistic Children. Molecules. 2020; 25(4):973. https://0-doi-org.brum.beds.ac.uk/10.3390/molecules25040973
Chicago/Turabian StyleGątarek, Paulina, Angelina Rosiak, Kamila Borowczyk, Rafał Głowacki, and Joanna Kałużna-Czaplińska. 2020. "Higher Levels of Low Molecular Weight Sulfur Compounds and Homocysteine Thiolactone in the Urine of Autistic Children" Molecules 25, no. 4: 973. https://0-doi-org.brum.beds.ac.uk/10.3390/molecules25040973