Article

Chemical Characterization of Capsule-Brewed Espresso Coffee Aroma from the Most Widespread Italian Brands by HS-SPME/GC-MS

1
Department of Food and Drug, University of Parma, 43124 Parma, Italy
2
Institute of Cancer and Genomic Sciences, Centre for Computational Biology, University of Birmingham, B15 2TT, UK
3
Institute of Translational Medicine, University of Birmingham, B15 2TT, UK
4
NIHR Surgical Reconstruction and Microbiology Research Centre, University Hospital Birmingham, Birmingham B15 2WB, UK
5
Faculty of Bioscience and Technology for Food, Agriculture and Environment, University of Teramo, 64100 Teramo, Italy
6
School of Advanced Studies on Food and Nutrition, University of Parma, 43124 Parma, Italy
7
Department of Veterinary Science, University of Parma, 43124 Parma, Italy
*
Author to whom correspondence should be addressed.
Submission received: 26 February 2020 / Accepted: 3 March 2020 / Published: 5 March 2020
(This article belongs to the Special Issue Exploring the OMICS Platforms in Food Analysis)

Abstract

:
Coffee capsules market is on the rise as it allows access to a wide selection of coffee, differing in taste and brand. However, few data about the chemical characterization of the capsule-brewed coffee aroma are available. In this work, an untargeted approach using headspace solid-phase microextraction (HS-SPME) coupled to gas chromatography–mass spectrometry (GC-MS) and combined to chemometrics was performed to study and compare aroma profile from 65 capsule-brewed espresso coffees (ECs) commercialized by five of the most representative brands in Italy. Volatile profiles obtained from ECs were subjected to multivariate statistical analysis, which generally did not show a significant variability among coffees belonging to the same brand, except for those modified after the addition of specific flavor additives or aromatic substances (such as caramel, chocolate, etc.). Similarities may be related to the starting coffee brew or the processing method, which is likely the same for each individual brand. Additionally, partial least squares discriminant analysis (PLS-DA) showed that capsules from a specific brand contain the highest concentration of pyrazines, thus characterized by an intense and characteristic aroma, and a stronger note than those from the other brands. This study supports that the chemical analysis in conjunction with chemometric tools is a useful approach for assessing flavor quality, even if the need remains to identify volatile markers of high-quality beverages.

1. Introduction

Coffee is the second most popular beverage in modern society after water, and its consumption is continually increasing with a market value close to 21 billion USD [1,2,3]. The popularity of coffee is mostly due to its stimulating effect from caffeine, as well as its pleasant taste and aroma [4]. Coffee can be prepared in many ways but one of the most widespread and known is the Italian “Espresso coffee” (EC). In fact, according to the latest data from the International Coffee organization (ICO) [3], about 1.5 billion cups of coffee a day are consumed worldwide with a growing preference for espresso when compared to other coffee beverages [5].
EC is prepared in a clear and basic way, where a jet of a limited amount of hot water under high pressure passes in a very brief time through a ground and tamped coffee cake [6]. This process produces a concentrated and intensely flavored brew covered by a dense foam creamy layer. Nowadays, several brewing methods are used to make EC [6]; among them, bar and/or home coffee machines and operating with pre-packed doses containing pre-measured ground coffee as pods and capsules, characterized by mixes of coffee cultivars, roasting degrees, and production countries, as well as by the occasional presence of aromas or additives [7]. Being so easy to prepare and enjoy, the popularity of espresso capsules has exponentially grown, together with the number of private label players entering the market and the interest of consumers for the quality of the final product [8]. Some capsules from specific brands were considered to taste better than others, but overall there is a lack of labelled information, so it is difficult to select the optimal choice for the consumer. In fact, no information (or incomplete information) is labelled about the origin and/or cultivar of the coffee blend, so it is very difficult to discriminate the quality of the product based on the starting blend. Furthermore, there are few studies in the literature concerning the analysis of capsule-brewed EC with respect to chemical characterization of the aroma.
As volatile compounds are associated with coffee flavor and consequently impact its acceptance, coffee flavor research has focused on the identification of active aroma compounds, testing multiple sample preparation advanced techniques, as solvent-assisted flavor evaporation (SAFE) and headspace solid-phase microextraction (HS-SPME) combined with untargeted analysis approaches, using gas chromatography-olfactometry [9,10].
In this context, more than 900 volatile components with a large variety of functional groups have been identified in roasted coffee [11,12,13] and classified by chemical families, including furans, pyrazines, ketones, pyrroles, phenols, hydrocarbons, acids and anhydrides, aldehydes, esters, alcohols, sulfur compounds, and others. It is generally recognized that the coffee aroma is not produced by a single compound, but by a multitude of volatiles in some specific proportions. Although the volatile profile of coffee is very complex, bioactive substances (called key odorants) have been identified as important contributors to the taste and correlated to coffee aroma, and consequently to the quality of the final product. Many published papers concern the relationship between the aroma profile of coffee and the chemical composition of the seeds, including other parameters such as the species and cultivars of coffee, climate, and processing methods, such as roasting, storage and brewing methods [14,15,16]. Thus, the chemical composition of the aroma is an important quality marker for EC.
Moreover, HS-SPME/ gas chromatography–mass spectrometry (GC-MS) combined with chemometric multivariate analysis could provide an accurate approach for the analysis of type and concentration of volatile components for the quality assessment [9].
This work explored the possibility to find some peculiar characteristic among products belonging to different commercial brands and to define characteristics that could permit to discriminate based on the chemical aroma profile. To this aim, the chemical aroma profile of 65 different ECs prepared with coffee capsules belonging to the five most common brands in Italy (in accordance with specific manufacturers’ instructions and specific machines) was characterized by HS-SPME/GC-MS, and a relationship between their aroma profile and flavor was assessed, based on their commercial brands and concentration of selected key odorants by the application of chemometric tools (i.e., multivariate statistical methods).

2. Results

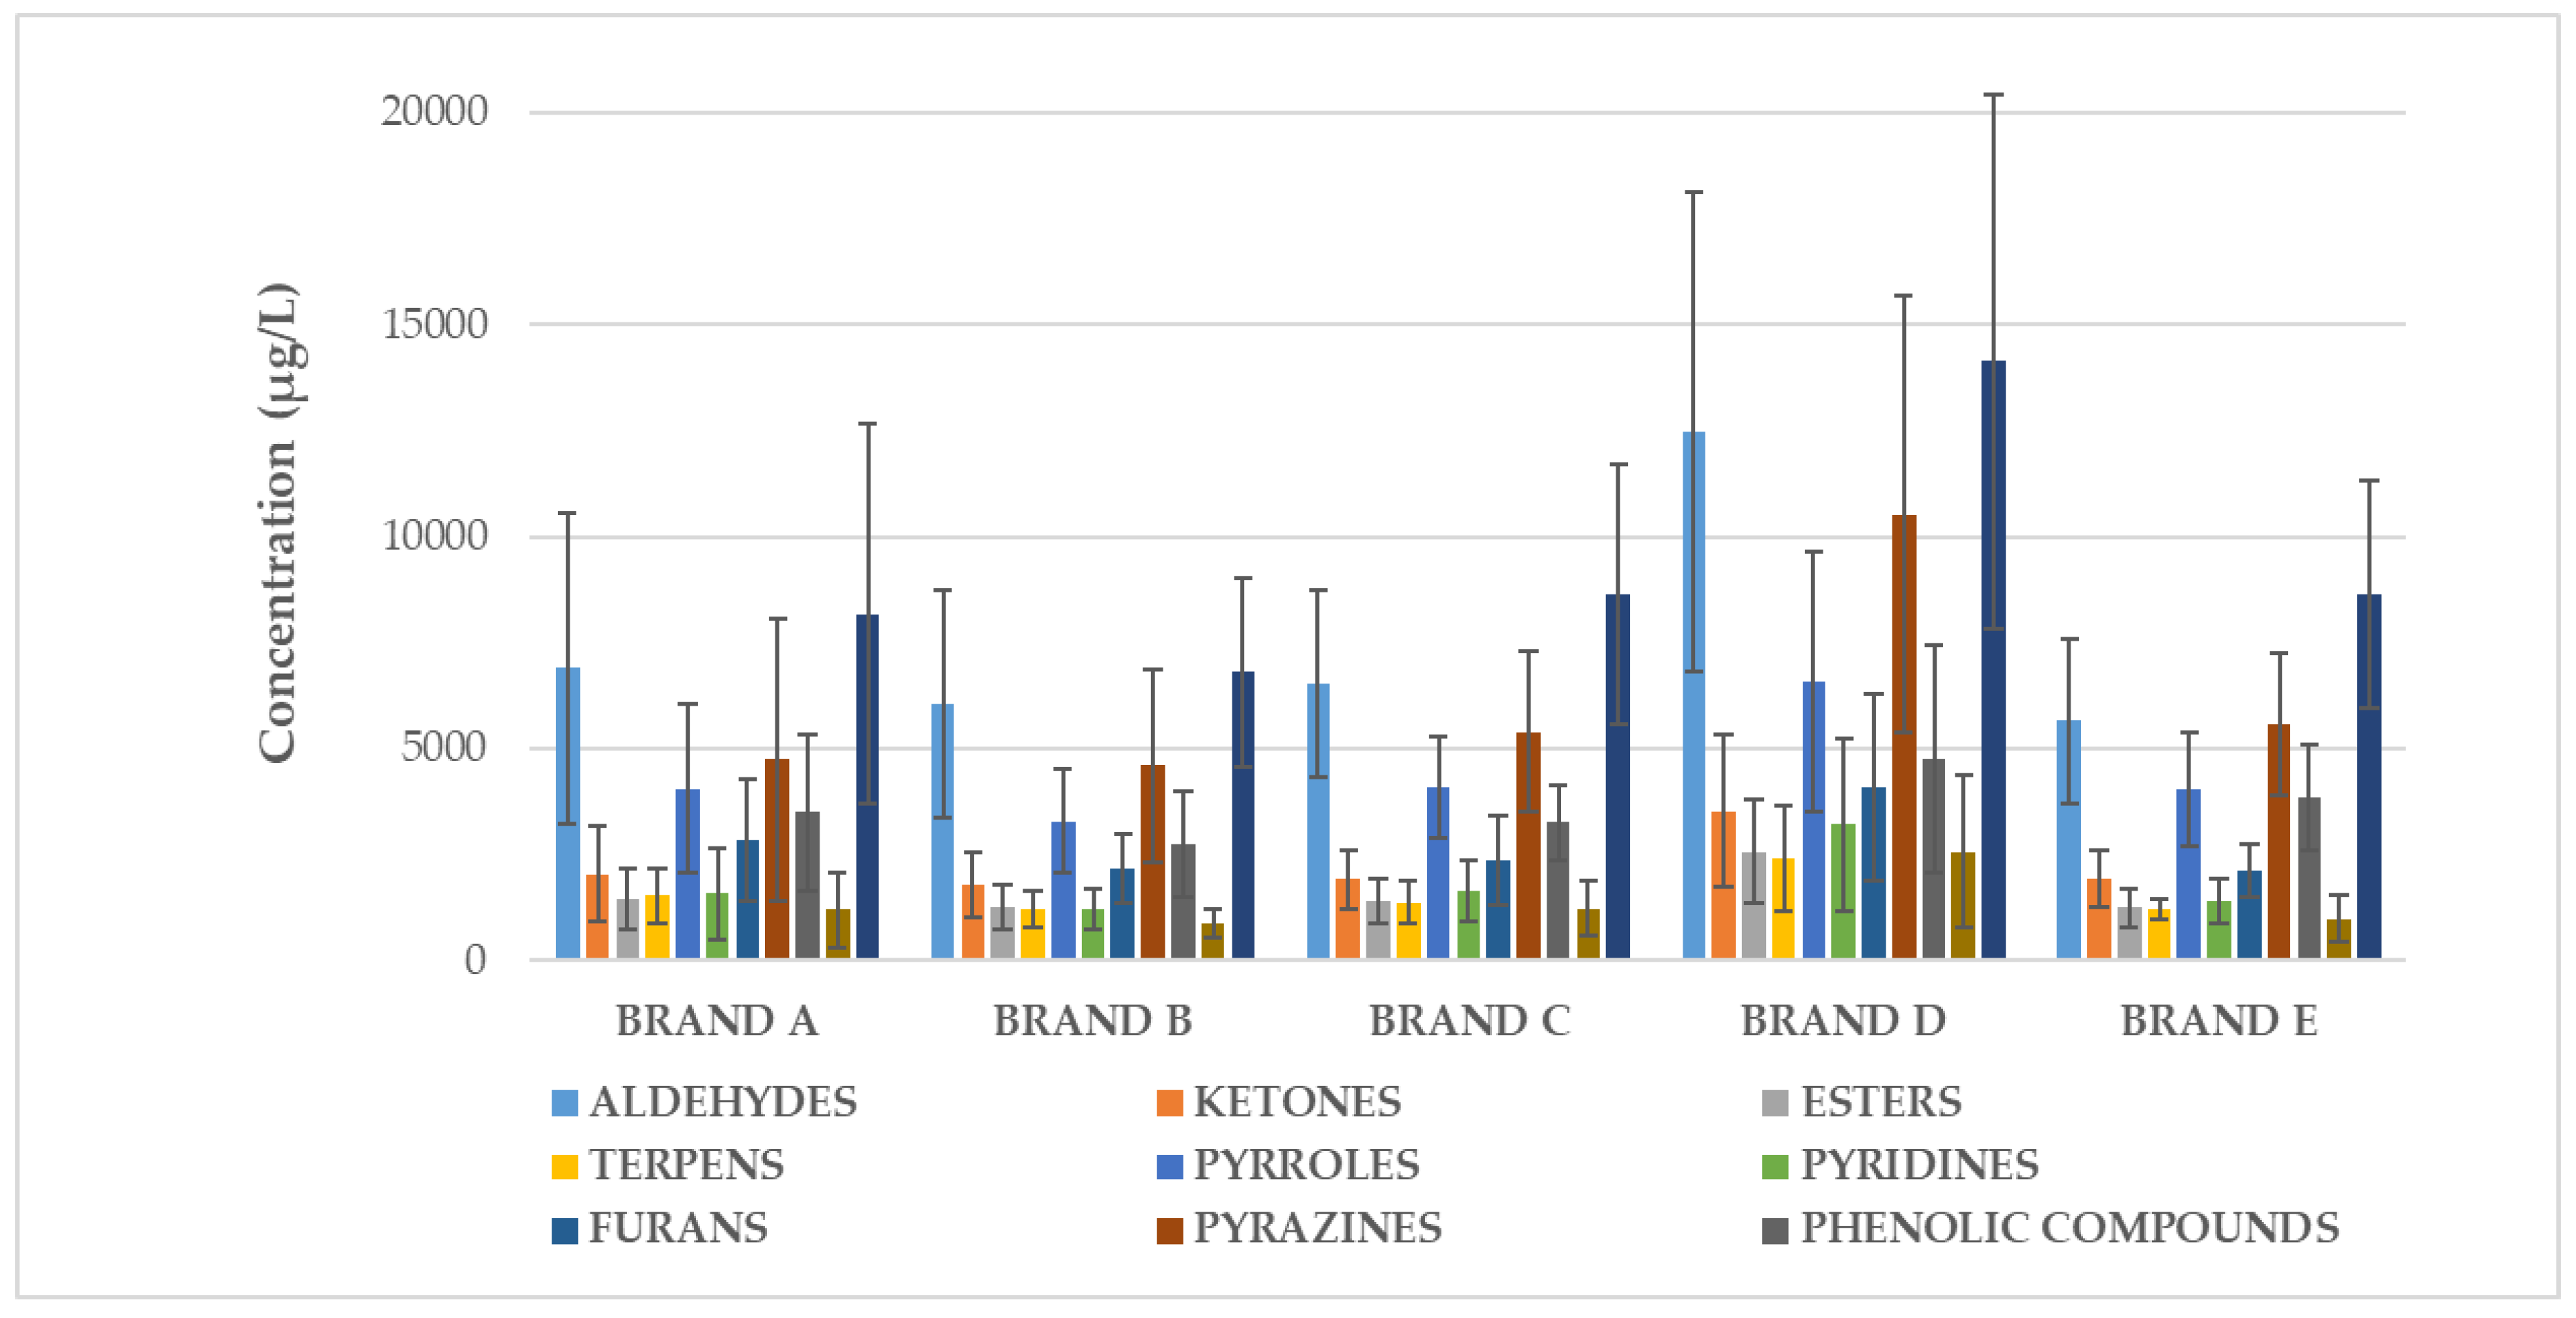
2.1. Volatile Compounds in Espresso Coffees (EC) Brewed by Capsules

More than 70 volatile compounds were detected and grouped by chemical class, including 7 furans, 12 pyrazines, 9 aldehydes, 10 ketones, 5 pyrroles, 9 esters, 2 pyridines, 2 sulfur and 6 phenolic compounds, 3 terpenes, and others, as shown in Table 1. The identified volatiles in the analyzed samples agreed with those reported in other studies for EC [1,11,15,16,17,18,19,20,21].
A semi-quantification of EC volatiles was performed (using the internal standard) and their relative mean and range (min-max) concentrations were expressed as µg/L for samples grouped by brand and reported in Table 2.
These data (Table 2) suggest that the general aroma of ECs from brand D are characterized by a significant higher concentration of volatiles (ANOVA, p < 0.05) belonging to different chemical class.
Distribution of volatile compounds by chemical class for each brand is shown in Figure 1.
In order to better understand which compounds may influence the EC aroma and the final flavor, the overall percentage variability (%CV) referring to the mean total sum of volatile compounds grouped by chemical class and between samples belonging to the same brand was calculated (Table 3).
Inter-brand variability reported in Table 3 resulted falling in the range between 20–75%. This high variability in volatiles content among capsules belonging to the same brand may suggest a wide selection of differently tasting products. Pyrazines and sulfur compounds (especially for brand A and brand D) resulted in the chemical class showing the highest variation, while the lowest variation was found for pyrroles (in particular, for brand C).
Nevertheless, due to the complexity of EC aroma profile and the large dataset considered, it is difficult to correlate the general volatile fraction with aroma profile of EC and final quality.
Therefore, selected key odorants responsible for coffee flavor were investigated, combining previous literature data and chemometrics. Among these compounds, eight were identified as key odorants for coffee aroma according to [1,18] (i.e., 2-methylpropanal, 2-methylbutanal, 3-methylbutanal, 2,3-pentanedione, 2-ethylpyrazine, 2-ethyl-6-methylpyrazine, 2-ethyl-3,5-dimethylpirazine and guaiacol) and listed in Table 4, together with their odor description and contribution on flavor [1,15,16,17]. These substances have been suggested to have either a positive or a negative contribution on flavor, and therefore a correlation with the aroma profile of EC [18].

2.2. Selection of Volatile Markers for EC Samples Classification Among Brands

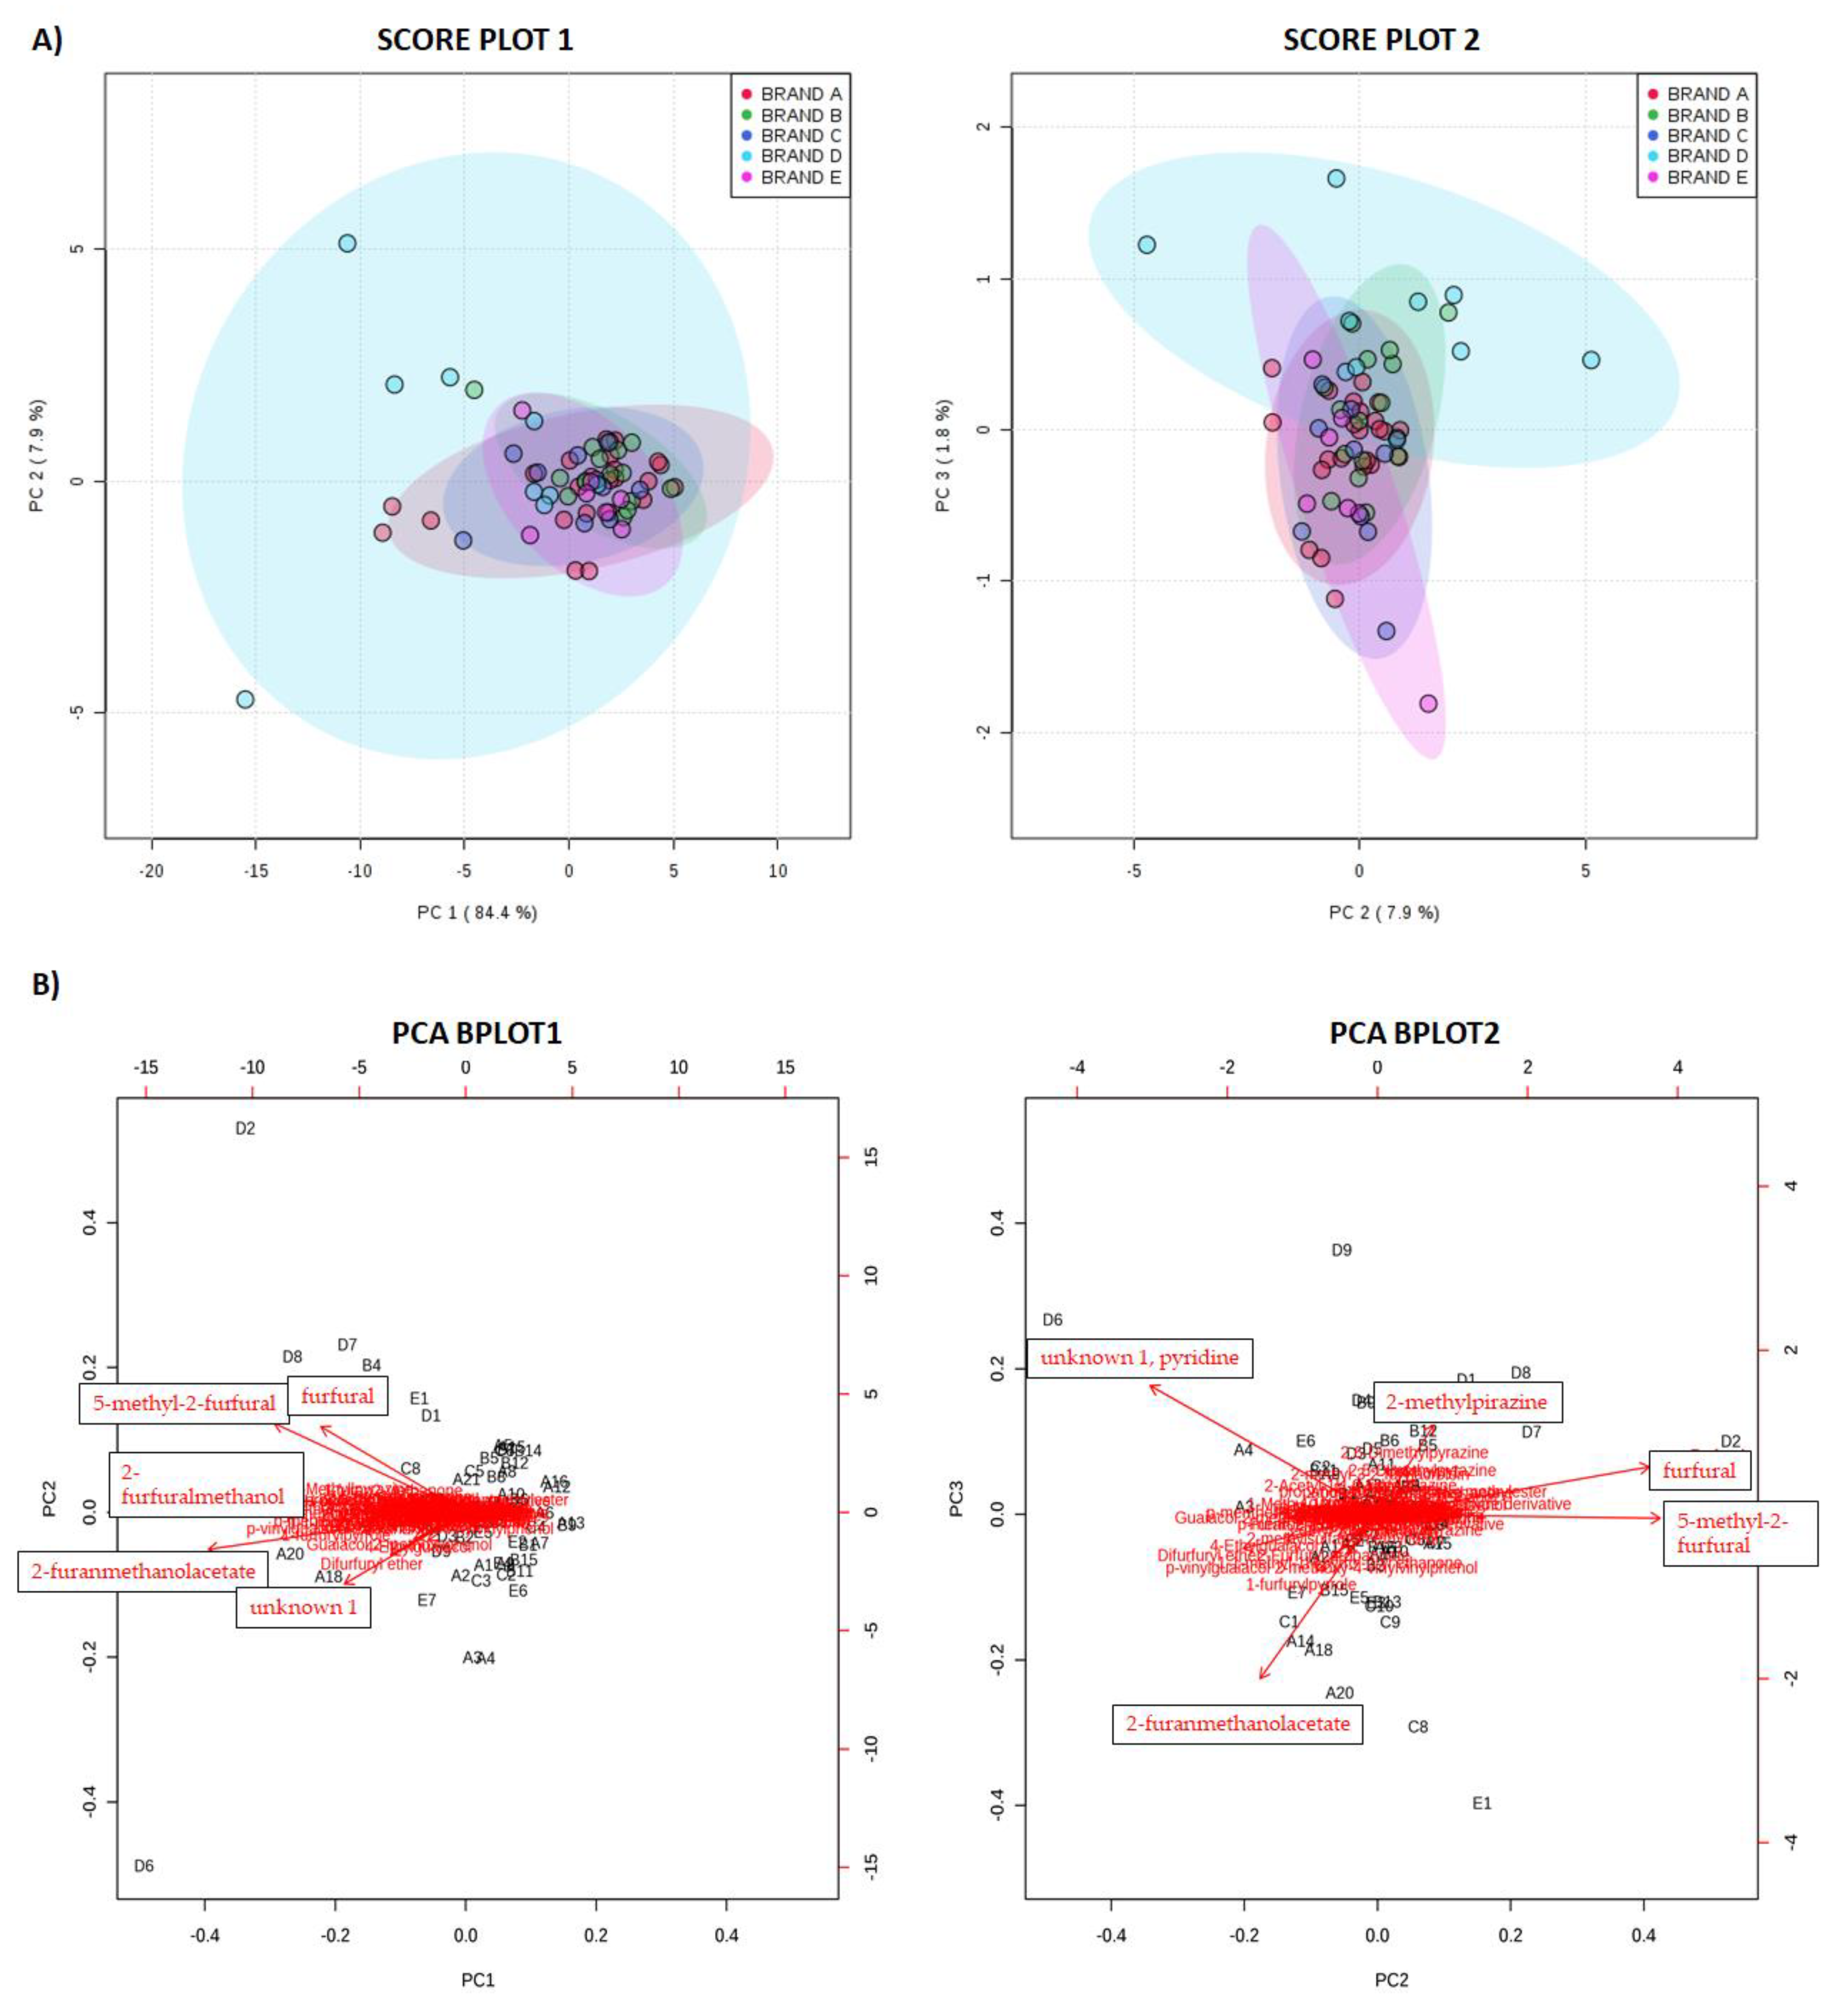
2.2.1. Principal Component Analysis (PCA)

Principal component analysis (PCA) was used to obtain an easily interpretable qualitative description of the eventual differences existing in the aroma profile of EC and, in particular, for ECs belonging to the same brand. PCA was performed on the matrix of 74 volatiles for 65 ECs brewed by capsules, and the principal components (PCs) were constructed with the correlation method. Three PCs were extracted, accounting for 94.1% of the variation in the volatile fingerprint. Plotting the first two components only (Figure 2A), no specific grouping was evidenced, unless for slightly variations for those samples likely added with specific flavor additives or aromatic substances (such as caramel, chocolate, etc.), which showed PC1 negative values. In addition, variables on PC2 axis contributed to a separation of some samples from brand D (differing in roasting degree) which showed the highest variability. On the other hand, although PC2 and PC3 explained only 7.9% and 1.8% of the total variability respectively, they were plotted in a 2D score plot (Figure 2A) and two groups were slightly evidenced, especially on the PC3 axis. Variables with positive coefficients on PC3 (Table S1) resulted to be pyrazines and furfural (and its derivatives) (Figure 2B), responsible for imparting characteristic flavor notes on coffee brew [12] and to group samples belonging to brand D from the others. However, samples of brand D were difficult to classify, probably because they presented the highest inter-brand variability (Table 3), so they exhibited well-defined characteristics for each type of capsule.
Globally, results suggested that EC brewed by capsules belonging to the same brand may present similar characteristics, except for those belonging to brand D, characterized by a high variability.

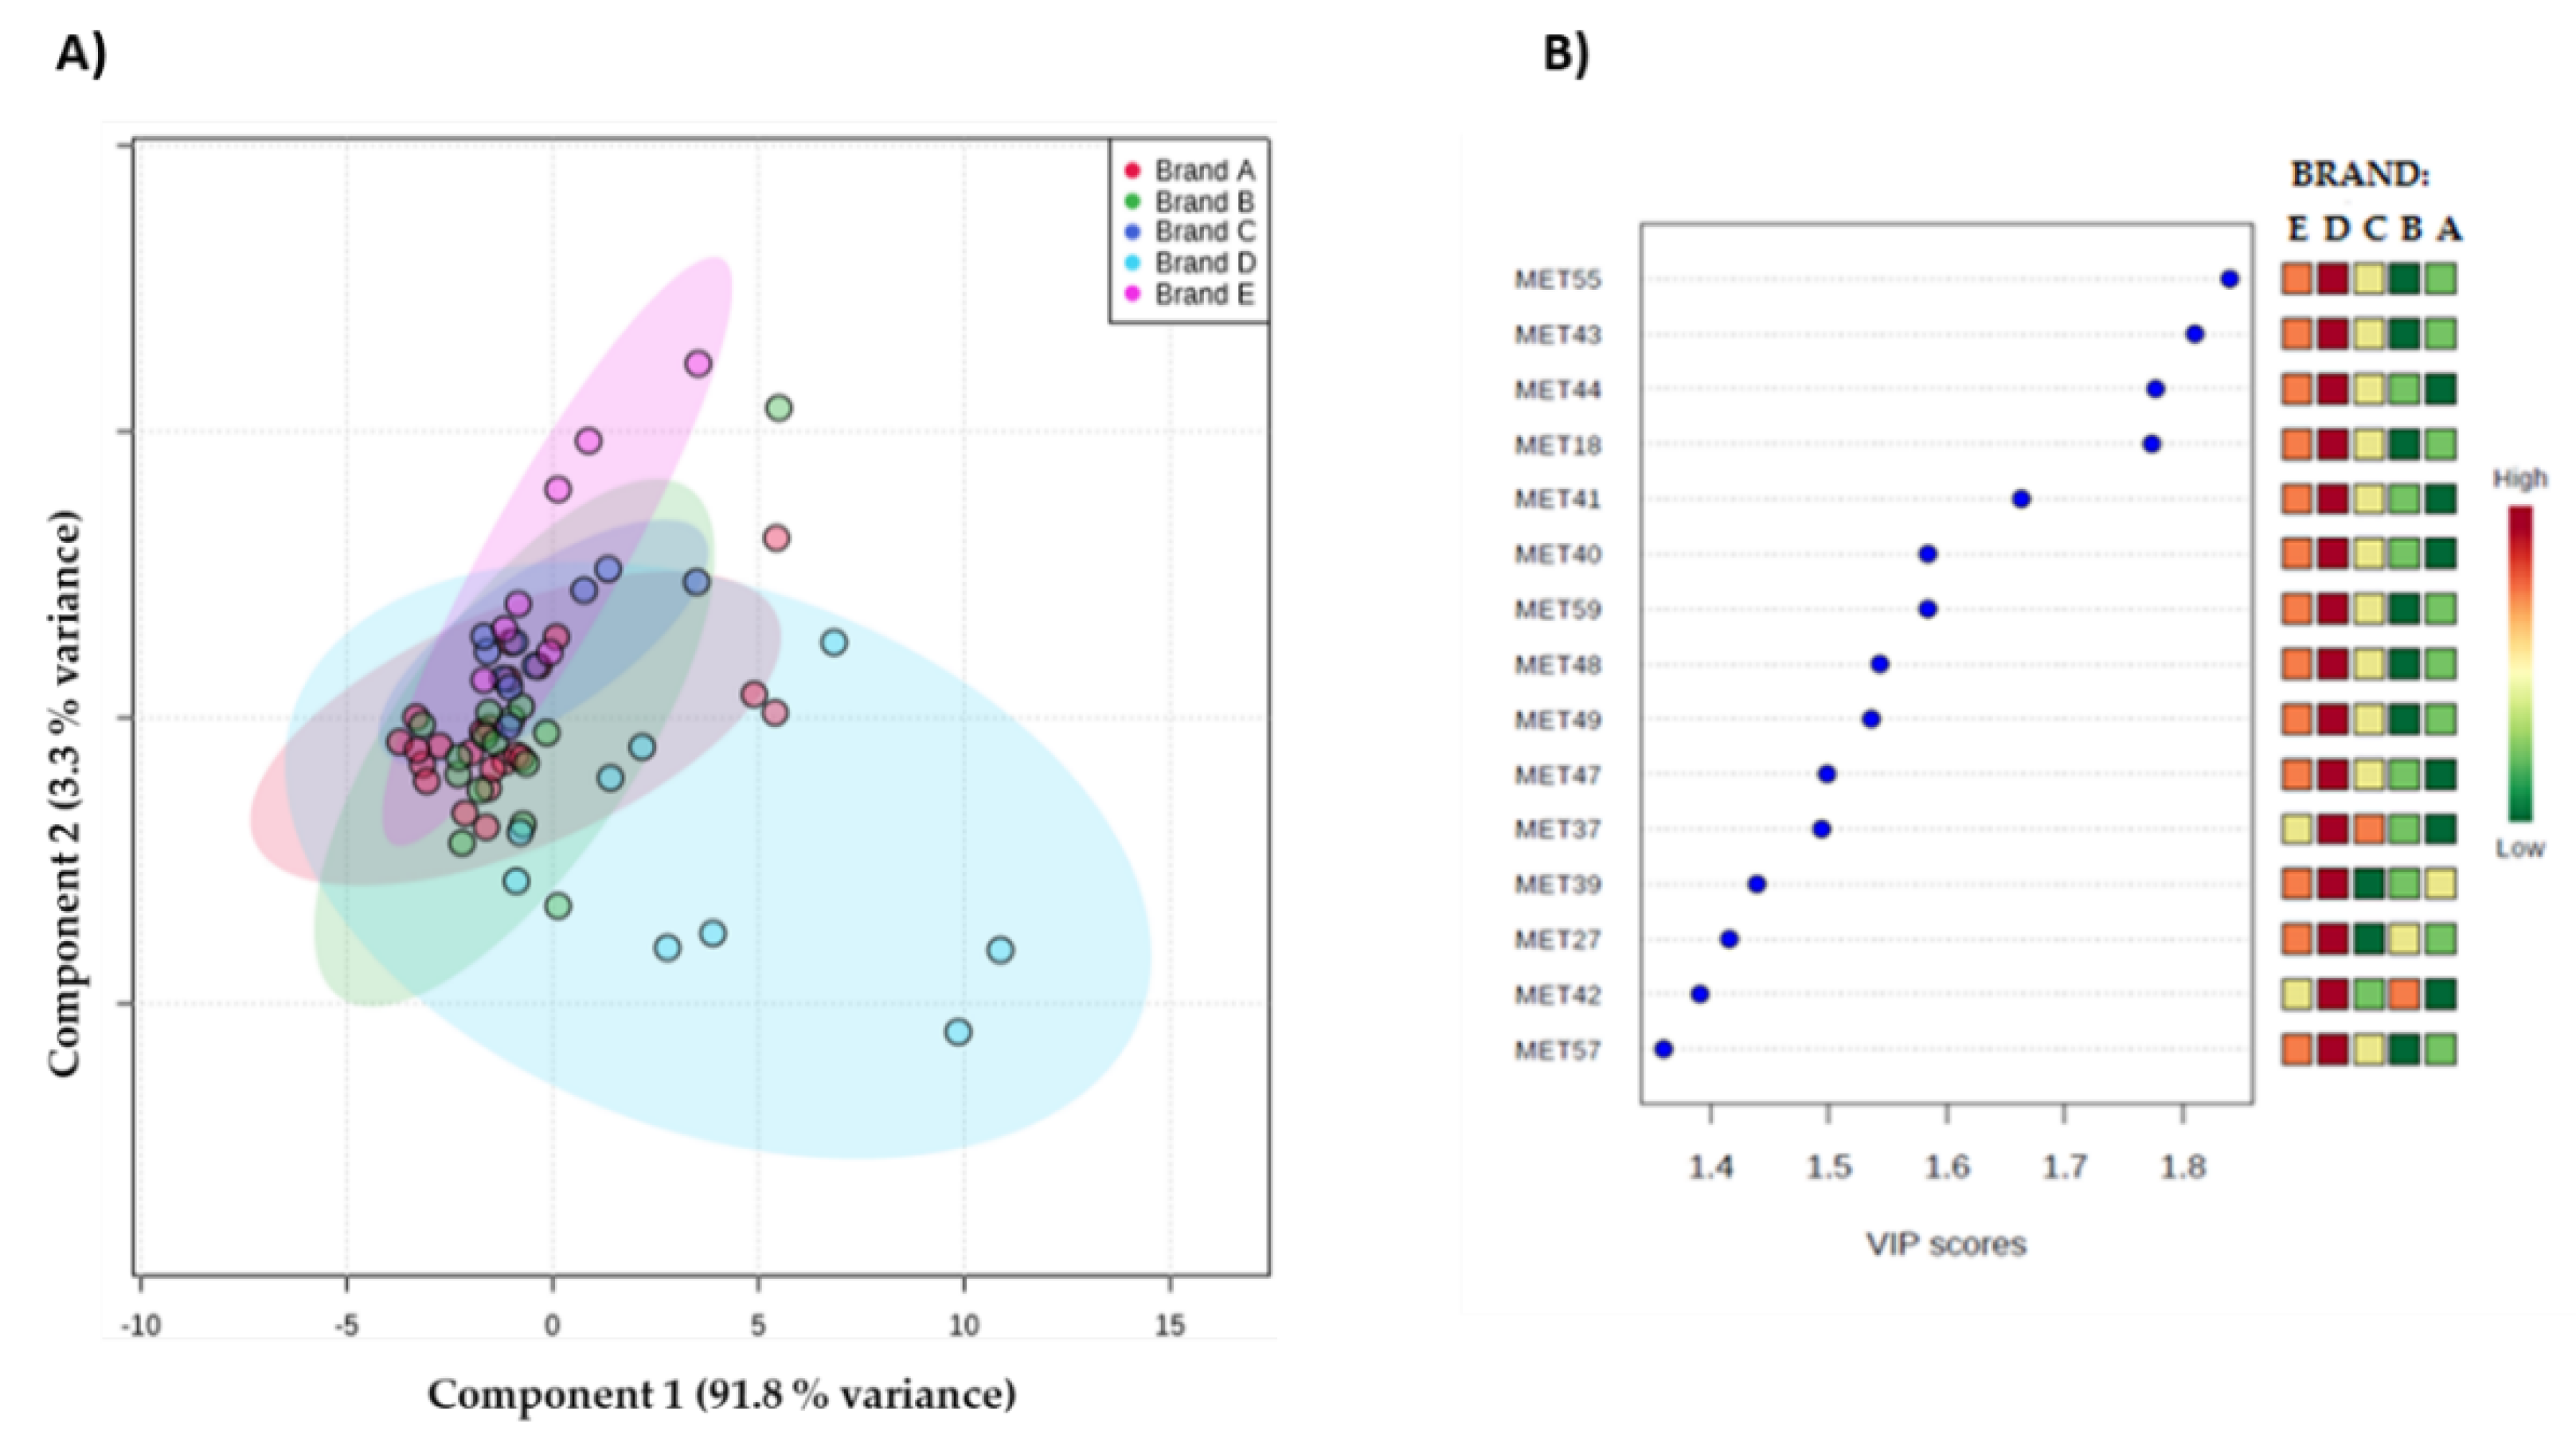
2.2.2. Partial Least Squares–Discriminant Analysis (PLS-DA)

All the metabolites were included in a partial least squares discriminant analysis (PLS-DA) model to additionally screen the chemical composition for capsule-brewed EC aroma according to the brand. Discriminant markers selection was performed merging the metabolites resulting from the PLS-DA loadings plots (Figure 3A) with those obtained using the Variable Influence in Projection (VIP threshold > 1), shown in Figure 3B.
PLS-DA selected 15 compounds as statistically significant volatiles (VIP > 1), including 9 pyrazines (2,6-dimethylpyrazine (MET37), 2-methylpyrazine (MET39), 2,5-dimethylpyrazine (MET40), 2-ethylpyrazine (MET 41), 2,3-dimethylpyrazine (MET42), 2-ethyl-6-methylpyrazine (MET43), 2-ethyl-5-methylpyrazine (MET44), 3-ethyl-2,5-dimethylpyrazine (MET48) and 2,6-diethylpyrazine (MET49)), furfuryl formate (MET18), 1-(furan-2-yl)ethenone (MET27), 1-methyl-1H-pyrrole-2-carbaldehyde derivative (MET55), 1H-pyrrole derivative (MET 57), and two unidentified compounds (MET47 and MET59). In order to simplify data interpretation on the chemical aroma profile, only pyrazines were considered for further evaluation among the volatiles with a high VIP score.
Globally, results highlighted that ECs from brand D contain the highest content of pyrazines in comparison to the other brands (Figure 4), supporting previous results obtained using ANOVA (p < 0.05) (see Table 2) and PCA (Figure 2), and as discussed below.

3. Discussion

In this work, the chemical aroma profile of ECs prepared from capsules from the five most representative brands in Italy were used for classification based on their commercial brands and selected key odorants, by the application of multivariate statistical methods.
Overall, results showed that the qualitative aroma chemical profiles were similar for all the 65 ECs brewed from capsules, especially within the same brand, with some exceptions discussed in detail in the following subsections. The discussion and interpretation of the results in this work highlights the main chemical families, which characterize the EC volatile fraction and contribute to the aroma and final quality of coffee.

3.1. Aldehydes and Ketones

2-methylpropanale, 2-methylbutanale, and 3-methylbutanale are the Strecker degradation products of branched amino acids (valine, isoleucine, and leucine) and they have been suggested to be key odorants and responsible of malty and fermented flavor [1]. The concentration values of these aldehydes (Table 2) are in good agreement with previous literature data [16] (considering that volatiles are diluted in water) and differ among the type/taste of capsules. However, there was no consistent trend in aldehydes content which could indicate a potential difference in the quality and the perceived aroma from capsule-brewed ECs, especially from different brands.
The nine ketones detected in the analyzed samples have been previously shown to impart buttery and creamy notes to coffee [1,16,18,19] and are present at significant higher concentrations (ANOVA, p < 0.05) in the ECs from brand D, and also for 2,3-pentanedione (previously described as key odorant). On the contrary, ECs from brand E contain the lowest level of this compound. However, the detected ketones in this work are present at moderate concentrations in all samples (Table 2) comparing to literature data [19]; thus, it is difficult to explain any aroma differences among them.

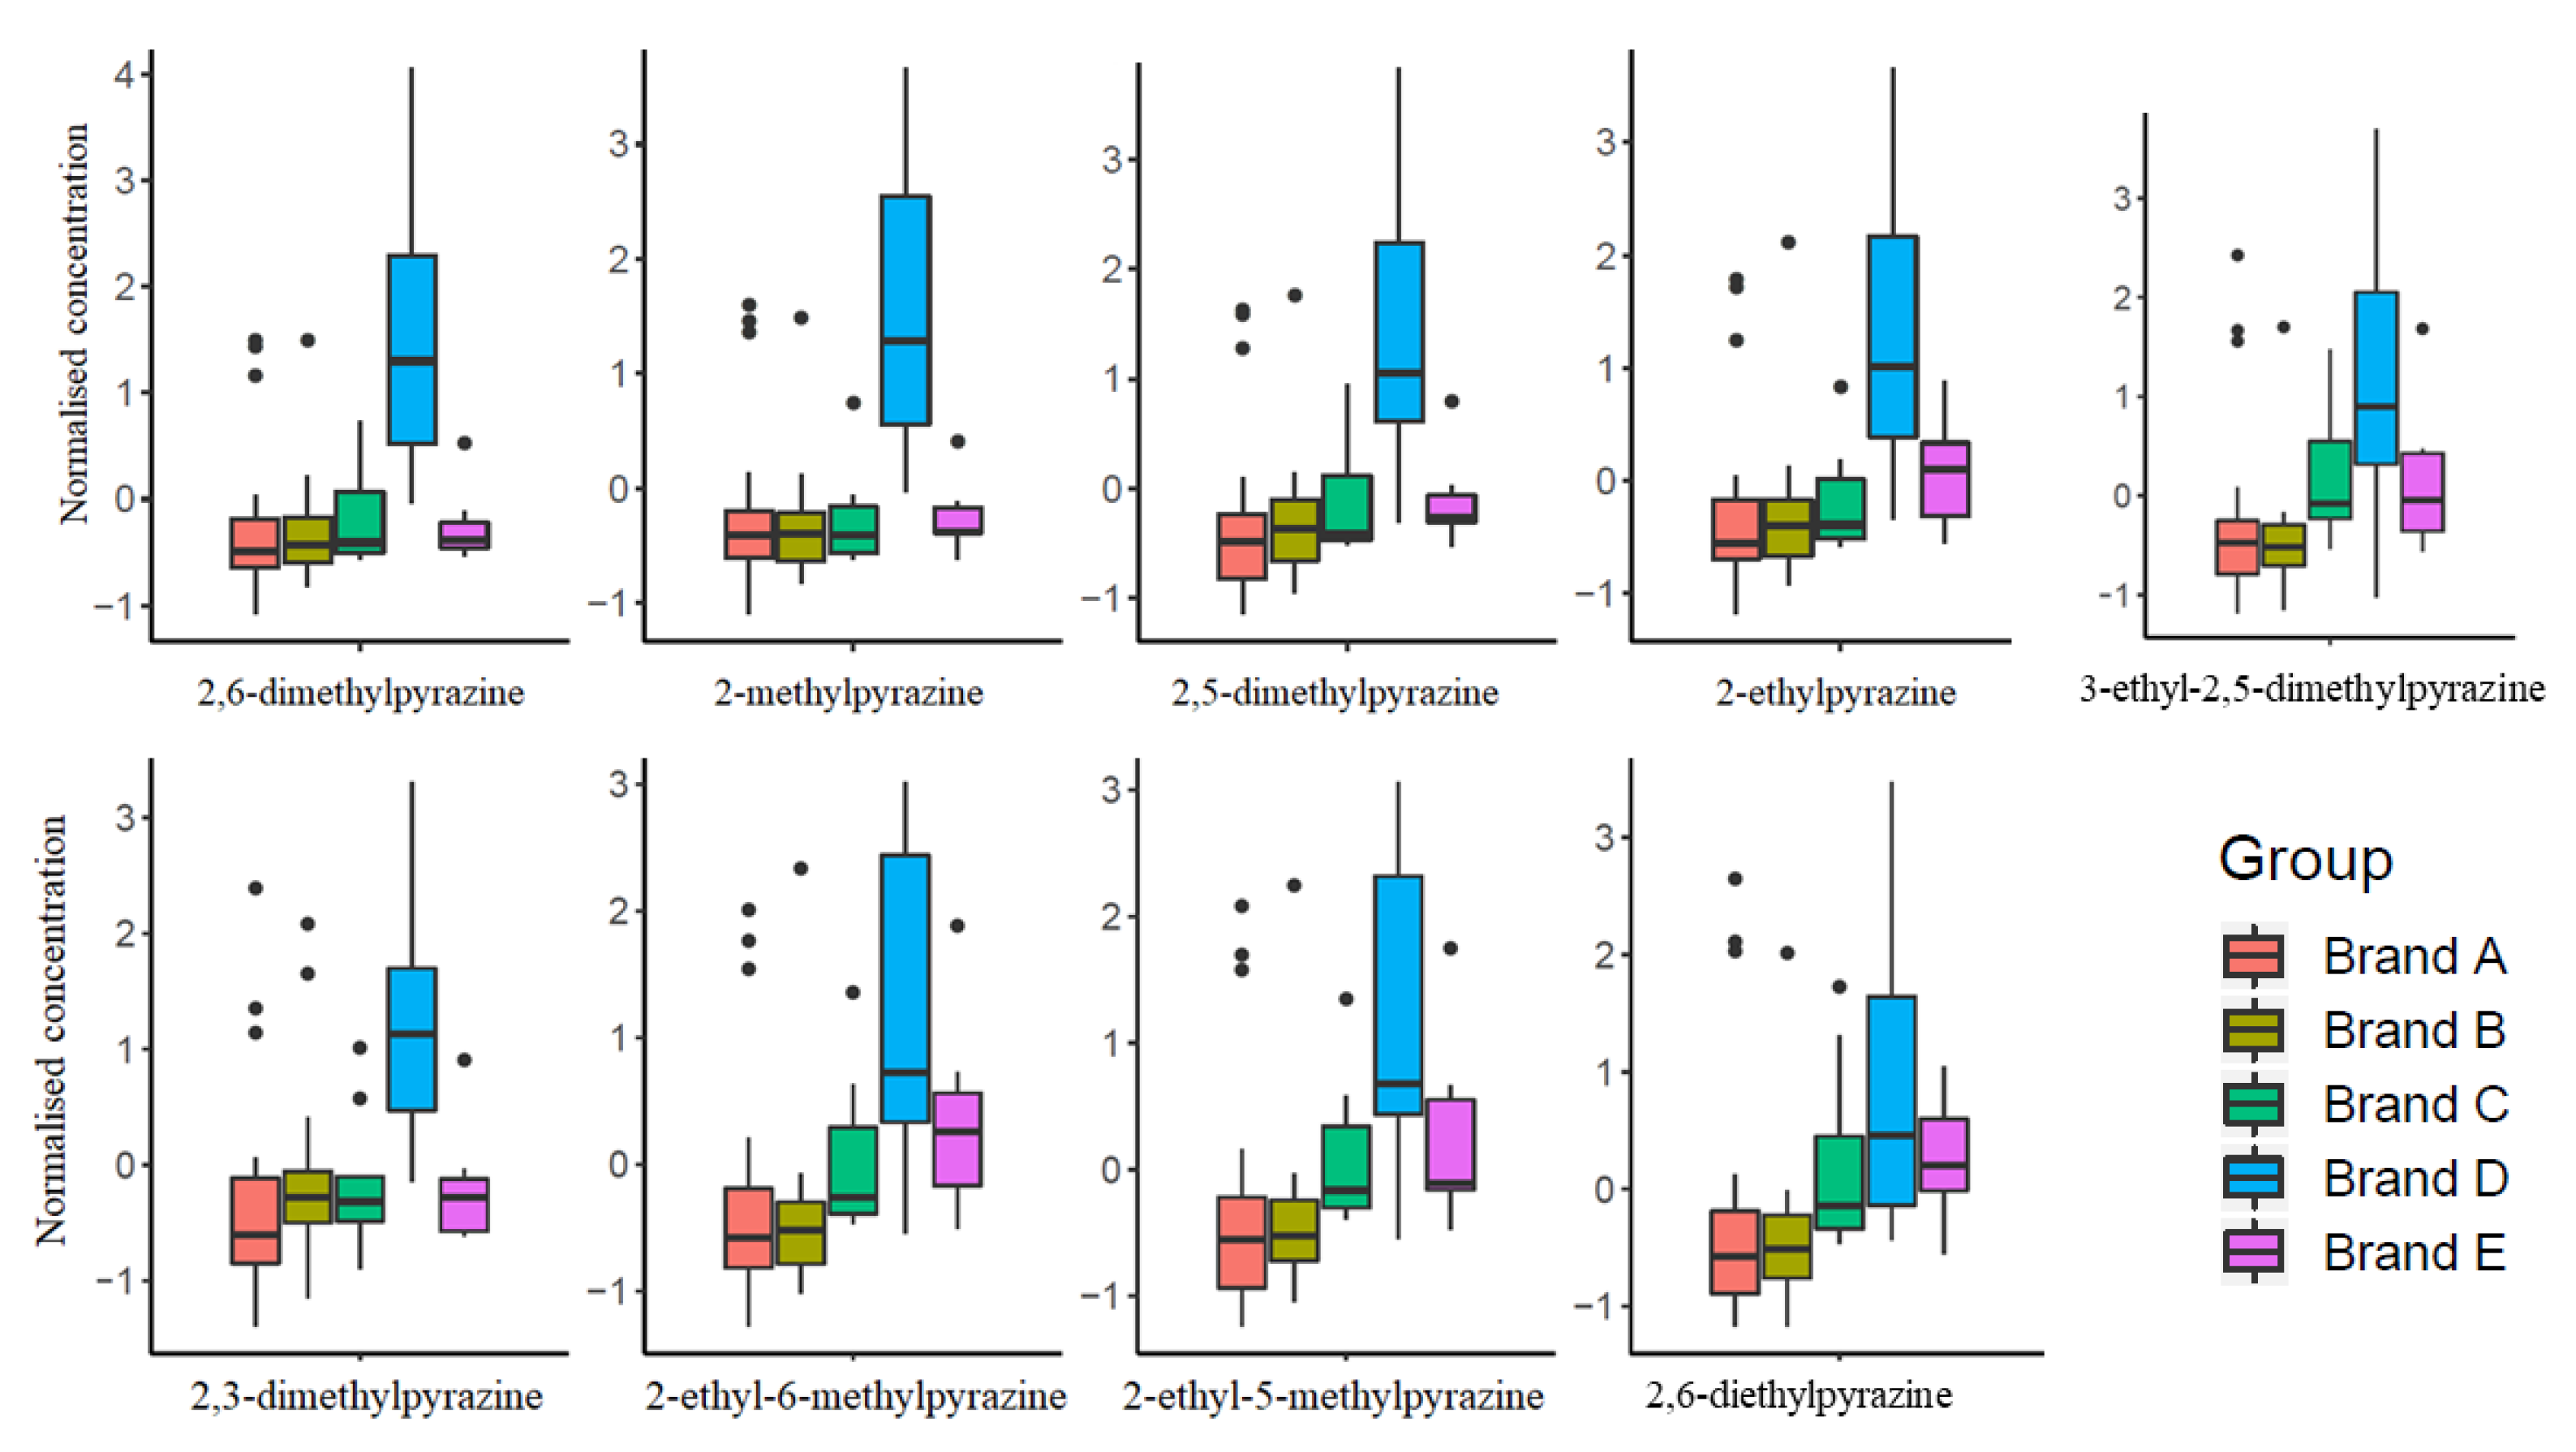
3.2. Pyrazines and Furans

According to data from the literature, pyrazines and furans are not only the major compounds in terms of concentration, but also the main classes contributing to coffee characteristic aroma, through their impact on flavor, imparting earthy, musty, woody, and papery notes [23].
In this work, 12 pyrazines were identified and among these, 2-ethylpyrazine, 2-ethyl-6-methylpyrazine and 2-ethyl-3,5-dimethylpyrazine have been previously indicated as potent key odorants [23,24,25,26]. The concentration pattern of pyrazines semi-quantified in this work resulted statistically different among different brands (p < 0.05) and the selected 9 pyrazines were highlighted in the PLS-DA as statistically important variables (VIP > 1). Along with thiazoles, pyrazines have the lowest odor threshold, therefore they significantly contribute to the coffee aroma. Moreover, structure-related alkylpyrazines from coffee may exhibit similar properties and contribute to the diverse physiological action of coffee [17].
A previous study [12] suggested that high concentration values of pyrazines are related to species and cultivars, mainly roasted powder and brews of Robusta coffee, as 2,3,5-trimethylpyrazine, 2,3-diethyl-5-methylpyrazine, 2-ethyl-5-methylpyrazine, and 3-ethyl-2,5-dimethylpyrazine together with other phenolic compounds (e.g., guaiacol and guaiacol derivatives), alkyl- and furfuryl- pyrroles, pyridine and N-methyl-2-pyrrole-carboxaldheyde. In this study, alkylpyrazines were found at a higher concentration than those previously reported [16] for brewed coffees from green beans. However, these concentrations are lower than those reported for roasted brew coffee [17] both for Robusta and Arabica species, making a classification based on cultivars difficult.
On the other hand, results of PLS-DA showed that capsules from brand D contain the highest number of pyrazines compared to that detected in ECs from the other brands (Figure 4). Among these, 2,6-diethyl-pyrazine belonging to brand D showed the lowest concentration (150.0 µg/mL) in decaffeinated espresso coffee, so comparable to other decaffeinated espressos from the other brands (the lowest value is 70.0 µg/mL from brand A) (Table 2). This result is also in agreement with data reported in the literature for decaffeinate ECs, which generally contain lower concentration of pyrazines, probably due to the decaffeination procedure [17].
As a whole, EC capsules from brand D are characterized by an intense characteristic aroma and a stronger note than those of other brands, especially with respect to brand A and brand B characterized by a finer flavor.
Regarding furans, eight compounds were detected in all the analyzed EC samples, except for vinyl furan, which generally showed the lowest mean concentration range among these compounds (0–80.6 µg/L). In 1995, the International Agency for Research on Cancer (IARC) classified furan as type 2B— “possibly carcinogenic to humans”. In addition, furans, mostly generated upon roasting from the thermal degradation of endogenous components during the Maillard reaction, and their metabolites (i.e., methyl furans), are suggested to contribute to furan toxicity. Despite coffee being a significant dietary source of methyl furans (where 2-methylfuran levels consistently exceed those of furan), in 2016 the IARC completed their reassessment on the potentially carcinogenic effects of coffee, reclassifying it as type 3—“not classifiable as to its carcinogenicity to humans”—due to insufficient evidence [27]. In fact, there are some gaps of knowledge about the toxicity of furan and methyl furans, especially about exposure to them [28].
Amongst numerous factors, furan and its methyl derivatives concentration in the EC cup depend on coffee composition, processing steps, and brewing methods. In a previous study [27], coffee brewed from capsules was suggested to provide the minimum exposure to furan and its derivatives with respect to other brewing methods (except for instant coffee, which exhibited furans levels below the limit of detection), contributing least to consumer’s dietary exposure to furans from coffee [28]. These data are in contrast with those reported by other authors, suggesting that commercial packed coffee capsules showed higher furan and furan derivatives concentrations than those detected in coffee samples from other brewing methods [29].
In this work, no detectable levels of furan were found in EC samples, according to previous data [27]. Regarding furan methyl derivatives, concentrations of 2-methylfuran and 2,5-dimethylfuran ranged from 45.0 to 531.0 µg/L and from 9.0 to 112.0 µg/L (Table 2) for all samples, respectively. It is noticeable that the concentration pattern of methyl furans shows a high variability and, in some cases, results higher than those reported by [27], however, they fall in the range reported by others [28,29]. An interesting result is that samples, mainly ECs from brand A and brand B, showed a significant variability among methyl furan derivatives concentrations. Among these, the samples added to specific flavor additives or aromatic substances (such as caramel and chocolate) resulted to be characterized by the highest levels of methylfurans, especially 2,5-dimethylfuran, which exceeded the reported ranges by [27]. The presence of these flavor additives known to contain significant level of furans [28] could have contributed to increase their concentrations in the coffee brew. On the contrary, capsules-brewed ECs from brand C and brand E show significant lower content of methyl furans than those from the other brands, especially for 2,5-dimethylfuran (21.0 µg/L and 14.3, respectively).
Overall, these results provide further data about methyl furans content in ECs brewed from capsules and might be useful to for the evaluation of furan and its derivatives’ exposure.

3.3. Phenolic and Sulfur Compounds

Among phenolic compounds, guaiacol was detected in all the samples with a concentration range of 210.0–3010.0 µg/L and classified as a key odorant with a spicy and phenolic note [12]. However, no statistically significant differences in the number of phenolic compounds, defined as key odorants, were found among brands (ANOVA, p ≥ 0.05), indicating that, in this work, concentration patterns of these volatiles had scarce significance for discriminating aroma chemical differences.
Sulfur-containing compounds were the most likely group to undergo changes during the analysis, probably due to evaporation, oxidation, degradation, and/or interactions with the brewed coffee matrix [16].
Fresh roasted coffee generally contains very low amounts of mercaptans, but during storage they increase considerably [12].
In this study, especially dimethylsulfide (not quantifiable) and 2-(methylsulfanylmethyl)furan were detected in most of the analyzed ECs (Table 2), in accordance with data reported in the literature [12,30,31]. The high variability in their concentration (Table 3) is possibly due to the species, the different way of processing (drying/roasting) and storage conditions, including packaging.
Robusta is known to contain more 2-(methylsulfanylmethyl)furan that Arabica [12]. Concentrations of this volatile in ECs from capsules of brand B (mean 306.3 µg/L) and brand D (mean 730.0 µg/L) significantly differed (ANOVA, p < 0.05). However, both concentration ranges for this compound fitted with those measured for Arabica and mixtures obtained in previous studies [30], thus not being able to discriminate between species, chemical aroma profile, and quality differences.

4. Materials and Methods

4.1. Materials

Capsules from sixty-five different types of coffee capsules belonging to five different brands (named A to E), together with their relative coffee machines, were purchased on local markets in Parma (Italy) or through online stores during 2016 (23 capsules from brand A; 15 capsules, brand B; 10 capsules, brand C; 10 capsules, brand D; and 7 capsules, brand E). Details on the type of coffee are fully described in reference [7].
Toluene, 2-methylbutanal, 3-methylbutanal, 2,3,5-trimethylpyrazine, and 1H-pyrrole-2-carbaldehyde were purchased from Sigma-Aldrich (St. Louis, MO, USA).

4.2. Preparation of Espresso Coffee

Samples were prepared as previously described [7]. Briefly, ECs were brewed with bi-distilled water by using the coffee capsule with its relative brand machine, according to the manufacturer’s instructions in terms of coffee volume and extraction time. Aliquots of the brewed coffees (3 mL) were placed in a vial for HS-SPME/GC-MS tightly capped with a silicone/Teflon septum cap and stored at −80 °C until analysis, as described in the following.

4.3. Determination of Volatile Profile of ECs

4.3.1. Headspace Solid-Phase Microextraction (HS-SPME)/GCMS

HeadSpace-Solid Phase Microextraction-Gas Chromatography (HS-SPME/GC-MS) was used to determine the volatile profile of EC from capsules, according to [1] slightly adapted.
Then, 3 mL of coffee sample were added to 10 µL of the standard solution of toluene in H2O at 0.3 mg/mL. Samples were analyzed using a HT2800T autosampler (HTA srl, Brescia, Italy) connected to a GC-MS system (Thermo Trace 1300 gas chromatograph (Thermo Fisher Scientific, Waltham, Massachusetts, USA) coupled to a Thermo Scientific ISQ GC-Single Quadrupole Mass Spectrometer (Thermo Fisher Scientific). Sample was equilibrated at 60 °C for 5 min; then, a PDMS fiber (SUPELCO, Bellefonte, PA, USA) was performed for the extraction (25 min) at the same temperature with shaking.
Volatile compounds were desorbed for 3 min and injected into the GC-MS system by splitless injection (250 °C; 2 min valve delay). Separation was performed on a SUPELCO-Wax column (SUPELCO; 30 m × 250 μm i.d., film thickness 0.25 μm). Helium was used as the carrier gas at a constant flow rate of 1 mL/min. Oven temperature program was isothermal for 3 min at 40 °C, raised to 200 °C at a rate of 3 °C min−1 and maintained at 200 °C for 5 min. The mass spectrometer operated in the electron impact (EI) ionization mode (70 eV) with a scan range of 40–400 m/z. The ion source temperature was set at 230 °C. All analytical samples were randomized for GC-MS analysis.
Fiber blanks were run daily to ensure the absence of contaminants or carry-over. Before use, all fibers were conditioned as recommended by the manufacturer, and tested to evaluate the consistency of their performance versus a reference EC coffee sample.

4.3.2. Identification of Volatiles in ECs

Compounds were identified based on their retention indices (RI) on the SUPELCO Wax column, their mass spectra, and the injection of pure standard when available. A series of n-alkanes (C8–C30) was analyzed to establish RI, as Kovats Indices, which were compared with data from the literature. The mass spectra were compared with those from NIST 11 library. Volatile and identified coffee compounds were grouped by chemical families (furans, pyrazines, pyrroles, pyridines, esters, aldehydes and ketones, among others, being terpenes, sulfur, and phenolic compounds).
The relative concentration of each identified volatile substance was defined by manually integrating its peak area and calculating with respect to the internal standard, and expressed as µg/L.

4.4. Statistical Analysis

Data were collected with Xcalibur 2.2 SP1 w Foundation 2.0 SP1. Data set was normalized by auto scaling (x-mean(x)/S.D.(x)) for further statistical analysis. Unsupervised PCA and supervised PLS-DA models were applied. PCA was applied as a preliminary analysis to better understand the relationships among individual ECs. PLS-DA model was fitted using brand as an outcome or response variable and volatile compounds as predictor set.
To quantify the rank of the volatile compounds, Variable Importance in Projection (VIP) scores were used [32]. A variable with a VIP score greater than 1 can be considered significant/important in the model. Analysis was done using R (v3.6.1) and Metaboanalyst’s output [33]. Model statistics were quantified based on the fraction of the sum of squares for the selected component (R2), which equates to the percentage of the model variance explained, and the predictive ability (Q2). Cross-validation was performed to predict and estimate the model performance (whether models were over fitted). For PLS-DA models, random permutation was used, whereby the class membership of individual samples was permuted randomly.
ANOVA and post hoc Tukey test (p < 0.05) were performed using SPSS statistical software (Version 21.0, SPSS Inc., Chicago, IL, USA) to evaluate significant differences in selected volatile concentrations among groups (i.e., ECs belonging to different brands).

5. Conclusions

HS-SPME/GC-MS analysis of EC aroma is a simple, rapid, sensitive, and high reproducible method, because the direct sampling does not require further operations (such as extraction) and provides the detection of a wide number of volatiles, giving the chemical fingerprint of the investigated samples. Results from multivariate statistical analysis showed that, based on their chemical aroma profile, all the analyzed ECs brewed from capsules could not be differentiated by specific sensory notes and according to the profiling of the products; except for capsule-brewed ECs from a specific brand (brand D), that are generally characterized by a stronger note if compared to others, characterized by a finer flavor.
Moreover, results may indicate that there is a characteristic starting coffee powder for each different brand, which can be slightly modified by adding coffee powders of specific species, origin, and roasting.
However, the addition of additives or aromatic substances (e.g., caramel, chocolate, vanilla, etc.) may obviously be responsible for the sensory attributes of some capsules and might be used to increase the variety of EC types/tastes. The relationship between the aromatic profile and the high quality of drinks, together with volatile markers of good quality, still requires further studies, especially on sensory attributes.

Supplementary Materials

The following are available online at https://0-www-mdpi-com.brum.beds.ac.uk/1420-3049/25/5/1166/s1, Table S1: PC3 score coefficients of variables related to concentrations (µg/L) of detected volatiles in EC samples.

Author Contributions

Conceptualization, V.L., M.T., D.A., P.M., and A.C.; methodology, V.L., M.T., and D.A.; investigation, V.L., A.A., and P.M.; resources, D.D.R., and A.C.; writing—original draft preparation, V.L.; writing—review and editing, V.L., P.M., and A.C.; supervision, P.M., and A.C. All authors have read and agreed to the published version of the manuscript.

Funding

This research received no external funding. A.A. was supported by the National Institute for Health Research (NIHR) Surgical Reconstruction and Microbiology Research Centre (SRMRC), Birmingham, United Kingdom.

Acknowledgments

Authors thank Francesca Zicca for her support with sample preparation and analysis. The views expressed in this publication are those of the authors and not necessarily those of the NHS, the National Institute for Health Research, the Medical Research Council or the Department of Health, United Kingdom.

Conflicts of Interest

The authors declare no conflict of interest.

References

  1. Caprioli, G.; Cortese, M.; Cristalli, G.; Maggi, F.; Odello, L.; Ricciutelli, M.; Sagratini, G.; Sirocchi, V.; Tomasoni, G.; Vittori, S. Optimization of espresso machine parameters through the analysis of coffee odorants by HS-SPME/GC/MS. Food Chem. 2012, 135, 1127–1133. [Google Scholar] [CrossRef]
  2. Gloess, A.N.; Schonbachler, B.; Klopprogge, B.; D’Ambrosio, L.; Chatelain, K.; Bongartz, A.; Strittmatter, A.; Rast, M.; Yeretzian, C. Comparison of nine common coffee extraction methods: Instrumental and sensory analysis. Eur. Food Res. Technol. 2013, 236, 607–627. [Google Scholar] [CrossRef] [Green Version]
  3. International Coffee Organization. Available online: http://www.ico.org/Market-Report-19-20-e.asp (accessed on 8 January 2020).
  4. Wanga, X.; William, J.; Fu, Y.; Lima, L.T. Effects of capsule parameters on coffee extraction in single-serve brewer. Food Res. Int. 2016, 89, 797–805. [Google Scholar] [CrossRef]
  5. Lopes, G.R.; Ferreira, A.S.; Pinto, M.; Passos, C.P.; Coelho, E.; Rodrigues, C.; Figueira, C.; Rocha, S.M.; Nunes, F.M.; Coimbra, M.A. Carbohydrate content, dietary fibre and melanoidins: Composition of espresso from single-dose coffee capsules. Food Res. Int. 2016, 89, 989–996. [Google Scholar] [CrossRef]
  6. Di Bella, G.; Potortì, A.G.; Lo Turco, V.; Saitta, M.; Dugo, G. Plasticizer residues by HRGC–MS in espresso coffees from capsules, pods and moka pots. Food Control. 2014, 41, 185–192. [Google Scholar] [CrossRef]
  7. Angelino, D.; Tassotti, M.; Brighenti, F.; Del Rio, D.; Mena, P. Niacin, alkaloids and (poly)phenolic compounds in the most widespread Italian capsule-brewed coffees. Sci. Rep. 2018, 8, 17874. [Google Scholar] [CrossRef] [PubMed]
  8. Coppola, D. Market Share of Coffee Pods and Capsules for Offices in Italy from 2014 to 2018. Available online: https://0-www-statista-com.brum.beds.ac.uk/statistics/693074/market-share-of-coffee-pods-and-capsule-for-offices-in-italy/ (accessed on 26 January 2020).
  9. Dong, W.; Hu, R.; Long, Y.; Li, H.; Zhang, Y.; Zhu, K.; Chu, Z. Comparative evaluation of the volatile profiles and taste properties of roasted coffee beans as affected by drying method and detected by electronic nose, electronic tongue, and HS-SPME/GC-MS. Food Chem. 2019, 272, 723–731. [Google Scholar] [CrossRef] [PubMed]
  10. Pua, A.; Lau, H.; Liu, S.Q.; Tan, L.P.; Goh, R.M.V.; Lassabliere, B.; Leong, K.C.; Sun, J.; Cornuz, M.; Yu, B. Improved detection of key odourants in Arabica coffee using gas chromatography-olfactometry in combination with low energy electron ionisation gas chromatography-quadrupole time-of-flight mass spectrometry. Food Chem. 2020, 1, 125370. [Google Scholar] [CrossRef] [PubMed]
  11. Petisca, C.; Pérez-Palacios, T.; Pinho, O.; Ferreira, I.M.P.L.V.O. Optimization and Application of a HS-SPME/GC-MS Methodology for Quantification of Furanic Compounds in Espresso Coffee. Food Anal. Methods 2014, 7, 81–88. [Google Scholar] [CrossRef]
  12. Toledo, P.R.A.B.; Pezza, L.; Pezza, H.R.; Toci, T. Relationship Between the Different Aspects Related to Coffee Quality and Their Volatile Compounds. Comprehensive Reviews in Food Science and Food Safety. Compr. Rev. Food Sci. Food Saf. 2016, 15, 705–719. [Google Scholar] [CrossRef] [Green Version]
  13. Melo Pereira, G.V.; de Carvalho Neto, D.P.; Magalhães Júnior, A.I.; Vásquez, Z.S.; Medeiros, A.B.P.; Vandenberghe, L.P.S.; Soccol, C.R. Exploring the impacts of postharvest processing on the aroma formation of coffee beans—A review. Food Chem. 2019, 272, 441–452. [Google Scholar] [CrossRef] [PubMed]
  14. Illy, A.; Viani, R. Espresso Coffee: The Science of Quality, 2nd ed.; Elsevier Academic Press: London, UK, 2005; pp. 1–20. [Google Scholar]
  15. Kulapichitr, F.; Borompichaichartkul, C.; Suppavorasatit, I.; Cadwallader, K.R. Impact of drying process on chemical composition and key aroma components of Arabica coffee. Food Chem. 2019, 291, 49–58. [Google Scholar] [CrossRef] [PubMed]
  16. Bressanello, D.; Liberto, E.; Cordero, C.; Rubiolo, P.; Pellegrino, G.; Ruosi, M.R.; Bicchia, C. Coffee aroma: Chemometric comparison of the chemical information provided by three different samplings combined with GC–MS to describe the sensory properties in cup. Food Chem. 2017, 214, 218–226. [Google Scholar] [CrossRef] [PubMed]
  17. Pickard, S.; Becker, I.; Merz, K.H.; Richling, E. Determination of the Alkylpyrazine Composition of Coffee Using Stable Isotope Dilution-Gas Chromatography-Mass Spectrometry (SIDA-GC-MS). J. Agric. Food Chem. 2013, 61, 6274–6281. [Google Scholar] [CrossRef] [PubMed]
  18. Maetzu, L.; Sanz, C.; Andueza, S.; Paz De Pena, M.; Bello, J.; Cid, C. Characterization of Espresso Coffee Aroma by Static Headspace GC-MS and Sensory Flavour Profile. J. Agric. Food Chem. 2001, 49, 5437–5444. [Google Scholar]
  19. Caporaso, N.; Whitworth, M.B.; Cuic, C.; Fiska, I.D. Variability of single bean coffee volatile compounds of Arabica and robusta roasted coffees analysed by SPME-GC-MS. Food Res. Int. 2018, 108, 628–640. [Google Scholar] [CrossRef]
  20. Ochiai, N.; Tsunokawa, J.; Kikuo Sasamoto, K.; Hoffmann, A. Multi-volatile method for aroma analysis using sequential dynamic headspace sampling with an application to brewed coffee. J. Chromatogr. A 2014, 1371, 65–73. [Google Scholar] [CrossRef] [Green Version]
  21. Bonvehí, J.S. Investigation of aromatic compounds in roasted cocoa powder. Eur. Food Res. Technol. 2005, 221, 19–29. [Google Scholar] [CrossRef]
  22. Flament, I. Coffee Flavor Chemistry, 1st ed.; John Wiley and Sons: Hoboken, NY, USA, 2002; pp. 81–335. [Google Scholar]
  23. Toci, A.T.; Farah, A. Volatile fingerprint of Brazilian defective coffee seeds: Corroboration of potential marker compounds and identification of new low-quality indicators. Food Chem. 2014, 153, 298–314. [Google Scholar] [CrossRef]
  24. Akiyama, M.; Murakami, K.; Ikeda, M.; Iwatsuki, K.; Kokubo, S.; Wada, A.; Tokuno, K.; Onishi, M.; Iwabuchi, H.; Tanaka, K. Characterization of flavour compounds released during grinding of roasted Robusta coffee beans. Food Sci. Technol. Res. 2005, 11, 298–307. [Google Scholar] [CrossRef] [Green Version]
  25. Sanz, C.; Czerny, M.; Cid, C.; Schieberle, P. Comparison of potent odorants in a filtered coffee brew and in an instant coffee beverage by aroma extract dilution analysis (AEDA). Eur. Food Res. Technol. 2002, 214, 299–302. [Google Scholar] [CrossRef]
  26. Czerny, M.; Mayer, F.; Grosch, W. Sensory study on the character impact odorants of roasted Arabica coffee. J. Agric. Food Chem. 1999, 47, 695–699. [Google Scholar] [CrossRef] [PubMed]
  27. Rahn, A.; Yeretzian, C. Impact of consumer behavior on furan and furan-derivative exposure during coffee consumption. A comparison between brewing methods and drinking preferences. Food Chem. 2019, 272, 514–522. [Google Scholar] [CrossRef] [PubMed]
  28. European Food Safety Authority. Update on furan levels in food from monitoring years 2004–2010 and exposure assessment. EFSA J. 2011, 9, 2347. [Google Scholar]
  29. Altaki, M.S.; Santos, F.J.; Galceran, M.T. Occurrence of furan in coffee from Spanish market: Contribution of brewing and roasting. Food Chem. 2011, 126, 1527–1532. [Google Scholar] [CrossRef]
  30. Tressl, R.; Solwar, R. Investigation of sulfur-containing components in roasted coffee. J. Agric. Food Chem. 1981, 29, 1078–1082. [Google Scholar] [CrossRef]
  31. Jiemin, L.; Ning, L.; Meijuan, W.; Guibin, J. Determination of Volatile Sulfur Compounds in Beverage and Coffee Samples by Purge-and-Trap On-Line Coupling with a Gas Chromatography-Flame Photometric Detector. Microchim. Acta 2004, 148, 43–47. [Google Scholar] [CrossRef]
  32. Chong, I.G.; Jun, C.H. Performance of some variable selection methods when multicollinearity is present. Chemometr. Intell. Lab. Syst. 2005, 78, 103–112. [Google Scholar] [CrossRef]
  33. Marco-Ramell, A.; Palau-Rodriguez, M.; Alay, A.; Tulipani, S.; Urpi-Sarda, M.; Sanchez-Pla, A.; Andres-Lacueva, C. Evaluation and comparison of bioinformatic tools for the enrichment analysis of metabolomics data. BMC Bioinform. 2018, 19, 1. [Google Scholar] [CrossRef]
Sample Availability: Samples of the compounds are not available from the authors.
Figure 1. Mean total sum of volatile compounds (µg/L) determined on EC samples from each brand divided by chemical classes. Bars refers to inter-brand variability.
Molecules 25 01166 g001
Figure 2. Principal component analysis (PCA) results for volatile profiles in EC brewed by capsules from 5 commercial Italian brands; (A) SCORE PLOT1: 2D score plot for PC1 and PC2; SCORE PLOT2: 2D score plot for PC2 and PC3; the ellipse represents the confidence around each of the brands. (B) PCA BPLOTS including the position of each sample for PC1 and PC2 (PCA BPLOT1) and for PC2 and PC3 (PCA BPLOT2) and how variables map onto these.
Molecules 25 01166 g002
Figure 3. Partial least squares discriminant analysis (PLS-DA) results for volatile profiles in EC brewed by capsules from 5 commercial Italian brands.; (A) 2D SCORE PLOT for Component 1 and Component 2. The ellipse represents the confidence around each of the brands; (B) VIP score of metabolites resulting from the PLS-DA loading plots with threshold > 1.
Molecules 25 01166 g003
Figure 4. Selected pyrazines by PLS-DA detected in ECs.
Molecules 25 01166 g004
Table 1. Volatile compounds detected in espresso coffees (EC) samples by headspace solid-phase microextraction (HS-SPME)/gas chromatography–mass spectrometry (GC-MS).
Compound KI 1 ID 2 Compound KI 1 ID 2
ALDEHYDES ESTERS
2-methylpropanal827Bmethyl acetate838B
2-methylbutanal919Bethyl acetate898B
3-methylbutanal921Apropanoic acid, 3-methyl-, methyl ester1008C
furfural1472Bmethyl isovalerate1020C
benzaldehyde1527Abutyl butanoate1229C
5-methyl-2-furfural1580Bprenyl acetate1256C
2-methylbenzaldehyde1596Cfurfuryl formate *1504B
2-methyl-3-(2-furyl)acrolein1682C2-oxobutyl acetate1533C
1H-pyrrole-2-carboxaldehyde2034A2-furfuryl-propanoate1602B
KETONES PYRAZINES
2-butanone906Bpyrazine1210B
2-pentanone979B2-methyllpyrazine *1266B
2,3-butandione982B2,5-dimethylpyrazine *1320B
2,3-pentanedione1063B2,6-dimethylpyrazine *1325B
3-penten-2-one1127B2-ethylpirazine *1334B
2,3-hexanedione1134B2,3-dimethylpyrazine *1345B
1-(furan-2-yl)ethanone *1512B2-ethyl-6-methylpyrazine *1385B
1-(furan-2-yl)butan-2-one1604B2-ethyl-5-methylpyrazine *1390B
1-(1-methylpyrrol-2-yl)ethanone1659B2,3,5-trimethylpyrazine1404A
2-ethyl-3-methylpyrazine1419C
furfural acetone derivative1910C2,6-diethylpyrazine *1433B
3-ethyl-2,5-dimethylpyrazine *1441B
TERPENES SULFUR COMPOUNDS
β-linalool1550Bdimetilsulfide1070B
p-menthene monoterpenoid derivative1650C2-(methylsulfanylmethyl)furan
(furfuryl methyl sulfide)
1490B
p-menthene monoterpenoid derivative 21694C
PYRROLES PHENOLIC COMPOUNDS
1-methyl-1H-pyrrole1141B2-methoxyphenol (guaiacol)1867B
1H-pyrrole derivative *1801C2-methoxy-4-methylphenol1871B
1-furfurylpyrrole1837B4-ethylguaiacol2034B
2-acetyl-1H-pyrrole1979B2-methylphenol (o-cresol)2092B
1-methyl-1H-pyrrole-2-carbaldehyde derivative *2107C3-methylphenol (m-cresol)2171B
p-vinylguaiacol (2-methoxy-4-vinylvinylphenol)2193B
FURANS OTHERS
2-methylfuran879Bunknown 11459-
2,5-dimethylfuran956Bbenzyl alcohol1880C
Vinylfuran1074B2-furanmethanol1667B
2-(methoxymethyl)furan1243B2-furanmethanolacetate
(furfuryl alcohol acetate)
1542B
2-butylfuran derivative1524Cunknown 2 *2030-
furan,2,2′-methylenbis1614Bunknown 3 *2038-
furfurylammine derivative2236C
difurfuryl ether (2,2′-[oxybis(methylene)]) bisfuran1992Cunknown 42253-
indole2386B
3-methylindole2450B
PYRIDINES
Pyridine1181B
4(H)-pyridine, n-acetyl1724B
1 Kovats Index (KI) experimentally determined for the SUPELCO®-Wax capillary column using homologous series of C8-C30 alkanes; 2 Identification (ID). Reliability of identification proposal is indicated by: (A) mass spectrum, retention time, and KI according to standards; (B) mass spectrum and retention index comparing literature data [1,12,15,16,17,18,19,20,21,22]; (C) mass spectrum compared with NIST 11 mass spectral database (pubchem.ncbi). * Key odorants selected by partial least squares discriminant analysis (PLS-DA) (VIP threshold > 1).
Table 2. Volatile compounds detected in EC samples grouped by chemical class. Minimum (Min), Maximum (Max), and Mean values (µg/L) are reported for samples belonging to five commercial Italian brands. Different letters (when reported) indicate statistically significant difference (ANOVA, p < 0.05); nq = not quantifiable.
BRAND A (N = 23)BRAND B (N = 15)BRAND C (N = 10)BRAND D (N = 10)BRAND E (N = 7)
CompoundMinMaxMeanMinMaxMeanMinMaxMeanMinMaxMeanMinMaxMean
ALDEHYDES
2-methylpropanal50.0770.0202.6 a,b50.0510.0158.7 a100.0260.0143 a130.0570.0323.3 b90.0240.0148.6 a
2-methylbutanal120.0920.0400.4 a,b80.01120.0329.4 a,b140.0430.0225.0 a180.0800.0494.4 b130.0370.0217.1 a
3-methylbutanal130.01690.0494.3100.0980.0357.5110.0510.0228.0170.0760.0486.7100.0350.0180.0
furfural580.04020.01774.3 a690.03890.01696.2 a850.02930.01772.0 a1640.07500.03676.7 b800.02580.01385.7 a
benzaldehyde130.0920.0386.1190.0880.0390.0320.0730.0460.0320.01090.0587.8330.0730.0472.9
5-methyl-2-furfural910.05460.02456.5 a780.05440.02291.9 a1480.04260.02754.0 a2270.08830.04786.7 b1300.03980.02345.7 a
2-methybenzaldehyde80.0750.0300.4 a,b70.0400.0226.9 a130.0560.0284.0 a,b250.0930.0432.2 b160.0320.0225.7 a
2-methyl-3-(2-furyl)acrolein250.01120.0601.7 a160.0740.0432.5 a210.0740.0445.0 a560.02040.01121.1 b270.0530.0414.3 a
1H-pyrrole-2-carboxaldehyde60.01610.0297.4 a,b40.0350.0188.1 a150.0360.0229.0 a210.0970.0564.4 b180.0430.0265.7 a
KETONES
2-butanone30.0260.0100.4 a40.0250.085.6 a50.0140.074.0 a80.0320.0173.3 b50.0150.082.9 a
2-pentanone10.0100.043.0 a,b10.0110.034.4 a,b10.070.027.0 a20.0140.061.1 b30.070.045.7 a,b
2,3-butandione10.0170.062.6 a,b20.0140.055.0 a20.070.036.0 a20.0180.097.8 b20.060.034.3 a
2,3-pentanedione40.0450.0135.2 a,b60.0280.0118.2 a,b50.0130.089.0 a50.0400.0197.8 b40.0140.075.7 a
3-penten-2-one0.060.020.0 a10.030.015.0 a10.040.018.0 a30.090.047.8 b10.020.012.9 a
2,3-hexanedione20.0150.061.720.0580.081.90.070.038.040.0130.083.30.050.018.6
1-(furan-2-yl)ethanone170.01410.0597.9 a150.01080.0566.9 a220.01090.0574.0 a590.02720.01402.2 b360.01190.0641.4 a
1-(furan-2-yl)butan-2-one60.0390.0163.940.0340.0151.3100.0340.0173.0110.0460.0241.160.0220.0148.6
1-(1-methylpyrrol-2-yl)ethanone260.01550.0680.0220.01130.0537.5390.01270.0742.00.02200.0933.3480.0980.0695.7
furfural acetone derivative70.0420.0182.6 a,b30.0290.0137.5 a100.0230.0151.0 a130.0680.0294.4 b120.0230.0175.7 a
ESTERS
methyl acetate30.0370.0107.0 a,b30.0290.087.5 a50.0160.077.0 a100.0500.0196.7 b50.0210.0102.9 a
ethyl acetate50.0370.0168.350.0220.0116.340.0500.0140.050.0330.0170.040.0170.074.3
propanoic acid, 3-methyl-, methyl ester60.0620.0244.8 a100.0630.0255.0 a120.0340.0234.0 a240.01020.0564.4 b100.0340.0180.0 a
methyl isovalerate0.030.013.510.030.016.30.020.013.010.040.017.80.020.010.0
prenyl acetate10.0120.051.7 a20.0130.050.0 a0.0100.052.0 a0.0310.0138.9 b20.0110.047.1 a
furfuryl formate0.0420.0128.7 a0.0290.0105.6 a30.0300.0138.0 a180.0760.0468.9 b50.0280.0152.9 a
2-furfuryl-propanoate320.01750.0752.6220.01400.0639.4330.01410.0770.0580.02350.01030.0460.01110.0702.9
TERPENS
β-linalool50.0780.0287.4 a80.0490.0261.3 a70.0580.0242.0 a130.01430.0536.7 b70.0340.0184.3 a
p-menthene monoterpenoid derivative200.01290.0610.0 a,b140.0890.0471.9 a280.0970.0513.0 a440.01700.0868.9 b300.0640.0452.9 a
p-menthene monoterpenoid derivative 2180.01430.0642.2 a130.0750.0487.5 a390.0900.0631.0 a420.02250.01023.3 b520.0620.0575.7 a
PYRROLES
1-methyl-1H-pyrrole40.0560.0190.4 a,b40.0330.0141.9 a,b30.0240.0156.0 a,b120.0550.0234.4 b30.0200.094.3 a
1H-pyrrole derivative200.01320.0593.0 a170.01070.0468.8 a370.0880.0596.0 a470.02040.01017.8 b490.0920.0675.7 a,b
1-furfurylpyrrole920.04100.01847.0 a,b630.02670.01506.9 a1220.03040.01893.0 a,b1530.05050.02525.6 b900.02970.01531.4 a
2-acetyl-1H-pyrrole220.01680.0745.2 a170.01310.0578.8 a410.01140.0682.0 a600.03040.01385.6 b580.01280.0858.6 a
1-methyl-1H-pyrrole-2-carbaldehyde derivative230.01580.0687.4 a290.01410.0600.6 a420.01300.0770.0 a640.02340.01431.1 b550.01400.0901.4 a
PYRIDINES
Pyridine220.03490.01200.0 a360.01690.0901.9 a580.02840.01244.0 a1230.07150.02568.9 b320.01990.0994.3 a
4(H)-pyridine, n-acetyl140.0880.0386.5 a130.0720.0328.8 a260.0540.0412.0 a270.01160.0642.2 b330.0510.0420.0 a
FURANS
2-methylfuran70.0530.0187.850.0480.0161.950.0280.0104.090.0430.0211.150.0180.0100.0
2,5-dimethylfuran20.090.034.8 a,b20.070.035.0 a,b10.050.021.0 a30.0110.053.3 b10.030.014.3 a
vinylfuran10.080.034.3 b,c10.040.026.9 a,b,c0.040.017.0 a,b0.070.037.8 c0.030.010.0 a
2-(methoxymethyl)furan40.0340.0123.0 a50.0260.0107.5 a30.0210.098.0 a70.0480.0246.7 b60.0170.0101.4 a
2-butylfuran derivative110.0900.0347.8 a120.0420.0273.7 a120.0560.0329.0 a360.01350.0747.8 b120.0430.0215.7 a
furan,2,2′-methylenbis420.01850.0897.4 a,b310.01260.0735.0 a450.01430.0826.0 a,b770.02780.01283.3 b460.01200.0624.3 a
difurfuryl ether (2,2′-[oxybis(methylene)] bisfuran380.02750.01213.0200.01730.0833.1520.02040.0986.0860.04290.01515.6760.01470.01055.7
PYRAZINES
pyrazine30.0350.0136.5 a60.0240.0124.4 a50.0210.0109.0 a110.0390.0263.3 b40.0130.080.0 a
2-methyllpyrazine210.02110.0808.3 a400.02030.0796.3 a550.01510.0782.0 a960.03580.02131.1 b540.01270.0810.0 a
2,5-dimethylpyrazine140.01290.0488.7 a220.01350.0513.7 a400.01010.0555.0 a490.02220.01225.6 b400.0950.0574.3 a
2,6-dimethylpyrazine130.01220.0468.3 a240.01210.0480.0 a350.0890.0513.0 a570.02300.01255.6 b360.0810.0480.0 a
2-ethylpirazine90.0960.0348.3 a160.01050.0359.4 a260.0680.0376.0 a330.01510.0841.1 b270.0700.0454.3 a
2,3-dimethylpyrazine30.0350.0116.1 a50.0330.0142.5 a70.0230.0133.0 a130.0430.0260.0 b90.0220.0128.6 a
2-ethyl-6-methylpyrazine150.01310.0492.2 a240.01420.0485.0 a440.01080.0607.0 a,b410.01660.0981.1 b420.01260.0721.4 a,b
2-ethyl-5-methylpyrazine120.0960.0349.6 a170.01000.0351.9 a330.0770.0448.0 a,b290.01210.0705.6 b310.0880.0501.4 a,b
2,3,5-trimethylpyrazine100.02930.0563.5 a,b250.01090.0478.7 a440.01140.0612.0 a,b380.01860.01001.1 b450.0580.0517.1 a,b
2-ethyl-3-methylpyrazine20.0180.066.1 a30.0160.065.0 a50.0150.074.0 a,b40.0260.0118.9 b50.0100.072.9 a,b
2,6-diethylpyrazine70.0950.0227.0 a,b90.0530.0198.1 a180.0470.0278.0 a,b150.0780.0410.0 b220.0430.0328.6 a,b
3-ethyl-2,5-dimethylpyrazine190.02100.0682.2 a200.01720.0616.3 a530.01590.0906.0 a,b270.02770.01335.6 b520.01710.0908.6 a,b
PHENOLIC COMPOUNDS
2-methoxyphenol (guaiacol)270.01720.0797.0210.01290.0656.3470.01320.0741.0480.03010.01114.4650.01560.0978.6
2-methoxy-4-methylphenol230.01320.0597.0 a100.01010.0456.9 a280.0760.0540.0 a450.01860.01055.6 b300.0680.0494.3 a
4-ethylguaiacol190.01610.0697.0180.01160.0598.8360.01350.0677.0400.02240.0792.2560.01440.0930.0
2-methylphenol (o-cresol)70.0820.0225.7 a,b40.0360.0168.8 a120.0330.0189.0 a,b160.0750.0338.9 b120.0290.0198.6 a,b
3-methilphenol (m-cresol)60.0420.0160.0 a,b30.0170.0103.1 a60.0180.0115.0 a110.0620.0248.9 b60.0220.0125.7 a
p-vinylguaiacol (2-methoxy-4-vinylvinylphenol)490.02720.01021.7320.01610.0772.5510.01360.01008.0680.02200.01221.1400.02050.01120.0
SULFUR COMPOUNDS
dimethylsulfidenqnqnqnqnqnqnqnqnqnqnqnqnqnqnq
2-(methylsulfanylmethyl)furan (furfurylmethylsufide)0.01270.0424.3 a,b0.0740.0306.25 a0.0970.0524.0 a,b0.01140.0730.0 b150.01000.0477.1 a,b
OTHERS
unknown 1220.03490.01200 a360.01690.0901.9 a580.02840.01244.0 a1230.07150.02568.9 b320.01990.0994.3 a
benzylalcohol120.0520.0237.8 a,b50.0320.0171.9 a150.0310.0213.0 a,b140.0810.0337.8 b170.0280.0231.4 a,b
2-furanmethanol740.06340.02628.3 a1170.06030.02415.0 a1560.04870.02808.0 a2320.08690.04891.1 b1830.04300.02831.4 a
2-furanmethanolacetate (furfuryl alcohol acetate)1160.08330.03427.4 a1170.03870.02829.4 a1790.07080.03843.0 a,b2870.011730.05692.2 b2260.06070.03641.4 a,b
unknown 2130.0870.0387.0 a80.0850.0320.6 a290.0580.0385.0 a310.01680.0937.8 b280.0730.0421.4 a
uknown 390.0420.0189.1 a,b30.0260.0142.5 a80.0290.0170.0 a,b60.0470.0271.1 b110.0280.0177.1 a
furfurylammine derivative230.01180.0510.4 a100.0700.0359.4 a260.0660.0407.0 a360.01360.0791.1 b300.01060.0515.7 a,b
unknown 470.0360.0153.0 a,b30.0170.0103.1 a60.0180.0114.0 a70.0490.0202.2 b70.0240.0131.4 a,b
indole40.0230.095.2 a,b20.0120.063.8 a40.0120.072.0 a70.0250.0133.3 b30.0110.071.4 a
3-methylindole50.0350.0135.730.0240.094.440.0190.0114.070.0380.0153.340.0240.0145.7
Table 3. Inter-brand variation (%CV) in the content of volatile compounds detected in EC samples by chemical class.
% CV
CHEMICAL CLASSBRAND ABRAND BBRAND CBRAND DBRAND E
ALDEHYDES52.944.434.045.234.5
KETONES54.643.235.650.735.1
ESTERS50.040.137.448.035.9
TERPENS42.434.834.851.819.0
PYRROLES49.037.629.446.532.8
PYRIDINES67.438.143.263.136.6
FURANS51.138.244.053.928.9
PYRAZINES70.249.335.148.930.0
PHENOLIC COMPOUNDS52.344.527.056.232.0
SULFUR COMPOUNDS74.437.352.069.753.8
OTHERS54.732.635.644.531.1
Table 4. Key odorants detected in EC brewed by capsules.
CompoundRI 1m/zDescription of Odour 2Typology of Contribution 2
ALDEHYDES
2-methylpropanale82741–72Grassy, fermentedNegative
2-methylbutanale91957–58Malt, fermentedNegative
3-methylbutanale92157–58Almond, fruityPositive
KETONES
2,3-pentanedione106357–100Buttery, caramel likePositive
PYRAZINE
2-ethylpyrazine1334107–108Earthy, mustyNegative
2-ethyl-6-methylpyrazine1385121–122Earthy, mustyNegative
2-ethyl-3,5-dimethylpyrazine1459135–136Woody, paperyNegative
PHENOLIC COMPUNDS
2-methoxyphenol (guaiacol)1867109–124Phenolic, spicyPositive
1 Retention Index (RI) on SUPELCO®-Wax column, experimentally determined using homologous series of C8-C30 alkanes; 2 According to [1,15,17].

