Experimental Pretreatment with Chlorogenic Acid Prevents Transient Ischemia-Induced Cognitive Decline and Neuronal Damage in the Hippocampus through Anti-Oxidative and Anti-Inflammatory Effects

 , ,
, ,
Abstract
:
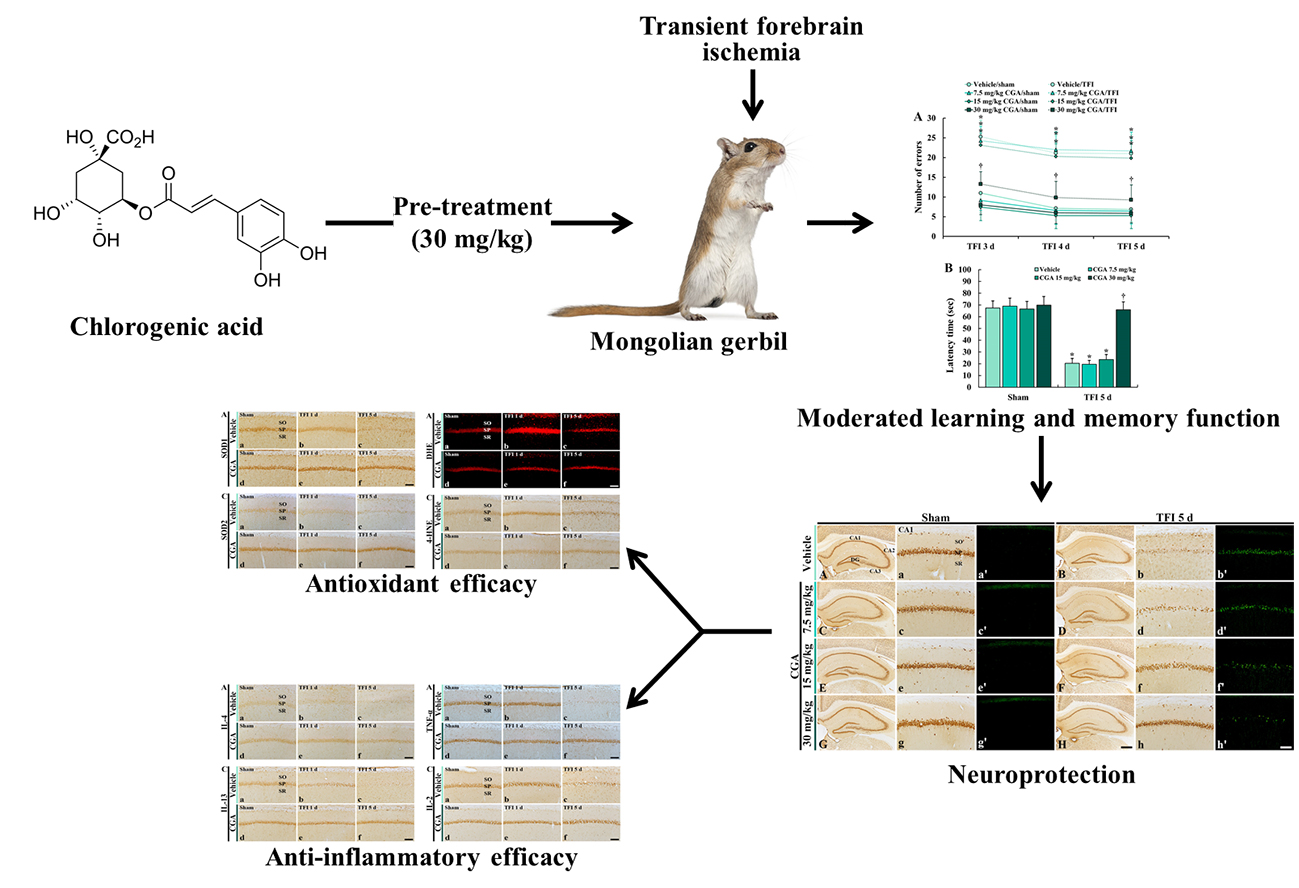
1. Introduction
2. Results
2.1. Cognitive Function
2.1.1. Spatial Memory
2.1.2. Learning and Memory
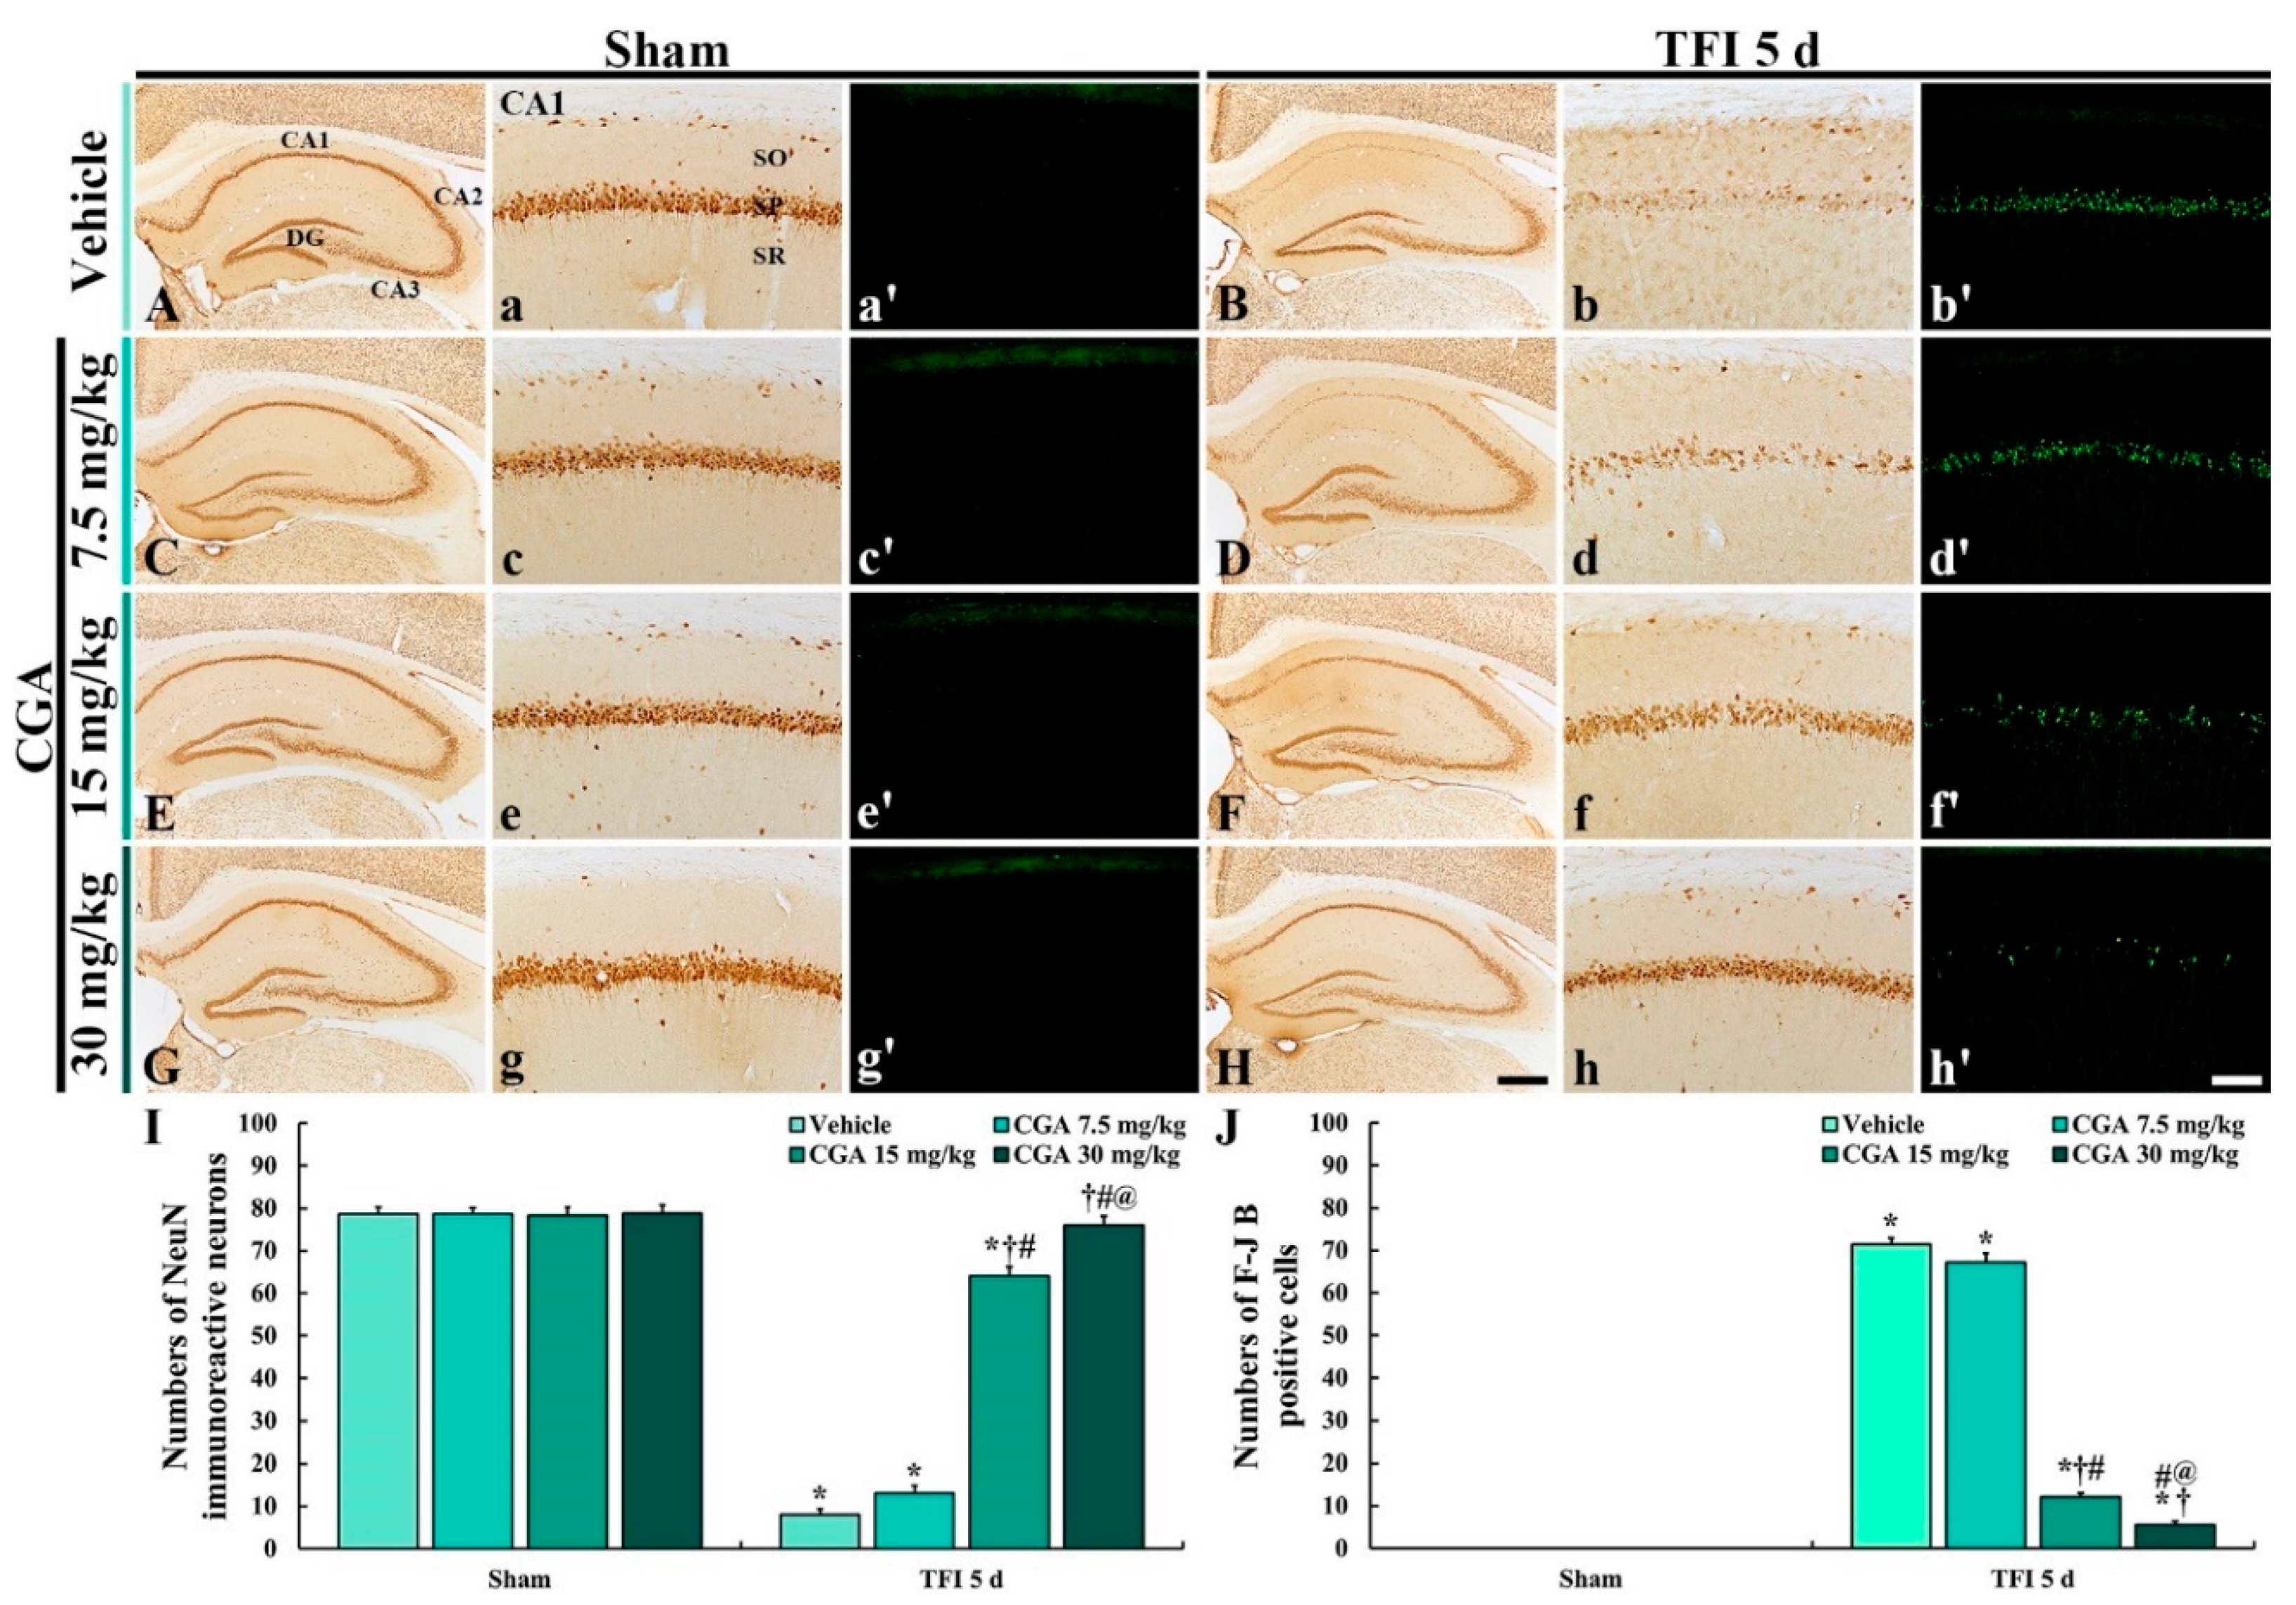
2.2. Neuroprotection
2.2.1. Neuronal Nucleus-Specific Protein (NeuN) Immunoreactive Neurons
2.2.2. Fluoro-Jade B (F-J B) Positive Cells
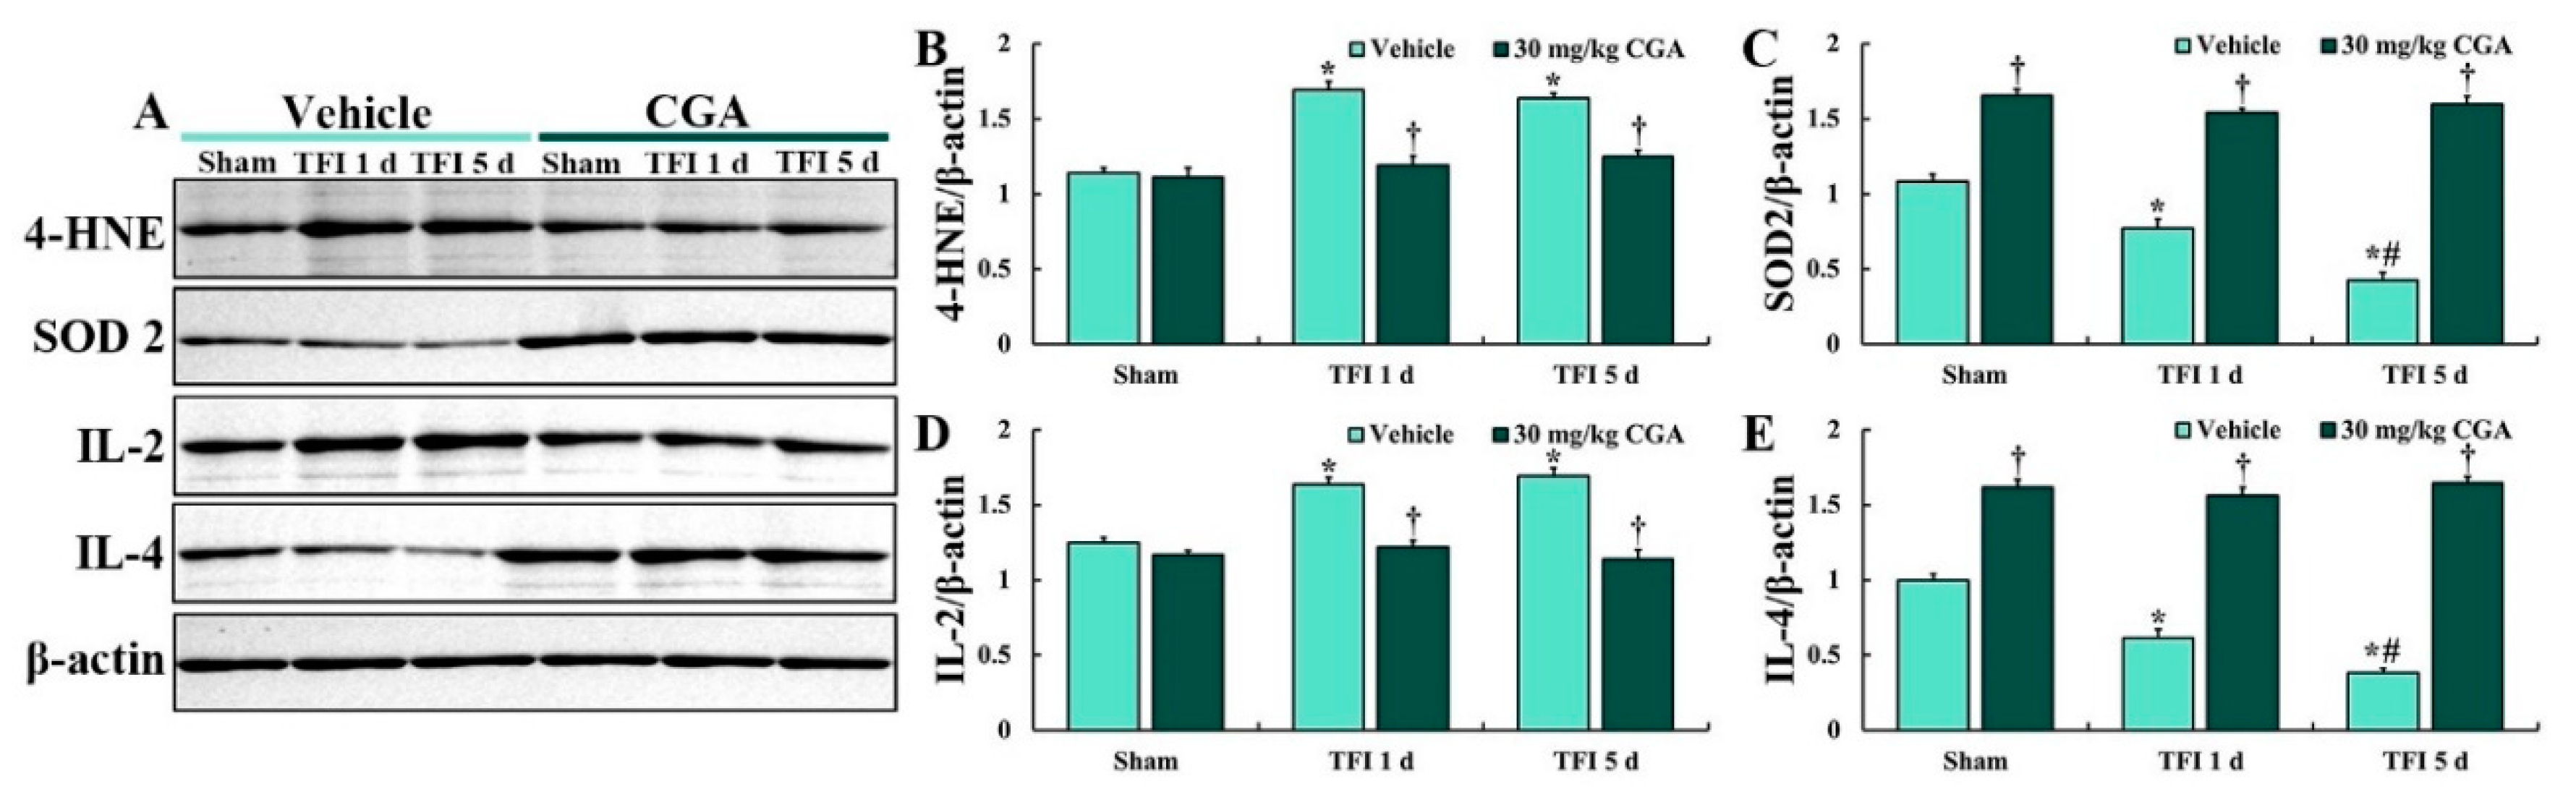
2.3. Levels of 4-Hydroxy-2-Nonenal (4-HNE), SOD2, IL-2 and IL-4
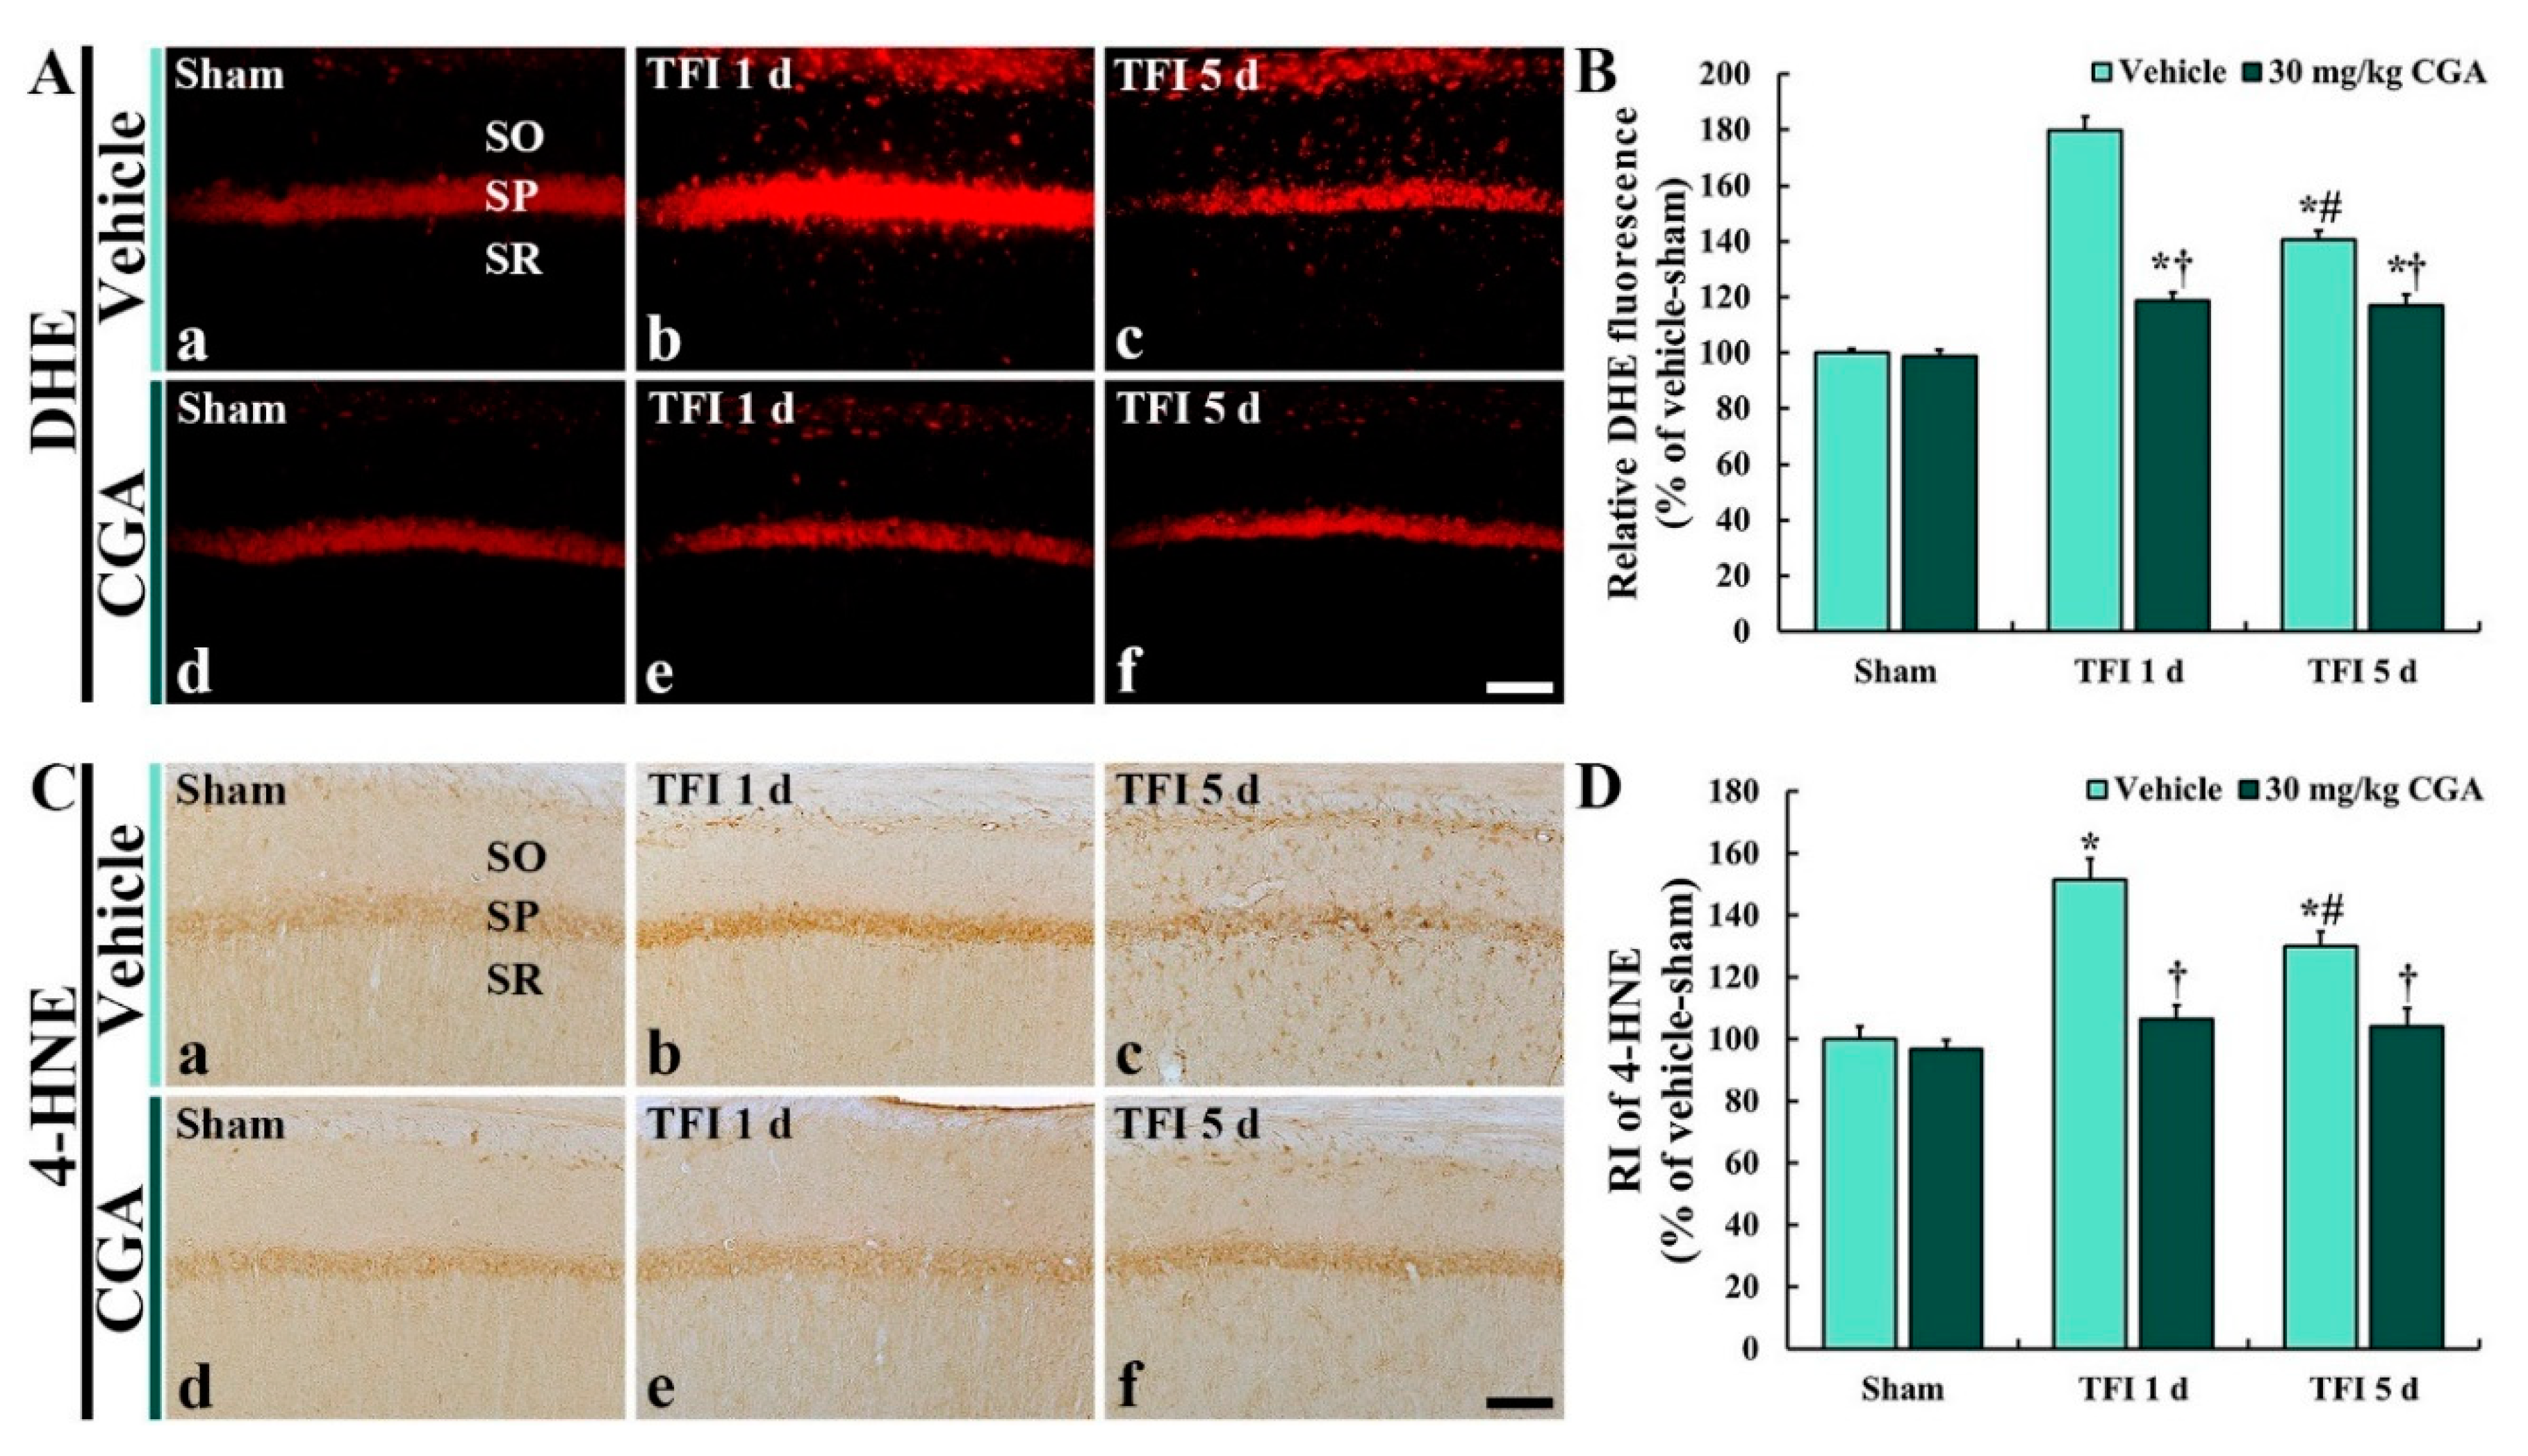
2.4. Oxidative Stress in CA1 Pyramidal Cells
2.4.1. Dihydroethidium (DHE) Fluorescence
2.4.2. 4-HNE Immunoreactivity
2.5. Antioxidant Enzyme Immunoreactivities in CA1 Pyramidal Cells
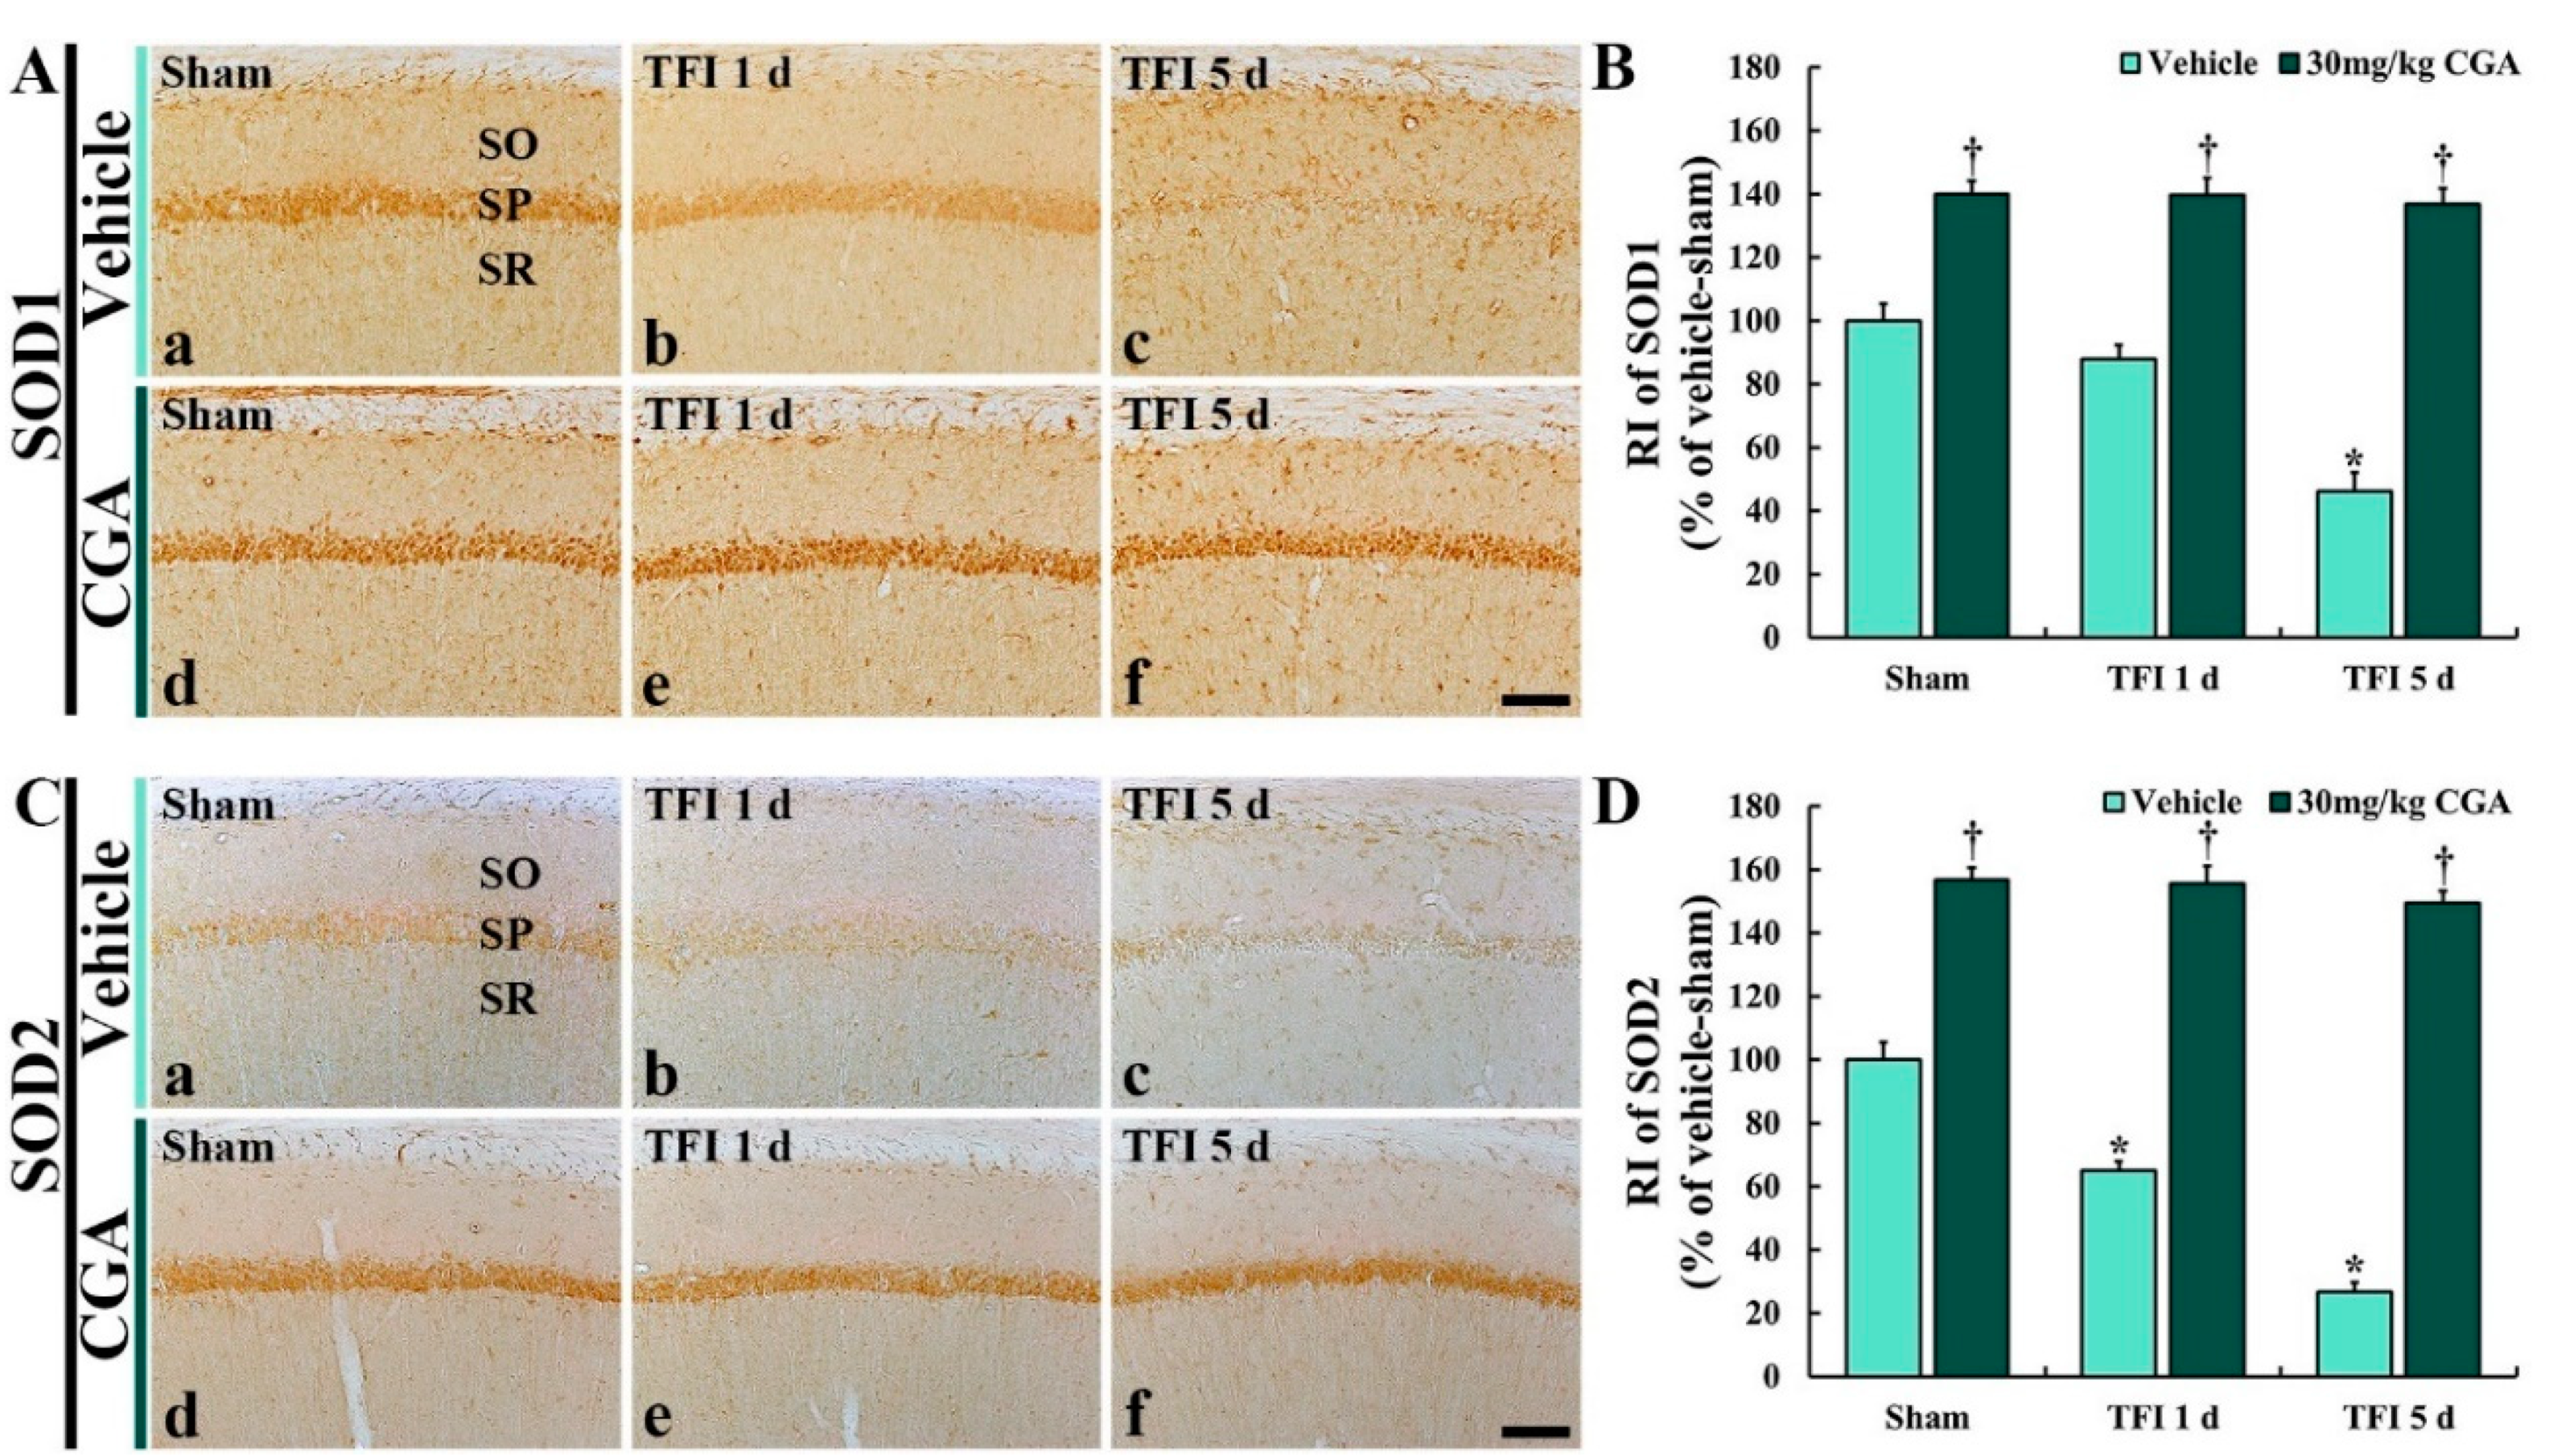
2.5.1. SOD1 Immunoreactivity
2.5.2. SOD2 Immunoreactivity
2.6. Pro-Inflammatory Cytokine Immunoreactivities in CA1 Pyramidal Cells
2.6.1. TNF-α Immunoreactivity
2.6.2. IL-2 Immunoreactivity
2.7. Anti-Inflammatory Cytokine Immunoreactivities in CA1 Pyramidal Cells
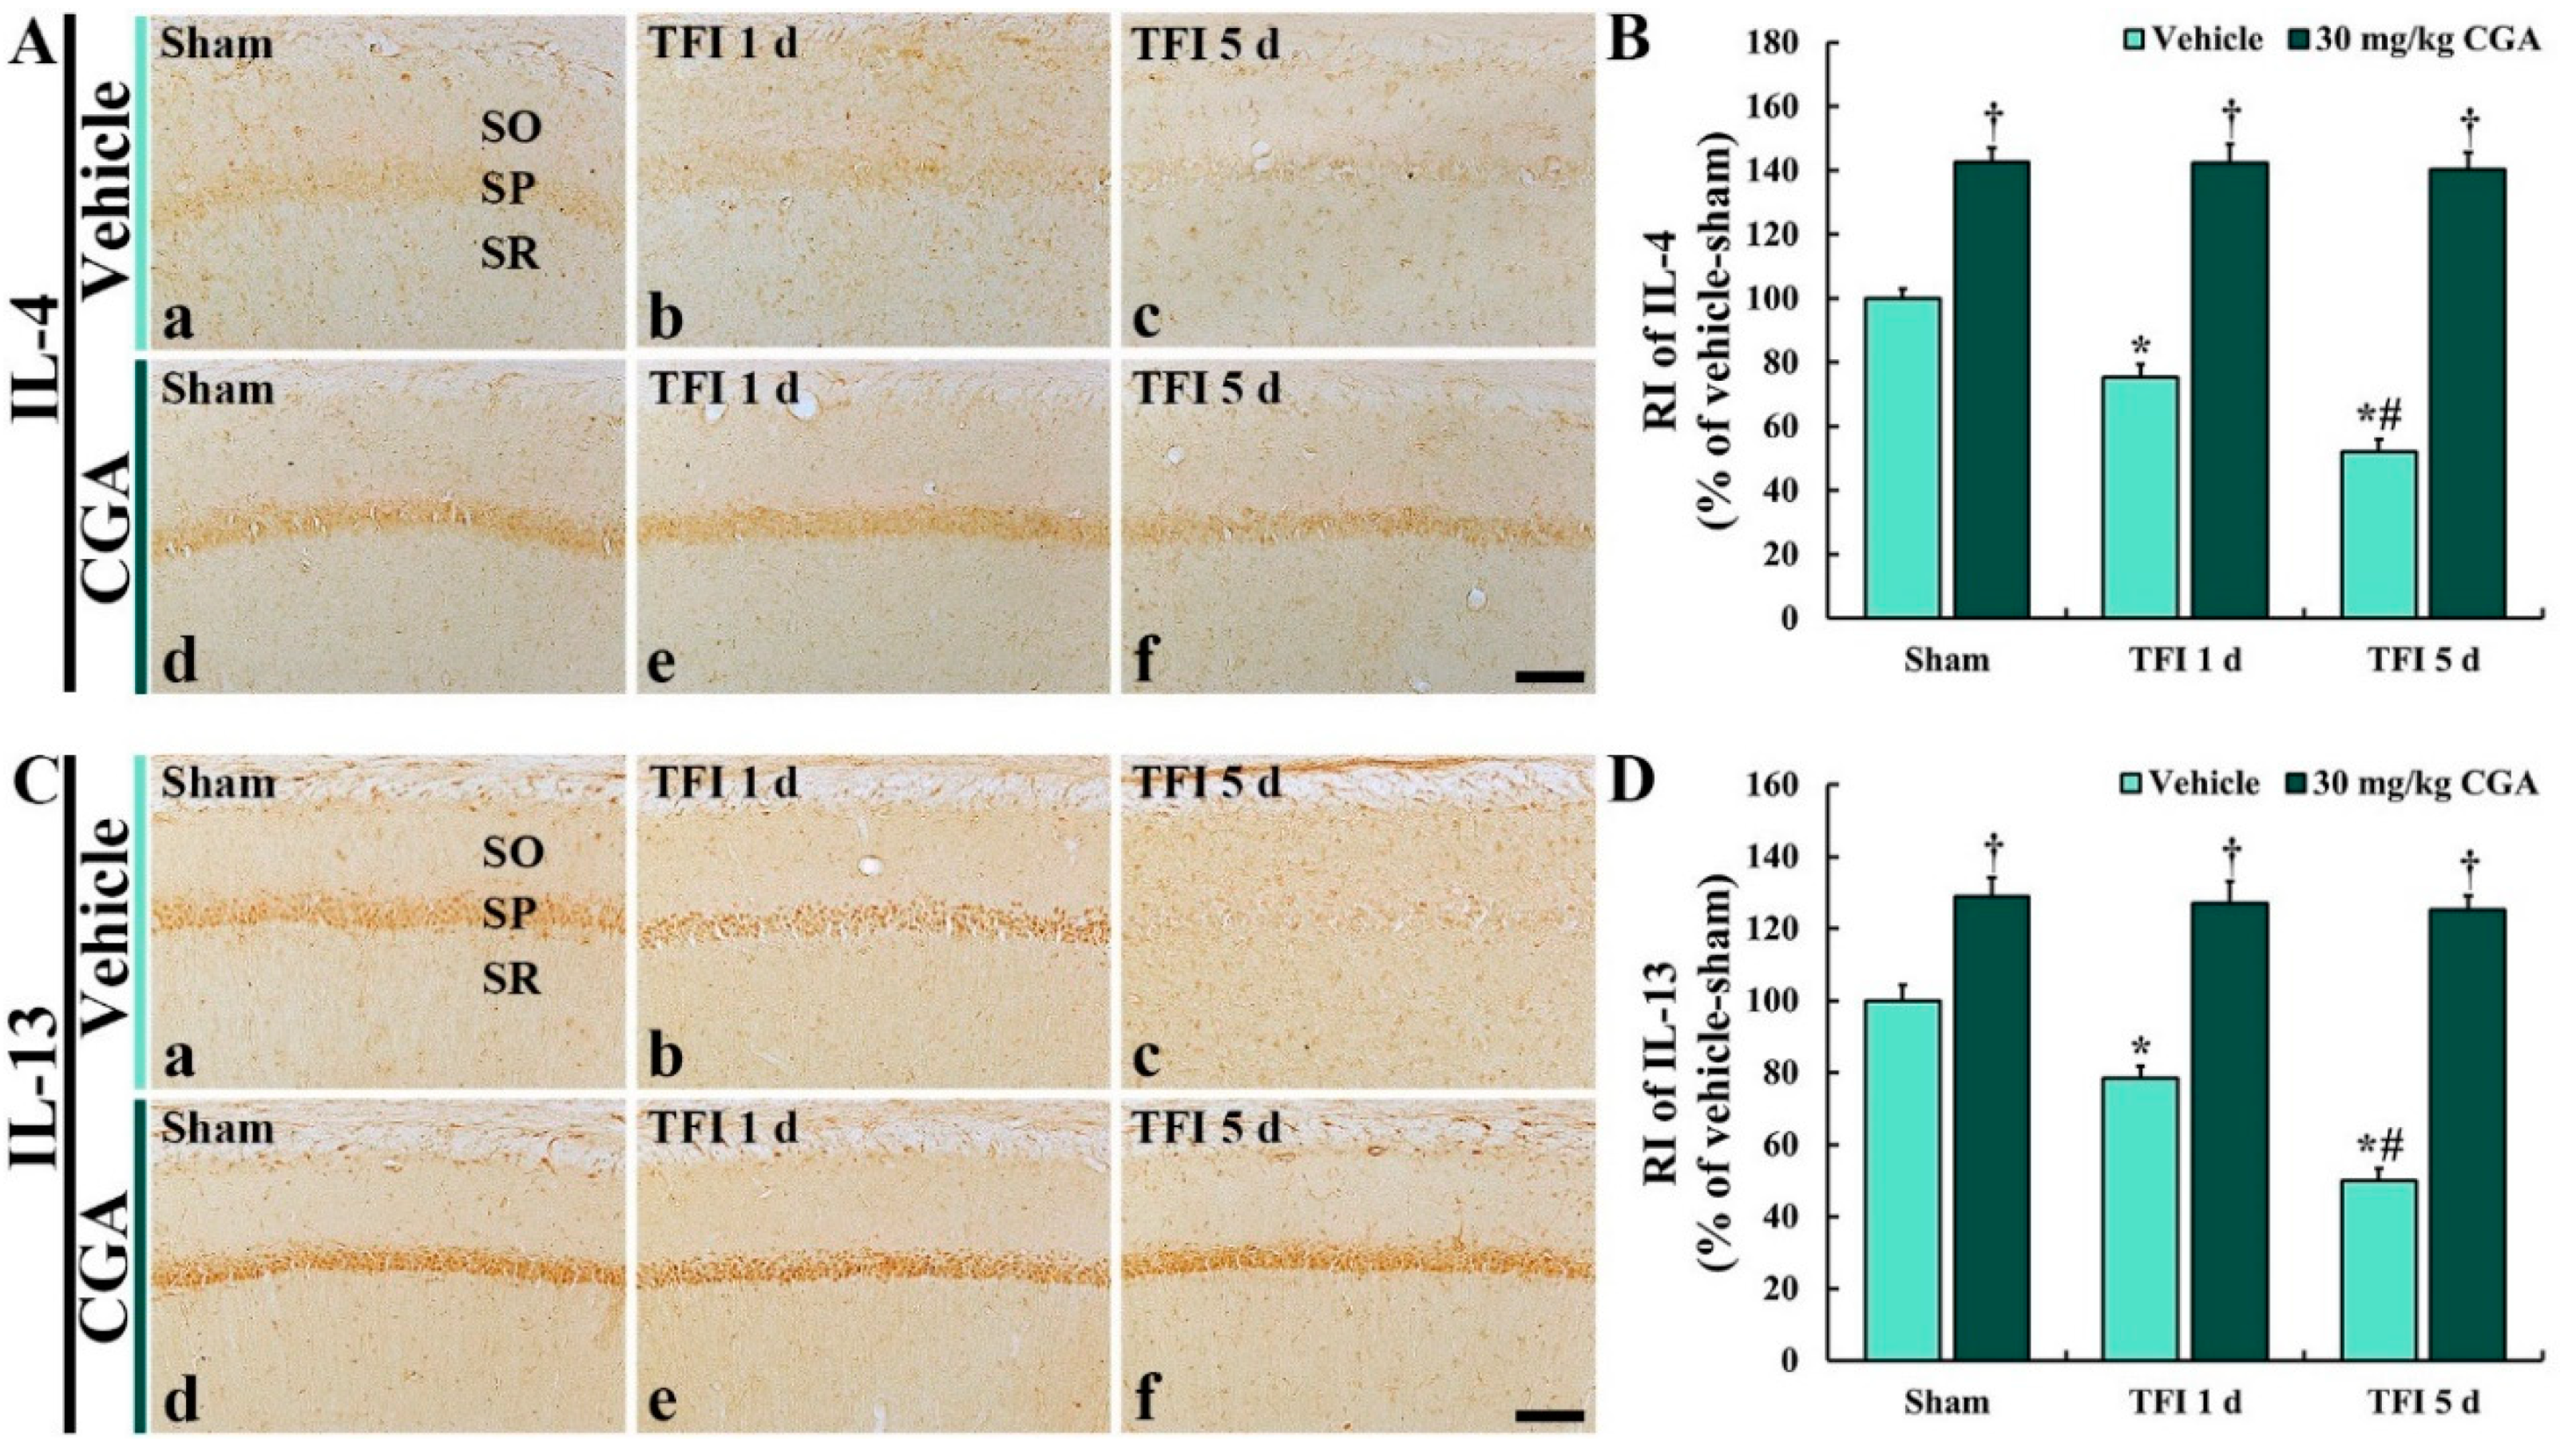
2.7.1. IL-4 Immunoreactivity
2.7.2. IL-13 Immunoreactivity
3. Discussion
4. Materials and Methods
4.1. Experimental Animals and Protocol
4.2. Experimental Groups and CGA Treatment
4.3. TFI Induction
4.4. Tests for Cognitive Functions
4.4.1. 8-ARMT
4.4.2. PAT
4.5. Western Blotting
4.6. Tissue Preparation for Histological Examination
4.7. F-J B Histofluorescence Staining
4.8. DHE Histofluorescence Staining
4.9. Immunohistochemistry
4.10. Statistical Analysis
Author Contributions
Funding
Conflicts of Interest
References
- Kirino, T.; Sano, K. Selective vulnerability in the gerbil hippocampus following transient ischemia. Acta Neuropathol. 1984, 62, 201–208. [Google Scholar] [CrossRef] [PubMed]
- Cho, J.H.; Won, M.-H.; Lee, T.-K.; Kim, H.; Song, M.; Lee, J.-C.; Park, J.H.; Ahn, J.H.; Yang, G.E.; Kim, H.; et al. Time-course pattern of neuronal loss and gliosis in gerbil hippocampi following mild, severe, or lethal transient global cerebral ischemia. Neural Regen. Res. 2019, 14, 1394–1403. [Google Scholar] [CrossRef] [PubMed]
- Park, J.H.; Cho, J.H.; Ahn, J.H.; Choi, S.Y.; Lee, T.-K.; Lee, J.-C.; Na Shin, B.; Hong, S.; Jeon, Y.H.; Kim, Y.-M.; et al. Neuronal loss and gliosis in the rat striatum subjected to 15 and 30 min of middle cerebral artery occlusion. Metab. Brain Dis. 2018, 33, 775–784. [Google Scholar] [CrossRef] [PubMed]
- Lee, J.-C.; Ahn, J.H.; Lee, D.H.; Yan, B.C.; Park, J.H.; Kim, I.H.; Cho, G.-S.; Kim, Y.-M.; Lee, B.; Park, C.W.; et al. Neuronal damage and gliosis in the somatosensory cortex induced by various durations of transient cerebral ischemia in gerbils. Brain Res. 2013, 1510, 78–88. [Google Scholar] [CrossRef] [PubMed]
- Kirino, T. Delayed neuronal death. Neuropathology 2000, 20, 95–97. [Google Scholar] [CrossRef] [PubMed]
- Kawabori, M.; Yenari, M.A. Inflammatory responses in brain ischemia. Curr. Med. Chem. 2015, 22, 1258–1277. [Google Scholar] [CrossRef] [Green Version]
- Yang, Z.; Zhong, L.; Zhong, S.; Xian, R.; Yuan, B. Hypoxia induces microglia autophagy and neural inflammation injury in focal cerebral ischemia model. Exp. Mol. Pathol. 2015, 98, 219–224. [Google Scholar] [CrossRef]
- Lee, J.-C.; Won, M.-H. Neuroprotection of antioxidant enzymes against transient global cerebral ischemia in gerbils. Anat. Cell Boil. 2014, 47, 149–156. [Google Scholar] [CrossRef] [Green Version]
- Li, P.; Stetler, R.A.; Leak, R.K.; Shi, Y.; Li, Y.; Yu, W.; Bennett, M.V.; Chen, J. Oxidative stress and DNA damage after cerebral ischemia: Potential therapeutic targets to repair the genome and improve stroke recovery. Neuropharmacology 2018, 134, 208–217. [Google Scholar] [CrossRef]
- Park, J.H.; Park, O.K.; Cho, J.-H.; Chen, B.H.; Kim, I.H.; Ahn, J.H.; Lee, J.-C.; Yan, B.C.; Yoo, K.-Y.; Lee, C.H.; et al. Anti-inflammatory Effect of Tanshinone I in Neuroprotection Against Cerebral Ischemia–Reperfusion Injury in the Gerbil Hippocampus. Neurochem. Res. 2014, 39, 1300–1312. [Google Scholar] [CrossRef]
- Kim, H.; Ahn, J.H.; Song, M.; Kim, D.-W.; Lee, T.-K.; Lee, J.-C.; Kim, Y.-M.; Kim, J.-D.; Cho, J.H.; Hwang, I.K.; et al. Pretreated fucoidan confers neuroprotection against transient global cerebral ischemic injury in the gerbil hippocampal CA1 area via reducing of glial cell activation and oxidative stress. Biomed. Pharmacother. 2019, 109, 1718–1727. [Google Scholar] [CrossRef] [PubMed]
- Kumar, G.; Mukherjee, S.; Paliwal, P.; Singh, S.S.; Birla, H.; Singh, S.P.; Krishnamurthy, S.; Patnaik, R. Neuroprotective effect of chlorogenic acid in global cerebral ischemia-reperfusion rat model. Naunyn-Schmiedeberg’s Arch. Pharmacol. 2019, 392, 1293–1309. [Google Scholar] [CrossRef] [PubMed]
- Miao, M.-S.; Cao, L.; Li, R.; Fang, X.; Miao, Y. Protective effect of chlorogenic acid on the focal cerebral ischemia reperfusion rat models. Saudi Pharm. J. 2017, 25, 556–563. [Google Scholar] [CrossRef] [PubMed]
- Hermawati, E.; Arfian, N.; Mustofa, M.; Partadiredja, G. Chlorogenic acid ameliorates memory loss and hippocampal cell death after transient global ischemia. Eur. J. Neurosci. 2019, 51, 651–669. [Google Scholar] [CrossRef]
- Kirino, T. Delayed neuronal death in the gerbil hippocampus following ischemia. Brain Res. 1982, 239, 57–69. [Google Scholar] [CrossRef]
- Tamagaki, C.; Murata, A.; Asai, S.; Takase, K.; Gonno, K.; Sakata, T.; Kinoshita, T. Age-related changes of cornu ammonis 1 pyramidal neurons in gerbil transient ischemia. Neuropathology 2000, 20, 221–227. [Google Scholar] [CrossRef]
- Park, J.H.; Cho, J.H.; Kim, I.H.; Ahn, J.H.; Lee, J.-C.; Chen, B.H.; Shin, B.-N.; Tae, H.-J.; Yoo, K.-Y.; Hong, S.; et al. Oenanthe Javanica Extract Protects Against Experimentally Induced Ischemic Neuronal Damage via its Antioxidant Effects. Chin. Med. J. 2015, 128, 2932–2937. [Google Scholar] [CrossRef]
- Kim, J.D.; Won, M.-H.; Park, J.H.; Kim, I.H.; Ahn, J.H.; Noh, Y.H.; Kim, S.-S.; Lee, T.-K.; Lee, J.-C.; Shin, B.-N.; et al. Pretreated Oenanthe Javanica extract increases anti-inflammatory cytokines, attenuates gliosis, and protects hippocampal neurons following transient global cerebral ischemia in gerbils. Neural Regen. Res. 2019, 14, 1536–1543. [Google Scholar] [CrossRef]
- Lu, C.-L.; Li, X.-F. A Review ofOenanthe javanica(Blume) DC. as Traditional Medicinal Plant and Its Therapeutic Potential. Evid.-Based Complement. Altern. Med. 2019, 2019, 1–17. [Google Scholar] [CrossRef] [Green Version]
- Taram, F.; Winter, A.N.; Linseman, D.A. Neuroprotection comparison of chlorogenic acid and its metabolites against mechanistically distinct cell death-inducing agents in cultured cerebellar granule neurons. Brain Res. 2016, 1648, 69–80. [Google Scholar] [CrossRef]
- Tundo, G.; Sbardella, D.; Santoro, A.; Coletta, M.; Oddone, F.; Grasso, G.; Milardi, D.; Lacal, P.; Marini, S.; Purrello, P.; et al. The proteasome as a druggable target with multiple therapeutic potentialities: Cutting and non-cutting edges. Pharmacol. Ther. 2020, 107579. [Google Scholar] [CrossRef] [PubMed]
- Nikonenko, A.G.; Radenovic, L.; Andjus, P.R.; Skibo, G.G. Structural Features of Ischemic Damage in the Hippocampus. Anat. Rec. Adv. Integr. Anat. Evol. Biol. 2009, 292, 1914–1921. [Google Scholar] [CrossRef] [PubMed]
- Chen, B.H.; Park, J.H.; Lee, Y.L.; Kang, I.J.; Kim, D.W.; Hwang, I.K.; Lee, C.H.; Yan, B.C.; Kim, Y.M.; Lee, T.K.; et al. Melatonin improves vascular cognitive impairment induced by ischemic stroke by remyelination via activation of erk1/2 signaling and restoration of glutamatergic synapses in the gerbil hippocampus. Biomed. Pharmacother. 2018, 108, 687–697. [Google Scholar] [CrossRef] [PubMed]
- Feno, S.; Butera, G.; Reane, D.V.; Rizzuto, R.; Raffaello, A. Crosstalk between Calcium and ROS in Pathophysiological Conditions. Oxidative Med. Cell. Longev. 2019, 2019. [Google Scholar] [CrossRef] [PubMed] [Green Version]
- Katoh, A.; Ishibashi, C.; Shiomi, T.; Takahara, Y.; Eigyo, M. Ischemia-induced irreversible deficit of memory function in gerbils. Brain Res. 1992, 577, 57–63. [Google Scholar] [CrossRef]
- Lee, J.-C.; Park, J.H.; Ahn, J.H.; Kim, I.H.; Cho, J.H.; Choi, J.H.; Yoo, K.-Y.; Lee, C.H.; Hwang, I.; Cho, J.H.; et al. New GABAergic Neurogenesis in the Hippocampal CA1 Region of a Gerbil Model of Long-Term Survival after Transient Cerebral Ischemic Injury. Brain Pathol. 2015, 26, 581–592. [Google Scholar] [CrossRef]
- Liu, Y.; Nakamura, T.; Toyoshima, T.; Lu, F.; Sumitani, K.; Shinomiya, A.; Keep, R.F.; Yamamoto, T.; Tamiya, T.; Itano, T. Ameliorative effects of yokukansan on behavioral deficits in a gerbil model of global cerebral ischemia. Brain Res. 2014, 1543, 300–307. [Google Scholar] [CrossRef]
- Kuchinka, J.; Nowak, E.; Szczurkowski, A.; Kuder, T. Arteries supplying the base of the brain in the Mongolian gerbil (Meriones unguiculatus). Pol. J. Vet. Sci. 2008, 11, 295–299. [Google Scholar]
- Subiros, N.; Machado, J.M.; Pérez-Saad, H.; Coro-Antich, R.M.; Berlanga-Acosta, J.A.; Salgueiro, S.R.; Illera, G.G.; Alba, J.S.; Del Barco, D.G. Global brain ischemia in Mongolian gerbils: Assessing the level of anastomosis in the cerebral circle of Willis. Acta Neurobiol. Exp. 2012, 72, 377–384. [Google Scholar]
- Ahn, J.H.; Shin, M.C.; Kim, D.W.; Kim, H.; Song, M.; Lee, T.-K.; Lee, J.-C.; Kim, H.; Cho, J.H.; Kim, Y.-M.; et al. Antioxidant Properties of Fucoidan Alleviate Acceleration and Exacerbation of Hippocampal Neuronal Death Following Transient Global Cerebral Ischemia in High-Fat Diet-Induced Obese Gerbils. Int. J. Mol. Sci. 2019, 20, 554. [Google Scholar] [CrossRef] [Green Version]
- Lee, T.-K.; Park, J.H.; Kim, B.; Park, Y.E.; Lee, J.-C.; Ahn, J.H.; Park, C.W.; Noh, Y.; Lee, J.-W.; Kim, S.-S.; et al. YES-10, A Combination of Extracts from Clematis mandshurica RUPR. and Erigeron annuus (L.) PERS., Prevents Ischemic Brain Injury in A Gerbil Model of Transient Forebrain Ischemia. Plants 2020, 9, 154. [Google Scholar] [CrossRef] [PubMed] [Green Version]
- Maleki, S.N.; Aboutaleb, N.; Souri, F. Berberine confers neuroprotection in coping with focal cerebral ischemia by targeting inflammatory cytokines. J. Chem. Neuroanat. 2017, 87, 54–59. [Google Scholar] [CrossRef] [PubMed]
- Zhang, H.; Park, J.H.; Maharjan, S.; Park, J.A.; Choi, K.-S.; Park, H.; Jeong, Y.; Ahn, J.H.; Kim, I.H.; Lee, J.-C.; et al. Sac-1004, a vascular leakage blocker, reduces cerebral ischemia—reperfusion injury by suppressing blood–brain barrier disruption and inflammation. J. Neuroinflamm. 2017, 14, 122. [Google Scholar] [CrossRef] [PubMed]
- Lee, K.; Lee, J.-S.; Jang, H.-J.; Kim, S.-M.; Chang, M.S.; Park, S.H.; Kim, K.S.; Bae, J.; Park, J.-W.; Lee, B.; et al. Chlorogenic acid ameliorates brain damage and edema by inhibiting matrix metalloproteinase-2 and 9 in a rat model of focal cerebral ischemia. Eur. J. Pharmacol. 2012, 689, 89–95. [Google Scholar] [CrossRef] [PubMed]
- Lee, T.-K.; Park, J.H.; Ahn, J.H.; Kim, H.; Song, M.; Lee, J.-C.; Kim, J.D.; Jeon, Y.H.; Choi, J.H.; Lee, C.H.; et al. Pretreatment of Populus tomentiglandulosa protects hippocampal CA1 pyramidal neurons from ischemia-reperfusion injury in gerbils via increasing SODs expressions and maintaining BDNF and IGF-I expressions. Chin. J. Nat. Med. 2019, 17, 424–434. [Google Scholar] [CrossRef]
- Nita, M.; Grzybowski, A. The Role of the Reactive Oxygen Species and Oxidative Stress in the Pathomechanism of the Age-Related Ocular Diseases and Other Pathologies of the Anterior and Posterior Eye Segments in Adults. Oxidative Med. Cell. Longev. 2016, 2016, 1–23. [Google Scholar] [CrossRef] [Green Version]
- Aviello, G.; Singh, A.K.; O’Neill, S.; Conroy, E.; Gallagher, W.; D’Agostino, G.; Walker, A.W.; Bourke, B.; Scholz, D.; Knaus, U.G. Colitis susceptibility in mice with reactive oxygen species deficiency is mediated by mucus barrier and immune defense defects. Mucosal Immunol. 2019, 12, 1316–1326. [Google Scholar] [CrossRef]
- Kelkka, T.; Kienhöfer, D.; Hoffmann, M.H.; Linja, M.; Wing, K.; Sareila, O.; Hultqvist, M.; Laajala, E.; Chen, Z.; Vasconcelos, J.; et al. Reactive Oxygen Species Deficiency Induces Autoimmunity with Type 1 Interferon Signature. Antioxid. Redox Signal. 2014, 21, 2231–2245. [Google Scholar] [CrossRef] [Green Version]
- Ray, P.D.; Huang, B.-W.; Tsuji, Y. Reactive oxygen species (ROS) homeostasis and redox regulation in cellular signaling. Cell. Signal. 2012, 24, 981–990. [Google Scholar] [CrossRef] [Green Version]
- He, L.; He, T.; Farrar, S.; Ji, L.; Liu, T.; Ma, X. Antioxidants Maintain Cellular Redox Homeostasis by Elimination of Reactive Oxygen Species. Cell. Physiol. Biochem. 2017, 44, 532–553. [Google Scholar] [CrossRef]
- Peshavariya, H.; Dusting, G.J.; Selemidis, S. Analysis of dihydroethidium fluorescence for the detection of intracellular and extracellular superoxide produced by NADPH oxidase. Free. Radic. Res. 2007, 41, 699–712. [Google Scholar] [CrossRef] [PubMed]
- Mustafa, A.G.; Alfaqih, M.A.; Al-Shboul, O. The 4-hydroxynonenal mediated oxidative damage of blood proteins and lipids involves secondary lipid peroxidation reactions. Exp. Ther. Med. 2018, 16, 2132–2137. [Google Scholar] [CrossRef] [PubMed] [Green Version]
- Kryl’skii, E.D.; Popova, T.N.; Safonova, O.A.; Stolyarova, A.O.; Razuvaev, G.A.; de Carvalho, M.A.P. Transcriptional regulation of antioxidant enzymes activity and modulation of oxidative stress by melatonin in rats under cerebral ischemia / reperfusion conditions. Neuroscience 2019, 406, 653–666. [Google Scholar] [CrossRef] [PubMed]
- Wicha, P.; Tocharus, J.; Janyou, A.; Jittiwat, J.; Changtam, C.; Suksamrarn, A.; Tocharus, C. Hexahydrocurcumin protects against cerebral ischemia/reperfusion injury, attenuates inflammation, and improves antioxidant defenses in a rat stroke model. PLoS ONE 2017, 12, e0189211. [Google Scholar] [CrossRef]
- Chen, L.; Deng, H.; Cui, H.; Fang, J.; Zuo, Z.; Deng, J.; Li, Y.; Wang, X.; Zhao, L. Inflammatory responses and inflammation-associated diseases in organs. Oncotarget 2017, 9, 7204–7218. [Google Scholar] [CrossRef] [Green Version]
- Nakamura, K.; Shichita, T. Cellular and molecular mechanisms of sterile inflammation in ischaemic stroke. J. Biochem. 2019, 165, 459–464. [Google Scholar] [CrossRef] [Green Version]
- Jayaraj, R.L.; Azimullah, S.; Beiram, R.; Jalal, F.Y.; Rosenberg, G.A. Neuroinflammation: Friend and foe for ischemic stroke. J. Neuroinflamm. 2019, 16, 142. [Google Scholar] [CrossRef] [Green Version]
- Banjara, M.; Ghosh, C. Sterile Neuroinflammation and Strategies for Therapeutic Intervention. Int. J. Inflamm. 2017, 2017, 1–20. [Google Scholar] [CrossRef] [Green Version]
- Disabato, D.J.; Quan, N.; Godbout, J.P. Neuroinflammation: The devil is in the details. J. Neurochem. 2016, 139, 136–153. [Google Scholar] [CrossRef] [Green Version]
- Kim, D.W.; Lee, J.-C.; Cho, J.-H.; Park, J.H.; Ahn, J.H.; Chen, B.H.; Shin, B.-N.; Tae, H.-J.; Seo, J.Y.; Cho, J.H.; et al. Neuroprotection of Ischemic Preconditioning is Mediated by Anti-inflammatory, Not Pro-inflammatory, Cytokines in the Gerbil Hippocampus Induced by a Subsequent Lethal Transient Cerebral Ischemia. Neurochem. Res. 2015, 40, 1984–1995. [Google Scholar] [CrossRef]
- Dugue, R.; Nath, M.; Dugue, A.; Barone, F.C. Roles of Pro- and Anti-inflammatory Cytokines in Traumatic Brain Injury and Acute Ischemic Stroke. Mech. Neuroinflamm. 2017, 211. [Google Scholar] [CrossRef] [Green Version]
- Pahan, K.; Khan, M.; Singh, I. Interleukin-10 and Interleukin-13 Inhibit Proinflammatory Cytokine-Induced Ceramide Production Through the Activation of Phosphatidylinositol 3-Kinase. J. Neurochem. 2002, 75, 576–582. [Google Scholar] [CrossRef] [PubMed]
- Won, M.-H.; Kang, I.J.; Yoo, K.-Y.; Kim, I.H.; Cho, J.-H.; Ahn, J.H.; Park, J.H.; Lee, J.-C.; Tae, H.-J.; Kim, D.W.; et al. Neuroprotection of Chrysanthemum indicum Linne against cerebral ischemia/reperfusion injury by anti-inflammatory effect in gerbils. Neural Regen. Res. 2016, 11, 270–277. [Google Scholar] [CrossRef] [PubMed]
- Kim, H.; Park, J.H.; Shin, M.C.; Cho, J.H.; Lee, T.-K.; Kim, H.; Song, M.; Park, C.W.; Park, Y.E.; Lee, J.-C.; et al. Fate of Astrocytes in The Gerbil Hippocampus After Transient Global Cerebral Ischemia. Int. J. Mol. Sci. 2019, 20, 845. [Google Scholar] [CrossRef] [PubMed] [Green Version]
- Carpenter, J.; Marion, C. Exotic Animal Formulary; Saunders: St. Louis, MI, USA; Elsevier: Philadelphia, PA, USA, 2013. [Google Scholar]
Sample Availability: Samples of the compounds are not available from the authors. |


© 2020 by the authors. Licensee MDPI, Basel, Switzerland. This article is an open access article distributed under the terms and conditions of the Creative Commons Attribution (CC BY) license (http://creativecommons.org/licenses/by/4.0/).
Share and Cite
Lee, T.-K.; Kang, I.-J.; Kim, B.; Sim, H.J.; Kim, D.-W.; Ahn, J.H.; Lee, J.-C.; Ryoo, S.; Shin, M.C.; Cho, J.H.; et al. Experimental Pretreatment with Chlorogenic Acid Prevents Transient Ischemia-Induced Cognitive Decline and Neuronal Damage in the Hippocampus through Anti-Oxidative and Anti-Inflammatory Effects. Molecules 2020, 25, 3578. https://0-doi-org.brum.beds.ac.uk/10.3390/molecules25163578
Lee T-K, Kang I-J, Kim B, Sim HJ, Kim D-W, Ahn JH, Lee J-C, Ryoo S, Shin MC, Cho JH, et al. Experimental Pretreatment with Chlorogenic Acid Prevents Transient Ischemia-Induced Cognitive Decline and Neuronal Damage in the Hippocampus through Anti-Oxidative and Anti-Inflammatory Effects. Molecules. 2020; 25(16):3578. https://0-doi-org.brum.beds.ac.uk/10.3390/molecules25163578
Chicago/Turabian StyleLee, Tae-Kyeong, Il-Jun Kang, Bora Kim, Hye Jin Sim, Dae- Won Kim, Ji Hyeon Ahn, Jae-Chul Lee, Sungwoo Ryoo, Myoung Cheol Shin, Jun Hwi Cho, and et al. 2020. "Experimental Pretreatment with Chlorogenic Acid Prevents Transient Ischemia-Induced Cognitive Decline and Neuronal Damage in the Hippocampus through Anti-Oxidative and Anti-Inflammatory Effects" Molecules 25, no. 16: 3578. https://0-doi-org.brum.beds.ac.uk/10.3390/molecules25163578