Article

Spatio-Temporal Variation of the Bacterial Communities along a Salinity Gradient within a Thalassohaline Environment (Saline di Tarquinia Salterns, Italy)

by
Susanna Gorrasi
1,
Andrea Franzetti
2,
Roberto Ambrosini
3,
Francesca Pittino
2,
Marcella Pasqualetti
1,4 and
Massimiliano Fenice
1,5,*
1
Dipartimento di Ecologia e Biologia, Università degli Studi della Tuscia, Largo Università snc, 01100 Viterbo, Italy
2
Dipartimento di Scienze dell’Ambiente e della Terra, Università di Milano-Bicocca, Piazza della Scienza 1, 20126 Milano, Italy
3
Dipartimento di Scienze e Politiche Ambientali, Università degli Studi di Milano, Via Celoria 2, 20133 Milano, Italy
4
Laboratoro di Ecologia dei Funghi Marini CONISMA, Università degli Studi della Tuscia, Largo Università snc, 01100 Viterbo, Italy
5
Laboratorio di Microbiologia Marina Applicata, CONISMA, Università degli Studi della Tuscia, Largo Università snc, 01100 Viterbo, Italy
*
Author to whom correspondence should be addressed.
Submission received: 12 January 2021 / Revised: 18 February 2021 / Accepted: 25 February 2021 / Published: 2 March 2021
(This article belongs to the Topic Extreme Environments: Microbial and Biochemical Diversity)

Abstract

:
The “Saline di Tarquinia” salterns have been scarcely investigated regarding their microbiological aspects. This work studied the structure and composition of their bacterial communities along the salinity gradient (from the nearby sea through different ponds). The communities showed increasing simplification of pond bacterial diversity along the gradient (particularly if compared to those of the sea). Among the 38 assigned phyla, the most represented were Proteobacteria, Actinobacteria and Bacteroidetes. Differently to other marine salterns, where at the highest salinities Bacteroidetes dominated, preponderance of Proteobacteria was observed. At the genus level the most abundant taxa were Pontimonas, Marivita, Spiribacter, Bordetella, GpVII and Lentibacter. The α-diversity analysis showed that the communities were highly uneven, and the Canonical Correspondence Analysis indicated that they were structured by various factors (sampling site, sampling year, salinity, and sampling month). Moreover, the taxa abundance variation in relation to these significant parameters were investigated by Generalized Linear Models. This work represents the first investigation of a marine saltern, carried out by a metabarcoding approach, which permitted a broad vision of the bacterial diversity, covering both a wide temporal span (two years with monthly sampling) and the entire salinity gradient (from the nearby sea up to the crystallisation ponds).

1. Introduction

Marine salterns (MS) are transition areas subject to very intense daily and seasonal variations of environmental parameters, particularly water temperature and salinity. Few other extreme environments undergo fluctuations of water availability and temperature as extreme as MS [1,2,3], which expose organisms to high environmental stress. Thus MS, besides being excellent models to study microbial diversity and ecology at different salt concentrations, are also suitable models to investigate phenomena such as scarce water availability and desiccation linked to currently ongoing global change [3,4].
Organisms of MS include both marine and more specialized species adapted to the high salinity [5,6,7,8]. The species richness of multicellular organisms decreases when salinity increases; at the highest salinities, animals and plants disappear and life is represented exclusively by Archaea, Bacteria and unicellular Eukaryotes [9]. However, the microorganism communities in the different ponds are due to both the active growth of resident taxa (specifically adapted to the pond environmental conditions) and to external inputs from neighbouring ponds, atmospheric events and bird droppings.
MS usually present a series of shallow ponds sequentially connected in order to establish an increasing salinity gradient; seawater is transferred through low salinity ponds (concentrators), to ponds where salt precipitation occurs (crystallisers) [10]. MS are therefore highly heterogeneous environments inhabited by complex biological communities distributed and differentiated along the salinity gradient, which also represents an environmental barrier difficult to cross both for macro- and micro-organisms [11,12]. In these environments, salt concentration clearly exerts a high selective pressure on organisms and is therefore the main environmental factor shaping the structure and the composition of the microbial communities [13]. Overall, prokaryotes, which dominate communities at the highest salinity levels, represent useful models to study the adaptive strategies used to cope with the above-mentioned severe life conditions and the relative population dynamics [14,15,16].
Various studies have been carried out by culture-independent methods to assess the prokaryotic diversity of MS. However, the majority were based on low-resolution methods (i.e., 16S rDNA clone libraries or Denaturing Gradient Gel Electrophoresis, DGGE) [17,18,19,20,21,22,23,24,25,26,27], which returned a limited vision of the diversity, affecting also community structure analysis. In addition, the majority of the investigations are based on one-time sampling [17,18,19,21,23,25,27,28,29,30,31,32,33,34,35], generating scant information on the prokaryotic taxa fluctuations over time.
Moreover, general prokaryotic community pattern and distribution along the salinity gradient within the MS environments have often been described [4,17,22,25,28,31,36,37]. Besides, it has been shown that MS of different geographic areas revealed only partially similar patterns and distribution of prokaryotes [18,20,21,23,26,27,32,33,34,35,38,39]. Thus, tracing and identifying common and different features in the prokaryotic assemblages of the worldwide MS is of valuable biological and ecological interest.
The present work specifically investigated the halophilic bacterial diversity of the Saline di Tarquinia marine salterns and its variation, over two years, through a metabarcoding approach.
The “Saline di Tarquinia” salterns (ST) cover an area of about 135 ha and are located at ca. 80 km NW of Rome, along a low sandy coast of the North Tyrrhenian Sea, from which they are separated by an array of low dunes. The salinity gradient is developed along a series of ca. 100 shallow interconnected ponds [16]. The industrial salt production in ST started in 1805 (but historical sources documented salt production already during the Etruscan and Roman ages) and ceased in 1997. In 1980 ST become a Nature Reserve. Concomitantly, anthropic activities dramatically reduced and the management and maintenance of the pond water balance changed (i.e., control of seawater inputs become irregular). Over time, the entire site structure was altered. In particular, the levees between the various ponds were eroded, allowing mixing of waters with different salinity. However, ST can still be considered an extreme environment with broad and sudden variations of environmental parameters (in particular salinity and water temperature) in the majority of the ponds [3].
ST biodiversity has been studied since 1976, and in 2007 a research laboratory was established in ST to coordinate and optimise the research activities. However, despite the intense research activity, the microbial communities of the sites were poorly investigated. Indeed, the majority of the studies regarded ST plant and animal diversity and ecology [6,40,41,42,43,44,45,46,47,48], and only a few studies regarded the presence and characterisation of phytoplanktonic organisms [8,40,49,50]. Only a preliminary investigation, carried out both by culture-dependent and culture-independent methods (DGGE), provided a first characterisation of the bacterial community found in some ponds [7]. Subsequently, a more detailed characterisation of the cultivable fraction was performed, analysing the ability of various strains to cope with temperature and salinity variations [3]. In addition, a recent survey regarding the Vibrio community in different ponds of the salterns was carried out [51].
The aim of this work was to provide the first in-depth characterisation (by a metabarcoding approach) of the bacterial communities of the Saline di Tarquinia salterns. The salinity variations occurring in this thalassohaline environment make ST an ideal environment to study how the bacterial communities cope with fluctuating salinities, monitoring their spatial and temporal variations. The value of this study is the broad investigation of bacterial community variations, both considering the salinity gradient and the wide time span.

2. Results

The work investigated the temporal (over two years) and spatial (along the salinity gradient) variation of the bacterial communities within the “Saline di Tarquinia”, a MS located in central Italy on the Tyrrhenian coast (North of Rome). Water samples were collected monthly in the period May 2012–April 2014 from the nearby sea (feeding the ST saltern system) and among the series of interconnected ponds, from three non-consecutive ponds selected in order to cover the ST salinity gradient: a low-salinity concentrator pond (P5), an intermediate-salinity concentrator pond (P24) and a crystallisation pond (P37). During the two sampling years, the ponds showed salinity fluctuations (Table S1, Supplementary Materials) with values in the ranges 20%–48‰ (P5), 38%–142‰ (P24) and 35%–336‰ (P37). However, except for some months (Table S1, Supplementary Materials) where P37 salinity were rather lower than P24 salinity, increasing salinity values were recorded from the low-salinity concentrator pond to the crystallisation pond.

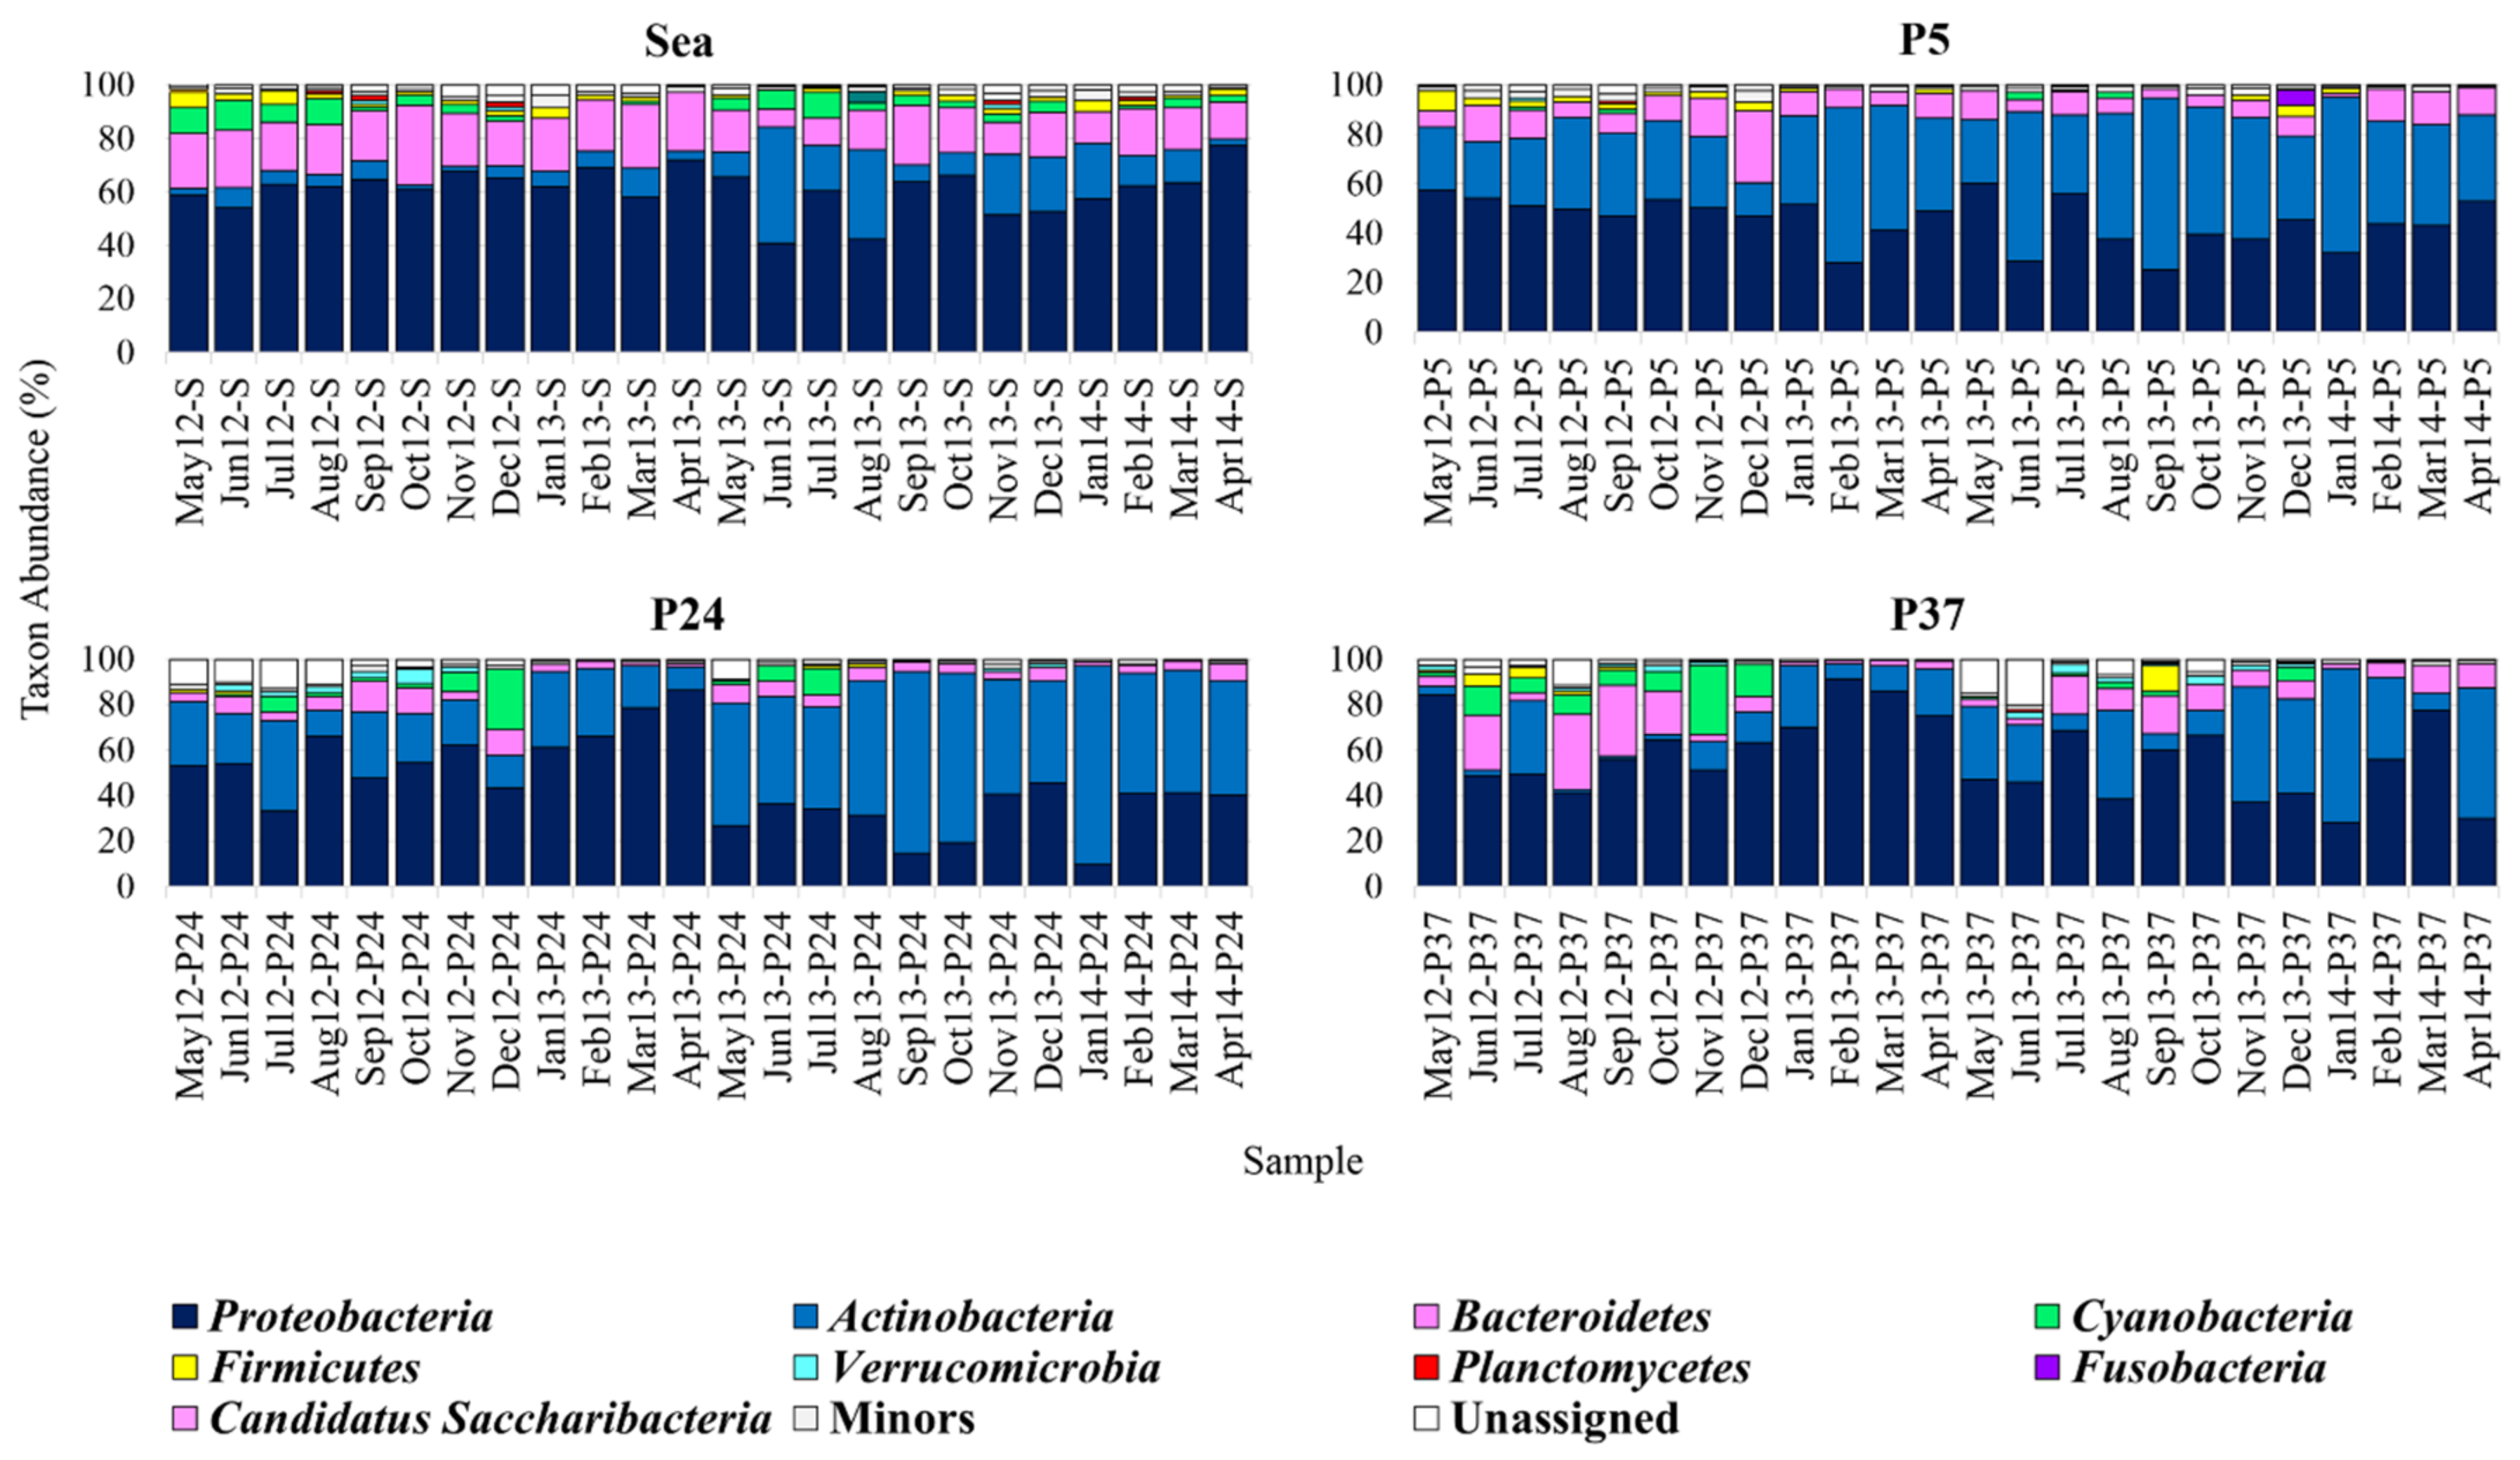
2.1. Composition of the Bacterial Communities

A total of 2,539,445 mapping sequences was obtained from the monthly survey of the bacterial communities along the salinity gradient, over the period May 2012–April 2014. Overall, Good’s index ranged from 90.2 to 99.6, indicating a good coverage for the libraries. The clustering sequence process defined 13,942 bacterial operational taxonomic units (OTUs).
OTUs retrieved were assigned to 38 phyla, 78 classes, 148 orders, 335 families and 1052 genera. At the phylum level, unassigned OTUs ranged from 0.6% to 4.2% in the sea, from 0.3% to 3.5% in P5, from 0.3% to 13% in P24 and from 0.1% to 20.4% in P37.
At the phylum level, the major taxa (relative abundance (Ra) ≥ 1% in at least one sample) found in ST were Proteobacteria, Actinobacteria, Bacteroidetes, Cyanobacteria, Firmicutes, Verrucomicrobia, Planctomycetes, Fusobacteria, Candidatus Saccharibacteria and Deinococcus-Thermus (Figure 1). Among them, Proteobacteria, Actinobacteria and Bacteroidetes were the most represented and were always recorded with a Ra ≥ 1% in all sampling sites over the two-year campaign.
In the sea samples (38%–40‰ salinity), except for June 2013, when Actinobacteria predominated (Ra = 43.5%), Proteobacteria was always the most abundant phylum (40.8–77.4%). Bacteroidetes most often represented the second abundant taxon (6.5–29.8%), except in the periods June-August 2013 and November 2013–January 2014, characterised by a higher abundance of Actinobacteria.
In P5 (20%–48‰ salinity), the bacterial communities were dominated by Proteobacteria and Actinobacteria, representing the most abundant phylum in 67% and 33% of samples, respectively. In particular, Proteobacteria dominated in the periods May 2012–January 2013, April–May 2013, July 2013, December 2013 and February–April 2014. This was generally followed by Actinobacteria; the only exception was in December 2012, where a peak of Bacteroidetes (Ra = 29.3%) was recorded.
In P24 (38%–142‰ salinity), the bacterial communities were dominated by Proteobacteria or Actinobacteria. Proteobacteria represented the most abundant phylum in the periods May–June 2012, August 2012–April 2013, and December 2013, whereas Actinobacteria dominated in the remaining months. In general, in months characterised by Proteobacteria preponderance, Actinobacteria was the second most abundant phylum, and vice versa. The only exception was in December 2012, when the second most abundant phylum was Cyanobacteria (Ra = ~27%).
Communities in P37 (35–336‰ salinity) were also dominated by Proteobacteria and Actinobacteria in 83% and 17% of samples, respectively. Proteobacteria was the most abundant phylum during the first sampling year (May 2012–April 2013), in July 2013 and in the periods August–September 2013 and February–March 2014. Actinobacteria predominated in all remaining months and mostly represented the second most abundant phylum (mainly in the second sampling year). Bacteroidetes represented the second most abundant phylum in summer and autumn (Jun 2012, August–October 2012, and July–October 2013). Although Proteobacteria, Actinobacteria and Bacteroidetes were generally the most represented phyla, a strong peak of Cyanobacteria (Ra = ~30%) was detected in November 2012.
In general, in all sites an increase of Actinobacteria was observed in the second sampling year (May 2013–April 2014), accompanied by the concomitant decrease of Proteobacteria, and sometimes of Bacteroidetes (although to a lesser extent) (Figure 1); this was particularly evident in P24.
Overall, considering all sampling sites, Proteobacteria abundance was higher in the sea than in the ponds (F3,79 = 12.607, pFDR < 0.001; Figure S1, Supplementary Materials). However, the abundance variations of this taxon, quite limited in the sea, were rather evident in the ST ponds (they were much broader in P24 and P37).
Proteobacteria, with some exceptions, seemed to be more abundant at low-intermediate salinities (26%–180‰) (Figure S2, Supplementary Materials). On the contrary, abundance of Actinobacteria was statistically higher in the ponds than in the sea (F3,79 = 41.343, pFDR < 0.001), although showing the broadest variations in P24 and P37 (Figure S1, Supplementary Materials). Abundance of Actinobacteria seemed to be higher also at mainly low-intermediate salinities (26%–146‰) (Figure S3, Supplementary Materials).
Compared to Proteobacteria and Actinobacteria, Bacteroidetes showed more limited abundance variations within the ST communities. However, its abundance was generally higher in the sea than in the ponds (F3,79 = 17.793, pFDR < 0.001) (Figure S1, Supplementary Materials). In P37, Bacteroidetes showed the broadest abundance variations. Moreover, peaks of its abundance were recorded in some months characterised by highest salinities (Figure S4, Supplementary Materials).
With the sole exception of February 2013 and April 2014 in P24, Cyanobacteria was always detected (Figure 1); its abundances were lower in P5 than in the other sampling sites (F3,79 = 11.251, pFDR < 0.001) (Figure S1, Supplementary Materials). In the sea, it represented a major phylum in 19 out of 24, being more abundant from late spring to early autumn (the highest abundances, Ra > 6%, were recorded in the periods May–August 2012 and May–July 2013). P5 definitely revealed the lowest occurrence of this phylum: it was usually detected as a rare taxon (Ra < 1%) excluding in July 2012, September 2012, June 2013 and August 2013, where its abundances were in the range 1.3%–2.8%. In P24 and P37 Cyanobacteria was recorded with some notable peaks in some months only.
In P24, except for July 2012, November–December 2012 and June–July 2013, in which abundances were greater than 6% (peak in December 2012, Ra = ~27%), Cyanobacteria were always rather low or a minor taxon. In P37 it was always major taxon at salinities higher than 180‰ (with Ras in the range 1.5–11.2%).
Abundance of Firmicutes was on average higher in the sea and P5 than in P24 and P37 (F3,79 = 18.651, pFDR < 0.001) (Figure 1; Figure S1, Supplementary Materials). In the sea, it ranged from ~0.6% to ~5.8%, having an average abundance of about 2%. It represented a rare taxon only in three months (April, June and August 2013). In P5, it ranged from ~0.1% to ~8.2%, with an average abundance of about 1.8%, and it represented a rare taxon in 11 out 24 months. In P24, it ranged from ~0.1% to ~1.7%, being definitely lower than in the other sampling sites. It usually represented a rare taxon, except for May–June 2012 and July–August 2013. In P37, Firmicutes ranged from ~0.2% to ~11.2% and was mostly a rare taxon, being among major phyla only in the first 5 months, and in September 2013 (when a peak was detected; Ra = ~11%).
Verrucomicrobia was found in all samples, but often it represented a rare taxon (Figure 1); this was particularly true for the sea and P5. It was detected as a major taxon mainly in P24 and P37: in P24, during the period June–November 2012; in P37 in May 2012 and in the periods August–November 2012 and June–December 2013.
With the only exception of September 2012 in P5, Planctomycetes always represented a rare taxon in the ponds, whereas in the sea it represented a major taxon in August–September 2012, December 2012, November 2013 and February 2014 (Figure 1).
Fusobacteria and Candidatus Saccharibacteria always represented a rare taxon, excluding the peaks recorded in December 2013 for Fusobacteria in P5 (Ra = 6%) and in August 2013 for Candidatus Saccharibacteria in the sea (Ra = 4.2%) (Figure 1).
Among the 1052 genera globally retrieved, 111 had Ra ≥ 1% in at least one sample; unassigned OTUs ranged from 15.8% to 48.5% in the sea, from 16% to 45.9% in P5, from 5.3% to 45.9% in P24 and from 6.7% to 45.2% in P37 (Figure 2).
Although the following considerations are based on relative abundance data calculated only from the OTUs assigned at genus level (50% confidence cut-off), it is rather evident that the sea samples did not show a marked predominance of some taxa, as occurred in the ponds. In any case, the sea samples showed the highest diversity of major genera. Pontimonas, Marivita, Escherichia/Shigella, and GpIIa were constantly found with rather high abundances.
In P5, Pontimonas always notably dominated the bacterial communities, ranging from 18.7% to 61.7%. Except for Lentibacter and Marivita in two samples, all the other taxa were detected with Ras of about ≤10%.
In P24, Pontimonas showed broader abundance variations (Ra 8.4–85.8%). It dominated mainly in the period May 2013–April 2014, but in some months other genera predominated. For instance, Thiohalocapsa was always a rare taxon except in August 2012 when it showed a notable abundance of 35%. Marivita and Bordetella were particularly abundant from January to July 2013, and Spiribacter from May to November 2012. GpVII was present as major genus in same months, in particular in December 2012 (Ra = 26.4%).
In P37, except for Thiohalocapsa, all the taxa mentioned above increased their abundance and they were present as major genus in a higher number of samples. Moreover, Salinibacter, that in the other sampling sites was usually a rare taxon, was in this pond among the major taxa in various months, with abundances in the range 1.3–25.4%. By contrast, a strong reduction of Pontimonas was observed mainly in the first sampling year.
Unlike the samples collected from the sea, those taken from the ponds showed a constant presence of Pontimonas as major taxon, with very high abundance (mainly in P5 and P24) (Figure 2). However, this taxon seemed to be more abundant at low-intermediate salinities (20%–142‰) (Figure S5, Supplementary Materials).

2.2. Alpha- and Beta-Diversity of the Bacterial Communities

The α-diversity indices of the bacterial communities of ST samples collected from the sea and the selected ponds along the salinity gradient are reported in Table S2, Supplementary Materials. The number of OTUs ranged from 86 to 397, from 112 to 254, from 253 to 712 and from 129 to 455 for the sea, P5, P24 and P37, respectively. The Shannon index ranged from 1.871 to 4.660, from 1.480 to 3.857, from 3.518 to 5.843 and 2.565 to 4.578 for the sea, P5, P24 and P37, respectively. The Gini inequality index was very high in all sample ranging from 0.976 to 0.999.
Overall, P24 bacterial communities showed higher diversity (higher number of OTUs and Shannon Index) than those of sea, P5 and P37, and were the least dominated (lowest Gini Index)
The Canonical Correspondence Analysis (CCA) analysis showed that the community structure changed significantly with sampling site, sampling year and, salinity and showed seasonal variations, as accounted for by variables sin(Month), cos(Month) and their interaction with the sampling site (Table 1).
The first axis of CCA plot (Figure 3) accounted mainly for different sampling sites. Based on this parameter, samples collected from the ponds P37 and P24 formed overlapping clusters and were distributed along the salinity gradient, whereas bacterial communities of P5 and S clustered separately.

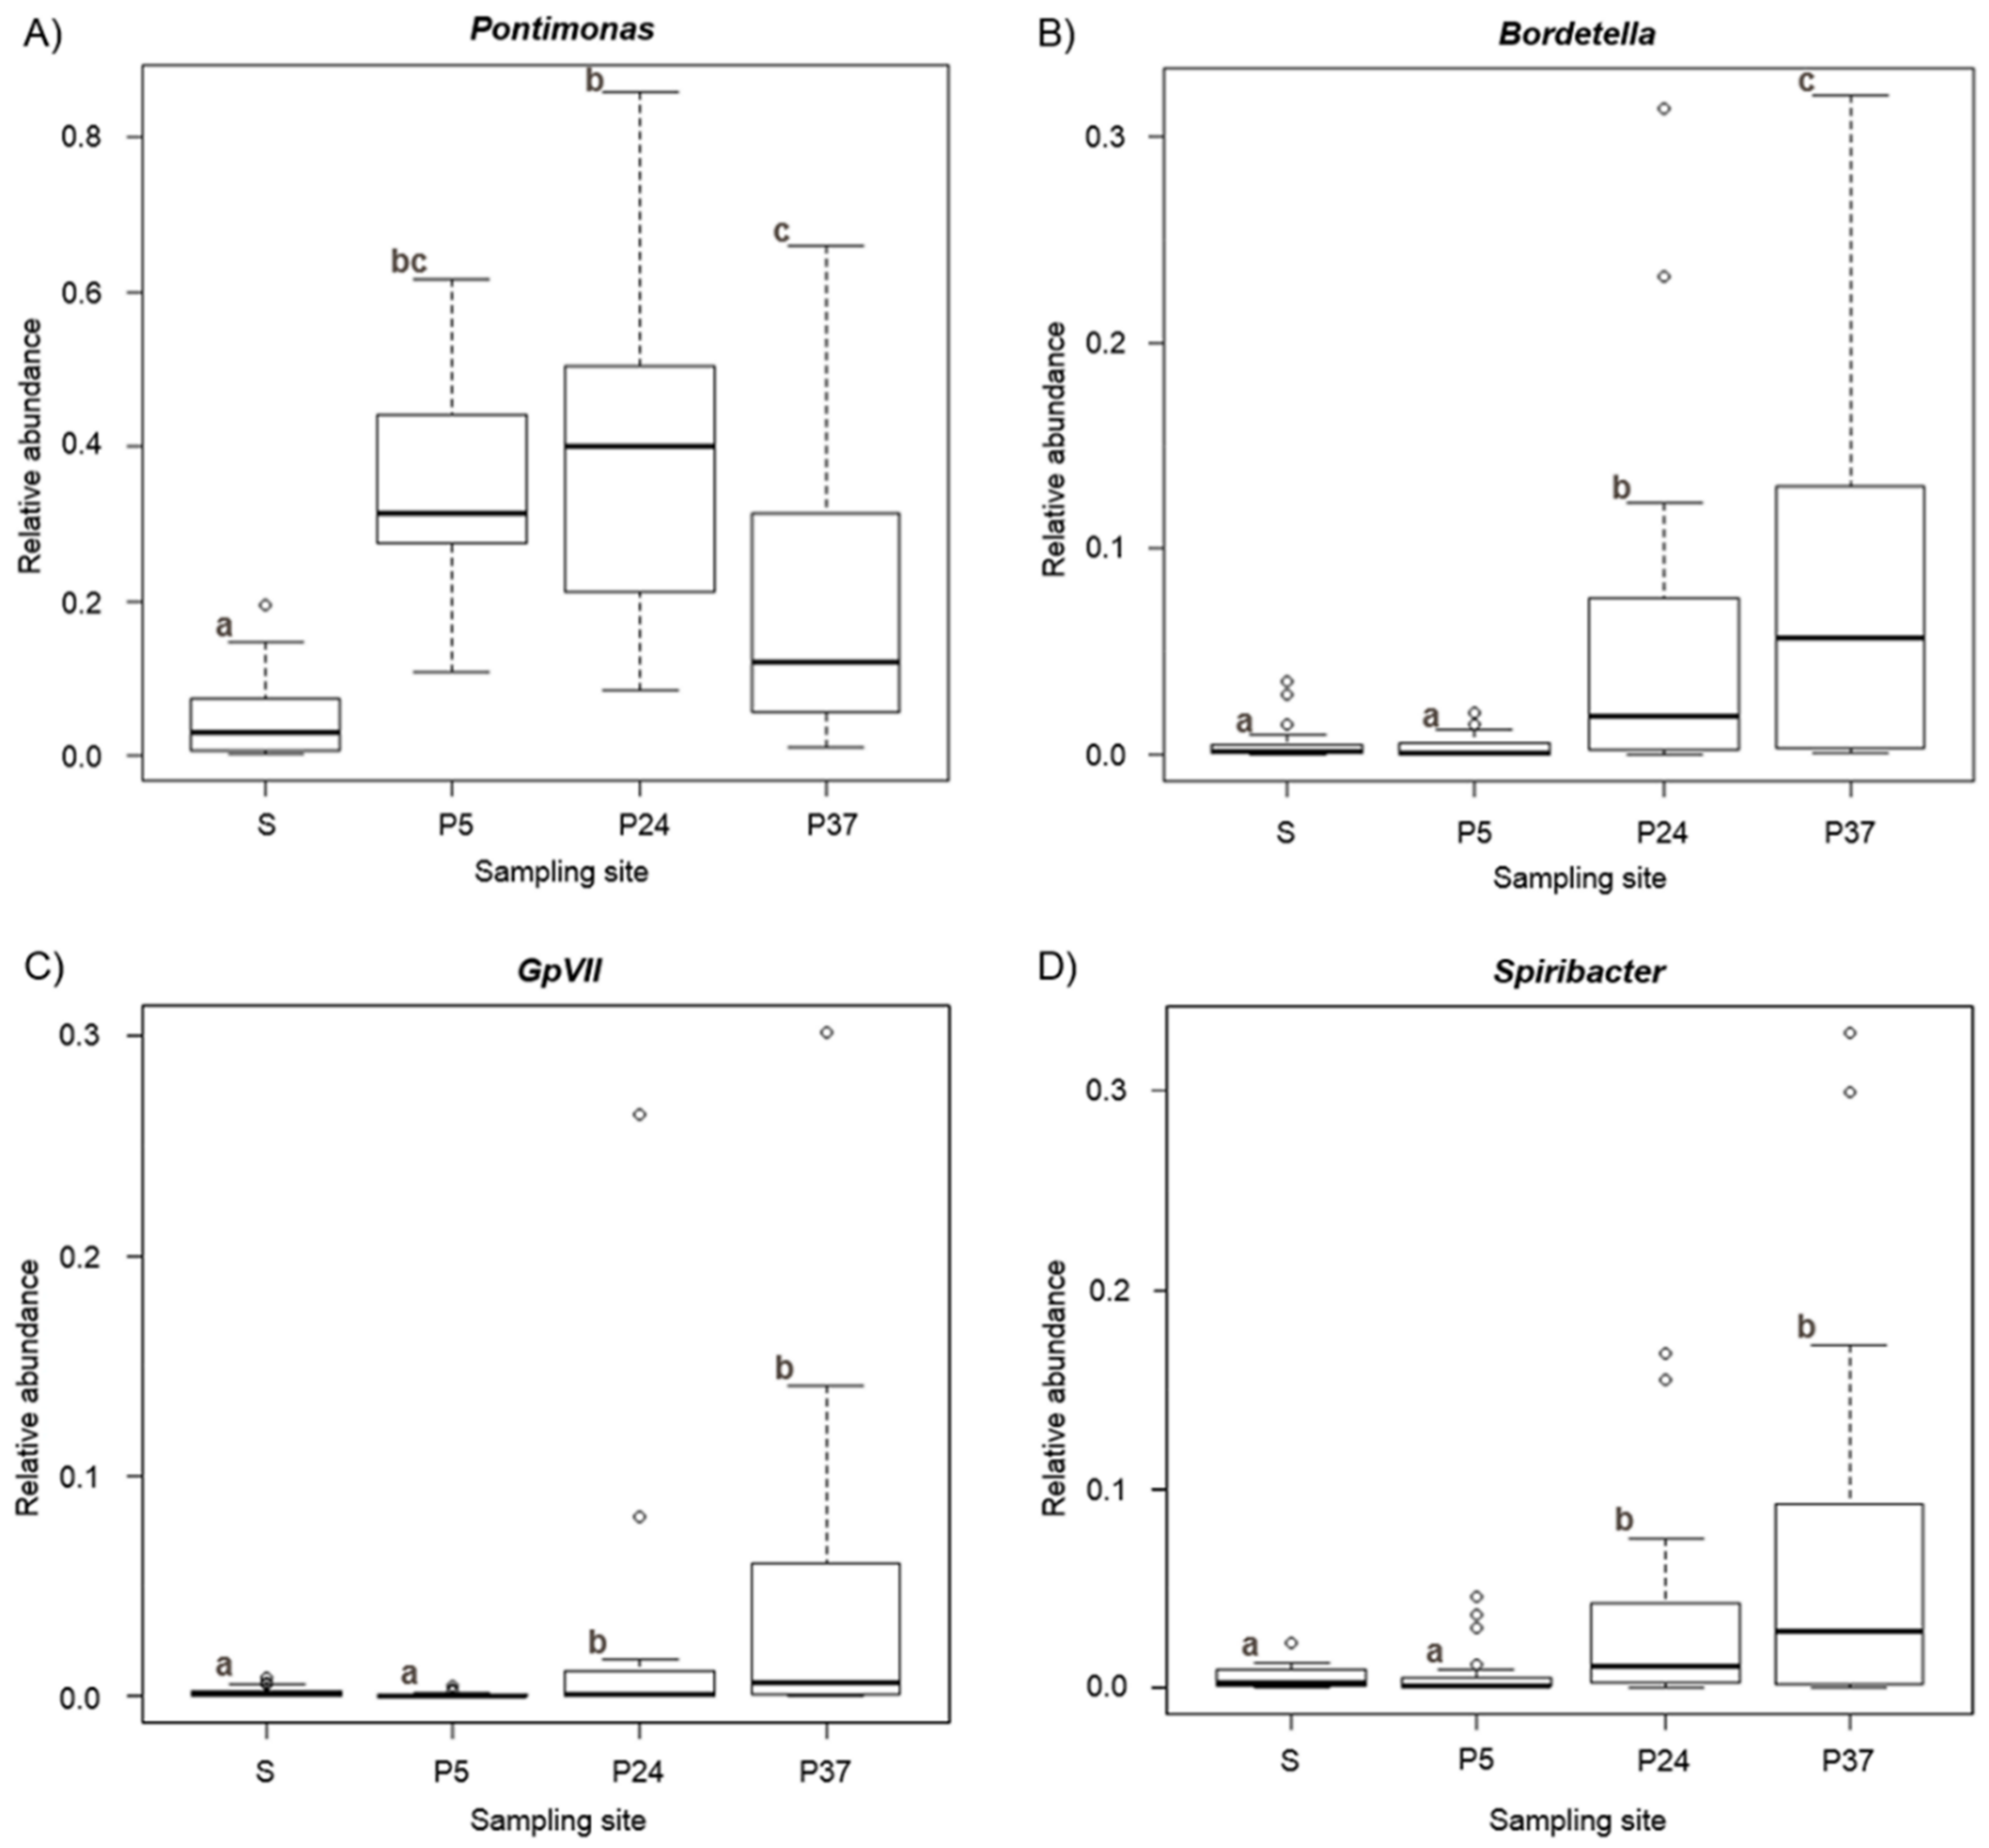
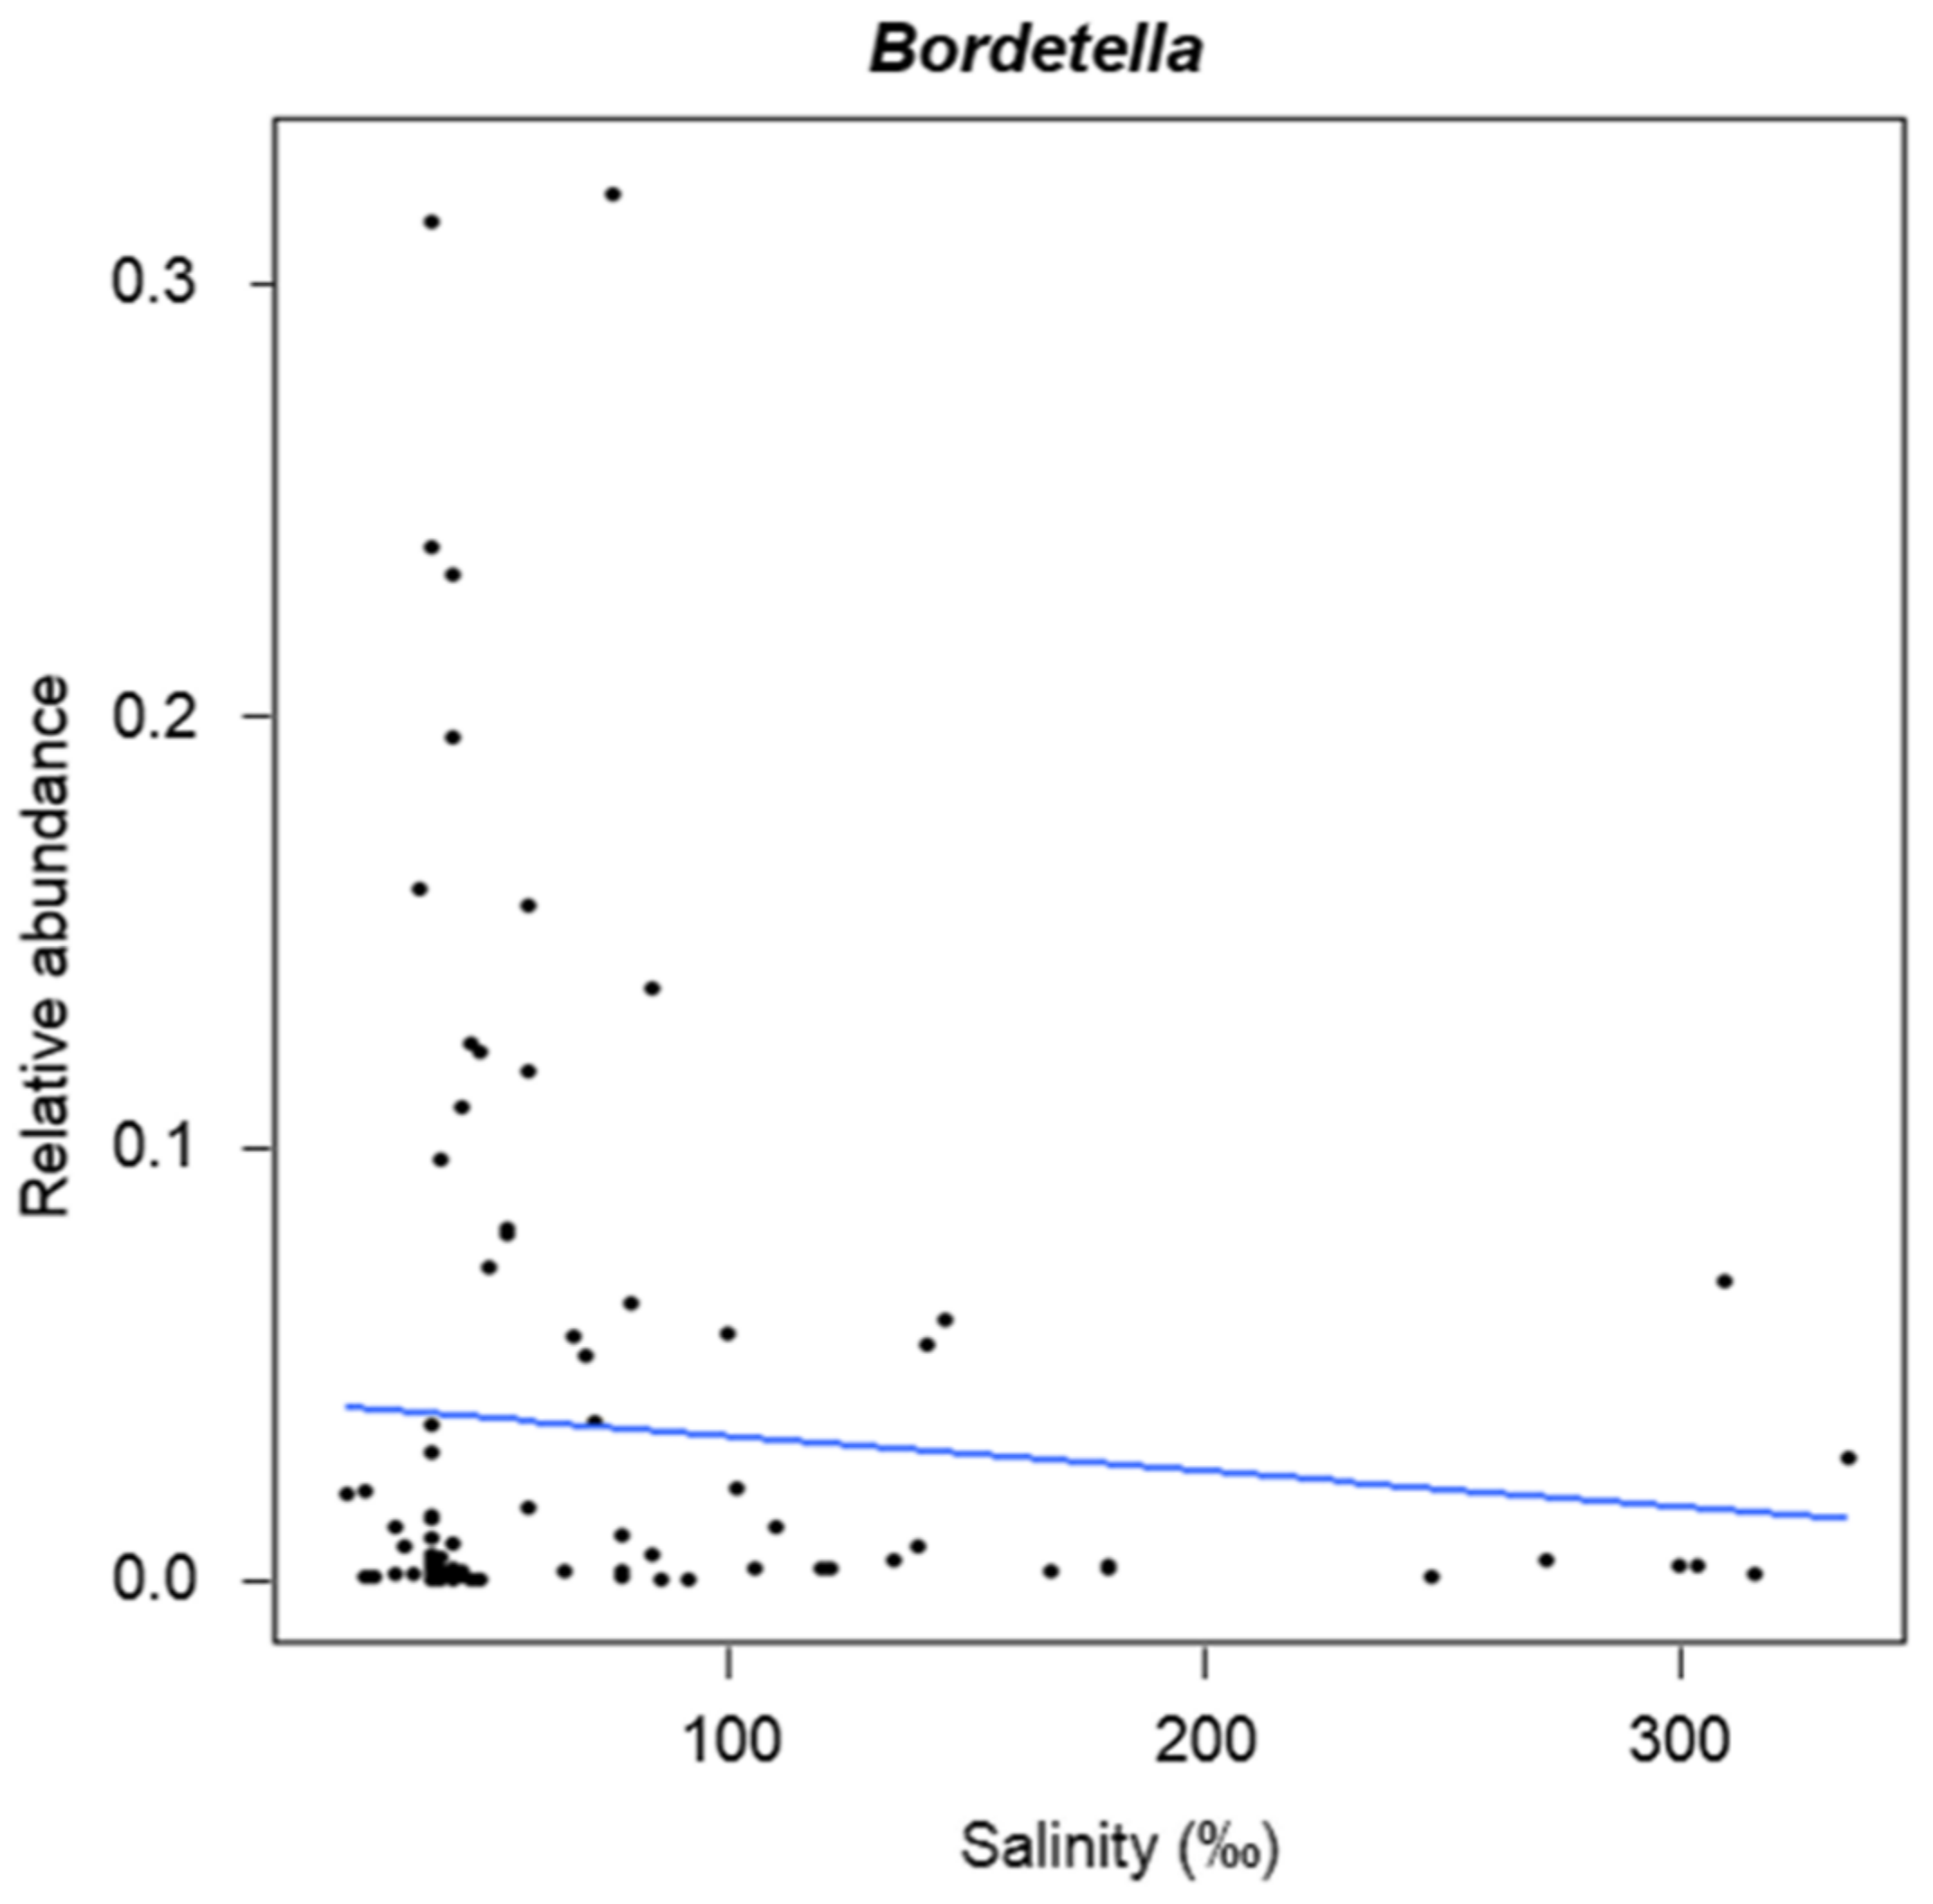
2.3. Variation of α-Diversity Indices and General Abundance in Relation to the Parameters Structuring the Bacterial Communities

Generalised Linear Models (GLMs) were run to analyse whether α-diversity indices and relative abundance of the most abundant genera significantly varied according to the parameters that structured the bacterial communities (see Table 1)
The α-diversity indices did not show significant variations (p > 0.05), whereas some taxa changed significantly according to the tested parameters.
Among the most abundant genera (Pontimonas, Marivita, Spiribacter, Bordetella, GpVII and Lentibacter), Lentibacter and Marivita showed significant variations among the sampling sites (Figure 4). Pontimonas (F3,79 = 55.571, pFDR < 0.001) showed the lowest relative abundances in the sea, increasing in P5 and P24, and decreasing again in P37; no statistically significant differences were recorded between the sea and P37 and between P5 and P24. Spiribacter (F3,79 = 14.767, pFDR < 0.001) and GpVII (F3,79 = 31.110, pFDR < 0.001) showed a similar trend among sampling sites, being lower in the sea and P5, and higher in P24 and P37 (with no statistically significant differences between the sea and P5 and between P24 and P37). Bordetella (F3,79 = 25.274, pFDR < 0.001) was very low in the sea and P5 (with no statistically significant differences between these sites), increasing in P24 and even more in P37.
Taxa seasonal variation was also investigated (Figure 5). Pontimonas showed a maximum in January, then decreased reaching a minimum in spring, and increased slightly in autumn (sin(Month): F1,79 = 26.475, pFDR < 0.001). Marivita had similar abundances from June to January (from late summer to winter) and reached a maximum in spring (cos(Month): F1,79 = 12.027, pFDR = 0.006). Spiribacter showed a minimum in winter, increasing until June (early summer), then it experienced a slight decrease, only to rise again reaching a maximum in autumn (sin(Month): F1,79 = 16.174, pFDR < 0.001; sin(Month) × cos(Month): F1,79 = 35.472, pFDR < 0.001). Bordetella had a maximum in spring and a minimum in autumn (sin(Month): F1,79 = 9.478, pFDR = 0.014). GpVII was usually quite low but increased from September to reach a maximum in December (it increased from the early autumn to reach a maximum in early winter) (cos(Month): F1,79 = 41.793, pFDR < 0.001).
Marivita varied also with the interaction sin(Month) × sampling site (F1,79 = 8.7661, pFDR < 0.001).
Only Bordetella showed significant variation (z = 12.170, pFDR < 0.001) in relation to salinity (Figure 6), decreasing with increasing salinity.
Pontimonas, Marivita and GpVII varied according to the sampling year (Figure 7). Pontimonas abundance increased progressively from 2012 to 2014 (F2,79 = 26.876, pFDR < 0.001). Marivita was higher in 2013 than in 2012 and 2014 (F2,79 = 24.3394, pFDR < 0.001). GpVII was higher in 2012 than in 2013 and 2014 (F2,79 = 133.8325, pFDR < 0.001).

3. Discussion

The current work was aimed at extending knowledge of hypersaline environments especially investigating bacterial communities’ variations in relation to the salinity gradient established along different ponds within a MS system (Saline di Tarquinia, Italy). The study considered the bacterial community assemblages starting from the neighbouring sea (representing the saltern seawater inlet) up to the crystallisation ponds.
Although some of the ST ponds have already been preliminarily studied by DGGE [7], the ST environment deserves more detailed investigation. This work represented the first in-depth characterisation of these bacterial communities by a high throughput metabarcoding approach. In addition, the value of the current investigation is broader, since the study was systematically planned, comprising a two-year survey with monthly sampling of various ponds.
Our outcomes will be compared to those obtained by other authors regarding the bacterial communities of water samples of various MS worldwide (see below).
This work evidenced that all the bacterial communities found along the ST salinity gradient were strongly uneven, as suggested by the high values (0.976–0.999) of the Gini index (Table S2, Supplementary Materials). The CCA analysis (Table 1, Figure 3) showed that the community variation was related to the sampling site, salinity, sampling year and month (addressing a seasonality effect). Based on the combination of these factors, the communities were clearly ordered according to the salinity gradient. As expected, the largest differences occurred between the communities of the sea and P37.
The taxonomic analysis revealed that these bacterial communities were dominated by members of three phyla: Proteobacteria. Bacteroidetes and Actinobacteria. In general, they are also retrieved as the most abundant bacterial taxa in other solar salterns around the world [17,18,20,24,28,30,31,33,36,52,53].
The progressive variation of the bacterial community assemblages along the salinity gradient (from the neighbouring sea towards the crystallisation ponds), which was evident at the genus level, was already revealed at a high taxonomic level (Phylum).
Proteobacteria, the most abundant phylum in the sea, decreased in P5 where a codominance of Proteobacteria and Actinobacteria was observed. The increase of Actinobacteria in P5 occurred concomitantly with a decrease of Bacteroidetes. This result was somehow surprising, the salinities recorded in the sea and P5 being quite similar; thus, a similar community composition was expected.
In P24, Proteobacteria were higher again in the first year, and with even more variations, its abundances very similar to those of the sea. By contrast, in the second year, relative abundance of this phylum was quite low and a preponderance of Actinobacteria occurred. In P24, relative abundance of Bacteroidetes was always lower than in P5, but it increased in P37 (crystallisation pond), particularly in months with higher salinity.
In any case, in all sites both Proteobacteria and Actinobacteria were higher at low-intermediate salinities (26%–180%). Similar results were reported by other authors [24,26,28,31,34,36,53]. However, a decrease in the relative abundance of these phyla along the salinity gradient was often reported and, at salinities higher than 200‰, Bacteroidetes abundance highly increased [4,19,22,28,30,31,34,36,37,54]. Moreover, various studies evidenced that at the highest salinities (≥ 300‰), where diversity is low, Euryarchaeota (Archaea) represented the greatest proportion of the community, but Bacteroidetes was the most abundant phylum among Bacteria (often representing almost the entire bacterial community) [4,17,28,29,31,34,37,53,54,55,56,57]. This was not confirmed by our work, since in ST Bacteroidetes generally showed low abundances, excluding some peaks in months characterised by high salinities. However, it was lower than Proteobacteria and Actinobacteria, which also dominated at high salinities. Thus, our outcome was somehow inconsistent with the majority of results from others, but it must be taken into account that most of these regarded the Santa Pola saltern (Spain), which is considered a study model for hypersaline environments, but is located in a more southerly location than ST. Actually, for different solar salterns over the world, other authors reported quite different assemblages concerning the bacterial fraction of the prokaryotic communities, indicating possible bio-geographic patterns [18,20,21,23,26,27,32,33,34,35,38,39]. Among them, some studies regarding the MS of Chile, Mexico, India, Bulgaria, and Spain revealed not only the presence of Proteobacteria in the crystalliser ponds (280%–440‰ of salinity), but also that they were more abundant than Bacteroidetes [23,27,33,35,38,39]. In addition, in some cases, Actinobacteria was also found among the major phyla harboured by the crystallization ponds [32,33,38].
The taxonomic analysis at the genus level evidenced a relatively high number of major taxa in the sea, which showed, in general, low-medium abundances. Instead, along the salinity gradient from the concentrator ponds to the crystallisation ponds, the taxonomic pattern (regarding major taxa) was simplified and an evident preponderance of some genera occurred.
An interesting outcome of this work regarded Pontimonas; it was relatively scarce (<20%) in the sea, but usually quite abundant in the ponds up to ca. 200‰ of salinity (Figure 2, Figure S5, Supplementary Materials). In addition, at the highest salinities of P37 it was always a major genus even if with much lower abundances (1.2–6.1%). This genus includes only one species (P. salivibrio) and the only cultivable strain (CL-TW6) was isolated in Korea from a solar saltern pond showing salinity slightly higher than seawater. It was assumed to be a slightly halophilic marine bacterium (optimal growth at 30‰ of salinity) by the researchers that described the species [58,59], who supposed that it was drawn into the saltern from the coastal environment [60]. No other work reports isolation of Pontimonas strains from MS or other hypersaline environments. Instead, some molecular studies also revealed the presence of this bacterium in continental hypersaline lakes at higher salinities [61,62]. In addition, to the best of our knowledge, the presence of Pontimonas in a MS was reported only by Leoni et al. (2020); this metabarcoding study found this genus at intermediate salinity (131% and 145‰), but with quite low relative abundance (~2%) [34].
In our case, Pontimonas relative abundances were lowest in the sea and highest mainly in P5 and P24 (although abundances in P37 were not statistically different from those in P5) (Figure 2, Figure 4A). Since salinity levels in the sea and P5 were quite similar, the very high differences in their Pontimonas abundance (Figure 2) could be due to other variables.
Due to its possible salinity preferences, this genus, even if with some exceptions, could be considered as a slight and/or moderate halophile. However, the constant presence of this genus in P37, and its rather high abundances (30–38%) at high salinities (Figure S5, Supplementary Materials), would also suggest a possible behaviour as a borderline-extreme halophile or, at least, as a moderate halophile with broad euryhalinism. Since these results were obtained over two years, they strongly reinforce the hypotheses of an evident adaptation of this genus to broad salinity variations, which could be substantiated also by the physiological data regarding the ST bacterial strains showing marked euryhalinism [3].
The presence of Bordetella in ST deserves to be discussed in detail. Bordetella species were mainly isolated from warm-blooded animals (including humans) and, until recently, they were thought to be only animal pathogens [63,64]. Nonetheless, recent studies revealed that Bordetella strains could also have an environmental origin [64,65,66]. It has been assumed that the Bordetella species related to animals evolved from ancestral environmental strains, and some animal-adapted species still maintain the ability to proliferate in the environment [64,67]. Among this genus, some members are known to be avian-associated microorganisms [68,69,70].
In our case, we have no definite information to explain the presence of this taxon, but since ST hosts a great avian biodiversity [71,72], we can assume that the presence of Bordetella in ST could have a primary avian origin with subsequent adaptation to the saltern environment, where it is quite diffused and not sporadic. In fact, this genus was constantly found in all samples; in the sea and P5 it often represented a rare taxon, but in P24 and P37 it was frequently a major genus with some high abundances (Figure 2). Moreover, GLM indicated a main seasonal occurrence of this taxon, which increased in spring and decreased in autumn (Figure 5C). It can be speculated that the total bacterial abundance in the high-salinity ponds can be lower than in low-salinity ponds. Therefore, exogenous bacteria brought by animals (e.g., birds) into these ponds might become major taxa even if they could be unable to grow.
The metabarcoding survey confirmed the presence of Spiribacter and Salinibacter in ST, like in other MS worldwide [23,26,27,28,31,36,52,54,73,74]. However, they have a different distribution with respect to salinity: Spiribacter generally dominates in the concentrator ponds with salinities of 100%–250‰, while Salinibacter dominates in the crystallisation ponds [19,28,31,34,74,75,76,77]. Presence of these genera at the mentioned specific conditions was confirmed also in our study, but they were not dominant. Absence or scarce abundance of Salinibacter in the crystalliser ponds have been pointed out also by other authors who studied MS of India, Spain and Greece [20,38,39].
However, as already stated by other authors, changes in environmental and or climatic conditions may influence saltern microbial communities; thus, in different geographic areas, different microbial assemblages could be revealed [19,27,37,54].

4. Materials and Methods

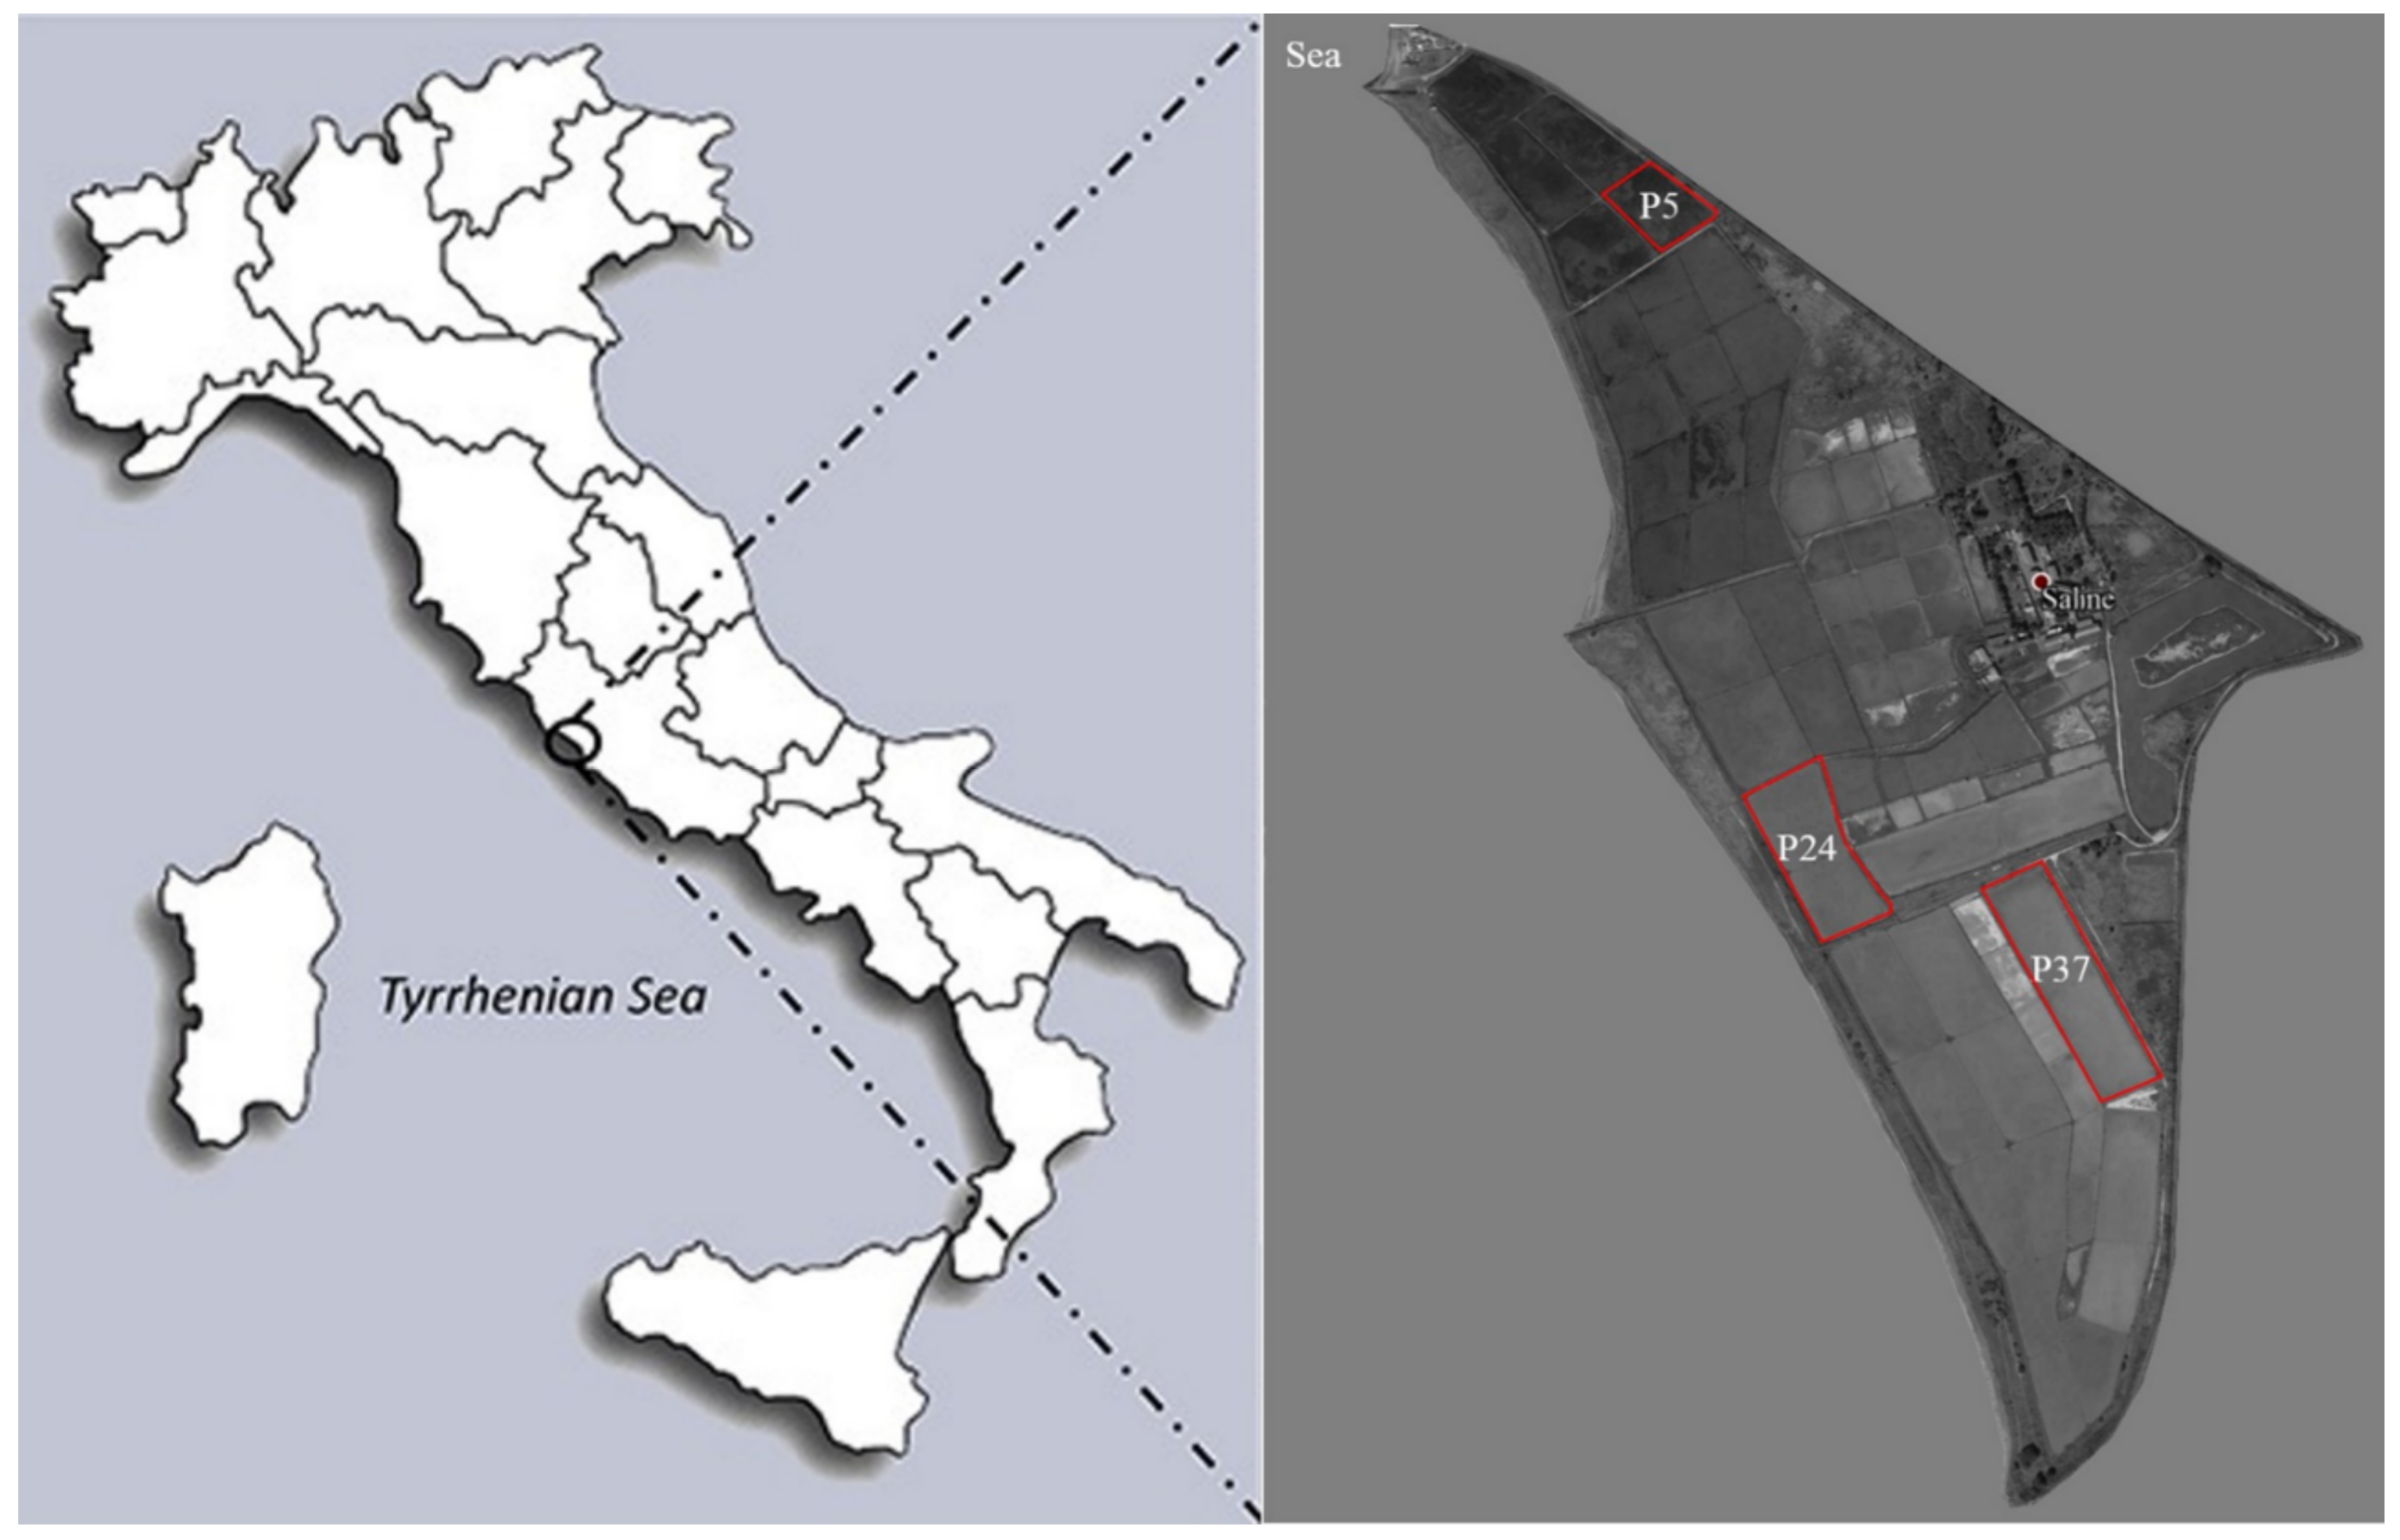
4.1. Sample Collection and Characterisation

Water samples were collected monthly over two years (from May 2012 to April 2014) from three ponds (P5, P24 and P37) within the ST (North Tyrrhenian Sea, Italy; 42°12′07.8′′ N 11°43′17.8′′ E) and from the nearby sea (Figure 8). The three non-consecutive ponds (low-salinity concentrator pond, P5; intermediate-salinity concentrator pond, P24; crystallisation pond, P37) were selected according to their annual range of salinity in order to cover the whole ST gradient.
All samples, obtained by pooling three different sub-samples [1,39,78], were stored in sterile bottles and kept refrigerated (4 °C) during the transport to the ST laboratory to be processed within an hour. Then, 1 L of water was vacuum filtered on sterile membranes (0.22 µm, Millipore, Burlington, MA, USA), which were washed twice with sterile saline (NaCl) solutions (with concentration roughly corresponding to the salinity recorded on the sites) to remove possible nutrients from the filters [78]. Membranes were maintained frozen until DNA extraction. The remaining sample aliquots were used to determine BOD5 and chlorophyll pigment concentration, which were measured by standard methods [79]
Environmental parameters (salinity, pH, conductivity and water temperature) were recorded during sampling by common handheld probes (see Table S1, Supplementary Materials for details on the recorded parameters over the sampling period). Daily rainfall and average temperatures of the site were obtained from a local government institution (“Ufficio Idrografico e Mareografico, Centro Funzionale Regionale, Regione Lazio”; [80]).

4.2. DNA Extraction, 16S rDNA Amplicon Libraries and Sequencing

DNA was extracted from the membranes using a GeneMATRIX Bacterial & Yeast Genomic DNA Purification Kit (EURx Ltd., Gdańsk, Poland) as previously reported [81,82]. The multiplexed libraries were prepared using a dual PCR amplification protocol (targeting the V5–V6 hypervariable regions of 16S rRNA gene) as previously reported [83,84]. The first PCR was carried out in 3 × 80 μL volume reactions using the GoTaq Green Master Mix (Promega Corporation, Madison, WI, USA) and 1 μM of each primer. The primers used, 783F and 1046R [85,86], were modified by adding external barcodes to allow the parallel processing of multiple samples. The PCR cycling conditions were: 98 °C for 30 s; 20 cycles at 98 °C for 10 s, 47 °C for 30 s, and 72 °C for 5 s and a final extension at 72 °C for 2 min. The amplicons were purified by Wizard SV Gel and PCR Clean-up System (Promega Corporation, Madison, WI, USA) and quantified using Qubit 2.0 (Life Technologies, Carlsbad, CA, USA). Then, the purified amplicons were pooled to obtain a single library (each library contained nine samples, identifiable by different external barcode pairs). The second step of library preparation, with the addition of standard Nextera indexes (Illumina, Inc., San Diego, CA, USA), and sequencing was carried out at Nuova Genetica Italiana SRL (Monza-Brianza, Italy). Amplicon libraries were sequenced by Illumina MiSeq (Illumina Inc., San Diego, CA, USA) using a 2 × 250 bp paired-end protocol.

4.3. Sequence Processing and Data Analysis

Reads from sequencing were demultiplexed according to the indices and internal barcodes. Reads/sequences were processed using the UPARSE pipeline [87]. Forward and reverse reads were merged with perfect overlapping and quality filtered with default parameters. Suspected chimeras and singleton sequences (i.e., sequences appearing only once in the whole data set) were removed. OTUs were defined on the whole data set clustering the sequences at 97% of similarity and defining a representative sequence for each cluster. The abundance of each OTU was estimated by mapping the sequences of each sample against the representative sequence of each OTU at 97% of similarity. Taxonomic classification of the OTU representative sequences was obtained by RDP classifier [88], using 50% confidence cut-off as suggested for short sequences [89].
Sequence data were submitted to the European Nucleotide Archive (ENA), study accession number PRJEB38856 (http://www.ebi.ac.uk/ena/data/view/PRJEB38856).

4.4. Statistical Methods

The coverage of each sample was evaluated by the Good’s method. The percentage of coverage of each sample was estimated using the formula [1 − (n/N)] × 100, where n is the number of OTUs in a specimen represented by one clone (singletons) and N is the total number of sequences in that specimen [90].
The Shannon index and Gini index were used to describe alpha diversity. The Shannon index takes into account the uniformity of species and its abundance. It ranges from 0 to +∞ and increases as both the richness and the evenness of the community increase [91]. The Gini index [92], developed as a measure of inequality of income in economics, is used in ecology to measure community evenness. Its values range from 0 to 1 and increasing values indicate a decrease in evenness [93]. The Shannon and the Gini indices were calculated on samples rarefied to 1929 randomly chosen sequences, corresponding to the minimum number of sequences at a sample (Table S2, Supplementary Materials). Analyses of alpha diversity indices were performed using linear models after checking that no relevant deviation from model assumption had occurred by visual inspection of residual plots (details not shown).
Beta diversity analyses were run on the non-rarefied samples [94], the number of sequences as abundance estimation of each OTU in a sample. Canonical Correspondence Analysis (CCA) was used to investigate the environmental parameters driving the community structure. Salinity, chlorophyll concentration, sampling month and sampling year were used as predictors. Sampling month data were entered as Fourier series transformed data to account for seasonality [95]. Other variables such as water temperature, pH, rainfall and BOD5 were removed because they were collinear with the abovementioned predictors (Pearson|r| > 0.6). CCA significance was assessed through 9999 permutations.
The abundance variation of the most abundant genera (with at least 40,000 sequences in the whole dataset) in relation to the parameters driving bacterial communities’ structure was investigated by Generalized Linear Models (GLMs), assuming a Poisson distribution and corrected for overdispersion. The log of the total number of sequences at a sample was also entered in the model as an offset, so that the GLMs model the proportion of sequences of a genus [96]. In this case, to account for taxa seasonal variation the periodic regression based on Fourier series transformation of month was also used [95]. Post-hoc tests were used to assess pairwise differences in taxa abundance variation among sampling sites. In GLMs, we accounted for multiple statistical tests by correcting p-values according to the false discovery rate (FDR) procedure [97].
All the statistical analyses were performed in R environment (R 3.4.2, R Core Team, 2018) using VEGAN, BIODIVERSITYR, MULTTEST, and MULTCOMP packages.

5. Conclusions

As well as their archaeal community, marine saltern ecosystems harbour interesting communities of halophilic bacteria, which are often considered somehow less important due to their much lower abundance particularly at the highest salinities and are analysed together with the other prokaryotes. Moreover, various studies have been carried out to assess the prokaryotic diversity of these environments, but the majority used low-resolution methods (i.e., 16S rDNA clone libraries or DGGE) returning a limited vision of the diversity and a distorted community structure. In addition, scant information is available regarding taxa fluctuations over time, most of the investigations being based on a one-time sampling.
Furthermore, although general community distribution along the MS salinity gradients have been described, it has been shown that MS of different geographic areas revealed only partially similar patterns of bacteria. Therefore, tracing and identifying common and different features in the bacterial community assemblages of the MS worldwide is of valuable biological and ecological interest.
Thus, the current work was specifically aimed at obtaining an in-depth characterisation of the bacterial communities found along the salinity gradient within the “Saline di Tarquinia” marine salterns. A metabarcoding approach was used to obtain detailed information on their community structure and composition and their spatial (along the salinity gradient) and temporal (over two years) variations.
In particular, the study evidenced that the ST communities showed, along the salinity gradient, an increasing simplification of bacterial diversity (particularly if compared to those of the nearby sea) and an increase of a few dominant taxa. Moreover, the variation of the bacterial communities along the salinity gradient was related to various factors: sampling site, sampling year, salinity, and sampling month.
The comparison with other marine salterns worldwide revealed different distribution of some bacterial groups, indicating a possible bio-geographic pattern.
Another interesting feature of the ST salterns was the constant presence of Pontimonas as major taxon along the whole salinity gradient (up to saturation) and with high abundance, mainly in the low-concentrator and intermediate-concentrator ponds. Until now, it has been described as a slightly halophilic marine bacterium and found only in two marine salterns, in Korea and South Italy. These findings could help to reconsider the adaptation characteristics of Pontimonas with respect to salinity.
The information obtained by the current study represents a valuable contribution to extend knowledge on the halophilic bacterial diversity of marine salterns, in particular on the composition and structure of the communities and their variations over time.

Supplementary Materials

The following are available online. Table S1. Environmental parameters recorded for the ST samples from May 2012 to April 2014, Table S2. Alpha-diversity indices of the ST amplicon libraries (Sea, P5, P24 and P37 samples), Figure S1. Box-whisker plot (GLM analysis) showing abundance variation of Proteobacteria (A), Actinobacteria (B), Bacteroidetes (C), Cyanobacteria (D) and Firmicutes (E) across the sampling sites. The thick lines represent the median, boxes upper and lower limits indicate the 25th and the 75th percentiles respectively, whiskers indicate the data that go beyond the 5th percentile (lower whisker) and the 75th percentile (upper whisker), and dots represent the outliers. The different letters indicate differences between the mean values of different groups, Figure S2. Proteobacteria distribution in the sampling sites according to the increasing salinities recorded in each site over the two-year survey, Figure S3. Actinobacteria distribution in the sampling sites according to the increasing salinities recorded in each site over the two-year survey, Figure S4. Bacteroidetes distribution in the sampling sites according to the increasing salinities recorded in each site over the two-year survey, Figure S5. Pontimonas distribution in the sampling sites according to the increasing salinities recorded in each site over the two-year survey.

Author Contributions

Conceptualization, S.G., A.F. and M.F.; methodology, S.G., A.F., R.A., F.P., M.P. and M.F.; software, A.F., R.A.; validation, S.G., A.F., R.A., F.P., M.P. and M.F.; formal analysis, S.G., A.F., R.A., F.P., M.P. and M.F.; investigation, S.G. and M.F.; resources, A.F., R.A. and M.F.; data curation, S.G., A.F. and R.A.; writing—original draft preparation, S.G., M.P. and M.F.; writing—review and editing, S.G., A.F., R.A., F.P., M.P. and M.F.; visualization, S.G., A.F., R.A., F.P., M.P. and M.F.; supervision, A.F. and M.F.; project administration, M.F.; funding acquisition, A.F. and M.F. All authors have read and agreed to the published version of the manuscript.

Funding

This research received no external funding.

Data Availability Statement

Sequence data are available at the European Nucleotide Archive (ENA), study accession number PRJEB38856 (http://www.ebi.ac.uk/ena/data/view/PRJEB38856).

Acknowledgments

Authors wish to thank the staff of ‘Comando Unità per la Tutela Forestale Ambientale e Agroalimentare Carabinieri, Posto fisso di Tarquinia UTB Carabinieri’, Riserva Naturale Statale Saline di Tarquinia, Località Saline, 01016 Tarquinia-Viterbo, for the kind support during the sampling.

Conflicts of Interest

The authors declare no conflict of interest.

Sample Availability

Sample of the compounds are not available from the authors.

References

  1. Reboleiro-Rivas, P.; Juarez-Jimenez, B.; Martinez-Toledo, M.V.; Rodelas, M.; Andrade, L.; Gonzalez-Lopez, J.; Fenice, M. Bacterial Communities Structure in a High Mountain Lake During the Ice-free Season: Cultural and PCR-TGGE Investigations. Int. J. Environ. Res. 2013, 7, 685–696. [Google Scholar]
  2. Andrade, L.; González-López, J.; Fenice, M.; Martínez-Toledo, M.V.; Pesciaroli, C.; Maza-Márquez, P.; Juárez-Jiménez, B. Application of Response Surface Methodology (RSM) for Culture Conditions and Biomass Production of Psychrophilic Microalgae Isolated from High Mountains Lake During the Ice-free Season. Int. J. Environ. Res. 2014, 8, 799–812. [Google Scholar] [CrossRef]
  3. Barghini, P.; Pasqualetti, M.; Gorrasi, S.; Fenice, M. Bacteria from the “Saline di Tarquinia” Marine Salterns Reveal Very Atypical Growth Profiles with Regards to Salinity and Temperature. Mediterr. Mar. Sci. 2018, 19, 513–525. [Google Scholar] [CrossRef] [Green Version]
  4. Ventosa, A.; Fernández, A.B.; León, M.J.; Sánchez-Porro, C.; Rodriguez-Valera, F. The Santa Pola Saltern as a Model for Studying the Microbiota of Hypersaline Environments. Extremophiles 2014, 18, 811–824. [Google Scholar] [CrossRef] [PubMed]
  5. Halse, S.A.; Cale, D.; Jasinska, E.J.; Shiel, R.J. Monitoring Change in Aquatic Invertebrate Biodiversity: Sample Size, Faunal elements and Analytical Methods. Aquat. Ecol. 2002, 36, 395–410. [Google Scholar] [CrossRef]
  6. Cimmaruta, R.; Blasi, S.; Angeletti, D.; Nascetti, G. The Recent History of the Tarquinia Salterns Offers the Opportunity to Investigate Parallel Changes at the Habitat and Biodiversity Levels. Transit. Water. Bull. 2010, 4, 53–59. [Google Scholar]
  7. Barghini, P.; Silvi, S.; Aquilanti, A.; Marcelli, M.; Fenice, M. Bacteria from Marine Salterns as a Model of Microorganisms Adapted to High Environmental Variations. J. Environ. Prot. Ecol. 2014, 15, 897. [Google Scholar]
  8. Barghini, P.; Giovannini, V.; Fenice, M.; Gorrasi, S.; Pasqualetti, M. High Lutein Production by a Halo-tolerant Strain of Dunaliella sp. (Chlorophyceae) Isolated from Solar Salterns in Central Italy. J. Environ. Prot. Ecol. 2018, 19, 704–712. [Google Scholar]
  9. Pedrós-Alió, C. Trophic Ecology of Solar Salterns. In Halophilic Microorganisms; Ventosa, A., Ed.; Springer: Heidelberg/Berlin, Germany, 2004; pp. 33–48. ISBN 978-3-642-05664-2. [Google Scholar]
  10. Barghini, P.; Aquilanti, A.; Silvi, S.; Gorrasi, S.; Juarez-Jimenez, B.; Cordova-Salas, K.; Fenice, M. Study on the Bacterial Diversity of the Productive Marine Salterns ‘Saline di Trapani-Paceco’, Trapani, Italy. J. Environ. Prot. Ecol. 2015, 16, 1389–1396. [Google Scholar]
  11. Forster, D.; Behnke, A.; Stoeck, T. Meta-analyses of Environmental Sequence Data Identify Anoxia and Salinity as Parameters Shaping Ciliate Communities. Syst. Biodivers. 2012, 10, 277–288. [Google Scholar] [CrossRef]
  12. Filker, S.; Forster, D.; Weinisch, L.; Mora-Ruiz, M.; González, B.; Farías, M.E.; Rosselló-Móra, R.; Stoeck, T. Transition Boundaries for Protistan Species Turnover in Hypersaline Waters of Different Biogeographic Regions. Environ. Microbiol. 2017, 19, 3186–3200. [Google Scholar] [CrossRef]
  13. Lozupone, C.A.; Knight, R. Global Patterns in Bacterial Diversity. Proc. Natl. Acad. Sci. USA 2007, 104, 11436–11440. [Google Scholar] [CrossRef] [Green Version]
  14. Oren, A. Microscopic Examination of Microbial Communities Along a Salinity Gradient in Saltern Evaporation Ponds: A ‘Halophilic Safari’. In Adaptation to Life at High Salt Concentrations in Archaea, Bacteria, and Eukarya, 1st ed.; Gunde-Cimerman, N., Oren, A., Plemenitaš, A., Eds.; Springer: Dordrecht, The Netherlands, 2005; Volume 9, pp. 41–57. ISBN 978-1-4020-3632-3. [Google Scholar]
  15. Salgaonkar, B.B.; Mani, K.; Bragança, J.M. Accumulation of Polyhydroxyalkanoates by Halophilic Archaea Isolated from Traditional Solar Salterns of India. Extremophiles 2013, 17, 787–795. [Google Scholar] [CrossRef] [PubMed]
  16. Barghini, P.; Pasqualetti, M.; Gorrasi, S.; Fenice, M. Study of Bacterial Diversity of a Saltern Crystallisation Pond (‘Saline di Tarquinia’, Italy) and Its Correlation with Salinity Variations. J. Environ. Prot. Ecol. 2018, 19, 139–145. [Google Scholar]
  17. Benlloch, S.; López-López, A.; Casamayor, E.O.; Øvreås, L.; Goddard, V.; Daae, F.L.; Smerdon, G.; Massana, R.; Joint, I.; Thingstad, F.; et al. Prokaryotic Genetic Diversity Throughout the Salinity Gradient of a Coastal Solar Saltern. Environ. Microbiol. 2002, 4, 349–360. [Google Scholar] [CrossRef]
  18. Park, S.J.; Kang, C.H.; Rhee, S.K. Characterization of the Microbial Diversity in a Korean Solar Saltern by 16S rRNA Gene Analysis. J. Microbiol. Biotechnol. 2006, 16, 1640–1645. [Google Scholar]
  19. Baati, H.; Guermazi, S.; Amdouni, R.; Gharsallah, N.; Sghir, A.; Ammar, E. Prokaryotic Diversity of a Tunisian Multipond Solar Saltern. Extremophiles 2008, 12, 505–518. [Google Scholar] [CrossRef]
  20. Tsiamis, G.; Katsaveli, K.; Ntougias, S.; Kyrpides, N.; Andersen, G.; Piceno, Y.; Bourtzis, K. Prokaryotic Community Profiles at Different Operational Stages of a Greek Solar Saltern. Res. Microbiol. 2008, 159, 609–627. [Google Scholar] [CrossRef] [PubMed]
  21. Trigui, H.; Masmoudi, S.; Brochier-Armanet, C.; Barani, A.; Grégori, G.; Denis, M.; Dukan, S.; Maalej, S. Characterization of Heterotrophic Prokaryote Subgroups in the Sfax Coastal Solar Salterns by Combining Flow Cytometry Cell Sorting and Phylogenetic Analysis. Extremophiles 2011, 15, 347–358. [Google Scholar] [CrossRef] [PubMed] [Green Version]
  22. Boujelben, I.; Gomariz, M.; Martínez-García, M.; Santos, F.; Peña, A.; López, C.; Antón, J.; Maalej, S. Spatial and Seasonal Prokaryotic Community Dynamics in Ponds of Increasing Salinity of Sfax Solar Saltern in Tunisia. Antonie Van Leeuwenhoek 2012, 101, 845–857. [Google Scholar] [CrossRef] [PubMed]
  23. Dillon, J.G.; Carlin, M.; Gutierrez, A.; Nguyen, V.; McLain, N. Patterns of Microbial Diversity Along a Salinity Gradient in the Guerrero Negro Solar Saltern, Baja CA Sur, Mexico. Front. Microbiol. 2013, 4, 399. [Google Scholar] [CrossRef] [Green Version]
  24. Gomariz, M.; Martínez-García, M.; Santos, F.; Rodriguez, F.; Capella-Gutiérrez, S.; Gabaldon, T.; Rosselló-Móra, R.; Meseguer, I.; Antón, J. From Community Approaches to Single-Cell Genomics: The Discovery of Ubiquitous Hyperhalophilic Bacteroidetes Generalists. ISME J. 2015, 9, 16–31. [Google Scholar] [CrossRef]
  25. Mutlu, M.B.; Güven, K. Bacterial Diversity in Çamaltı Saltern, Turkey. Pol. J. Microbiol. 2015, 64, 37–45. [Google Scholar] [CrossRef]
  26. Zhang, J.; Ma, G.; Deng, Y.; Dong, J.; Van Stappen, G.; Sui, L. Bacterial Diversity in Bohai Bay Solar Saltworks, China. Curr. Microbiol. 2016, 72, 55–63. [Google Scholar] [CrossRef]
  27. Kambourova, M.; Tomova, I.; Boyadzhieva, I.; Radchenkova, N.; Vasileva-Tonkova, E. Phylogenetic Analysis of the Bacterial Community in a Crystallizer Pond, Pomorie Salterns, Bulgaria. Biotechnol. Biotechnol. Equip. 2017, 31, 325–332. [Google Scholar] [CrossRef] [Green Version]
  28. Ghai, R.; Pašić, L.; Fernández, A.B.; Martin-Cuadrado, A.B.; Mizuno, C.M.; McMahon, K.D.; Papke, R.T.; Stepanauskas, R.; Rodriguez-Brito, B.; Rohwer, F.; et al. New Abundant Microbial Groups in Aquatic Hypersaline Environments. Sci. Rep. 2011, 1, 135. [Google Scholar] [CrossRef]
  29. Fernández, A.B.; Ghai, R.; Martin-Cuadrado, A.B.; Sanchez-Porro, C.; Rodriguez-Valera, F.; Ventosa, A. Metagenome Sequencing of Prokaryotic Microbiota from Two Hypersaline Ponds of a Marine Saltern in Santa Pola, Spain. Genome. Announc. 2013, 1. [Google Scholar] [CrossRef] [Green Version]
  30. Fernández, A.B.; León, M.J.; Vera, B.; Sánchez-Porro, C.; Ventosa, A. Metagenomic Sequence of Prokaryotic Microbiota from an Intermediate-salinity Pond of a Saltern in Isla Cristina, Spain. Genome. Announc. 2014, 2, 1–2. [Google Scholar] [CrossRef] [Green Version]
  31. Fernández, A.B.; Ghai, R.; Martin-Cuadrado, A.B.; Sanchez-Porro, C.; Rodriguez-Valera, F.; Ventosa, A. Prokaryotic Taxonomic and Metabolic Diversity of an Intermediate Salinity Hypersaline Habitat Assessed by Metagenomics. FEMS Microbiol. Ecol. 2014, 88, 623–635. [Google Scholar] [CrossRef] [PubMed] [Green Version]
  32. Plominsky, A.M.; Delherbe, N.; Ugalde, J.A.; Allen, E.E.; Blanchet, M.; Ikeda, P.; Santibanez, F.; Hanselmann, K.; Ulloa, O.; De la Iglesia, R.; et al. Metagenome Sequencing of the Microbial Community of a Solar Saltern Crystallizer Pond at Cáhuil Lagoon, Chile. Genome. Announc. 2014, 2. [Google Scholar] [CrossRef] [PubMed] [Green Version]
  33. Plominsky, M.A.; Henríquez, C.A.; Delherbe, N.; Podell, S.; Ramirez, S.; Ugalde, J.A.; Santibañez, F.; van den Engh, G.; Hanselmann, K.; Ulloa, O.; et al. Distinctive Archaeal Composition of an Artisanal Crystallizer Pond and Functional Insights into Salt-saturated Hypersaline Environment Adaptation. Front. Microbiol. 2018, 9, 1800. [Google Scholar] [CrossRef] [Green Version]
  34. Leoni, C.; Volpicella, M.; Fosso, B.; Manzari, C.; Piancone, E.; Dileo, M.C.; Arcadi, E.; Yakimov, M.; Pesol, G.; Ceci, L.R. A Differential Metabarcoding Approach to Describe Taxonomy Profiles of Bacteria and Archaea in the Saltern of Margherita di Savoia (Italy). Microorganisms 2020, 8, 936. [Google Scholar] [CrossRef] [PubMed]
  35. John, J.; Siva, V.; Kumari, R.; Arya, A.; Kumar, A. Unveiling Cultivable and Uncultivable Halophilic Bacteria Inhabiting Marakkanam Saltpan, India and Their Potential for Biotechnological Applications. Geomicrobiol. J. 2020, 37, 691–701. [Google Scholar] [CrossRef]
  36. Fernández, A.B.; Vera-Gargallo, B.; Sánchez-Porro, C.; Ghai, R.; Papke, R.T.; Rodriguez-Valera, F.; Ventosa, A. Comparison of Prokaryotic Community Structure from Mediterranean and Atlantic Saltern Concentrator Ponds by a Metagenomic Approach. Front. Microbiol. 2014, 5, 1–12. [Google Scholar] [CrossRef] [PubMed]
  37. Gómez-Villegas, P.; Vigara, J.; León, R. Characterization of the Microbial Population Inhabiting a Solar Saltern Pond of the Odiel Marshlands (SW Spain). Mar. Drugs. 2018, 16, 332. [Google Scholar] [CrossRef] [Green Version]
  38. Mora-Ruiz, M.D.R.; Cifuentes, A.; Font-Verdera, F.; Pérez-Fernández, C.; Farias, M.E.; González, B.; Orfila, A.; Rosselló-Móra, R. Biogeographical Patterns of Bacterial and Archaeal Communities from Distant Hypersaline Environments. Syst. Appl. Microbiol. 2018, 41, 139–150. [Google Scholar] [CrossRef]
  39. Mani, K.; Taib, N.; Hugoni, M.; Bronner, G.; Bragança, J.M.; Debroas, D. Transient Dynamics of Archaea and Bacteria in Sediments and Brine Across a Salinity Gradient in a Solar Saltern of Goa, India. Front. Microbiol. 2020, 11, 1891. [Google Scholar] [CrossRef]
  40. Alfinito, S.; Iberite, M.; Fumanti, B. The Algal Microflora of the Salt Works of Tarquinia (Italy). Hydrobiology 1990, 203, 137–146. [Google Scholar] [CrossRef]
  41. Frondoni, R.; Iberite, M. The Halophile Vegetation of the Sedimentary Coast of Lazio (Central Tyrrhenian District, Italy). Plant. Biosyst. 2002, 136, 49–67. [Google Scholar] [CrossRef]
  42. Angeletti, D.; Cimmaruta, R.; Nascetti, G. Genetic Diversity of the Killifish Aphanius fasciatus Paralleling the Environmental Changes of Tarquinia Salterns Habitat. Genetica 2010, 138, 1011–1021. [Google Scholar] [CrossRef]
  43. Angeletti, D.; Cimmaruta, R.; Sebbio, C.; Bellisario, B.; Carere, C.; Nascetti, G. Environmental Heterogeneity Promotes Microgeographic Genetic Divergence in the Mediterranean Killifish Aphanius fasciatus (Cyprinodontidae). Ethol. Ecol. Evol. 2017, 29, 367–386. [Google Scholar] [CrossRef]
  44. Pasqualetti, M.; Giovannini, V.; Barghini, P.; Gorrasi, S.; Fenice, M. Diversity and Ecology of Culturable Marine Fungi Associated with Posidonia ceanica Leaves and Their Epiphytic Algae Dictyota Dichotoma and Sphaerococcus Coronopifolius. Fungal Ecol. 2020, 44, 100906. [Google Scholar] [CrossRef]
  45. Bellisario, B.; Cerfolli, F.; Nascetti, G. Spatial Network Structure and Robustness of Detritus-based Communities in a Patchy Environment. Ecol. Res. 2010, 25, 813–821. [Google Scholar] [CrossRef]
  46. Bellisario, B.; Cerfolli, F.; Nascetti, G. The Interplay Between Network Structure and Functioning of Detritus-based Communities in Patchy Aquatic Environment. Aquat. Ecol. 2012, 46, 431–441. [Google Scholar] [CrossRef]
  47. Bellisario, B.; Carere, C.; Cerfolli, F.; Angeletti, D.; Nascetti, G.; Cimmaruta, R. Infaunal Macrobenthic Community Dynamics in a Manipulated Hyperhaline Ecosystem: A Long-term Study. Aquat. Biosyst. 2013, 9, 20. [Google Scholar] [CrossRef] [Green Version]
  48. Cerfolli, F.; Bellisario, B.; Battisti, C. Detritus-based Assemblage Responses Under Salinity Stress Conditions in a Disused Aquatic Artificial Ecosystem. Aquat. Biosyst. 2013, 9, 22. [Google Scholar] [CrossRef] [PubMed] [Green Version]
  49. Pasqualetti, M.; Bernini, R.; Carletti, L.; Crisante, F.; Tempesta, S. Salinity and Nitrate Concentration on the Growth and Carotenoids Accumulation in a Strain of Dunaliella salina (Chlorophyta) Cultivated Under Laboratory Conditions. Transit. Water. Bull. 2010, 4, 94–104. [Google Scholar] [CrossRef]
  50. Tempesta, S.; Paoletti, M.; Pasqualetti, M. Morphological and Molecular Identification of a Strain of the Unicellular Green Alga Dunaliella sp. Isolated from Tarquinia Salterns. Transit. Water. Bull. 2010, 4, 60–70. [Google Scholar] [CrossRef]
  51. Gorrasi, S.; Pasqualetti, M.; Franzetti, A.; Pittino, F.; Fenice, M. Vibrio Communities Along a Salinity Gradient Within a Marine Salterns Hypersaline Environment (Saline di Tarquinia, Italy). Environ. Microbiol. 2020, 22, 4356–4366. [Google Scholar] [CrossRef]
  52. Rodriguez-Brito, B.; Li, L.; Wegley, L.; Furlan, M.; Angly, F.; Breitbart, M.; Buchanan, J.; Desnues, C.; Dinsdale, E.; Edwards, R.; et al. Viral and Microbial Community Dynamics in Four Aquatic Environments. ISME J. 2010, 4, 739. [Google Scholar] [CrossRef]
  53. Kimbrel, J.A.; Ballor, N.; Wu, Y.W.; David, M.M.; Hazen, T.C.; Simmons, B.A.; Singer, S.W.; Jansson, J.K. Microbial Community Structure and Functional Potential Along a Hypersaline Gradient. Front. Microbiol. 2018, 9, 1492. [Google Scholar] [CrossRef] [PubMed]
  54. Pašić, L.; Rodriguez-Mueller, B.; Martin-Cuadrado, A.B.; Mira, A.; Rohwer, F.; Rodriguez-Valera, F. Metagenomic Islands of Hyperhalophiles: The Case of Salinibacter ruber. BMC Genom. 2009, 10, 570. [Google Scholar] [CrossRef] [Green Version]
  55. Zhaxybayeva, O.; Stepanauskas, R.; Mohan, N.R.; Papke, R.T. Cell Sorting Analysis of Geographically Separated Hypersaline Environments. Extremophiles 2013, 17, 265–275. [Google Scholar] [CrossRef] [PubMed]
  56. Couto-Rodríguez, R.L.; Montalvo-Rodríguez, R. Temporal Analysis of the Microbial Community from the Crystallizer Ponds in Cabo Rojo, Puerto Rico, Using Metagenomics. Genes 2019, 10, 422. [Google Scholar] [CrossRef] [Green Version]
  57. Ramos-Barbero, M.D.; Martin-Cuadrado, A.B.; Viver, T.; Santos, F.; Martinez-Garcia, M.; Antón, J. Recovering Microbial Genomes from Metagenomes in Hypersaline Environments: The Good, the Bad and the Ugly. Syst. Appl. Microbiol. 2019, 42, 30–40. [Google Scholar] [CrossRef]
  58. Jang, G.I.; Cho, Y.; Cho, B.C. Pontimonas salivibrio gen. nov., sp. nov., A New Member of the Family Microbacteriaceae Isolated from a Seawater Reservoir of a Solar Saltern. Int. J. Syst. Evol. Microbiol. 2013, 63, 2124–2131. [Google Scholar] [CrossRef]
  59. Cho, B.C.; Jang, G.I.; Hwang, C.Y. Pontimonas. In Bergey’s Manual of Systematics of Archaea and Bacteria; Whitman, W.E.B., Ed.; John Wiley & Sons: New York, NY, USA, 2015; pp. 1–5. ISBN 9781118960608. [Google Scholar]
  60. Cho, B.C.; Hardies, S.C.; Jang, G.I.; Hwang, C.Y. Complete Genome of Streamlined Marine Actinobacterium Pontimonas salivibrio Strain CL-TW6 T Adapted to Coastal Planktonic Lifestyle. BMC Genom. 2018, 19, 625. [Google Scholar] [CrossRef] [PubMed] [Green Version]
  61. Selivanova, E.A.; Poshvina, D.V.; Khlopko, Y.A.; Gogoleva, N.E.; Plotnikov, A.O. Diversity of Prokaryotes in Planktonic Communities of Saline Sol-Iletsk Lakes (Orenburg Oblast, Russia). Microbiology 2018, 87, 569–582. [Google Scholar] [CrossRef]
  62. Shurigin, V.; Hakobyan, A.; Panosyan, H.; Egamberdieva, D.; Davranov, K.; Birkeland, N.K. A Glimpse of the Prokaryotic Diversity of the Large Aral Sea Reveals Novel Extremophilic Bacterial and Archaeal Groups. Microbiol. Open 2019, 8, e00850. [Google Scholar] [CrossRef] [PubMed] [Green Version]
  63. Sanden, G.N.; Weyant, R.S. Bordetella. In Bergey’s Manual of Systematics of Archaea and Bacteria; Whitman, W.E.B., Ed.; John Wiley & Sons: New York, NY, USA, 2015; pp. 1–20. ISBN 9781118960608. [Google Scholar]
  64. Soumana, I.H.; Linz, B.; Harvill, E.T. Environmental Origin of the Genus Bordetella. Front. Microbiol. 2017, 8, 28. [Google Scholar] [CrossRef]
  65. Badamchi, A.; Papizadeh, M. Comparative Phylogeny of the Genus Bordetella Using Sequence Analysis of 16S rRNA and ompA Genes. J. Med. Bacteriol. 2017, 6, 1–13. [Google Scholar]
  66. Linz, B.; Ma, L.; Rivera, I.; Harvill, E.T. Genotypic and Phenotypic Adaptation of Pathogens: Lesson from the Genus: Bordetella. Curr. Opin. Infect. Dis. 2019, 32, 223–230. [Google Scholar] [CrossRef]
  67. Taylor-Mulneix, D.L.; Soumana, I.H.; Linz, B.; Harvill, E.T. Evolution of Bordetellae from Environmental Microbes to Human Respiratory Pathogens: Amoebae as a Missing Link. Front. Cell. Infect. Microbiol. 2017, 7, 510. [Google Scholar] [CrossRef]
  68. Kersters, K.; Hinz, K.H.; Hertle, A.; Segers, P.; Lievens, A.; Siegmann, O.; De Ley, J. Bordetella avium sp. nov., Isolated from the Respiratory Tracts of Turkeys and Other Birds. Int. J. Syst. Evol. Microbiol. 1984, 34, 56–70. [Google Scholar] [CrossRef] [Green Version]
  69. Raffel, T.R.; Register, K.B.; Marks, S.A.; Temple, L. Prevalence of Bordetella avium Infection in Selected Wild and Domesticated Birds in the Eastern USA. J. Wildl. Dis. 2002, 38, 40–46. [Google Scholar] [CrossRef] [Green Version]
  70. Stenzel, T.; Pestka, D.; Tykałowski, B.; Śmiałek, M.; Koncicki, A.; Bancerz-Kisiel, A. Detection of Bordetella avium by TaqMan Real-time PCR in Tracheal Swabs from Wildlife birds. Pol. J. Vet. Sci. 2017, 20, 31–36. [Google Scholar] [CrossRef] [Green Version]
  71. Lanzuisi, E. Waterbirds of a Mediterranean Wetland, Tarquinia Salinas. Regional and Local Environmental Variables and Management Prescriptions. Ph.D. Thesis, Università degli Studi della Tuscia, Viterbo, Italy, 2009. [Google Scholar]
  72. Biondi, M. Check-list Degli Uccelli della RNPA Saline di Tarquinia (VT) Aggiornata al Maggio. In La Riserva Naturale Statale “Saline di Tarquinia”, 1st ed.; Colletti, L., Ed.; Corpo Forestale dello Stato, Ufficio territoriale per la Biodiversità di Roma: Roma, Italy, 2014; pp. 119–132. ISBN 978-88-909200-7-3. [Google Scholar]
  73. López-Pérez, M.; Ghai, R.; Leon, M.J.; Rodríguez-Olmos, Á.; Copa-Patiño, J.L.; Soliveri, J.; Sanchez-Porro, C.; Ventosa, A.; Rodriguez-Valera, F. Genomes of “Spiribacter”, a Streamlined, Successful Halophilic Bacterium. BMC Genom. 2013, 14, 787. [Google Scholar] [CrossRef] [Green Version]
  74. León, M.J.; Fernández, A.B.; Ghai, R.; Sánchez-Porro, C.; Rodriguez-Valera, F.; Ventosa, A. From Metagenomics to Pure Culture: Isolation and Characterization of the Moderately Halophilic Bacterium Spiribacter salinus gen. nov., sp. nov. Appl. Environ. Microbiol. 2014, 80, 3850–3857. [Google Scholar] [CrossRef] [Green Version]
  75. Antón, J.; Rosselló-Mora, R.; Rodríguez-Valera, F.; Amann, R. Extremely Halophilic Bacteria in Crystallizer Ponds from Solar Salterns. Appl. Environ. Microbiol. 2000, 66, 3052–3057. [Google Scholar] [CrossRef] [Green Version]
  76. Antón, J.; Oren, A.; Benlloch, S.; Rodríguez-Valera, F.; Amann, R.; Rosselló-Mora, R. Salinibacter ruber gen. nov., sp. nov., A Novel, Extremely Halophilic Member of the Bacteria from Saltern Crystallizer Ponds. Int. J. Syst. Evol. Microbiol. 2002, 52, 485–491. [Google Scholar] [CrossRef]
  77. León, M.J.; Aldeguer-Riquelme, B.; Antón, J.; Sánchez-Porro, C.; Ventosa, A. Spiribacter aquaticus sp. nov., A Novel Member of the Genus Spiribacter Isolated from a Saltern. Int. J. Syst. Evol. Microbiol. 2017, 67, 2947–2952. [Google Scholar] [CrossRef]
  78. Gorrasi, S.; Pesciaroli, C.; Barghini, P.; Pasqualetti, M.; Giovannini, V.; Fenice, M. Metagenetic Profiling of the Bacterial Communities of an Intertidal Pool in Kandalaksha Bay (White Sea, Russia). J. Environ. Prot. Ecol. 2019, 20, 1317–1324. [Google Scholar]
  79. Rice, E.W.; Baird, R.B.; Eaton, A.D.; Clesceri, L.S. Standard Methods for the Examination of Water and Wastewater, 22nd ed.; American Public Health Association: Washington, DC, USA, 2012; ISBN 9780875530130. [Google Scholar]
  80. Centro Funzionale Regionale, Regione Lazio, Annali. Available online: http://www.idrografico.regione.lazio.it/annali/index.htm (accessed on 31 August 2020).
  81. Pesciaroli, C.; Rodelas, B.; Juarez-Jiménez, B.; Barghini, P.; Fenice, M. Bacterial Community Structure of a Coastal Area in Kandalaksha Bay, White Sea, Russia: Possible Relation to Tidal Hydrodynamics. Ann. Microbiol. 2015, 65, 443–453. [Google Scholar] [CrossRef]
  82. Gorrasi, S.; Pesciaroli, C.; Barghini, P.; Pasqualetti, M.; Fenice, M. Structure and Diversity of the Bacterial Community of an Arctic Estuarine System (Kandalaksha Bay) Subject to Intense Tidal Currents. J. Mar. Syst. 2019, 196, 77–85. [Google Scholar] [CrossRef]
  83. Gandolfi, I.; Canedoli, C.; Imperato, V.; Tagliaferri, I.; Gkorezis, P.; Vangronsveld, J.; Padoa Schioppa, E.; Papacchini, M.; Bestetti, G.; Franzetti, A. Diversity and Hydrocarbon-degrading Potential of Epiphytic Microbial Communities on Platanus x acerifolia Leaves in an Urban Area. Environ. Pollut. 2017, 220, 650–658. [Google Scholar] [CrossRef] [PubMed]
  84. Pittino, F.; Maglio, M.; Gandolfi, I.; Azzoni, R.S.; Diolaiuti, G.; Ambrosini, R.; Franzetti, A. Bacterial Communities of Cryoconite Holes of a Temperate Alpine Glacier Show Both Seasonal Trends and Year-to-year Variability. Ann. Glaciol. 2018, 59, 1–9. [Google Scholar] [CrossRef] [Green Version]
  85. Huber, J.A.; Welch, D.B.M.; Morrison, H.G.; Huse, S.M.; Neal, P.R.; Butterfield, D.A.; Sogin, M.L. Microbial Population Structures in the Deep Marine Biosphere. Science 2007, 318, 97–100. [Google Scholar] [CrossRef] [PubMed] [Green Version]
  86. Wang, Y.; Qian, P.Y. Conservative Fragments in Bacterial 16S rRNA Genes and Primer Design for 16S Ribosomal DNA Amplicons in Metagenomic Studies. PLoS ONE 2009, 4, e7401. [Google Scholar] [CrossRef] [PubMed] [Green Version]
  87. Edgar, R.C. UPARSE: Highly Accurate OTU Sequences from Microbial Amplicon Reads. Nat. Methods 2013, 10, 996–998. [Google Scholar] [CrossRef] [PubMed]
  88. Wang, Q.; Garrity, G.M.; Tiedje, J.M.; Cole, J.R. Naive Bayesian Classifier for Rapid Assignment of rRNA Sequences into the New Bacterial Taxonomy. Appl. Environ. Microbiol. 2007, 73, 5261–5267. [Google Scholar] [CrossRef] [Green Version]
  89. Claesson, M.J.; O’Sullivan, O.; Wang, O.; Nikkilä, J.; Marchesi, J.R.; Smidt, H.; de Vos, W.M.; Ross, R.P.; O’Toole, P.W. Comparative Analysis of Pyrosequencing and a Phylogenetic Microarray for Exploring Microbial Community Structures in the Human Distal Intestine. PLoS ONE 2009, 4, e6669. [Google Scholar] [CrossRef] [Green Version]
  90. Good, I.J. The Population Frequencies of Species and the Estimation of Population Parameters. Biometrika 1953, 40, 237–264. [Google Scholar] [CrossRef]
  91. Shannon, C.E. A Mathematical Theory of Communication. Bell. Sys. Tech. J. 1948, 27, 379–423. [Google Scholar] [CrossRef] [Green Version]
  92. Gini, C. Variabilità e Mutabilità: Contributo allo Studio delle Distribuzioni e delle Relazioni Statistiche; Tipografia di Paolo Cuppini: Bologna, Italy, 1912. [Google Scholar]
  93. Wittebolle, L.; Marzorati, M.; Clement, L.; Balloi, A.; Daffonchio, D.; Heylen, K.; De Vos, P.; Verstraete, W.; Boon, N. Initial Community Evenness Favours Functionality under Selective Stress. Nature 2009, 458, 623–626. [Google Scholar] [CrossRef] [PubMed]
  94. McMurdie, P.J.; Holmes, S. Waste Not, Want Not: Why Rarefying Microbiome Data is Inadmissible. PLoS Comput. Biol. 2014, 10, e1003531. [Google Scholar] [CrossRef] [Green Version]
  95. Legendre, P.; Legendre, L. Numerical Ecology, 3rd ed.; Elsevier: Amsterdam, The Netherlands, 2012; ISBN 9780444538680. [Google Scholar]
  96. Zuur, A.F.; Hilbe, J.M.; Ieno, E.N. A Beginner’s Guide to GLM and GLMM with R: A Frequentist and Bayesian Perspective for Ecologists, 2nd ed.; Highland Statistics L.t.d.: Newburgh, UK, 2015; ISBN 9780957174139. [Google Scholar]
  97. Benjamini, Y.; Yekutieli, D. The Control of the False Discovery Rate in Multiple Testing under Dependency. Ann. Stat. 2001, 29, 1165–1188. [Google Scholar] [CrossRef]
Figure 1. Bacterial composition of the Saline di Tarquinia (ST) samples at the Phylum-level. Distribution of the major phyla (Ra ≥ 1% in at least one sample); phyla with Ra < 1% were gathered in “Others”.
Molecules 26 01338 g001
Figure 2. Bacterial composition of the ST samples at the Genus-level. Distribution of the major genera (Ra ≥ 1% in at least one sample); genera with Ra < 1% were gathered in “Others”.
Molecules 26 01338 g002
Figure 3. CCA ordination biplot showing samples according to the parameters driving the bacterial community structure. Arrow represents salinity. Variance explained by the two axes and axes significance (***p < 0.001) is reported. Line contour encloses samples collected from the same sampling site (green line: sea samples; red line: P5 samples; purple line: P24 samples; dark cyan line = P37 samples).
Molecules 26 01338 g003
Figure 4. Box-whisker plot (Generalised Linear Model (GLM) analysis) showing abundance variation of Pontimonas (A), Bordetella (B), GpVII (C) and Spiribacter (D) across the sampling sites. The thick lines represent the median, boxes’ upper and lower limits indicate the 25th and the 75th percentiles respectively, whiskers indicate the data that go beyond the 5th percentile (lower whisker) and the 75th percentile (upper whisker), and dots represent the outliers. Different letters indicate differences between the mean values of different groups.
Molecules 26 01338 g004
Figure 5. GLM plots showing seasonal variation in abundance of Pontimonas (A), Marivita (B), Bordetella (C), GpVII (D) and Spiribacter (E).
Molecules 26 01338 g005
Figure 6. GLM plot showing variation in abundance of Bordetella in relation to the salinity.
Molecules 26 01338 g006
Figure 7. Box-whisker plot (GLM analysis) showing abundance variation of Pontimonas (A), Marivita (B) and GpVII (C) in relation to the sampling years. The thick lines represent the median, boxes’ upper and lower limits indicate the 25th and the 75th percentiles respectively, whiskers indicate the data that go beyond the 5th percentile (lower whisker) and the 75th percentile (upper whisker), and dots represent the outliers. Different letters indicate differences between the mean values of different groups.
Molecules 26 01338 g007
Figure 8. Detailed map of the “Saline di Tarquinia” (Viterbo, Italy) marine salterns with indication of the sampling sites (Sea, P5, P24 and P37). Map was generated using Google Earth Pro version 7.3.1 and graphically edited.
Molecules 26 01338 g008
Table 1. Canonical Correspondence Analysis (CCA) of variation of the operational taxonomic units (outs) abundance for sea, P5, P24 and P37 according to the parameters.
VariabledfVarianceFp
sin(Month) × cos(Month)10.1262.10490.001
Year20.3132.60930.001
Salinity10.0981.63180.027
Chlorophyll pigments10.07111.18300.255
sin(Month) × Sampling site30.34891.9360.001
cos(Month) × Sampling site30.34791.92090.001
Residuals794.745
F10,79 = 3.254, p = 0.001, adjusted R2 = 0.275
Publisher’s Note: MDPI stays neutral with regard to jurisdictional claims in published maps and institutional affiliations.

