
Computational Study of the Electron Spectra of Vapor-Phase Indole and Four Azaindoles

Department of Chemistry, University of British Columbia, 2016 Main Mall, Vancouver, BC V6T 1Z1, Canada
Molecules 2021, 26(7), 1947; https://0-doi-org.brum.beds.ac.uk/10.3390/molecules26071947
Submission received: 20 January 2021
/
Revised: 10 March 2021
/
Accepted: 11 March 2021
/
Published: 30 March 2021
(This article belongs to the Special Issue The Chemistry of Nitrocompounds)
Abstract
:After geometry optimization, the electron spectra of indole and four azaindoles are calculated by density functional theory. Available experimental photoemission and excitation data for indole and 7-azaindole are used to compare with the theoretical values. The results for the other azaindoles are presented as predictions to help the interpretation of experimental spectra when they become available.
1. Introduction
Indole is a bicyclic aromatic compound consisting of a six-membered benzene ring fused to a five-membered pyrrole ring. Azaindoles are analogous molecules in which the benzene ring is replaced by a pyridine ring. Indole and azaindoles are involved in many biochemical reactions, as evidenced by papers, reviews [1,2,3,4], and books [5,6], in addition to popular internet sources, such as Wikipedia and Encyclopedia Britanica. While indole and 7-azaindole have been studied by several workers [7,8,9,10,11,12,13,14,15,16,17,18,19,20,21,22,23,24,25,26,27,28,29,30,31,32,33,34], the other azaindoles have received much less attention. The vibrations of indole were investigated by Collier [9], and by Walden and Wheeler [10]. The experimental rotational constants reported by Suenam et al. [11], Caminati and Bernardo [12], Gruet et al. [13], Nesvadba et al. [14], and by Vavra et al. [15] are more useful for the present study in guiding our choice of method of geometry optimization. The published data of UV absorption spectra [16,17,18,19,20,21,22,23,24,25,26,27,28,29,30,31,32,33,34] often covered different excited states. Serrano-Andres and Roos [22] used results from multi-configuration second-order perturbation theory for complete active space (CASPT2) to compare with the various observations. Similarly, Serrano-Andres and coworkers [33] used CASPT2 to study the excitations of 7-azaindole. We shall bring the comparison more up to date. Finally, the more recent experimental photoelectron spectra of indole [35] will be used to confirm the theoretical methods based on density functional theory (DFT) we have developed and tested.
2. Methods
Geometry optimization of indole and the four azaindoles are performed using the Gaussian package [36]. The results are summarized in Table 1. The optimized Cartesian coordinates of the five molecules can be found in the Supplementary Materials.
In our earlier studies, we used molecular geometry determined experimentally when available; otherwise, the Hartree–Fock method was often used for optimization; and MP2 and CCSD were also used occasionally. Typical dependence of calculated core-electron binding energies (CEBEs) on molecular geometry is shown in Appendix A. The molecule formaldehyde is rather rigid, whereas hydrogen peroxide is quite flexible. The results presented in Table A1 and Table A2 indicate that the dependence of CEBEs on geometry is quite small in both cases. The results of geometry optimization by B3LYP/6-31G(d) agree with the experimental rotational constants of indole and 7-azaindole so well that we decided to use B3LYP/6-31G(d) for the other three azaindoles as well.
The methods we use for computation of electron spectra have been presented several times in previous studies. After geometry optimization, we use the Amsterdam Density Functional (ADF) package [37] to calculate the various electron spectra. For vertical ionization energies (VIEs) of valence electrons, we used Method (a) = ΔPBE0(SAOP)/et-pVQZ [38], which means the energy difference calculated with the parameter-free Perdew–Burke–Ernzerhof exchange-correlation functional using the electron density obtained with the exchange-correlation potential (Vxc) known as statistical averaging of orbital potentials (SAOP). The efficient even-tempered basis set of polarized valence quadruple-zeta (et-pVQZ) Slater-type orbitals [39] is available in the ADF package. This method has been used in many molecules [40,41,42,43,44,45,46,47,48,49,50]. The results are summarized in Table 2.
The AADs are somewhat arbitrary because they depend on the number of VIEs included. Moreover, some earlier experimental VIEs may be in error by as much as 0.1 eV because of calibration and/or overlapping of bands. In any case, the AADs are less than 0.2 eV for many molecules. Alternative methods giving reliable VIEs are symmetry-adapted cluster configuration interaction (SAC-CI) of Nakatsuji [51] and renormalized partial third-order (P3+) method of Ortiz [52]. Both methods are available in recent versions of the Gaussian package. However, SAC-CI is computationally demanding and does not seem to be preferred by photoelectron spectroscopists. On the other hand, P3+ is limited to outer-valence electrons only, whereas our Method (a) above can handle inner-valence electrons with little or no difficulties.
For reliable prediction of CEBEs, there are several points to consider: (1) the electrons of the core-hole cation are attracted by a shielded nucleus very different from that of the neutral parent, so that the basis set must be flexible enough to account for the difference. Usual basis sets of Gaussian-type orbitals (GTOs) contain a single contraction for the 1s orbital and is not flexible. In our earlier study using contracted GTOs [53], we used exponent scaling factors to solve the problem, in addition to testing the use of correlation-consistent core-valence basis sets. More recently, Bellafont et al. [54,55,56,57,58] used augmented Partridge basis sets of uncontracted GTOs to avoid the difficulty. On the other hand, the problem does not exist when we use Slater-type orbitals (STOs) in the ADF program. More often than not, we use the efficient et-pVQZ basis set [39], which contains double-zeta core basis functions in addition to effectively polarized quadruple-zeta basis functions for valence electrons.
(2) For the prediction of CEBEs, relativistic effects influence the accuracy of the calculated nonrelativistic results. In 1995 [59], we decided to use the formula (1):
to estimate the small relativistic correction to the calculated nonrelativistic CEBEs of C to F. The parameters K and N were obtained by fitting the difference between Pekeris’ accurate relativistic and nonrelativistic ionization energies of two-electron ions [60]. For both Crel and Inr in electron volts, K = 2.198 × 10⁻⁷ and N = 2.178. In 2005, Maruani et al. [61] reported results of Dirac-Fock correction to the ionization energies of atoms Li to Xe. The allometric fit for the Be to Ne series gave K = 6.55 × 10⁻⁷ and N = 2.0569. More recently, Bellafont et al. [54,55,56,57,58] also examined relativistic effects by the Dirac–Fock method on B to F atoms, with very different results. Table 3 summarizes all these efforts.
Irel = Inr + Crel, with Crel = K InrN
(3) Since the method we developed is based on DFT, there is the question of choice of functional. For CEBEs of B to F [53], we use the formula:
which means that PW86 and PW91 are used for exchange and correlation functionals, respectively. Table 4 compares our results for carbon-containing molecules with those in the resent paper from Illas’ laboratory [17] using the TPSS functional.
Method (b) = ΔPW86-PW91/et-pVQZ + Crel,
Experimental measurements of CEBEs by X-ray photoelectron spectroscopy require calibration and reported values may be off by as much as 0.1 eV. As a rule, synchrotron measurements tend to be more reliable. In any case, our AAD of 0.14 eV is remarkably small. The relativistic correction for carbon 1s ionization is 0.05 eV for our method and 0.13 eV for the method using TPSS. Whether or not we add 0.08 eV to our results, our correlation corrected results for carbon-containing molecules are definitely superior to those using the TPSS functional. Table 5 compares the CEBEs for N, O, and F, calculated by our Method (b) with the results obtained by Bellafont et al. using TPSS [56].
Two other approaches tested by Illas and coworkers do not fare any better: The popular functional B3LYP performs fairly well for CEBEs of N1s but much less well for O1s [55]. Low-order GW approximations did much worse [62].
For excitation of valence electrons, we use Method (c) = time-dependent density functional theory (TDDFT) with: Vxc = SAOP.
Basically, TD-DFT in the ADF package is a CI calculation with singly excited configuration using DFT ground-state molecular orbitals. For non-relativistic closed shell molecules, spin and symmetry are conserved. In other words, excited singlets and triplets are computed separately. Excitations to triplet states are omitted when the keyword allowed is included in the input. For highly excited states (approaching Rydberg excitations, for example), the basis set et-pVQZ can be augmented by diffuse functions specially designed for excitation studies [63]. Such an augmented set (called aug-et-pVQZ) was tested on the first 15 excited states of ten closed shell molecules, and employed in the present study. The use of TDDFT for visible/UV excitations is less well validated, partly because there are fewer experimental data available for comparison. More often than not, the observed absorption bands are the result of convolution of several close-by excitations. Some comparisons between TDDFT results and experiment have been reported [63,64].
Two minor extensions are introduced in this study. Firstly, in the early days of X-ray photoelectron spectroscopy (XPS), Gelius [65,66] estimated relative cross-sections with a simple model. Minor refinements were made by Nefedov et al. [67]. The model worked remarkably well in connection with the semiempirical HAM/3 molecular orbital method [68]. The results of using such a model HAM/3 method for indole are included in Table 9, to be compared with experimental XPS of the valence electrons when available.
The second extension is called shifted meta-Koopmans’ theorem, to be used in CEBE calculations. For valence electron ionization of organic and other small molecules, meta-Koopmans’ theorem (mKT) means using the negative of the orbital energy from Vxc = SAOP calculation to approximate the ionization energy [69]. However, mKT does not provide reliable CEBEs, although it gives quite reasonable relative CEBEs. When there are many carbon atoms, for example, in a molecule, the core-hole may be difficult to localize. In such cases, we can obtain good estimates of the CEBEs by the method of shifted mKT. The shift needed may be obtained in various ways by comparing the mKT value with that from method (b) outlined above. In this work, we select the simplest choice for the lowest CEBE for the element of interest (carbon, for example). In the present study, the shift for indole is found to be 16.67 eV. Alternative choices for the shift are the highest CEBE (for carbon for example), the average of the lowest and highest CEBEs, or the average of all the available CEBEs.
Since the non-resonant Kα X-ray emission spectra (XES) are so simple to compute [70], we calculate the predicted XES for the nitrogen cores of indole and the four azaindoles. As there are so many carbon atoms in indole and azaindoles, the X-ray emission spectra are expected to be hopeless to untangle and are therefore not calculated.
3. Results and Discussion
The results of our calculations can of course be directly compared with experimental measurements of electron spectra. Correlation of CEBEs with Hammett substitution constants [71] has been demonstrated, but is limited to aromatic substitution reactions. In addition, Thomas et al. [72], suggested that CEBEs are related to chemical properties such as electronegativity, acidity, basicity, proton affinities, reactivity, and regioselectivity of reactions. For example, Saethre et al. [73] found statistical correlation between CEBEs and activation energies and regioselectivity for the Markovnikov addition of the elctrophiles HX (X = F, Cl, Br, and I) to the alkenes ethene, propene and 2-methylpropene. However, comparison with general experimental reactivity is much more difficult. In general, reactivity is affected by a combination of several physical properties of the reactants. For example, it was suggested that the biological activity of non-steroidal anti-inflammatory drugs (NSAIDs) depends on a synergistic collective action of several factors, including the ionization energies of molecular orbital localized mainly on the group responsible for bridging to the receptor [30].
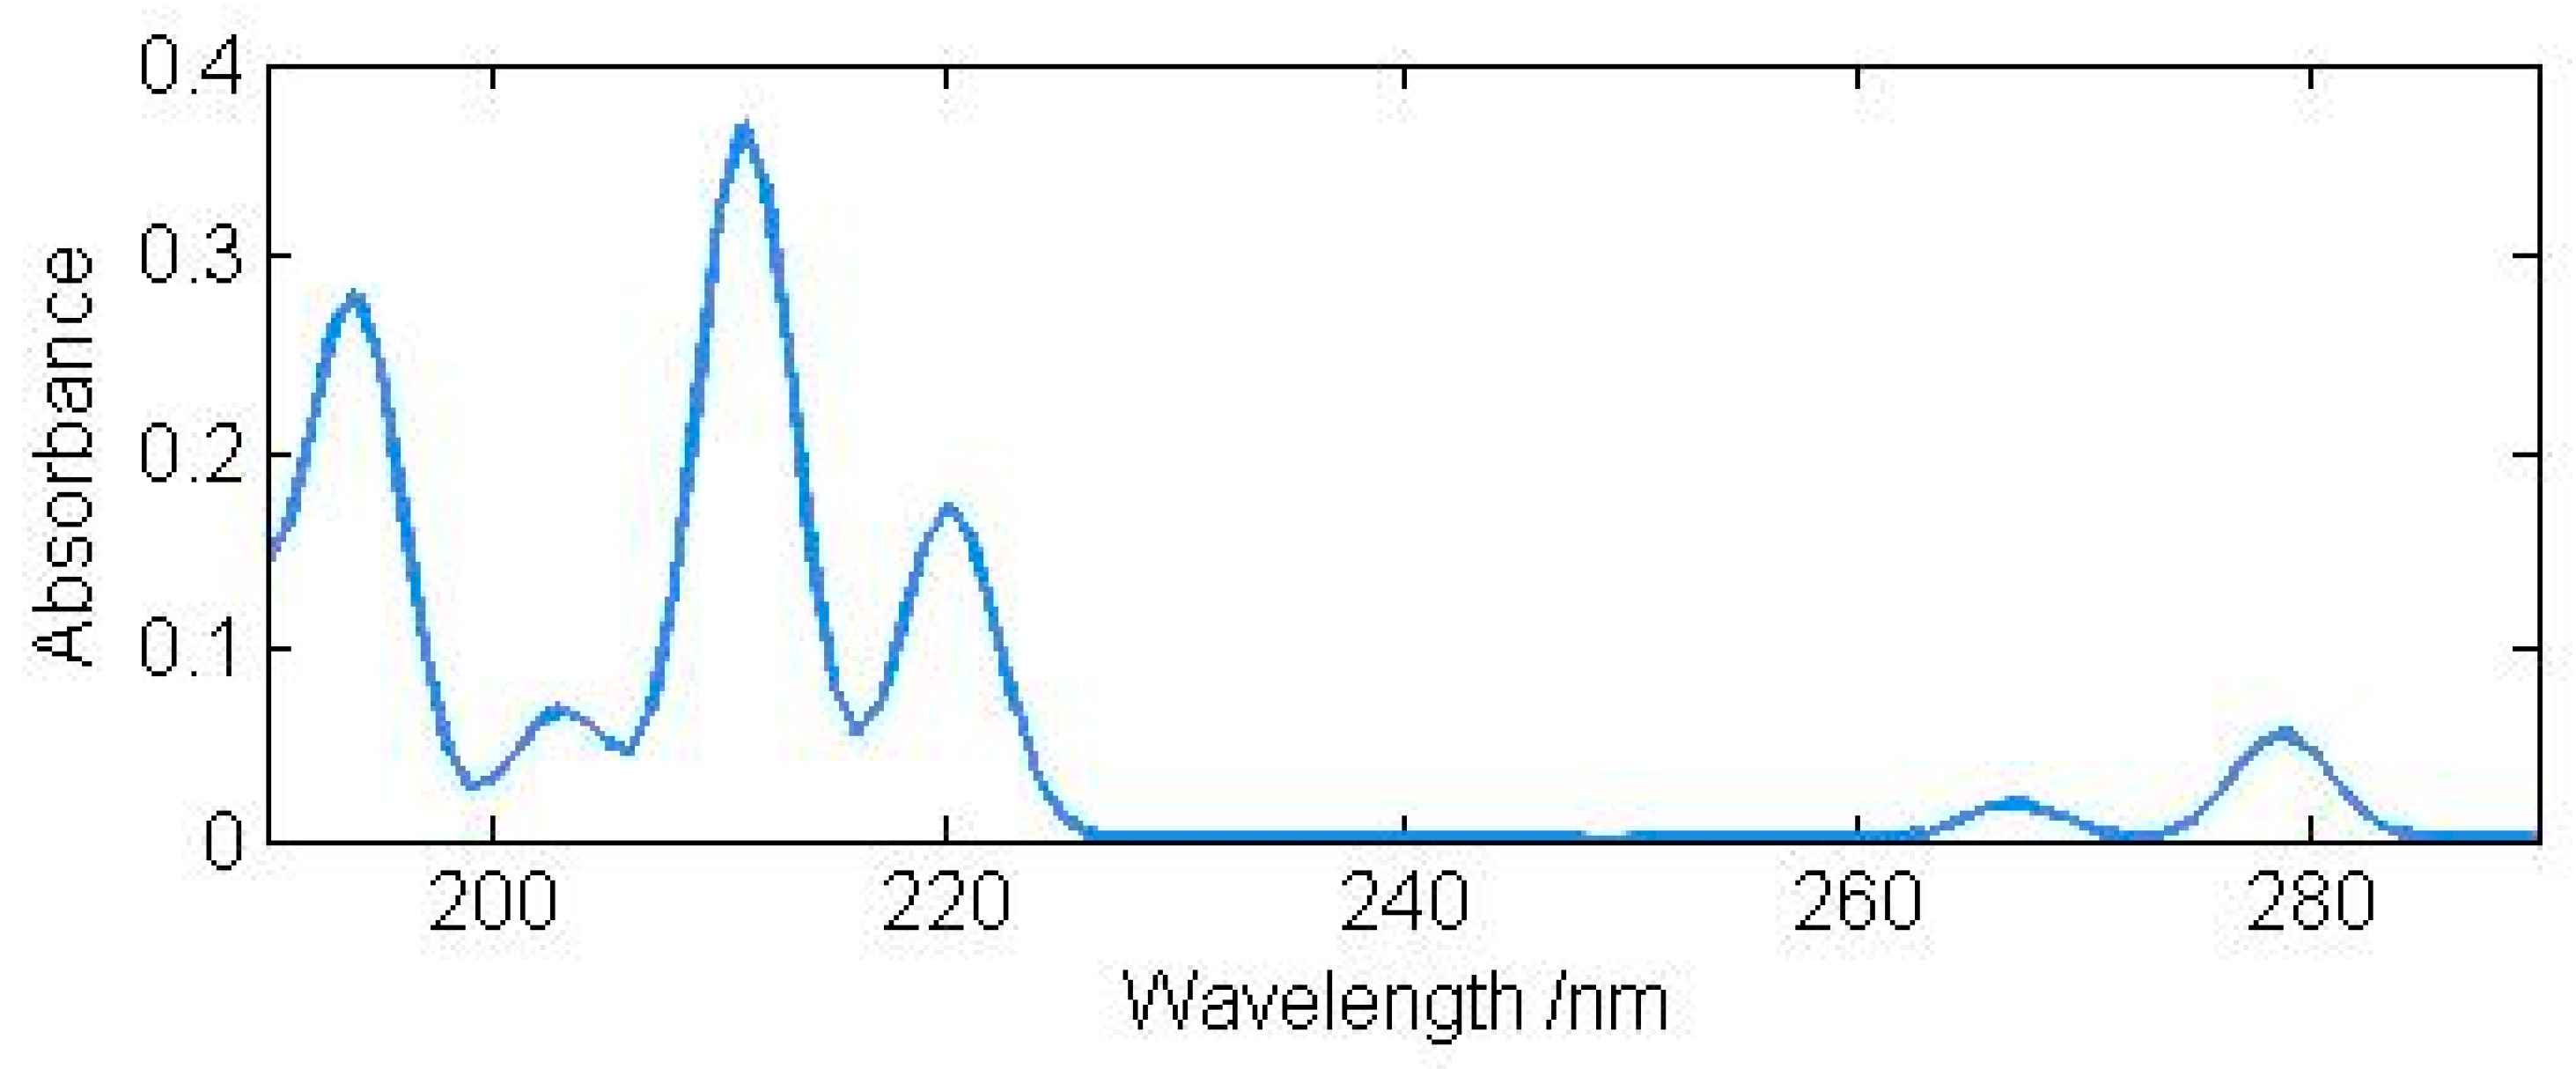
The result for indole is displayed in Figure 1. Our DFT results for the four lowest excited singlet states agree with the previous CASPT2 results reasonably well. For the higher singlet states, our DFT method appears to be more reliable. The same method and basis set are then used to predict the excited states of 4-azaindole, 5-azaindole, and 6-azaindole. Hopefully, the results, summarized in Table 8, will be useful to experimental chemists. For indole and the four azaindoles, π-type excitations have low intensities.
The results for the photoelectron spectrum of indole(g) are summarized in Table 9. Plekan et al. [35] used the method of renormalized partial third order method (P3+) for the ionization energies of outer valence electrons and ΔB3LYP for core electrons. Besides the inclusion of inner-valence electrons, our DFT results appear to be more reliable (except for the lowest VIE) than the P3+ method, especially for core electrons.
The same procedures are applied to the azaindoles and the results are shown in Table 10. The iterations for four valence cations fail to converge. For the purpose of computing X-ray emission spectra, the ionization energies of those four non-convergent cases are estimated.
Finally, the Kα X-ray emission spectra for decay of N1s core holes are predicted for indole and the four azaindoles. The results summarized in Table 11; Table 12 indicates that ΔE values are fairly similar with many transitions between 374 and 398 eV. However, the data of f-values (even though approximate) help to make the spectra different from one another. The f-values have been calculated with Kohn–Sham orbitals from Vxc = SAOP calculations. In atomic units, the energy difference ΔE enters the formula for f-value
where μ is the transition dipole moment. The error in (ΔE) amounts to about 5% (20 eV in 400 eV) for nitrogen. Therefore, the f-values listed are hardly affected except for the most intense transitions, which have been highlighted with boldface type in Table 11 and Table 12.
f = (2/3) (ΔE)∣μ∣ 2
4. Summary
In this work, we have computed the various electron spectra of gas-phase indole and four azaindoles. The spectra include UV absorption, valence ionization, core ionization, and X-ray emission. The available experimental data on indole and 7-azaindole allow the comparison of theory with experiment and support the reliability of the predicted spectra. Experimentalists are therefore encouraged to measure the unknown spectra.
Supplementary Materials
The following are available online: the optimized Cartesian coordinates of the five molecules.
Funding
This research received no external funding.
Institutional Review Board Statement
Not applicable.
Data Availability Statement
Data availability on request.
Acknowledgments
The author is grateful for the continuing support of Scientific Computing and Modeling (Amsterdam).
Conflicts of Interest
The authors declare no conflict of interest.
Appendix A
The geometry of both methanal and hydrogen peroxide were optimized by popular methods using various basis sets. The results of such test calculations are presented in Table A1 and Table A2. It can be seen that the dependence of the calculated CEBEs is quite small in both cases.

Table A1.
Summary of DF T calculation on H2CO: bond lengths in angstrom, angles in degree, rotational constants and their average absolute deviation from experiment in MHz, and core-electron binding energies in eV. Bold-face type indicates best agreement with the experiment.
Table A1.
Summary of DF T calculation on H2CO: bond lengths in angstrom, angles in degree, rotational constants and their average absolute deviation from experiment in MHz, and core-electron binding energies in eV. Bold-face type indicates best agreement with the experiment.
| Method | R(CO) | R(CH) | <OCH | A | B | C | AAD | OK | Dev | CK | Dev |
|---|---|---|---|---|---|---|---|---|---|---|---|
| B3LYP/6-31G(d) | 1.2066 | 1.1105 | 122.38 | 285,068 | 38,634 | 34,023 | 1108 | 539.56 | 0.08 | 294.57 | 0.10 |
| B3LYP/6-311 + G(d,p) | 1.2019 | 1.1080 | 122.04 | 284,214 | 38,999 | 34,293 | 903 | 539.56 | 0.08 | 294.55 | 0.08 |
| B3LYP/6-311 + G(2d,p) | 1.2003 | 1.1075 | 121.89 | 283,545 | 39,135 | 34,389 | 757 | 539.56 | 0.08 | 294.55 | 0.08 |
| MP2/cc-pVTZ | 1.2102 | 1.1004 | 121.95 | 287,589 | 38,603 | 34,033 | 1962 | 539.54 | 0.06 | 294.54 | 0.07 |
| CCSD/cc-pVTZ | 1.2028 | 1.1012 | 121.94 | 287,122 | 39,022 | 34,353 | 1900 | 539.55 | 0.07 | 294.53 | 0.06 |
| CCSD(T)/cc-pVTZ | 1.2096 | 1.1030 | 121.88 | 285,816 | 38,631 | 34,031 | 1361 | 539.54 | 0.06 | 294.55 | 0.08 |
| Expt | 1.2078 | 1.1161 | 116.52 | 281,964 | 38,832 | 34,002 | (0) | 539.48 | (0) | 294.47 | (0) |
Table A2.
Summary of DFT calculation on HOOH: bond lengths in angstrom, angles in degree, rotational constants and their average absolute deviation from experiment in MHz, and core-electron binding energies in eV. Bold-face type indicates best agreement with the experiment.
Table A2.
Summary of DFT calculation on HOOH: bond lengths in angstrom, angles in degree, rotational constants and their average absolute deviation from experiment in MHz, and core-electron binding energies in eV. Bold-face type indicates best agreement with the experiment.
| Method | R(OO) | R(OH) | <HOO | <HOOH | A | B | C | AAD | CEBE | Dev |
|---|---|---|---|---|---|---|---|---|---|---|
| B3LYP/6-31G(d) | 1.4557 | 0.9737 | 99.68 | 118.60 | 297,104 | 26,414 | 25,366 | 4799 | 540.89 | 0.09 |
| B3LYP/6-311+G(d,p) | 1.4538 | 0.9672 | 100.50 | 120.84 | 303,402 | 26,466 | 25,364 | 2717 | 540.89 | 0.09 |
| B3LYP/6-311+G(2d,p) | 1.4516 | 0.9682 | 100.55 | 115.67 | 302,390 | 26,449 | 25,518 | 3100 | 540.90 | 0.10 |
| MP2/cc-pVTZ | 1.4498 | 0.9643 | 99.36 | 114.13 | 301,579 | 26,598 | 25,704 | 3482 | 540.92 | 0.12 |
| CCSD/cc-pVTZ | 1.4406 | 0.9610 | 100.27 | 113.09 | 305,937 | 26,836 | 25,979 | 2200 | 540.93 | 0.13 |
| CCSD(T)/cc-pVTZ | 1.4578 | 0.9640 | 99.55 | 113.93 | 302,158 | 26,301 | 25,435 | 3100 | 540.91 | 0.11 |
| Expt | 1.475 | 0.950 | 94.8 | 119.8 | 310,465 | 25,950 | 24,793 | (0) | 540.8 | (0) |
References
- van Order, R.B.; Lindwall, H.G. Indole. Chem. Rev. 1942, 30, 69–96. [Google Scholar] [CrossRef]
- Sullivan, D.; Gad, S. Indole. In Encyclopedia of Toxicology; Elsevier BV: Amsterdam, The Netherlands, 2014; pp. 1030–1031. [Google Scholar]
- Ziarani, G.M.; Moradi, R.; Ahmadi, T.; Lashgari, N. Recent Advances in the Application of Indoles in Multicomponent Reactions. RSC Adv. 2018, 8, 12069. [Google Scholar] [CrossRef] [Green Version]
- Chadha, N.; Silakari, O. Chapter8—Indoles: As multitarget directed ligands in medicinal chemistry. In Key Heterocycle Cores for Designing Multitargeting Molecules; Sikari, O., Ed.; Elsevier: Amsterdam, The Netherlands, 2018; pp. 285–321. [Google Scholar]
- Sundberg, R.J. The Chemistry of Indoles. In Organic Chemistry; Blomquist, A.T., Ed.; Springer: Heidelberg, Germany, 1970; Volume 18. [Google Scholar]
- Gribble, G.W. Heterocyclic Scaffolds II: Reactions and Applications of Indoles; Springer: Heidelberg, Germany, 2010. [Google Scholar]
- Yakhontov, L.N. The Chemistry of Azaindoles [Pyrrolo[2,3]pyridines]. Russ. Chem. Rev. 1968, 37, 551–565. [Google Scholar] [CrossRef]
- Prokopov, A.A.; Yakhontov, L.N. Methods of Synthesis and the Production Technology of Therapeutic Substances. Chemistry of the Azaindoles (Review). Pharma. Chem. J. 1994, 28, 471–506. [Google Scholar] [CrossRef]
- Collier, W.B. Vibrational Frequencies for Polyatomic Molecules. I. Indole and 2,3-benzofuran Spectra and Analysis. J. Chem. Phys. 1988, 88, 7295–7306. [Google Scholar] [CrossRef]
- Walden, S.E.; Wheeler, R.A. Structure and Vibrational Analysis of Indole by Density Functional Theory and by Hartree-Fock/Density Functional Methods. J. Chem. Soc. Perkin Trans. 1996, 2, 2653–2662. [Google Scholar] [CrossRef]
- Suenram, R.D.; Lovas, F.J.; Fraser, G.T. Microwave Spectrum and 14N Quadrupole Coupling Constants of Indole. J. Mol. Spectrosc. 1988, 127, 472–480. [Google Scholar] [CrossRef]
- Caminati, W.; Bernardo, S. Microwave Spectrum and Amino Hydrogen Location in Indole. J. Mol. Struct. 1990, 223, 253–262. [Google Scholar] [CrossRef]
- Gruet, S.; Pirali, O.; Goubet, M.; Tokaryk, D.W.; Brechignac, P. High-resolution Far-infrared Spectroscopy of N-substituted Two-ring Polycyclic Aromatic Hydrocarbons: An Extended Study. J. Phys. Chem. A 2016, 120, 95–105. [Google Scholar] [CrossRef]
- Nesvadba, R.; Studecky, T.; Uhlikova, T.; Urban, S. Microwave Spectrum and Molecular Constants of Indole. J. Mol. Spectrosc. 2017, 339, 6–11. [Google Scholar] [CrossRef]
- Vavra, K.; Lukova, K.; Kania, P.; Koucky, J.; Urban, S. Rotational Spectra of Indole in the Lowest Vibrational States. J. Mol. Spectrosc. 2019, 363, 111175. [Google Scholar] [CrossRef]
- Caminati, W.; Bernardo, S. Microwave Spectrum and Amino Hydrogen Location in 7-azaindole. J. Mol. Struct. 1990, 223, 415–424. [Google Scholar] [CrossRef]
- Hollas, J.M. Vapour-phase Ultraviolet Absorption Spectra of Indene, Indole, Coumarone and Thionaphthene. Spectrochim. Acta 1963, 19, 753–767. [Google Scholar] [CrossRef]
- Strickland, E.H.; Horwitz, J.; Billups, C. Near-ultraviolet Absorption Bands of Tryptophan. Studies using Indole and 3-methylindole as Models. Biochemistry 1970, 9, 4914–4921. [Google Scholar] [CrossRef]
- Lami, H. On the Possible Role of a Mixed Valence-Rydberg State in the Fluorescence of Indoles. J. Chem. Phys. 1977, 67, 3274–3281. [Google Scholar] [CrossRef]
- Lami, H. Presence of a Low-lying “Rydberg” Band in the Vapour Phase Absorption Spectra of Indole and 1-methyl Indole. Chem. Phys. Lett. 1977, 48, 447–450. [Google Scholar] [CrossRef]
- Ilich, P. 7-azaindole: The Low-temperature Near-UV Spectra and Electronic Structure. J. Mol. Struct. 1995, 354, 37–47. [Google Scholar] [CrossRef]
- Serrano-Andres, L.; Roos, B.J. Theoretical Study of the Absorption and Emission Spectra of Indole in the Gas Phase and in a Solvent. J. Am. Chem. Soc. 1996, 118, 185–195. [Google Scholar] [CrossRef]
- Borisevich, N.A.; Raichenok, T.F. Absorption, Fluorescence, and Fluorescence Excitation Spectra of Free Molecules of Indole and its Derivatives. J. Appl. Spectrosc. 2007, 74, 218–222. [Google Scholar] [CrossRef]
- Livingston, R.; Schalk, O.; Boguslavskiy, A.E.; Wu, G.; Bergendahl, L.T.; Stolow, A.; Paterson, M.J.; Townsend, D.J. Following the excited state relaxation dynamics of indole and 5-hydroxyindole using time-resolved photoelectron spectroscopy. Chem. Phys. 2011, 135, 194307. [Google Scholar] [CrossRef] [Green Version]
- Kumar, M.; Mohan, T.R.; Branton, T.A.; Trivedi, D.; Nayak, G.; Mishra, R.K.; Jana, S. Biofield Treatment: A Potential Strategy for Modification of Physical and Thermal Properties of Indole. J. Environ. Anal. Chem. 2015, 2, 152. [Google Scholar] [CrossRef]
- Borin, A.C.; Serrano-Andres, L. A Theoretical Study of the Absorption Spectra of Indole and its Analogs: Indene, Benzimidazole, and 7-azaindole. Chem. Phys. 2000, 262, 253–265. [Google Scholar] [CrossRef]
- Serrano-Andres, L.; Borin, A.C. A Theoretical Study of the Emission Spectra of Indole and its Analogs: Indene, Benzimidazole, and 7-azaindole. Chem. Phys. 2000, 262, 267–283. [Google Scholar] [CrossRef]
- Giussan, A.; Marchesell, J.; Mukamel, S.; Garavelli, M.; Nenov, A. On the Simulation of Two-dimensional Electronic Spectroscopy of Indole-containing Peptides. Photochem. Photobiol. 2017, 93, 1368–1380. [Google Scholar] [CrossRef] [PubMed]
- Fuke, K.; Yoshiuchi, H.; Kaya, K. Electronic Spectra and Tautomerism of Hydrogen-bonded Complexes of 7-azaindole in a Supersonic Jet. J. Phys. Chem. 1984, 88, 5840–5844. [Google Scholar] [CrossRef]
- Bulska, H.; Grabowska, A.; Pakula, B.; Sepiol, J.; Waluk, J. Spectroscopy of Doubly Hydrogen-bonded 7-azaindole. Reinvestigation of the Excited State Reaction. J. Lumin. 1984, 29, 65–81. [Google Scholar] [CrossRef]
- Hassan, K.H.; Hollas, J.M. Assignment of the S1-S0 Electronic Absorption Spectra of 7-azaindole and 1-azaindolizine as π*-π by Rotational Band Contour Analysis. J. Mol. Spectrosc. 1989, 138, 398–412. [Google Scholar] [CrossRef]
- Sukhodola, A.A. 7-azaindole in the Gas Phase: Absorption, Luminescence, and the Mechanism of Long-lived Luminescence. J. Appl. Spectrosc. 2018, 85, 850–855. [Google Scholar] [CrossRef]
- Serrano-Andres, L.; Merchan, M.; Borin, A.C.; Stalring, J. Theoretical Studies on the Spectroscopy of the 7-azaindole Monomer and Dimer. Int. J. Quantum Chem. 2001, 84, 181–191. [Google Scholar] [CrossRef]
- Ten, G.N.; Glukhova, O.E.; Slepchenkov, O.E.; Baranov, V.I. Theoretical Analysis of the Fluorsescence Spectra of 7-azaindole and its Tautomer. Opt. Spectrosc. 2016, 120, 359–366. [Google Scholar] [CrossRef]
- Plekan, O.; Sa’Adeh, H.; Ciavardini, A.; Callegari, C.; Cautero, G.; Dri, C.; Di Fraia, M.; Prince, K.C.; Richter, R.; Sergo, R.; et al. Experimental and Theoretical Photoemission Study of Indole and Its Derivatives in the Gas Phase. J. Phys. Chem. A 2020, 124, 4115–4127. [Google Scholar] [CrossRef] [PubMed]
- Frisch, M.J.; Trucks, G.W.; Schlegel, H.B.; Scuseria, G.E.; Robb, M.A.; Cheeseman, J.R.; Scalmani, G.; Barone, V.; Mennucci, B.; Petersson; et al. Gaussian 09, Revision, A.02; Gaussian: Wallingford, CT, USA, 2009. [Google Scholar]
- ADF Program System, Release 2013; Scientific Computing & Modeling, NV: Amsterdam, 2006. For a comprehensive description of ADF, see te Velde, G.; Bickelhaupt, F.M.; Baerends, E.J.; Fonseca Guerra, C.; van Gisbergen, S.J.A.; Snijders, J.G.; Ziegler, T. Chemistry with ADF. J. Comput. Chem. 2001, 22, 931.
- Segala, M.; Chong, D.P. An Evaluation of Exchange-correlation Functionals for the Calculation of the Ionization Energies of Atoms and Molecules. J. Electron. Spectrosc. Rel. Phenom. 2009, 171, 18–23. [Google Scholar] [CrossRef]
- Chong, D.P.; van Lenthe, E.; van Gisbergen, S.; Baerends, E.J. Even-tempered Slater-type Orbitals Revisited: From Hydrogen to Krypton. J. Comput. Chem. 2004, 25, 1030–1036. [Google Scholar] [CrossRef]
- Chong, D.P. Additions and Crrections: Theoretical Study of the Electron Spectra of s-triazine Vapor. Can. J. Chem. 2010, 88, 577. [Google Scholar] [CrossRef]
- Chong, D.P. Density Functional Theory Study on the Electron Spectra of Naphthalene and Azulene. Can. J. Chem. 2010, 88, 787–796. [Google Scholar] [CrossRef]
- Chong, D.P. Density Functional Theory Study on the Electron Spectra of 1,4-benzoquinone Vapor. Mol. Phys. 2010, 108, 2459–2466. [Google Scholar] [CrossRef]
- Chong, D.P. Density Functional Theory Study on the Electron Spectra of Formamide Vapor. J. Electron. Spectrosc. Rel. Phenom. 2011, 184, 164–169. [Google Scholar] [CrossRef]
- Chong, D.P. DFT Study of the Vertical Ionization Energies of the Valence and Core Electrons of Cyclopentadiene, Pyrrole, Furan, and Thiophene. Can. J. Chem. 2011, 89, 1477–1488, Errata: The calculated core electron binding energies of pyrrole in Table 9 should read 290.75, 289.92, and 406.37 eV instead of 290.55, 289.71, and 405.57 eV, respectively, doi:10.1139/V11-121. [Google Scholar] [CrossRef]
- Takahata, Y.; Chong, D.P. DFT Calculation of Core- and Valence-Shell Electron Excitation and Ionization Energies of 2,1,3-benzothiadiazole C6H4SN2, 1,3,2,4-benzodithiadiazine, C6H4S2N2, and 1,3,5,2,4-benzotrithiadiazeoine, C6H4S3N2”. J. Electron. Spectrosc. Rel. Phenom. 2012, 185, 475–485. [Google Scholar] [CrossRef] [Green Version]
- Chong, D.P. Density Functional Theory Study of the Photoelectron Spectra of 5-methyltetrazole. Theoret. Comput. Chem. 2013, 12, 1250096. [Google Scholar] [CrossRef]
- Chong, D.P. Theoretical study of uric acid and its ions. J. Theoret. Comput. Sci. 2013, 1, 104. [Google Scholar] [CrossRef]
- Chong, D.P. Computational study of the electron spectra of acetamide and N-methylacetamide. Croat. Chem. Acta 2017, 90, 99–105. [Google Scholar] [CrossRef]
- Chong, D.P. Computational study of the structures and electron spectra of gas-phase nitroamines: Dimethylnitrosamine, N-nitrosopyrrolidine and 1-nitrosoaziridine. J. Electron. Spectrosc. Rel. Phenom. 2019, 232, 35–39. [Google Scholar] [CrossRef]
- Chong, D.P. Computational study of the structures and electron spectra of 12 azabenzenes. Can. J. Chem. 2019, 97, 697–703. [Google Scholar] [CrossRef]
- Nakatsuji, H.; Miyahara, T.; Fukuda, R. Symmetry-adapted-cluster/symmetry-adapted-cluster configuration interaction methodology extended to giant molecular systems: Ring molecular crystals. J. Chem. Phys. 2007, 126, 84104. [Google Scholar] [CrossRef] [PubMed] [Green Version]
- Ortiz, J.V. An efficient, renormalizd self-energy for calculating the electron binding energies of close-shell molecules and anions. Int. J. Quantum Chem. 2005, 105, 803–808. [Google Scholar] [CrossRef]
- Cavigliasso, G.; Chong, D.P. Accurate density-functional calculation of core-electron binding energies by a total-energy difference approach. J. Chem. Phys. 1999, 111, 9485–9492. [Google Scholar] [CrossRef]
- Bellafont, N.P.; Illas, F.; Bagus, P.S. Validation of Koopmans’ theorem for density functional theory binding energies. Phys. Chem. Chem. Phys. 2015, 17, 4015–4019. [Google Scholar] [CrossRef] [PubMed]
- Bellafont, N.P.; Bagus, P.S.; Illas, F. Prediction of core level binding energies in density functional theory: Rigorous definition of initial and final state contributions and implications on the physical meaning of Kohn-Sham energies. J. Chem. Phys. 2015, 142, 214102. [Google Scholar] [CrossRef] [PubMed]
- Bellafont, N.P.; Bagus, P.S.; Sousa, C.; Illas, F. Assessing the ability of DFT methods to describe static electron correlation effects: CO core level binding energies as a representative case. J. Chem. Phys. 2017, 147, 024106. [Google Scholar] [CrossRef] [Green Version]
- Bellafont, N.P.; Vines, F.; Illas, F. Performance of the TPSS Functional on Predicting Core Level Binding Energies of Main Group Elements Containng Molecules: A Good Choice for Molecules Adsorbed on Metal Surfaces. J. Chem. Theory Comput. 2016, 12, 324–331. [Google Scholar] [CrossRef] [PubMed]
- Vines, F.; Sousa, C.; Illas, F. On the prediction of core level binding energies in molecules, surfaces and solids. Phys. Chem. Chem. Phys. 2018, 20, 8403–8410. [Google Scholar] [CrossRef] [PubMed]
- Chong, D.P. Density-Functional Calculation of Core-electron Binding Energies of C., N., O., and F. J. Chem. Phys. 1995, 103, 1842–1845. [Google Scholar] [CrossRef]
- Pekeris, C.L. Ground State of Two-Electron Atoms. Phys. Rev. 1958, 112, 1649–1658. [Google Scholar] [CrossRef]
- Maruani, J.; Kuleff, A.I.; Chong, D.P.; Bonnelle, C. Ansatz for the Evaluation of the Relativistic Contributions to Core Ionization Energies in Complex Molecules Involving Heavy Atoms. Int. J. Quantum Chem. 2005, 104, 397–410. [Google Scholar] [CrossRef]
- Van Setten, M.J.; Costa, R.; Viñes, F.; Illas, F. Assessing GW Approaches for Predicting Core Level Binding Energies. J. Chem. Theory Comput. 2018, 14, 877–883. [Google Scholar] [CrossRef]
- Chong, D.P. Augmenting Basis Set for Time-dependent Density Functional Theory Calculation of Excitation Energies: Slater-type Orbitals for Hydrogen to Krypton. Mol. Phys. 2005, 103, 749–761, Erratum: The volume and page numbers of Ref. 20 should read 34 and 31, respectively. [Google Scholar] [CrossRef]
- Falzon, C.T.; Chong, D.P.; Wang, F. Prediction of spectroscopic constants for diatomic molecules in the ground and excited states using time-dependent density functional theory. J. Comput. Chem. 2005, 27, 163–173. [Google Scholar] [CrossRef] [PubMed]
- Gelius, U. Molecular orbitals and line intensities in ESCA spectra. In Electron Spectroscopy; Shirley, D.A., Ed.; North-Holland Publishing Co.: Amsterdam, The Netherlands, 1972; pp. 311–334. [Google Scholar]
- Gelius, U. Recent progress in ESCA studies of gases. J. Electron. Spectrosc. Relat. Phenom. 1974, 5, 985–1057. [Google Scholar] [CrossRef]
- Nefedov, V.I.; Sergushin, N.P.; Band, I.M.; Trzhaskovskaya, M.B. Relative intensities in X-ray photoelectron spectra. J. Electron. Spectrosc. Rel. Phenom. 1973, 2, 383–403. [Google Scholar] [CrossRef]
- Chong, D.P. Adaptation of the Gelius intensity model for semiempiriacl HAM/3 molecular orbital calculations of valence photoelectron spectra excited by X.-ray radiation. Can. J. Chem. 1985, 63, 2007–2011. [Google Scholar] [CrossRef]
- Chong, D.P.; Gritsenko, O.V.; Baerends, E.J. Interpretation of the Kohn-Sham Orbital Energies as the Approximate Vertical Ionization Potentials. J. Chem. Phys. 2002, 116, 1760–1772. [Google Scholar] [CrossRef] [Green Version]
- Chong, D.P. Calculation of reliable non-resonant Kα X-ray emission spectra of organic molecules and other small molecules. Can. J. Chem. 2020, 98, 741–745. [Google Scholar] [CrossRef]
- Takahata, Y.; Wulfman, C.E.; Chong, D.P. Accurate calculation of N1s and C1s core electron binding energies of substituted pyridines. Correlation with basicity and with Hammett substituent constants. J. Mol. Struct. THEOCHEM 2008, 863, 33–38. [Google Scholar] [CrossRef]
- Thomas, T.D.; Børve, K.J.; Gundersen, M.; Kukk, E. Reactivity and Core-Ionization Energies in Conjugated Dienes. Carbon 1s Photoelectron Spectroscopy of 1,3-Pentadiene. J. Phys. Chem. A 2005, 109, 5085–5092. [Google Scholar] [CrossRef] [PubMed]
- Saethre, L.J.; Thomas, T.D.; Svensson, S. ChemInform Abstract: Markovnikov Addition to Alkenes. A Different View from Core-Electron Spectroscopy and Theory. Cheminform 2010, 28, 749–755. [Google Scholar] [CrossRef]
- Gusten, H.; Klasinc, L.; Ruscic, B. Photoelectron Spectroscopy of Heterocycles. Indene Analogs. Z. Naturforsch. 1976, 31a, 1051–1056. [Google Scholar] [CrossRef]
- Chrostowska, A.; Xu, S.; Mazière, A.; Boknevitz, K.; Li, B.; Abbey, E.R.; Dargelos, A.; Graciaa, A.; Liu, S.-Y. UV-Photoelectron Spectroscopy of BN Indoles: Experimental and Computational Electronic Structure Analysis. J. Am. Chem. Soc. 2014, 136, 11813–11820. [Google Scholar] [CrossRef] [Green Version]
Figure 1.
Calculated UV absorption spectrum of indole (g).

Table 1.
Experimental (microwave) and theoretical (present work) rotational constants (in MHz) of indole and azaindoles.
Table 1.
Experimental (microwave) and theoretical (present work) rotational constants (in MHz) of indole and azaindoles.
| Year | Indole | A | B | C | AAD a | Dipole (ADF) b, D | α b | Δα b |
|---|---|---|---|---|---|---|---|---|
| 1988 | Suenram et al. [11] | 3877.84 | 1636.05 | 1150.90 | ||||
| 1990 | Caminati and Bernardo [12] | 3877.83 | 1636.05 | 1150.90 | 2.09 ± 0.13 | |||
| 2015 | Gruet et al. [13] | 3877.84 | 1636.05 | 1150.90 | ||||
| 2017 | Nesvadba et al. [14] | 3877.84 | 1636.05 | 1150.90 | ||||
| 2019 | Vavra et al. [15] | 3877.84 | 1636.05 | 1150.90 | (0) | |||
| 2020 | B3LYP/6-31G(d) | 3878.25 | 1631,22 | 1148.25 | 2.63 | 2.1731 (2.1798) | 103.35 | 118.93 |
| 2020 | B3LYP/6-311+G(2d,p) | 3901.39 | 1640.17 | 1154.72 | 10.50 | 2.1360 | ||
| 2020 | B3LYP/cc-pVTZ | 3908.14 | 1642.93 | 1156.68 | 14.32 | 2.1732 | ||
| 2020 | B3LYP/cc-pVQZ | 3909.46 | 1643.62 | 1157.14 | 15.14 | 2.1399 | ||
| 7-Azaindole | ||||||||
| 1990 | Caminati and Bernardo [12] | 3928.93 | 1702.63 | 1188.13 | (0) | 1.68 ± 0.07 | ||
| 2020 | B3LYP/6-31G(d) | 3929.63 | 1697.39 | 1185.37 | 2.90 | 1.6343 (1.7166) | 97.99 | 147.73 |
| 2020 | B3LYP/6-311+G(2d,p) | 3957.32 | 1705.05 | 1191.16 | 11.28 | 1.6435 | ||
| 2020 | B3LYP/cc-pVTZ | 3963.53 | 1708.56 | 1193.91 | 15.44 | 1.6198 | ||
| 2020 | B3LYP/cc-pVQZ | 3966.63 | 1708.97 | 1194.38 | 16.76 | 1.6293 | ||
| 4-Azaindole | ||||||||
| 2020 | B3LYP/6-31G(d) | 3914.94 | 1692.94 | 1181.87 | 4.0322 (4.1588) | 98.13 | 127.01 | |
| 5-Azaindole | ||||||||
| 2020 | B3LYP/6-31G(d) | 4014.22 | 1638.31 | 1163.47 | 4.4053 (4.5675) | 97.05 | 90.37 | |
| 6-Azaindole | ||||||||
| 2020 | B3LYP/6-31G(d) | 4012.95 | 1639.08 | 1163.75 | 3.7656 (3.9394) | 97.09 | 122.91 | |
a Average absolute deviation. b From SAOP/aug-et-pVQZ.
Table 2.
Vertical ionization energies (in eV) of valence electrons calculated ΔPBE0 (SAOP). AAD = Average absolute deviation from experiment.
Table 2.
Vertical ionization energies (in eV) of valence electrons calculated ΔPBE0 (SAOP). AAD = Average absolute deviation from experiment.
| Ref. | Year | Molecules | Number of VIEs | AAD, eV |
|---|---|---|---|---|
| 38 | 2009 | 31 molecules | 128 | 0.26 |
| 40 | 2010 | S-triazine | 10 | 0.20 |
| 41 | 2010 | naphthalene | 19 | 0.15 |
| azulene | 9 | 0.13 | ||
| 42 | 2010 | 1,4-benzoquinone | 16 | 0.19 |
| 43 | 2011 | formamide | 9 | 0.11 |
| 44 | 2011 | cyclopentadiene | 11 | 0.26 |
| pyrrole | 10 | 0.19 | ||
| furan | 12 | 0.23 | ||
| thiophene | 11 | 0.27 | ||
| 45 | 2012 | 2,1,3-benzothiadiazole | 10 | 0.14 |
| 1,3,2,4-benzodithiadiazine | 10 | 0.09 | ||
| 1,3,5,2,4-benzodithiadiazepine | 11 | 0.15 | ||
| 46 | 2013 | 5-methyltetrazole | 9 | 0.22 |
| 47 | 2013 | uric acid | 5 | 0.14 |
| 48 | 2017 | acetamide | 9 | 0.17 |
| N-methylformamide | 8 | 0.16 | ||
| 49 | 2019 | dimethylnitrosamine | 5 | 0.13 |
| N-nitrosopyrrollidine | 6 | 0.16 | ||
| 1-nitrosoaziridine | 9 | 0.24 | ||
| 50 | 2019 | Pyridine | 12 | 0.15 |
| 1,2-diazine | 13 | 0.28 | ||
| 1,3-diazine | 12 | 0.25 | ||
| 1,4-diazine | 12 | 0.25 |
Table 3.
Relativistic correction of core electron ionization energies (in eV).
| Case | Ref | Effects Included | B | C | N | O | F | |||
|---|---|---|---|---|---|---|---|---|---|---|
| Relativistic | Correlation | Molecular | ||||||||
| Two Electron Ions | 60 | yes | yes | no | Irel | 259.375 | 392.093 | 552.072 | 739.335 | 953.911 |
| Inr | 259.338 | 391996 | 551.865 | 738.944 | 953.234 | |||||
| Irel–Inr | 0.037 | 0.097 | 0.207 | 0.391 | 0.677 | |||||
| 59 | Crel a | 0.040 | 0.098 | 0.206 | 0.389 | 0.677 | ||||
| Typical Molecules c | 59 | yes | part | no | Crel a | 0.022 | 0.051 | 0.106 | 0.196 | 0.340 |
| Dirac-Fock Atoms | 61 | part | no | no | Crel b | 0.024 | 0.059 | 0.126 | 0.243 | 0.434 |
| Dirac-Fock Atoms | 54–58 | part | no | no | 0.06 | 0.13 | 0.25 | 0.45 | 0.75 | |
a Crel = (2.198 × 10⁻⁷) Inr2.178. b (6.55 × 10⁻⁷) Inr2.0569. c B2H6, CH4, NH3, H2O, HF. It can be seen that the relativistic corrections reported by Maruani et al. [61] are slightly larger than Crel of our earlier empirical fit [59] and approximately half of those reported by Bellafont at al [54,55,56,57,58]. It would be ideal if one can apply a relativistic procedure capable of giving accurate results for two-electron ions to the typical molecules B2H6, CH4, NH3, H2O, and HF. Until then, we shall remain consistent and continue to use our Crel.
Table 4.
Carbon core-electron binding energies (in eV).
| Case | Obs | ΔPW86PW91 | ΔTPSS |
|---|---|---|---|
| CH2=C(CH3)2 | 289.83 | 289.88 | 290.66 |
| Cα in pyrrole | 289.96 | 289.92 | 289.76 |
| CH2=CHCH3 | 290.25 | 290.24 | 290.61 |
| Cm in C6H5F | 290.54 | 290.49 | 290.57 |
| Cp in C6H5F | 290.54 | 290.69 | 290.38 |
| CH2=C(CH3)2 | 290.65 | 290.76 | 290.52 |
| CH2=C(CH3)2 | 290.69 | 290.78 | 290.66 |
| CH2=CHCH3 | 290.73 | 290.79 | 290.82 |
| Cβ in pyrrole | 290.77 | 290.75 | 290.80 |
| CH2=CHCH3 | 290.81 | 290.95 | 290.17 |
| Co in C6H5F | 290.87 | 290.63 | 290.52 |
| CH4 | 290.91 | 290.95 | 290.86 |
| C2 in p-C6H4F2 | 290.99 | 290.92 | 290.89 |
| CH3COOH | 291.55 | 291.51 | 291.83 |
| CH3OCH3 | 292.34 | 292.21 | 292.17 |
| CH3OH | 292.42 | 292.54 | 292.45 |
| CH3CN | 292.45 | 292.75 | 292.70 |
| C1 in C6H5F | 292.70 | 292.75 | 292.55 |
| C1 in p-C6H4F2 | 292.95 | 292.86 | 292.74 |
| CH3CN | 292.98 | 292.84 | 292.62 |
| HCN | 293.40 | 293.56 | 293.46 |
| H2CO | 294.47 | 294.53 | 294.49 |
| CH3COOH | 295.38 | 295.06 | 294.99 |
| CO | 296.21 | 296.26 | 296.32 |
| CH2F2 | 296.40 | 296.08 | 296.20 |
| CO2 | 297.69 | 297.28 | 297.30 |
| CF4 | 301.90 | 301.14 | 301.34 |
| Cp in aniline | 289.85 | 289.85 | 290.02 |
| Co in aniline | 289.95 | 289.97 | 289.89 |
| Cm in aniline | 290.25 | 290.17 | 290.03 |
| C1 in aniline | 291.29 | 291.37 | 291.17 |
| Cp in toluene | 290.1 | 290.24 | 290.02 |
| Co in toluene | 290.2 | 290.19 | 289.89 |
| Cm in toluene | 290.4 | 290.31 | 290.03 |
| C1 in toluene | 290.9 | 290.49 | 290.17 |
| Cp in phenol | 290.2 | 290.24 | 289.94 |
| Co in phenol | 290.2 | 290.47 | 290.21 |
| Cm in phenol | 290.6 | 290.53 | 290.25 |
| C1 in phenol | 292.0 | 292.12 | 291.84 |
| Average deviation | (0) | −0.03 | −0.11 |
| Average absolute deviation | (0) | 0.14 | 0.23 |
| AD for ΔPW86PW91 + 0.08 | +0.05 | ||
| AAD for ΔPW86PW91 + 0.08 | 0.16 |
Table 5.
Core-electron binding energies (in eV) of N, O, and F. AAD (n) means average absolute deviation for n cases.
Table 5.
Core-electron binding energies (in eV) of N, O, and F. AAD (n) means average absolute deviation for n cases.
| Case | Obs | ΔPW86PW91 | ΔTPSS [56] | ΔB3LYP [56] | QsGW [62] |
|---|---|---|---|---|---|
| N in pyridine | 404.88 | 404.76 | 404.43 | ||
| NH3 | 405.56 | 405.77 | 405.52 | 405.32 | 407.84 |
| N in pyrrole | 406.15 | 406.37 | 405.96 | ||
| HCONH2 | 406.38 | 406.55 | |||
| HCN | 406.78 | 406.94 | 406.67 | 406.66 | 408.78 |
| NNO | 408.71 | 408.59 | |||
| N2 | 409.98 | 410.02 | |||
| NNO | 412.59 | 412.47 | |||
| AAD(4) for N1s | (0) | 0.18 | 0.20 | ||
| AAD(8) for N1s | (0) | 0.14 | |||
| HCONH2 | 537.77 | 537.78 | |||
| CH3OCH3 | 538.74 | 538.71 | 538.04 | ||
| CH3OH | 539.48 | 539.15 | 538.59 | ||
| H2CO | 539.48 | 539.48 | 539.03 | ||
| H2O | 539.90 | 540.01 | 539.45 | 539.39 | 542.13 |
| CO2 | 541.28 | 541.36 | 540.96 | ||
| CO | 542.55 | 542.72 | 542.21 | 542.10 | |
| AAD(6) for O1s | (0) | 0.12 | 0.52 | ||
| AAD(7) for O1s | (0) | 0.10 | |||
| HF | 694.23 | 694.28 | 693.53 | ||
| CH2F2 | 693.65 | 693.71 | 692.89 | ||
| CF4 | 695.56 | 695.38 | 694.58 | ||
| F2 | 696.69 | 696.52 | 695.89 | ||
| AAD(4) for F1s | (0) | 0.04 | 0.81 |
Table 6.
Ultraviolet excitation spectrum of indole vapor: energies in eV (f-values in parentheses, unless otherwise specified).
Table 6.
Ultraviolet excitation spectrum of indole vapor: energies in eV (f-values in parentheses, unless otherwise specified).
| State | Experiment | Theory | |||||||||||
|---|---|---|---|---|---|---|---|---|---|---|---|---|---|
| 1963 a | 1970 b | 1977 c | 1995 d | 1996 e | 2007 f | 2011 g | 2015 h | CASPT2 | CASPT2 | CCR(3) | RASPT2 | DFT k | |
| 1996 e | 2000 i | 2011 g | 2017 j | 2020 k | |||||||||
| 2 1A’ | 4.37 | 4.32 | 4.35 m | 4.37 (0.045) | 4.37 | 4.37 | 4.32 | 4.43 (0.050) | 4.43 (0.050) | 4.76 (0.038) | 4.31 (0.38) | 4.45 (0.0543) | |
| 3 1A’ | 4.77 | 4.67 s | 4.77 (0.123) | 4.63 | 4.79 | 4.73 (0.081) | 4.73 (0.081) | 5.12 (0.1018) | 4.64 (0.23) | 4.64 (0.0187) | |||
| 1 1A” | 4.86 | 4.784.87 | 4.90 | 4.85 (0.001) | 5.02 (0.0022) | 5.84 (0.14) | 5.34 (0.0015) | ||||||
| 4 1A’ | 5.27 | 5.21 (0.004) | 5.84 (0.458) | 5.96 (0.11) | 5.62 (0.1761) | ||||||||
| 2 1A” | 5.71 | 5.33 (0.003) | 6.01 (0.36) | 5.75 (0.0011) | |||||||||
| 3 1A” | 5.36 (0.001) | 6.17 (0.54) | 5.76 (0.0010) | ||||||||||
| 5 1A’ | 5.55 | 5.90 | 6.02 | 5.65 (0.002) | 6.16 (0.003) | 6.42 (0.10) | 5.87 (0.3682) | ||||||
| 4 1A” | 5.37 (0.002) | 6.55 (0.11) | 6.08 (0.0018) | ||||||||||
| 6 1A’ | 6.04 h | 6.02 (~0.6) | 5.84 (0.458) | 6.44 (0.257) | 7.40 (0.88) | 6.08 (0.0571) | |||||||
| 5 1A” | 5.81 (0.001) | 7.39 (0.17) | 6.17 (0.0019) | ||||||||||
| 7 1A’ | 6.34 h | 6.35 | 5.94 (0.012) | 6.71 (0.138) | 6.38 (0.2593) | ||||||||
a Hollas [17]. b Strickland et al. [18]. c Lami [19,20]. d Ilich, in Ar matrix [21]. e Serrano-Andres and Roos [22]. f Borisevich and Raichenok [23]. g Livingston et al. [24]. h Kumar et al. [25]. i Borin and Serrano-Andres [26,27]. j Giussani et al. [28]: transition dipoles in parentheses. k This work: TDDFT using Vxc = SAOP/aug-et-pVQZ.
Table 7.
UV absorption spectrum of 7-azaindole vapor: energies in eV (f-values in parentheses).
| State | Experiment | Theory | ||||||||
|---|---|---|---|---|---|---|---|---|---|---|
| INDO/SI | CASPT2 | CASPT2 | TDDFT | This Work i | ||||||
| 1984 a | 1984 b | 1989 c | 1995 d | 2018 e | 1995 d | 2000 f | 2001 g | 2016 h | 2020 | |
| 2 1A’ | 4.29 | 4.15 | 4.29 | 4.28 | 4.29 | 4.28 (0.17) | 4.22 (0.043) | 4.22 (0.043) | 4.56 | 4.20 (0.0456) |
| 1 1A” | 5.27 (0.008) | 5.27 (0.008) | 4.84 | 4.60 (0.0018) | ||||||
| 3 1A’ | 4.49 | 4.49 | 4.55 (0.09) | 4.49 (0.072) | 4.49 (0.072) | 4.62 (0.0571) | ||||
| 2 1A” | 5.64 (0.0002) | |||||||||
| 4 1A’ | 5.76 | 5.77 (0.065) | 5.77 (0.065) | 5.69 (0.3733) | ||||||
| 3 1A” | 5.82 (0.0034) | |||||||||
| 5 1A’ | 5.99 | 5.93 (0.148) | 5.93 (0.148) | 6.02 (0.0518) | ||||||
| 4 1A” | 6.10 (0.0000) | |||||||||
| 5 1A” | 6.25 (0.0029) | |||||||||
| 6 1A’ | 6.26 (0.377) | 6.26 (0.377) | 6.36 (0.0718) | |||||||
| 6 1A” | 6.47 (0.0018) | |||||||||
| 7 1A’ | 6.46 (0.079) | 6.46 (0.079) | 6.51 (0.0763) | |||||||
| 7 1A” | 6.52 (0.0085) | |||||||||
| 8 1A” | 6.52 (0.0008) | |||||||||
| 8 1A’ | 6.71 (0.265) | 6.71 (0.265) | 6.64 (0.2339) | |||||||
Table 8.
UV excitation spectrum of n-azaindole vapor, n = 4, 5, and 6: energies in eV (f-values in parentheses).
Table 8.
UV excitation spectrum of n-azaindole vapor, n = 4, 5, and 6: energies in eV (f-values in parentheses).
| State | n = 4 | n = 5 | n = 6 |
|---|---|---|---|
| 2 1A’ | 4.23 (0.0383) | 4.46 (0.0479) | 4.40 (0.0521) |
| 3 1A’ | 4.62 (0.0646) | 4.85 (0.0079) | 4.82 (0.0211) |
| 4 1A’ | 5.66 (0.2827) | 5.67 (0.1402) | 5.80 (0.1531) |
| 5 1A’ | 5.93 (0.0382) | 5.86 (0.1474) | 5.86 (0.2207) |
| 6 1A’ | 5.98 (0.1296) | 5.94 (0.1817) | 5.97 (0.0103) |
| 7 1A’ | 6.43 (0.1104) | 6.44 (0.2553) | 6.21 (0.1286) |
| 8 1A’ | 6.47 (0.0378 | 6.49 (0.0751) | 6.47 (0.3539) |
| 1 1A” | 4.26 (0.0016) | 4.33 (0.0004) | 4.33 (0.0012) |
| 2 1A” | 5.27 (0.0005) | 5.18 (0.0025) | 5.29 (0.0006) |
| 3 1A” | 5.62 (0.0017) | 5.49 (0.0017) | 5.62 (0.00010 |
| 4 1A” | 5.93 (0.0008) | 6.03 (0.0001) | 6.06 (0.0013) |
| 5 1A” | 6.12 (0.0020) | 6.16 (0.0007) | 6.09 (0.0015) |
| 6 1A” | 6.16 (0.0012) | 6.32 (0.0077) | 6.31 (0.0001) |
| 7 1A” | 6.43 (0.0001 | 6.35 (0.0018) | 6.41 (0.0034) |
Table 9.
Vertical ionization energies (in eV) of indole vapor.
| MO | 2020 | 2020 | 1976 | 2014 | |||||
|---|---|---|---|---|---|---|---|---|---|
| This Work | Plekan et al. a | Gusten b | Chrostowska c | ||||||
| HAM/3 d | mKT e | DFT f | Ave. | Obs | P3+ | Ave. | Obs | Obs | |
| 5π | 8.29 (0.0517) | 9,23 | 7.78 | 7.90 | 7.91 | 7.91 | 7.9 | ||
| 4π | 8.85 (0.0467) | 9.65 | 8.24 | 8.32 | 8.25 | 8.37 | 8.5 | ||
| 3π | 9.99 (0.0418) | 10.96 | 9.81 | 9.82 | 9.88 | 9.78 | 9.9 | ||
| 26σ | 11.93 (0.0394) | 12.06 | 11.35 | 10.97 | 11.68 | 11.03 | 11.05 | ||
| 2π | 11.12 (0.0450) | 12.30 | 11.38 | 11.55 | 11.29 | 11.52 | 11.45 | ||
| 25σ | 12.40 (0.0485) | 12.58 | 11.97 | 12.20 | 12.27 | 12.26 | 12.25 | ||
| 24σ | 13.26 (0.0572) | 13.52 | 12.93 | 13.02 | 13.29 | 12.72 | 13.0 | ||
| 23σ | 13.55 (0.0402) | 14.00 | 13.51 | (13.7) | 13.88 | 13.16 | |||
| 1π | 13.24 (0.0535) | 14.49 | 13.75 | 13.80 | 13.66 | 13.77 | |||
| 22σ | 13.97 (0.0463) | 14.46 | 14.02 | (14.1) | 14.37 | (14.04) | |||
| 21σ | 14.44 (0.0617) | 14.68 | 14.08 | 14.25 | 14.52 | 14.25 | |||
| 20σ | 15.06 (0.0710) | 15.54 | 15.12 | 15.30 | 15.58 | 15.05 | |||
| 19σ | 15.55 (0.1286) | 15.86 | 15.45 | 15.80 | 15.88 | 15.33 | |||
| 18σ | 16.61 (0.1039) | 17.31 | 17.04 | 17.00 | 17.48 | 17.03 | |||
| 17σ | 17.50 (0.2076) | 18.38 | 18.26 | (18.2) | |||||
| 16σ | 18.48 (0.2547) | 18.73 | 18.68 | 18.52 | |||||
| 15σ | 18.74 (0.1813) | 19.45 | 19.42 | 19.25 | |||||
| 14σ | 21.84 (0.4390) | 21.83 | 22.06 | ||||||
| 13σ | 22.51 (0.4648) | 22.29 | 22.58 | ||||||
| 12σ | 23.95 (0.5046) | 23.50 | 23.91 | ||||||
| 11σ | 25.96 (0.5796) | 24.94 | 25.48 | ||||||
| 10σ | 30.18 (0.6925) | 28.62 | 29.43 | ||||||
| C8 | 289.72 | 289.72 | 289.85 | 289.89 | 289.49 | 289.61 | |||
| C7 | 289.82 | 289.77 | 289.54 | ||||||
| C3 | 289.67 | 289.78 | 289.55 | ||||||
| C9 | 289.83 | 289.79 | 289.57 | ||||||
| C6 | 289.97 | 290.00 | 289.76 | ||||||
| C4 | 289.92 | 290.02 | 289.77 | ||||||
| C5 | 290.76 | (290.76) g | 290.78 | 290.86 | 290.61 | 290.64 | |||
| C2 | 290.78 | 290.79 | 290.66 | ||||||
| N1 | 406.00 | 405.82 | 405.45 | ||||||
a Plekan et al. [35]: P3+ for outer-valence electrons and ΔB3LYP for core electrons. b Gusten et al. [74]. c Chrostowska et al. [75]. d Relative intensity for XPS in parentheses, based on the Gelius model. e mKT + shift of 16.67 eV for core electrons. f ΔPBE0(SAOP)/et-pVQZ//B3LYP/6-31G(d) for valence electrons; ΔPW86xPW91c + Crel for core electrons. g Shifted mKT.
Table 10.
Predicted vertical ionization energies (in eV) of azaindoles a.
| MO | 4-Azaindole | 5-Azaindole | 6-Azaindole | 7-Azaindole |
|---|---|---|---|---|
| 5π | 8.29 (0.0552) | 8.16 (0.0499) | 8.25 (0.0572) | 8.22 (0.0530) |
| 4π | 8.61 (0.0566) | 9.09 (0.0667) | 8.81 (0.0492) | 8.67 (0.0552) |
| 3π | 10.44 (0.0429) | 10.19 (0.0408) | 10.33 (0.0511) | 10.58 (0.0511) |
| 2π | 12.18 (0.0655) | 12.34 (0.0636) | 12.30 (0.0631) | 12.04 (0.0601) |
| 1π | 14.15 (0.0528) | 14.18 (0.0530) | 14.20 (0.0533) | 14.27 (0.0549) |
| 26σ | 9.18 (0.2224) | 9.16 (0.2354) | 9.22 (0.2353) | 9.57 (0.2135) |
| 25σ | 12.44 (0.0493) | 11.92 (0.0446) | 12.04 (0.0546) | 12.52 (0.0443) |
| 24σ | 13.06 (0.0508) | 13.24 (0.0554) | 12.79 (0.0453) | ~12.9 b (0.089) |
| 23σ | 13.41 (0.0802) | 13.98(0.0693) | 14.08 (0.0546) | 13.22 (0.0751) |
| 22σ | 14.03 (0.0637) | 14.29 (0.0501) | 14.13 (0.0444) | 14.06 (0.0575) |
| 21σ | 14.73 (0.0502) | ~14.7 b (0.0504) | 14.73 (0.0593) | 14.73 (0.0542) |
| 20σ | 15.63 (0.0683) | 15.21 (0.0840) | 15.39 (0.0813) | 15.41 (0.0640) |
| 19σ | 15.96 (0.1277) | 16.03 (0.1192) | 15.90 (0.1275) | 15.90 (0.1173) |
| 18σ | 17.31 (0.1197) | 17.57 (0.1003) | 17.60 (0.1058) | 17.41 (0.1203) |
| 17σ | 18.66 (0.2008) | 18.82 (0.212) | 18.79 (0.2240) | 18.82 (0.2020) |
| 16σ | 19.22 (0.2565) | 19.21 (0.2483) | 19.18 (0.2619) | 19.18 (0.2450) |
| 15σ | 20.11 (0.2364) | 20.17 (0.2310) | 20.11 (0.2213) | 20.08 (0.2544) |
| 14σ | 22.60 (0.4581) | 22.56 (0.4403) | ~22.8 b (0.4536) | 22.65 (0.4506) |
| 13σ | 23.77 (0.4929) | ~23.4 b (0.5260) | 23.30 (0.4915) | 23.37 (0.4881) |
| 12σ | 24.57 (0.5415) | 24.04 (0.5327) | 24.69 (0.5583) | 24.85 (0.5656) |
| 11σ | 28.12 (0.6945) | 28.20 (0.7018) | 28.19 (0.6963) | 27.98 (0.6628) |
| 10σ | 29.75 (0.7095) | ~29.9 b (0.6993) | 29.86 (0.7016) | 29.84 (0.7255) |
| C3 (289.77) c | C3 290.18 | C4 290.28 | C5 290.05 | |
| C6 290.07 | C9 290.34 | C3 290.34 | C3 290.06 | |
| C7 290.57 | C7 (290.37) c | C9 290.70 | C9 290.34 | |
| C5 290.61 | C6 290.59 | C5 290.71 | C4 290.35 | |
| C9 290.80 | C4 290.71 | C7 291.07 | C6 290.67 | |
| C8 (291.01) c | C2 291.17 | C2 291.34 | C2 291.05 | |
| C2 291.05 | C6 (291.37) c | C8 (291.23) c | C8 (291.54) c | |
| N4 404.06 | N5 404.01 | N6 404.21 | N7 404.36 | |
| N1 406.30 | N1 406.39 | N1 406.57 | N1 406.13 |
a ΔPBE0(SAOP)/et-pVQZ//B3LYP/6-31G(d) for valence electrons; ΔPW86xPW91c + Crel for core electrons; approximate relative intensities for XPS (based on the Gelius model) in parentheses. b Estimated, for nonconvergent cation. c mKT + shift.
Table 11.
Predicted X-ray emission spectrum of indole and 7-azaindole: ΔE in eV, f-value in parentheses.
Table 11.
Predicted X-ray emission spectrum of indole and 7-azaindole: ΔE in eV, f-value in parentheses.
| Indole | 7-Azaindole | ||
|---|---|---|---|
| Core Hole @ N1 | N1 | N7 | |
| 5π | 398.22 (0.0061) | 397.91 (0.0040) | 396.14 (0.0019) |
| 4π | 397.76 (0.0040) | 397.46 (0.0082) | 395.69 (0.0028) |
| 3π | 396.19 (0.0037) | 395.55 (0.0027) | 393.78 (0.0076) |
| 2π | 394.62 (0.0064) | 394.09 (0.0082) | 392.32 (0.0084) |
| 1π | 392.25 (0.0019) | 391.86 (0.0111) | 390.09 (0.0042) |
| 26σ | 394.65 (0.0005) | 396.56 (0.0007) | 394.79 (0.0252) |
| 25σ | 394.03 (0.0009) | 393.61 (0.0004) | 391.84 (0.0033) |
| 24σ | 393.07 (0.0033) | 393.23 (0.0023) | 391.46 (0.0038) |
| 23σ | 302.49 (0.0004) | 392.91 (0.0027) | 391.14 (0.0026) |
| 22σ | 391.98 (0.0143) | 392.07 (0.0024) | 390.30 (0.0020) |
| 21σ | 391.92 (0.0079) | 391.40 (0.0071) | 389.63 (0.0033) |
| 20σ | 390.88 (0.0006) | 390.72 (0.0036) | 388.95 (0.0043) |
| 19σ | 390.55 (0.0084) | 390.23 (0.0058) | 388.46 (0.0010) |
| 18σ | 388.96 (0.0068) | 388.72 (0.0076) | 386.95 (0.0030) |
| 17σ | 387.74 (0.0051) | 387.31 (0.0095) | 385.54 (0.0010) |
| 16σ | 387.32 (0.0072) | 386.95 (0.0027) | 385.18 (0.0066) |
| 15σ | 386.58 (0.0065) | 386.05 (0.0057) | 384.28 (0.0002) |
| 14σ | 383.94 (0.0022) | 383.48 (0.0038) | 381.71 (0.0029) |
| 13σ | 383.42 (0.0024) | 382.78 (0.0011) | 380.99 (0.0002) |
| 12σ | 382.09 (0.0016) | 381.28 (0.0006) | 379.51 (0.0001) |
| 11σ | 380.52 (0.0003) | 378.15 (0.0003) | 376.38 (0.0017) |
| 10σ | 376.57 (0.0005) | 376.29 (0.0005) | 374.52 (0.0004) |
Table 12.
Predicted X-ray emission spectrum of azaindoles: ΔE in eV, f-value in parentheses.
| 4-Azaindole | 5-Azaindole | 6-Azaindole | ||||
|---|---|---|---|---|---|---|
| N1 | N4 | N1 | N5 | N1 | N6 | |
| 5π | 398.01 (0.0039) | 395.77 (0.0038) | 398.23 (0.0047) | 395.85 (0.0002) | 398.32 (0.0088) | 395.96 (0.0018) |
| 4π | 397.69 (0.0092) | 395.45 (0.0018) | 397.30 (0.0076) | 394.92 (0.0099) | 397.76 (0.0008) | 395.40 (0.0052) |
| 3π | 395.86 (0.0004) | 393.62 (0.0261) | 396.20 (0.0027) | 393.82 (0.0002) | 396.24 (0.0056) | 393.88 (0.0032) |
| 2π | 394.12 (0.0002) | 391.88 (0.0053) | 394.05 (0.0063) | 391.67 (0.0130) | 394.27 (0.0061) | 391.91 (0.0128) |
| 1π | 392.15 (0.0120) | 389.91 (0.0022) | 392.21 (0.0132) | 389.83 (0.0010) | 392.37 (0.0131) | 390.01 (0.0013) |
| 26σ | 397.12 (0.0005) | 394.88 (0.0055) | 397.23 (0.0001) | 394.85 (0.0276) | 397.35 (0.0003) | 394.99 (0.0273) |
| 25σ | 393.86 (0.0089) | 391.62 (0.0110) | 394.47 (0.0003) | 392.09 (0.0046) | 394.53 (0.0014) | 392.17 (0.0044) |
| 24σ | 393,24 (0.0025) | 391.00 (0.0038) | 393.15 (0.0035) | 390.77 (0.0010) | 393.76 (0.0005) | 391.42 (0.0025) |
| 23σ | 392.89 (0.0021) | 390.65 (0.0011) | 392.41 (0.0013) | 390.03 (0.0030) | 392.49(0.0015) | 390.13 (0.0032) |
| 22σ | 392.27 (0.0020) | 390.03 (0.0020) | 392.10 (0.0035) | 389.72 (0.0024) | 392.44(0.0015) | 390.08 (0.0005) |
| 21σ | 391.57 (0.0070) | 389.33 (0.0035) | 391.69 (0.0073) | 389.31 (0.0027) | 391.84 (0.0091) | 389.48 (0.0032) |
| 20σ | 390.67 (0.0002) | 388.43 (0.0037) | 391.18 (0.0071) | 388.80 (0.0044) | 391.18 (0.0018) | 388.82 (0.0058) |
| 19σ | 390.34 (0.0104) | 388.10 (0.0029) | 390.36 (0.0064) | 387.98 (0.0028) | 390.67 (0.0085) | 388.31 (0.0007) |
| 18σ | 388.99 (0.0073) | 386.75 (0.0004) | 388.82 (0.0067) | 386.44 (0.0022) | 388.97 (0.0071) | 386.61 (0.0043) |
| 17σ | 387.64 (0.0085) | 385.40 (0.0017) | 387.57 (0.0084) | 385.19 (0.0006) | 387.78 (0.0074) | 385.42 (0.0006) |
| 16σ | 387.08 (0.0034) | 384.84 (0.0053) | 387.18 (0.0044) | 384.80 (0.0036) | 387.39 (0.0054) | 385.03 (0.0004) |
| 15σ | 386.19 (0.0058) | 383.95 (0.0019) | 386.22 (0.0072) | 383.84 (0.0022) | 386.46 (0.0057) | 384.10 (0.0044) |
| 14σ | 383.70 (0.0034) | 381.46 (0.0011) | 383.83 (0.0020) | 381.45 (0.0025) | 383.77 (0.0009) | 381.41 (0.0021) |
| 13σ | 382.53 (0.0018) | 380.29 (0.0010) | 382.99 (0.0019) | 380.61 (0.0004) | 383.27 (0.0039) | 380.91 (0.0006) |
| 12σ | 381.73 (0.0009) | 379.49 (0.0002) | 382.35 (0.0013) | 379.97 (0.0002) | 381.88 (0.0009) | 379.52 (0.0001) |
| 11σ | 378.18 (0.0000) | 375.94 (0.0019) | 378.19 (0.0000) | 375.81 (0.0019) | 378.38 (0.0000) | 376.02 (0.0019) |
| 10σ | 376.55 (0.0005) | 374.31 (0.0001) | 376.49 (0.0005) | 374.11 (0.0000) | 376.71 (0.0005) | 374.35 (0.0000) |
Publisher’s Note: MDPI stays neutral with regard to jurisdictional claims in published maps and institutional affiliations. |
© 2021 by the author. Licensee MDPI, Basel, Switzerland. This article is an open access article distributed under the terms and conditions of the Creative Commons Attribution (CC BY) license (https://creativecommons.org/licenses/by/4.0/).
Share and Cite
MDPI and ACS Style
Chong, D.P. Computational Study of the Electron Spectra of Vapor-Phase Indole and Four Azaindoles. Molecules 2021, 26, 1947. https://0-doi-org.brum.beds.ac.uk/10.3390/molecules26071947
AMA Style
Chong DP. Computational Study of the Electron Spectra of Vapor-Phase Indole and Four Azaindoles. Molecules. 2021; 26(7):1947. https://0-doi-org.brum.beds.ac.uk/10.3390/molecules26071947
Chicago/Turabian StyleChong, Delano P. 2021. "Computational Study of the Electron Spectra of Vapor-Phase Indole and Four Azaindoles" Molecules 26, no. 7: 1947. https://0-doi-org.brum.beds.ac.uk/10.3390/molecules26071947