
1H-NMR Profiling Shows as Specific Constituents Strongly Affect the International EVOO Blends Characteristics: The Case of the Italian Oil

 ,
,  ,
,  ,
,
Abstract
:
1. Introduction
2. Materials and Methods
2.1. Sample Preparation
2.2. 1H-NMR Analysis
2.3. Multivariate Statistical Analysis Applied to NMR Data
3. Results and Discussion
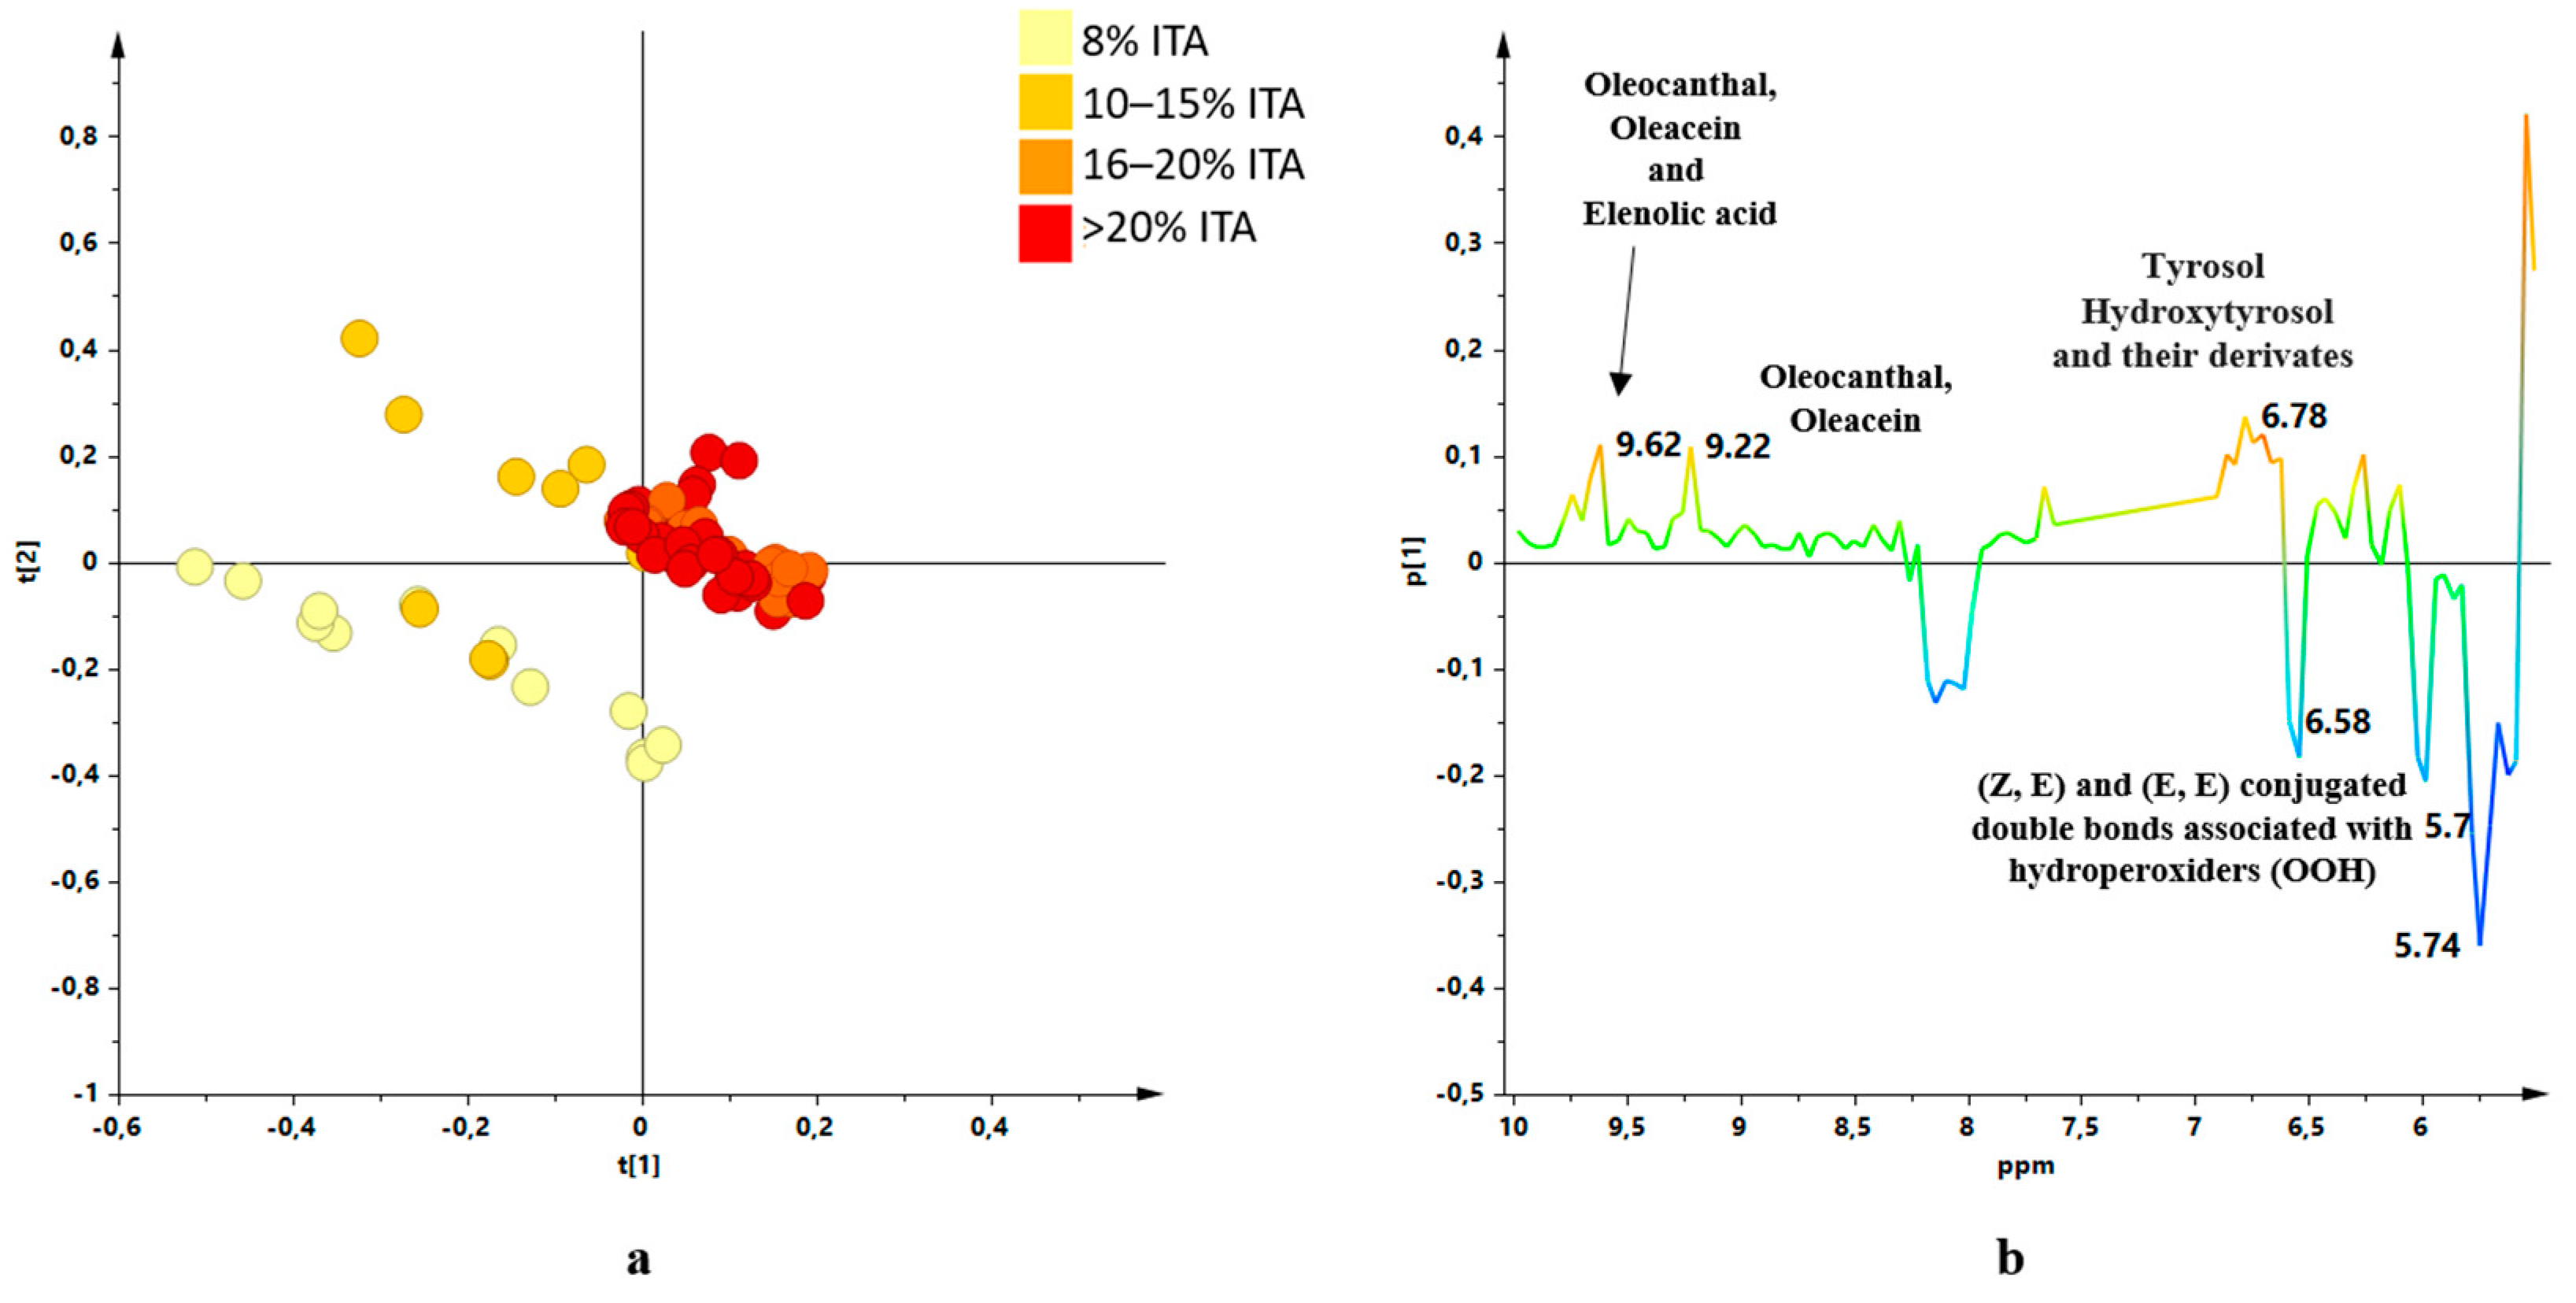
3.1. Unsupervised Analysis
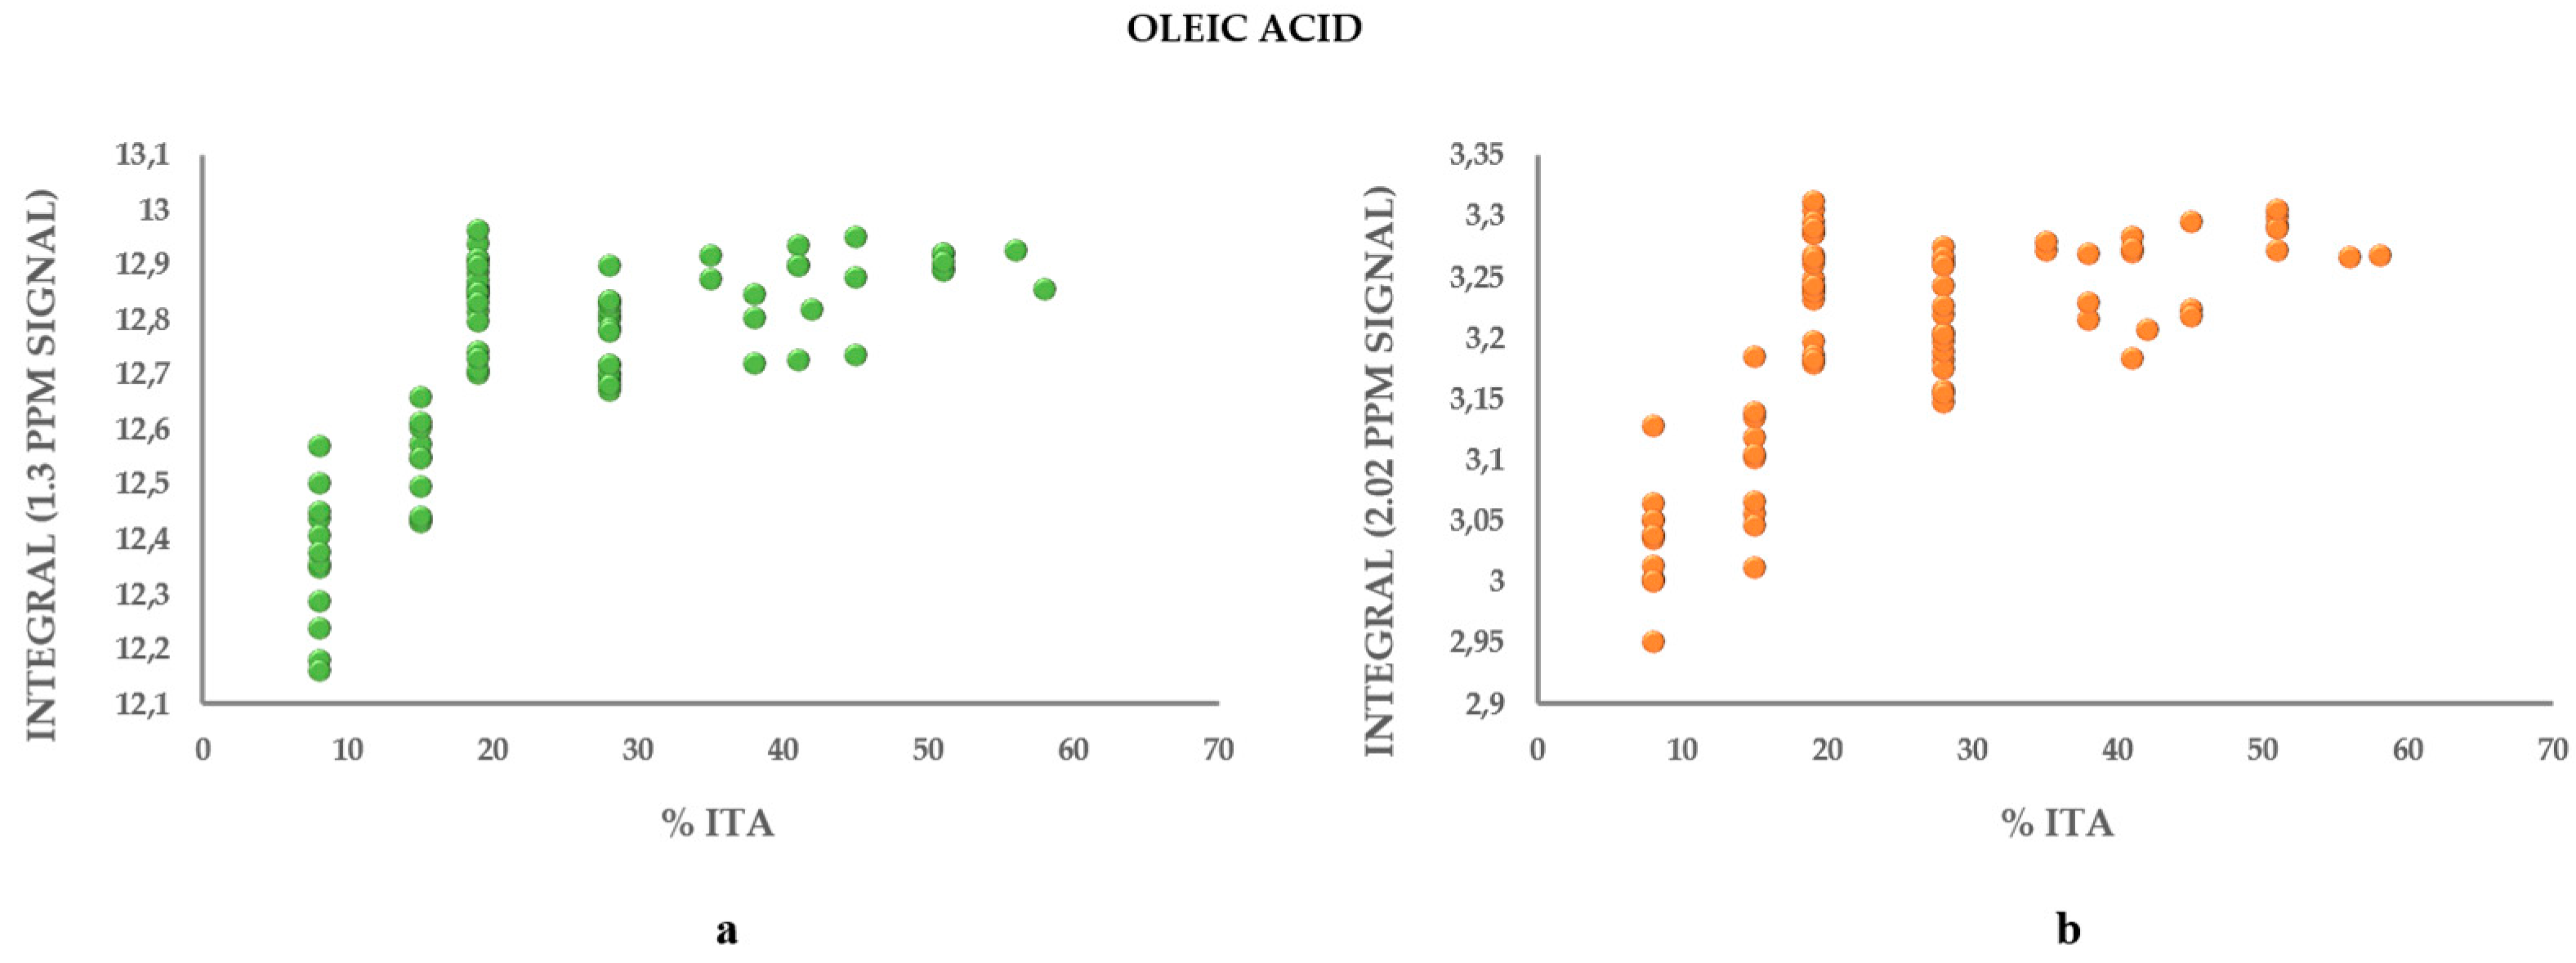
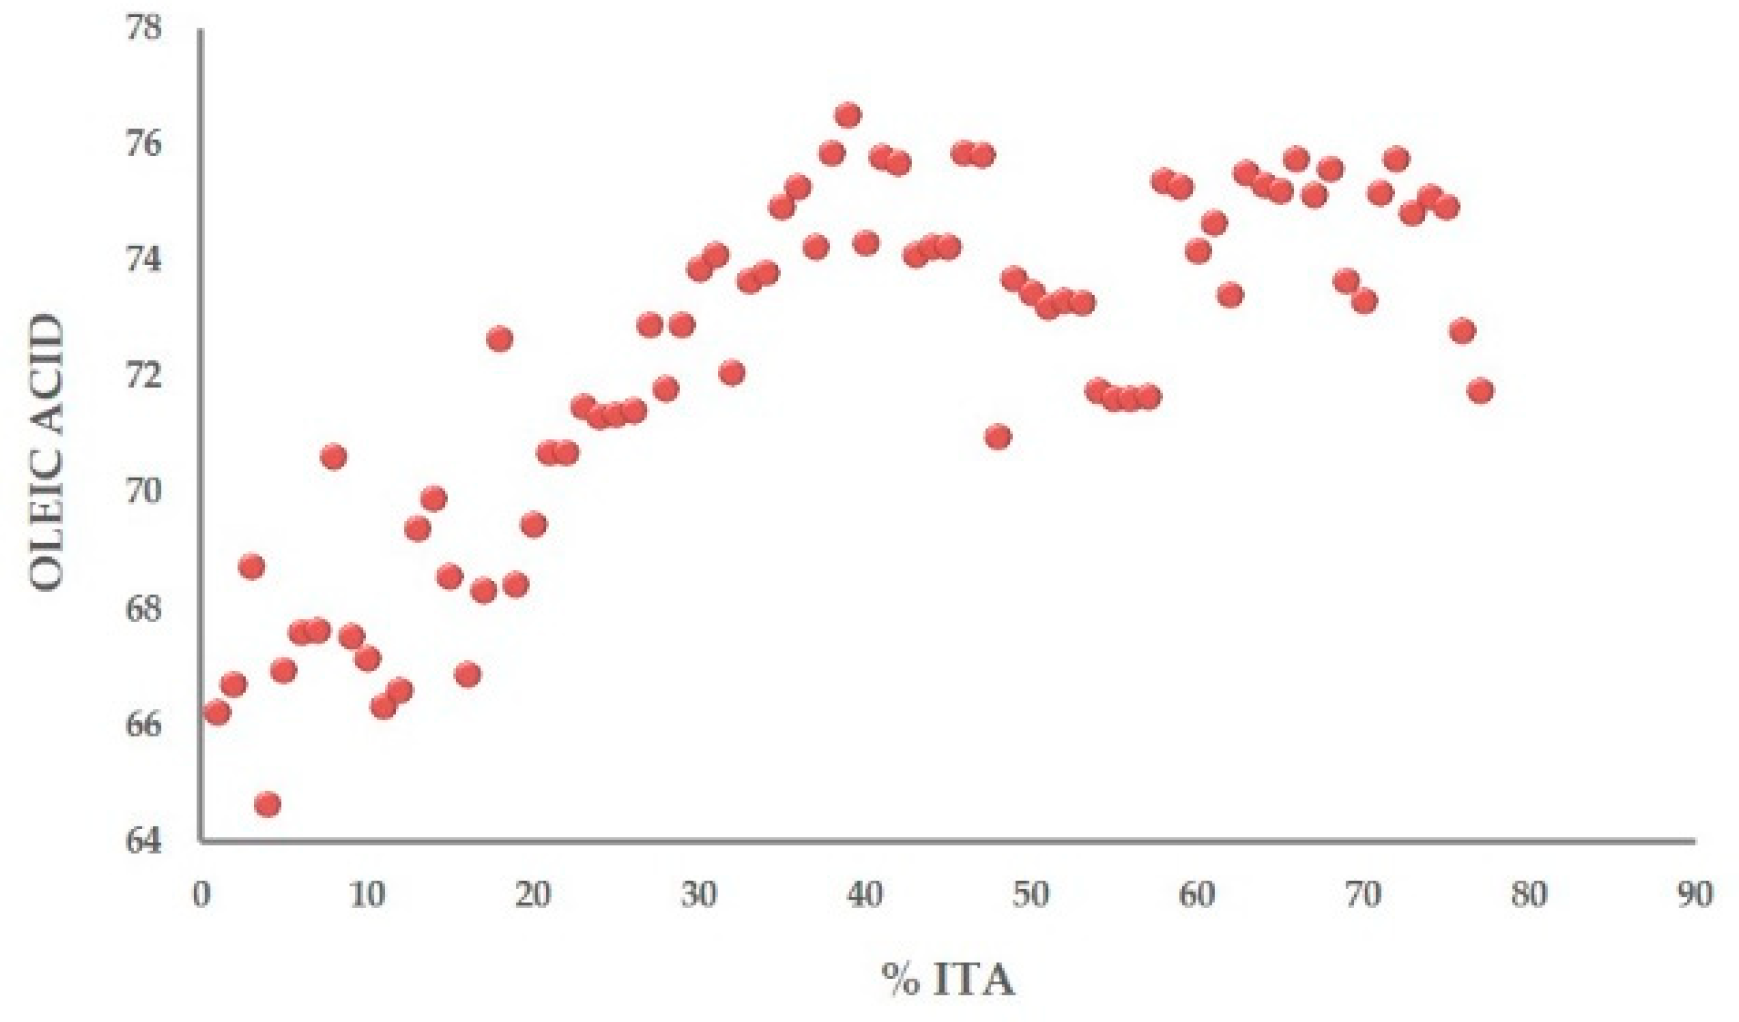
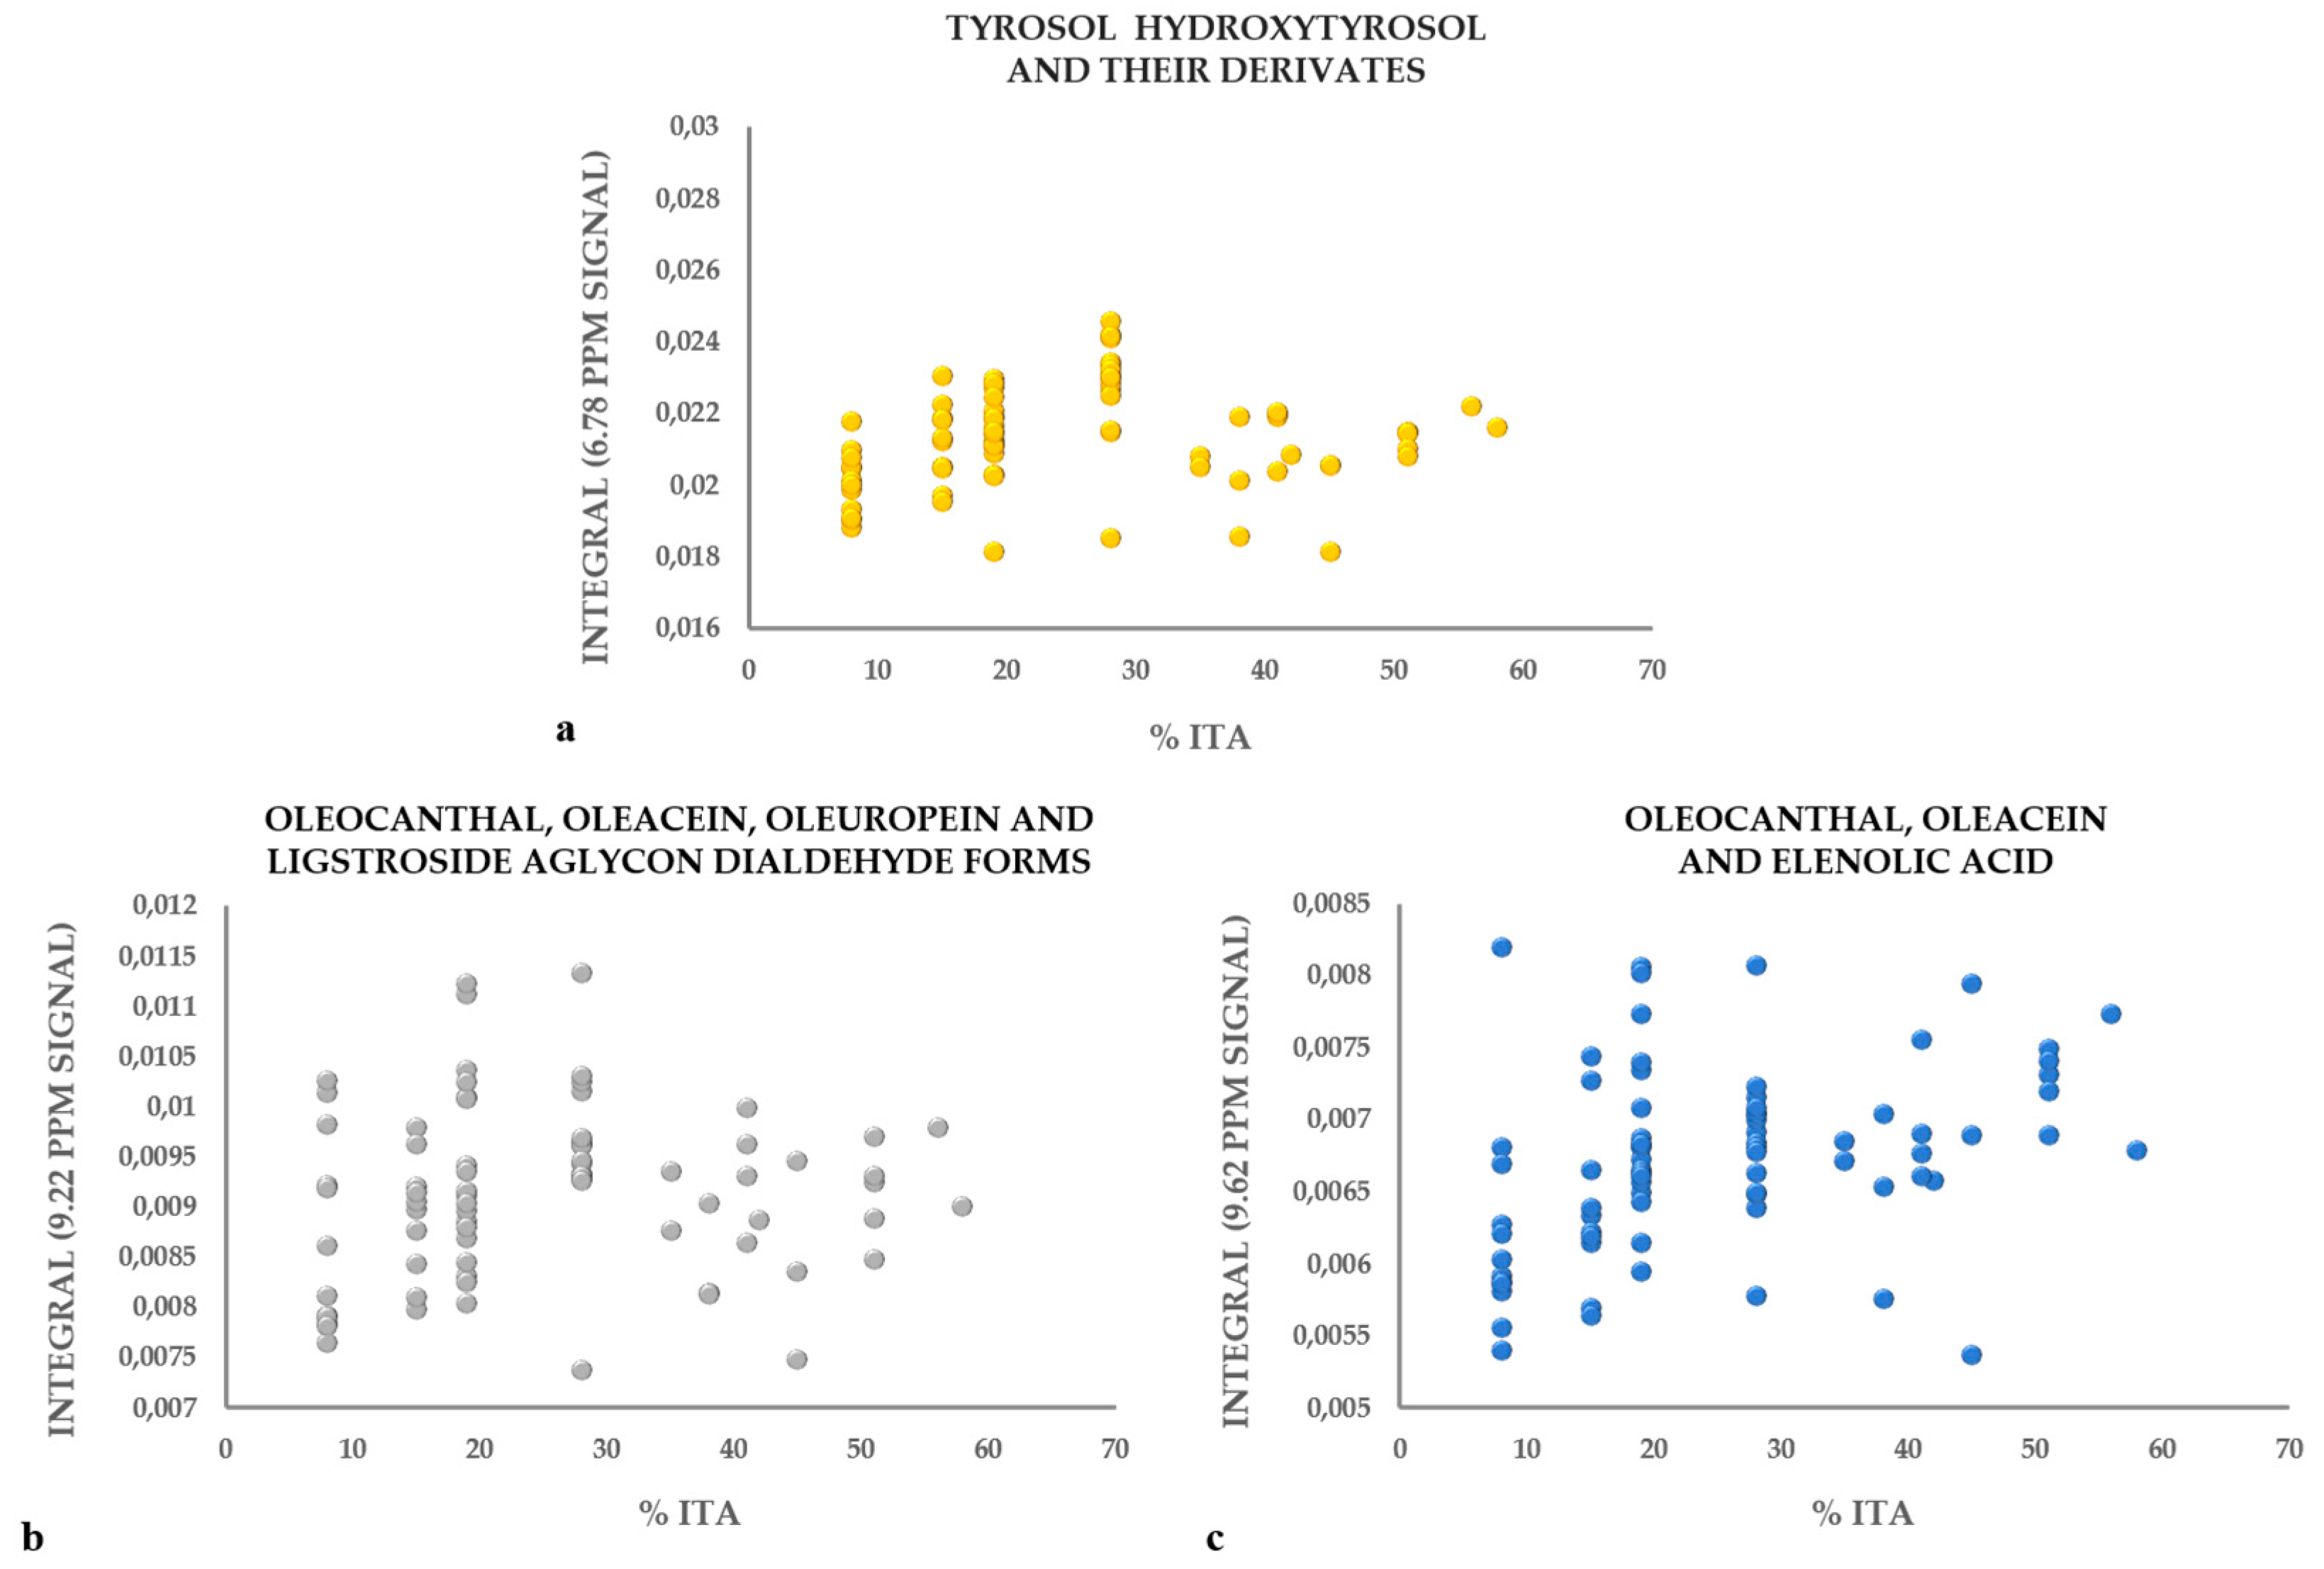
3.2. Linear Regression Analysis
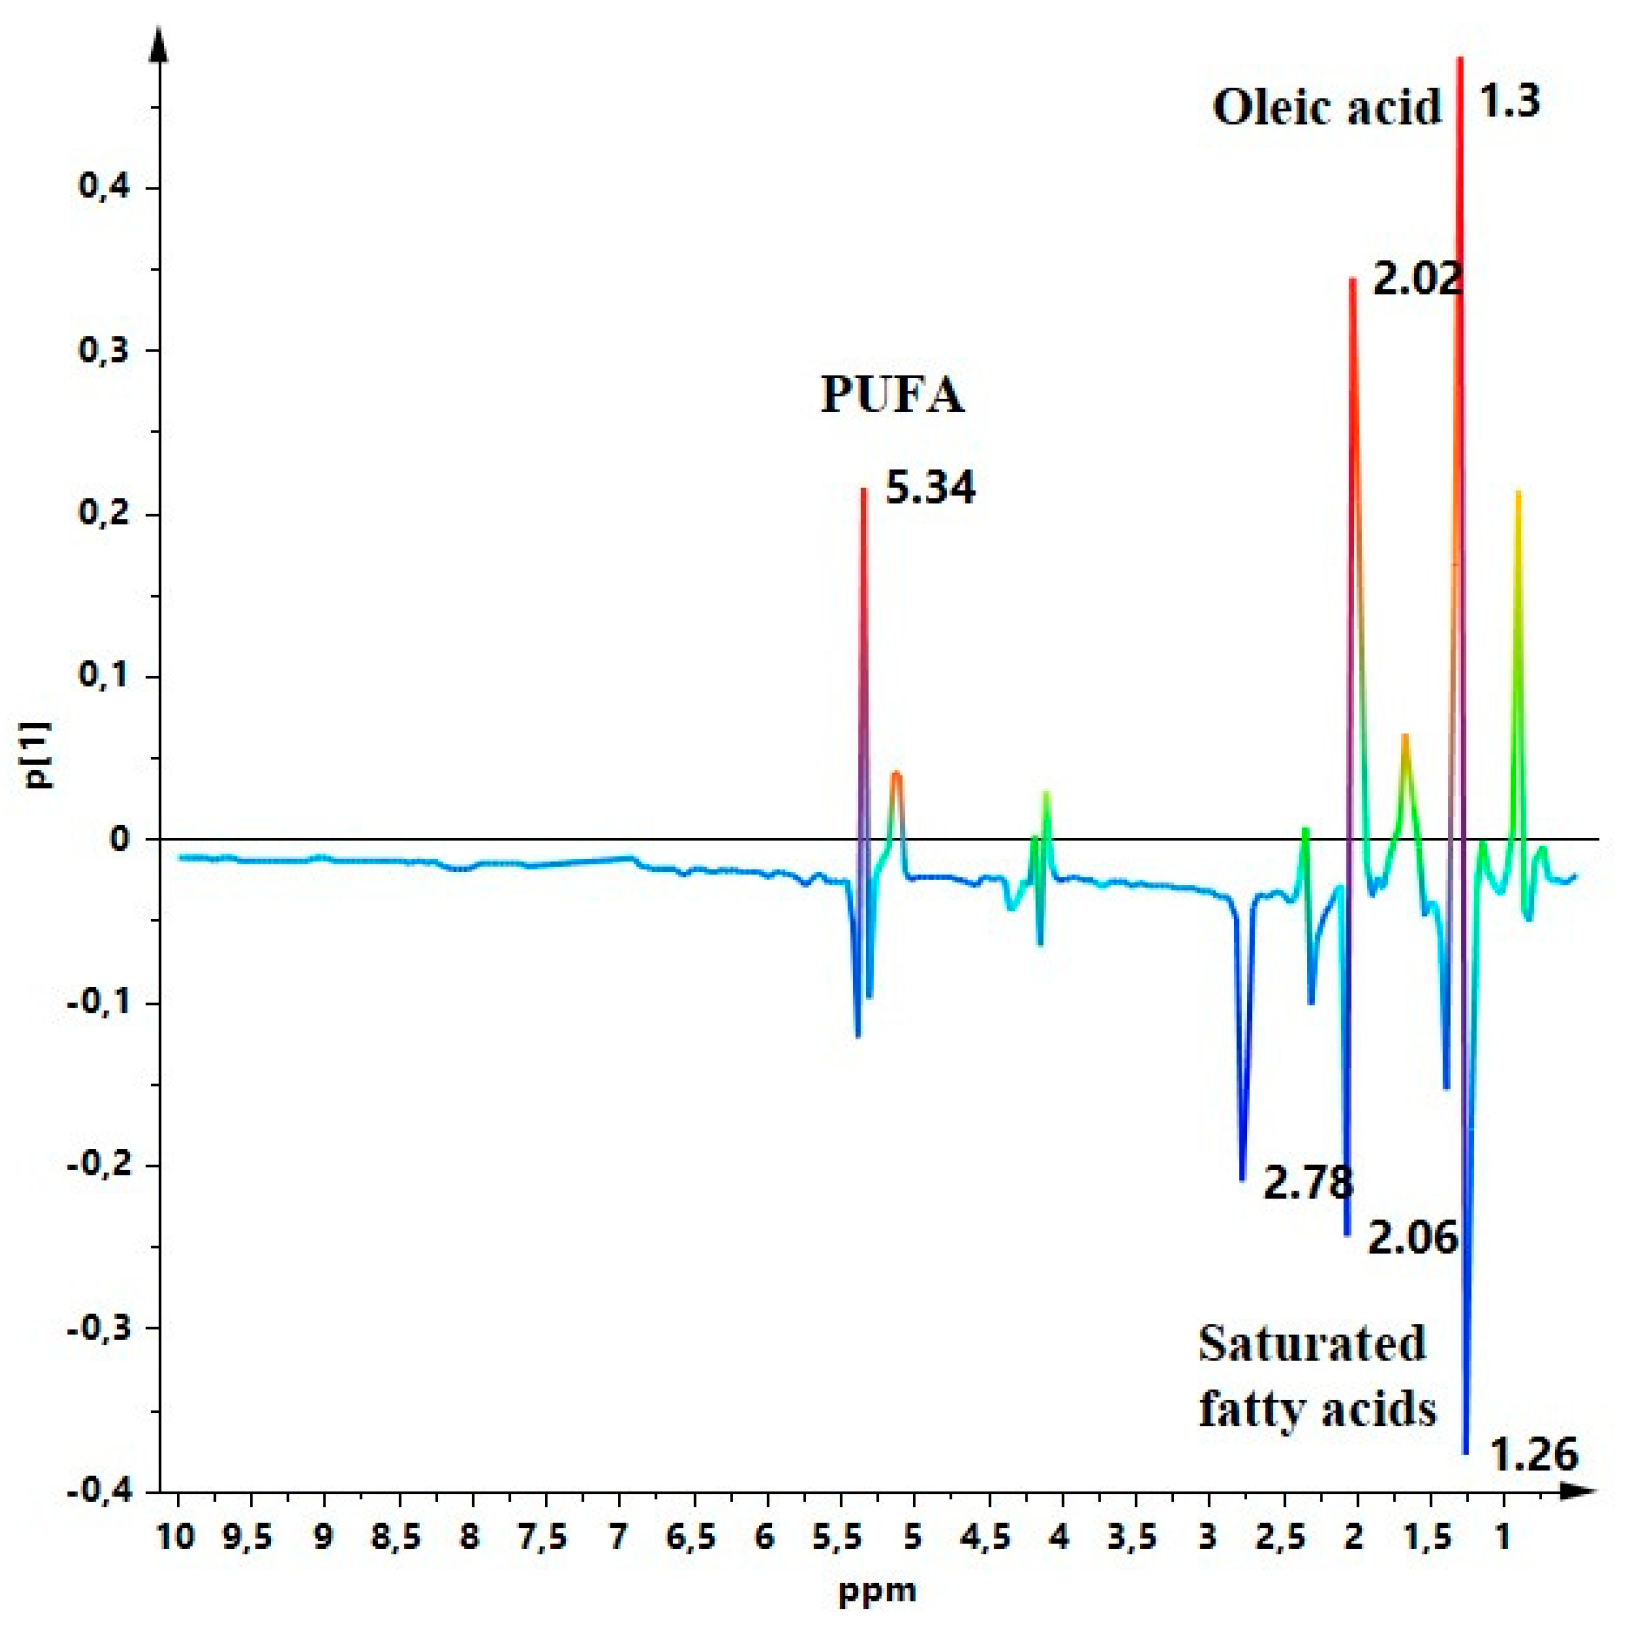
3.3. Metabolic Profile
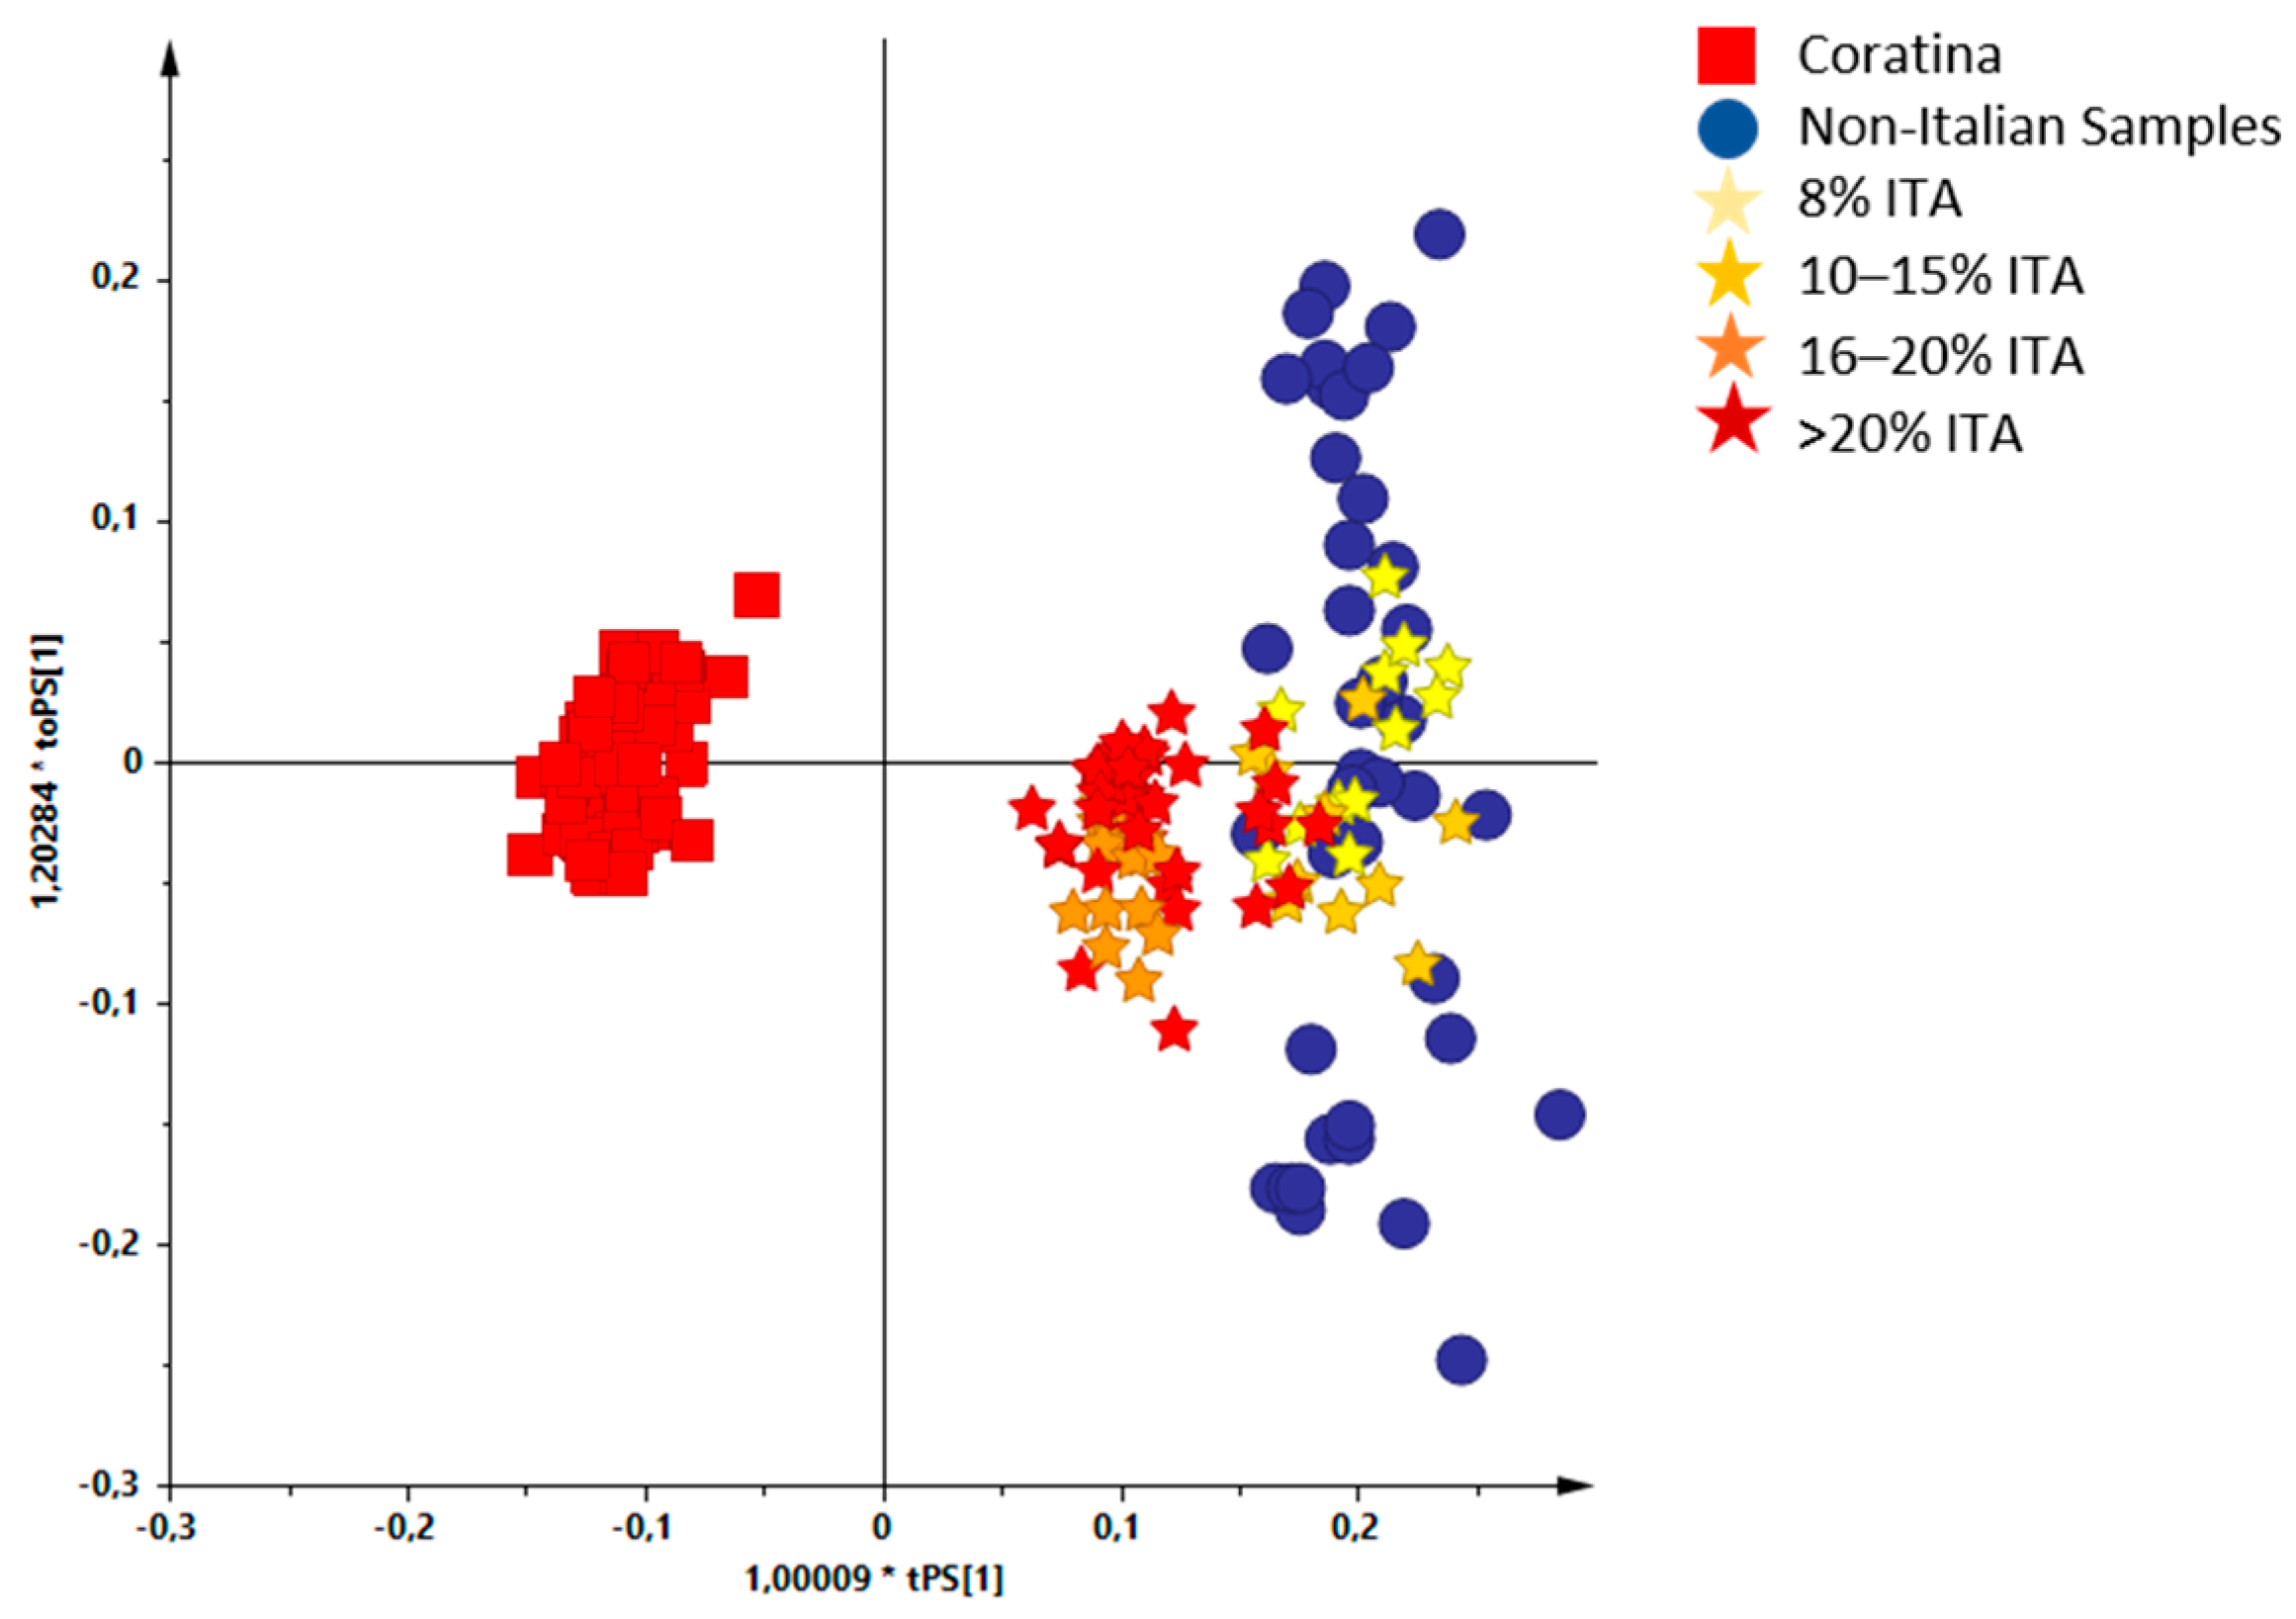
3.4. Supervised Analysis with Coratina and Non-Italian Oils
4. Conclusions
Supplementary Materials
Author Contributions
Funding
Institutional Review Board Statement
Informed Consent Statement
Data Availability Statement
Acknowledgments
Conflicts of Interest
Sample Availability
References
- Del Monaco, G.; Officioso, A.; D’Angelo, S.; Cara, F.; Ionata, E.; Marcolongo, L.; Squillaci, G.; Maurelli, L.; Morana, A. Characterization of Extra Virgin Olive Oils Produced with Typical Italian Varieties by Their Phenolic Profile. Food Chem. 2015, 184, 220–228. [Google Scholar] [CrossRef]
- Cicerale, S.; Lucas, L.J.; Keast, R.S.J. Antimicrobial, Antioxidant and Anti-inflammatory Phenolic Activities in Extra Virgin Olive Oil. Curr. Opin. Biotechnol. 2012, 23, 129–135. [Google Scholar] [CrossRef] [PubMed]
- Visioli, F.; Davalos, A.; de las Hazas, M.-C.L.; Crespo, M.C.; Tomé-Carneiro, J. An Overview of the Pharmacology of Olive Oil and Its Active Ingredients. Br. J. Pharmacol. 2020, 177, 1316–1330. [Google Scholar] [CrossRef] [PubMed] [Green Version]
- Różańska, A.; Russo, M.; Cacciola, F.; Salafia, F.; Polkowska, Ż.; Dugo, P.; Mondello, L. Concentration of Potentially Bioactive Compounds in Italian Extra Virgin Olive Oils from Various Sources by Using LC-MS and Multivariate Data Analysis. Foods 2020, 9, 1120. [Google Scholar] [CrossRef] [PubMed]
- European Commission Food Safety and Quality–Certification–Quality Labels–Geographical Indications Register. Available online: https://ec.europa.eu/info/food-farming-fisheries/food-safety-and-quality/certification/quality-labels/geographical-indications-register/ (accessed on 12 February 2021).
- Bajoub, A.; Bendini, A.; Fernández-Gutiérrez, A.; Carrasco-Pancorbo, A. Olive Oil Authentication: A Comparative Analysis of Regulatory Frameworks with Especial Emphasis on Quality and Authenticity Indices, and Recent Analytical Techniques Developed for Their Assessment. A Review. Crit. Rev. Food Sci. Nutr. 2018, 58, 832–857. [Google Scholar] [CrossRef]
- Girelli, C.R.; Del Coco, L.; Zelasco, S.; Salimonti, A.; Conforti, F.L.; Biagianti, A.; Barbini, D.; Fanizzi, F.P. Traceability of “Tuscan PGI” Extra Virgin Olive Oils by 1H NMR Metabolic Profiles Collection and Analysis. Metabolites 2018, 8, 60. [Google Scholar] [CrossRef] [PubMed] [Green Version]
- Girelli, C.R.; Del Coco, L.; Fanizzi, F.P. Tunisian Extra Virgin Olive Oil Traceability in the EEC Market: Tunisian/Italian (Coratina) EVOOs Blend as a Case Study. Sustainability 2017, 9, 1471. [Google Scholar] [CrossRef] [Green Version]
- Dabbou, S.; Sifi, S.; Rjiba, I.; Esposto, S.; Taticchi, A.; Servili, M.; Montedoro, G.F.; Hammami, M. Effect of Pedoclimatic Conditions on the Chemical Composition of the Sigoise Olive Cultivar. Chem. Biodivers. 2010, 7, 898–908. [Google Scholar] [CrossRef]
- Mannina, L.; Patumi, M.; Proietti, N.; Bassi, D.; Segre, A. Geographical Characterization of Italian Extra Virgin Olive Oils Using High-Field 1H NMR Spectroscopy. J. Agric. Food Chem. 2001, 49, 2687–2696. [Google Scholar] [CrossRef] [PubMed]
- Mannina, L.; D’Imperio, M.; Capitani, D.; Rezzi, S.; Guillou, C.; Mavromoustakos, T.; Vilchez, M.D.M.; Fernández, A.H.; Thomas, F.; Aparicio, R. 1H NMR-Based Protocol for the Detection of Adulterations of Refined Olive Oil with Refined Hazelnut Oil. J. Agric. Food Chem. 2009, 57, 11550–11556. [Google Scholar] [CrossRef]
- Conte, L.; Bendini, A.; Valli, E.; Lucci, P.; Moret, S.; Maquet, A.; Lacoste, F.; Brereton, P.; García-González, D.L.; Moreda, W.; et al. Olive Oil Quality and Authenticity: A Review of Current EU Legislation, Standards, Relevant Methods of Analyses, Their Drawbacks and Recommendations for the Future. Trends Food Sci. Technol. 2020, 105, 483–493. [Google Scholar] [CrossRef]
- Consonni, R.; Cagliani, L.R. NMR Studies on Italian PDO Olive Oils and Their Potential in Olive-Tree-Derived Products Characterization. Eur. J. Lipid Sci. Technol. 2019, 121, 1800174. [Google Scholar] [CrossRef]
- Almeida, D.S.; Oliveira, D.F.; Souza, A.S.; Silva, A.C.; Anjos, M.J.; Lopes, R.T. Characterization of Vegetable Oils through Scattered Radiation and Multivariate Analysis. Radiat. Phys. Chem. 2019, 156, 245–251. [Google Scholar] [CrossRef]
- Malechaux, A.; Le Dréau, Y.; Artaud, J.; Dupuy, N. Exploring the Scientific Interest for Olive Oil Origin: A Bibliometric Study from 1991 to 2018. Foods 2020, 9, 556. [Google Scholar] [CrossRef]
- Ghisoni, S.; Lucini, L.; Angilletta, F.; Rocchetti, G.; Farinelli, D.; Tombesi, S.; Trevisan, M. Discrimination of Extra-Virgin-Olive Oils from Different Cultivars and Geographical Origins by Untargeted Metabolomics. Food Res. Int. 2019, 121, 746–753. [Google Scholar] [CrossRef]
- Alonso-Salces, R.M.; Moreno-Rojas, J.M.; Holland, M.V.; Reniero, F.; Guillou, C.; Héberger, K. Virgin Olive Oil Authentication by Multivariate Analyses of 1H NMR Fingerprints and Δ13C and Δ2H Data. J. Agric. Food Chem. 2010, 58, 5586–5596. [Google Scholar] [CrossRef]
- Laroussi-Mezghani, S.; Vanloot, P.; Molinet, J.; Dupuy, N.; Hammami, M.; Kamoun, N.; Artaud, J. Authentication of Tunisian Virgin Olive Oils by Chemometric Analysis of Fatty Acid Compositions and NIR Spectra. Comparison with Maghrebian and French Virgin Olive Oils. Food Chem. 2014, 173, 122–152. [Google Scholar] [CrossRef]
- Peres, F.; Jeleń, H.H.; Majcher, M.M.; Arraias, M.; Martins, L.L.; Ferreira-Dias, S. Characterization of Aroma Compounds in Portuguese Extra Virgin Olive Oils from Galega Vulgar and Cobrançosa Cultivars Using GC–O and GC×GC–ToFMS. Food Res. Int. 2013, 54, 1979–1986. [Google Scholar] [CrossRef] [Green Version]
- Longobardi, F.; Ventrella, A.; Casiello, G.; Sacco, D.; Tasioula-Margari, M.; Kiritsakis, A.K.; Kontominas, M.G. Characterisation of the Geographical Origin of Western Greek Virgin Olive Oils Based on Instrumental and Multivariate Statistical Analysis. Food Chem. 2012, 133, 169–175. [Google Scholar] [CrossRef]
- Becerra-Herrera, M.; Vélez-Martín, A.; Ramos-Merchante, A.; Richter, P.; Beltrán, R.; Sayago, A. Characterization and Evaluation of Phenolic Profiles and Color as Potential Discriminating Features among Spanish Extra Virgin Olive Oils with Protected Designation of Origin. Food Chem. 2018, 241, 328–337. [Google Scholar] [CrossRef]
- Rongai, D.; Sabatini, N.; Del Coco, L.; Perri, E.; Del Re, P.; Simone, N.; Marchegiani, D.; Fanizzi, F.P. 1H NMR and Multivariate Analysis for Geographic Characterization of Commercial Extra Virgin Olive Oil: A Possible Correlation with Climate Data. Foods 2017, 6, 96. [Google Scholar] [CrossRef] [PubMed] [Green Version]
- Mannina, L.; Sobolev, A. High Resolution NMR Characterization of Olive Oils in Terms of Quality, Authenticity and Geographical Origin. Magn. Reson. Chem. 2011, 49 (Suppl. 1), S3–S11. [Google Scholar] [CrossRef]
- Hoffman, R.E. Standardization of Chemical Shifts of TMS and Solvent Signals in NMR Solvents. Magn. Reson. Chem. 2006, 44, 606–616. [Google Scholar] [CrossRef]
- Barison, A.; da Silva, C.W.P.; Campos, F.R.; Simonelli, F.; Lenz, C.A.; Ferreira, A.G. A Simple Methodology for the Determination of Fatty Acid Composition in Edible Oils through 1H NMR Spectroscopy. Magn. Reson. Chem. 2010, 48, 642–650. [Google Scholar] [CrossRef]
- Ruiz-Aracama, A.; Goicoechea, E.; Guillén, M.D. Direct Study of Minor Extra-Virgin Olive Oil Components without Any Sample Modification. 1H NMR Multisupression Experiment: A Powerful Tool. Food Chem. 2017, 228, 301–314. [Google Scholar] [CrossRef] [PubMed]
- Alonso-Salces, R.; Holland, M.V.; Guillou, C.; Héberger, K. Quality Assessment of Olive Oil by 1H-NMR Fingerprinting; INTECH Open Access Publisher: London, UK, 2012; ISBN 978-953-307-921-9. [Google Scholar]
- Coco, L.D.; Pascali, S.A.D.; Fanizzi, F.P. NMR-Metabolomic Study on Monocultivar and Blend Salento EVOOs Including Some from Secular Olive Trees. Food Nutr. Sci. 2014, 5, 89–95. [Google Scholar] [CrossRef] [Green Version]
- van den Berg, R.A.; Hoefsloot, H.C.; Westerhuis, J.A.; Smilde, A.K.; van der Werf, M.J. Centering, Scaling, and Transformations: Improving the Biological Information Content of Metabolomics Data. BMC Genom. 2006, 7, 142. [Google Scholar] [CrossRef] [Green Version]
- Jackson, J.E. A User’s Guide to Principal Components; John Wiley & Sons: Hoboken, NJ, USA, 2005; ISBN 978-0-471-72532-9. [Google Scholar]
- Kettaneh, N.; Berglund, A.; Wold, S. PCA and PLS with Very Large Data Sets. Comput. Stat. Data Anal. 2005, 48, 69–85. [Google Scholar] [CrossRef]
- Pérez-Enciso, M.; Tenenhaus, M. Prediction of Clinical Outcome with Microarray Data: A Partial Least Squares Discriminant Analysis (PLS-DA) Approach. Hum. Genet. 2003, 112, 581–592. [Google Scholar] [CrossRef]
- Boccard, J.; Rutledge, D.N. A Consensus Orthogonal Partial Least Squares Discriminant Analysis (OPLS-DA) Strategy for Multiblock Omics Data Fusion. Anal. Chim. Acta 2013, 769, 30–39. [Google Scholar] [CrossRef]
- Wold, S.; Eriksson, L.; Trygg, J.; Kettaneh, N. The PLS Method—Partial Least Squares Projections to Latent Structures—And Its Applications in Industrial RDP (Research, Development, and Production); Umeå University: Umeå, Sweden, 2004. [Google Scholar]
- Trygg, J.; Wold, S. Orthogonal projections to latent structures (O-PLS). J. Chemom. 2002, 16, 119–128. [Google Scholar] [CrossRef]
- Wheelock, Å.M.; Wheelock, C.E. Trials and Tribulations of ‘omics Data Analysis: Assessing Quality of SIMCA-Based Multivariate Models Using Examples from Pulmonary Medicine. Mol. Biosyst. 2013, 9, 2589–2596. [Google Scholar] [CrossRef] [PubMed] [Green Version]
- Del Coco, L.; Mondelli, D.; Mezzapesa, G.; Miano, T.; Pascali, S.; Girelli, C.R.; Fanizzi, F. Protected Designation of Origin Extra Virgin Olive Oils Assessment by Nuclear Magnetic Resonance and Multivariate Statistical Analysis: “Terra Di Bari”, an Apulian (Southeast Italy) Case Study. J. Am. Oil Chem. Soc. 2016, 93, 1–9. [Google Scholar] [CrossRef]
- Eriksson, L.; Byrne, T.; Johansson, E.; Trygg, J.; Vikström, C. Multi- and Megavariate Data Analysis: Basic Principles and Applications; Umetrics Academy: Umeå, Sweden, 2013; ISBN 978-91-973730-5-0. [Google Scholar]
- Karkoula, E.; Skantzari, A.; Melliou, E.; Magiatis, P. Direct Measurement of Oleocanthal and Oleacein Levels in Olive Oil by Quantitative 1H NMR. Establishment of a New Index for the Characterization of Extra Virgin Olive Oils. J. Agric. Food Chem. 2012, 60, 11696–11703. [Google Scholar] [CrossRef]
- Sperry, J.B.; Smith, A.B. Chapter 160–Chemical Synthesis of Diverse Phenolic Compounds Isolated From Olive Oils. In Olives and Olive Oil in Health and Disease Prevention; Preedy, V.R., Watson, R.R., Eds.; Academic Press: San Diego, CA, USA, 2010; pp. 1439–1464. ISBN 978-0-12-374420-3. [Google Scholar]
- Esti, M.; Cinquanta, L.; La Notte, E. Phenolic Compounds in Different Olive Varieties. J. Agric. Food Chem. 1998, 46, 32–35. [Google Scholar] [CrossRef]
- Klikarová, J.; Česlová, L.; Kalendová, P.; Dugo, P.; Mondello, L.; Cacciola, F. Evaluation of Italian Extra Virgin Olive Oils Based on the Phenolic Compounds Composition Using Multivariate Statistical Methods. Eur. Food Res. Technol. 2020, 246, 1241–1249. [Google Scholar] [CrossRef]
- Hachicha Hbaieb, R.; Kotti, F.; Cortes-Francisco, N.; Caixach, J.; Gargouri, M.; Vichi, S. Ripening and Storage Conditions of Chétoui and Arbequina Olives: Part II. Effect on Olive Endogenous Enzymes and Virgin Olive Oil Secoiridoid Profile Determined by High Resolution Mass Spectrometry. Food Chem. 2016, 210, 631–639. [Google Scholar] [CrossRef]
- Olmo-Cunillera, A.; López-Yerena, A.; Lozano-Castellón, J.; Tresserra-Rimbau, A.; Vallverdú-Queralt, A.; Pérez, M. NMR Spectroscopy: A Powerful Tool for the Analysis of Polyphenols in Extra Virgin Olive Oil. J. Sci. Food Agric. 2020, 100, 1842–1851. [Google Scholar] [CrossRef]
- Inarejos-Garcia, A.M.; Androulaki, A.; Salvador, M.D.; Fregapane, G.; Tsimidou, M.Z. Discussion on the Objective Evaluation of Virgin Olive Oil Bitterness. Food Res. Int. 2009, 42, 279–284. [Google Scholar] [CrossRef]
- Angelis, A.; Antoniadi, L.; Stathopoulos, P.; Halabalaki, M.; Skaltsounis, L.A. Oleocanthalic and Oleaceinic Acids: New Compounds from Extra Virgin Olive Oil (EVOO). Phytochem. Lett. 2018, 26, 190–194. [Google Scholar] [CrossRef]
- Guillen, M.; Ruiz, A. Rapid Simultaneous Determination of Proton NMR of Unsaturation and Composition of Acyl Groups in Vegetable Oils. Eur. J. Lipid Sci. Technol. 2003, 105, 688–696. [Google Scholar] [CrossRef]
- Coco, L.D.; Perri, E.; Cesari, G.; Muzzalupo, I.; Zelasco, S.; Simeone, V.; Schena, F.P.; Fanizzi, F.P. NMR-Based Metabolomic Approach for EVOO from Secular Olive Trees of Apulia Region. Eur. J. Lipid Sci. Technol. 2013, 115, 1043–1052. [Google Scholar] [CrossRef]
- De Nino, A.; Mazzotti, F.; Perri, E.; Procopio, A.; Raffaelli, A.; Sindona, G. Virtual Freezing of the Hemiacetal–Aldehyde Equilibrium of the Aglycones of Oleuropein and Ligstroside Present in Olive Oils from Carolea and Coratina Cultivars by Ionspray Ionization Tandem Mass Spectrometry. J. Mass Spectrom. 2000, 35, 461–467. [Google Scholar] [CrossRef]
- Girelli, C.R.; Calò, F.; Angilè, F.; Mazzi, L.; Barbini, D.; Fanizzi, F.P. 1H NMR Spectroscopy to Characterize Italian Extra Virgin Olive Oil Blends, Using Statistical Models and Databases Based on Monocultivar Reference Oils. Foods 2020, 9, 1797. [Google Scholar] [CrossRef]
- Del Coco, L.; De Pascali, S.; Fanizzi, F. 1H NMR Spectroscopy and Multivariate Analysis of Monovarietal EVOOs as a Tool for Modulating Coratina-Based Blends. Foods 2014, 3, 238–249. [Google Scholar] [CrossRef] [Green Version]
- Girelli, C.R.; Del Coco, L.; Papadia, P.; De Pascali, S.A.; Fanizzi, F.P. Harvest Year Effects on Apulian EVOOs Evaluated by 1H NMR Based Metabolomics. PeerJ 2016, 4, e2740. [Google Scholar] [CrossRef] [Green Version]
- Del Coco, L.; Girelli, C.R.; Angilè, F.; Mascio, I.; Montemurro, C.; Distaso, E.; Tamburrano, P.; Chiurlia, S.; Clodoveo, M.L.; Corbo, F.; et al. NMR-Based Metabolomic Study of Apulian Coratina Extra Virgin Olive Oil Extracted with a Combined Ultrasound and Thermal Conditioning Process in an Industrial Setting. Food Chem. 2021, 345, 128778. [Google Scholar] [CrossRef]
- Girelli, C.R.; Coco, L.D.; Fanizzi, F.P. 1H NMR Spectroscopy and Multivariate Analysis as Possible Tool to Assess Cultivars, from Specific Geographical Areas, in EVOOs. Eur. J. Lipid Sci. Technol. 2016, 118, 1380–1388. [Google Scholar] [CrossRef]


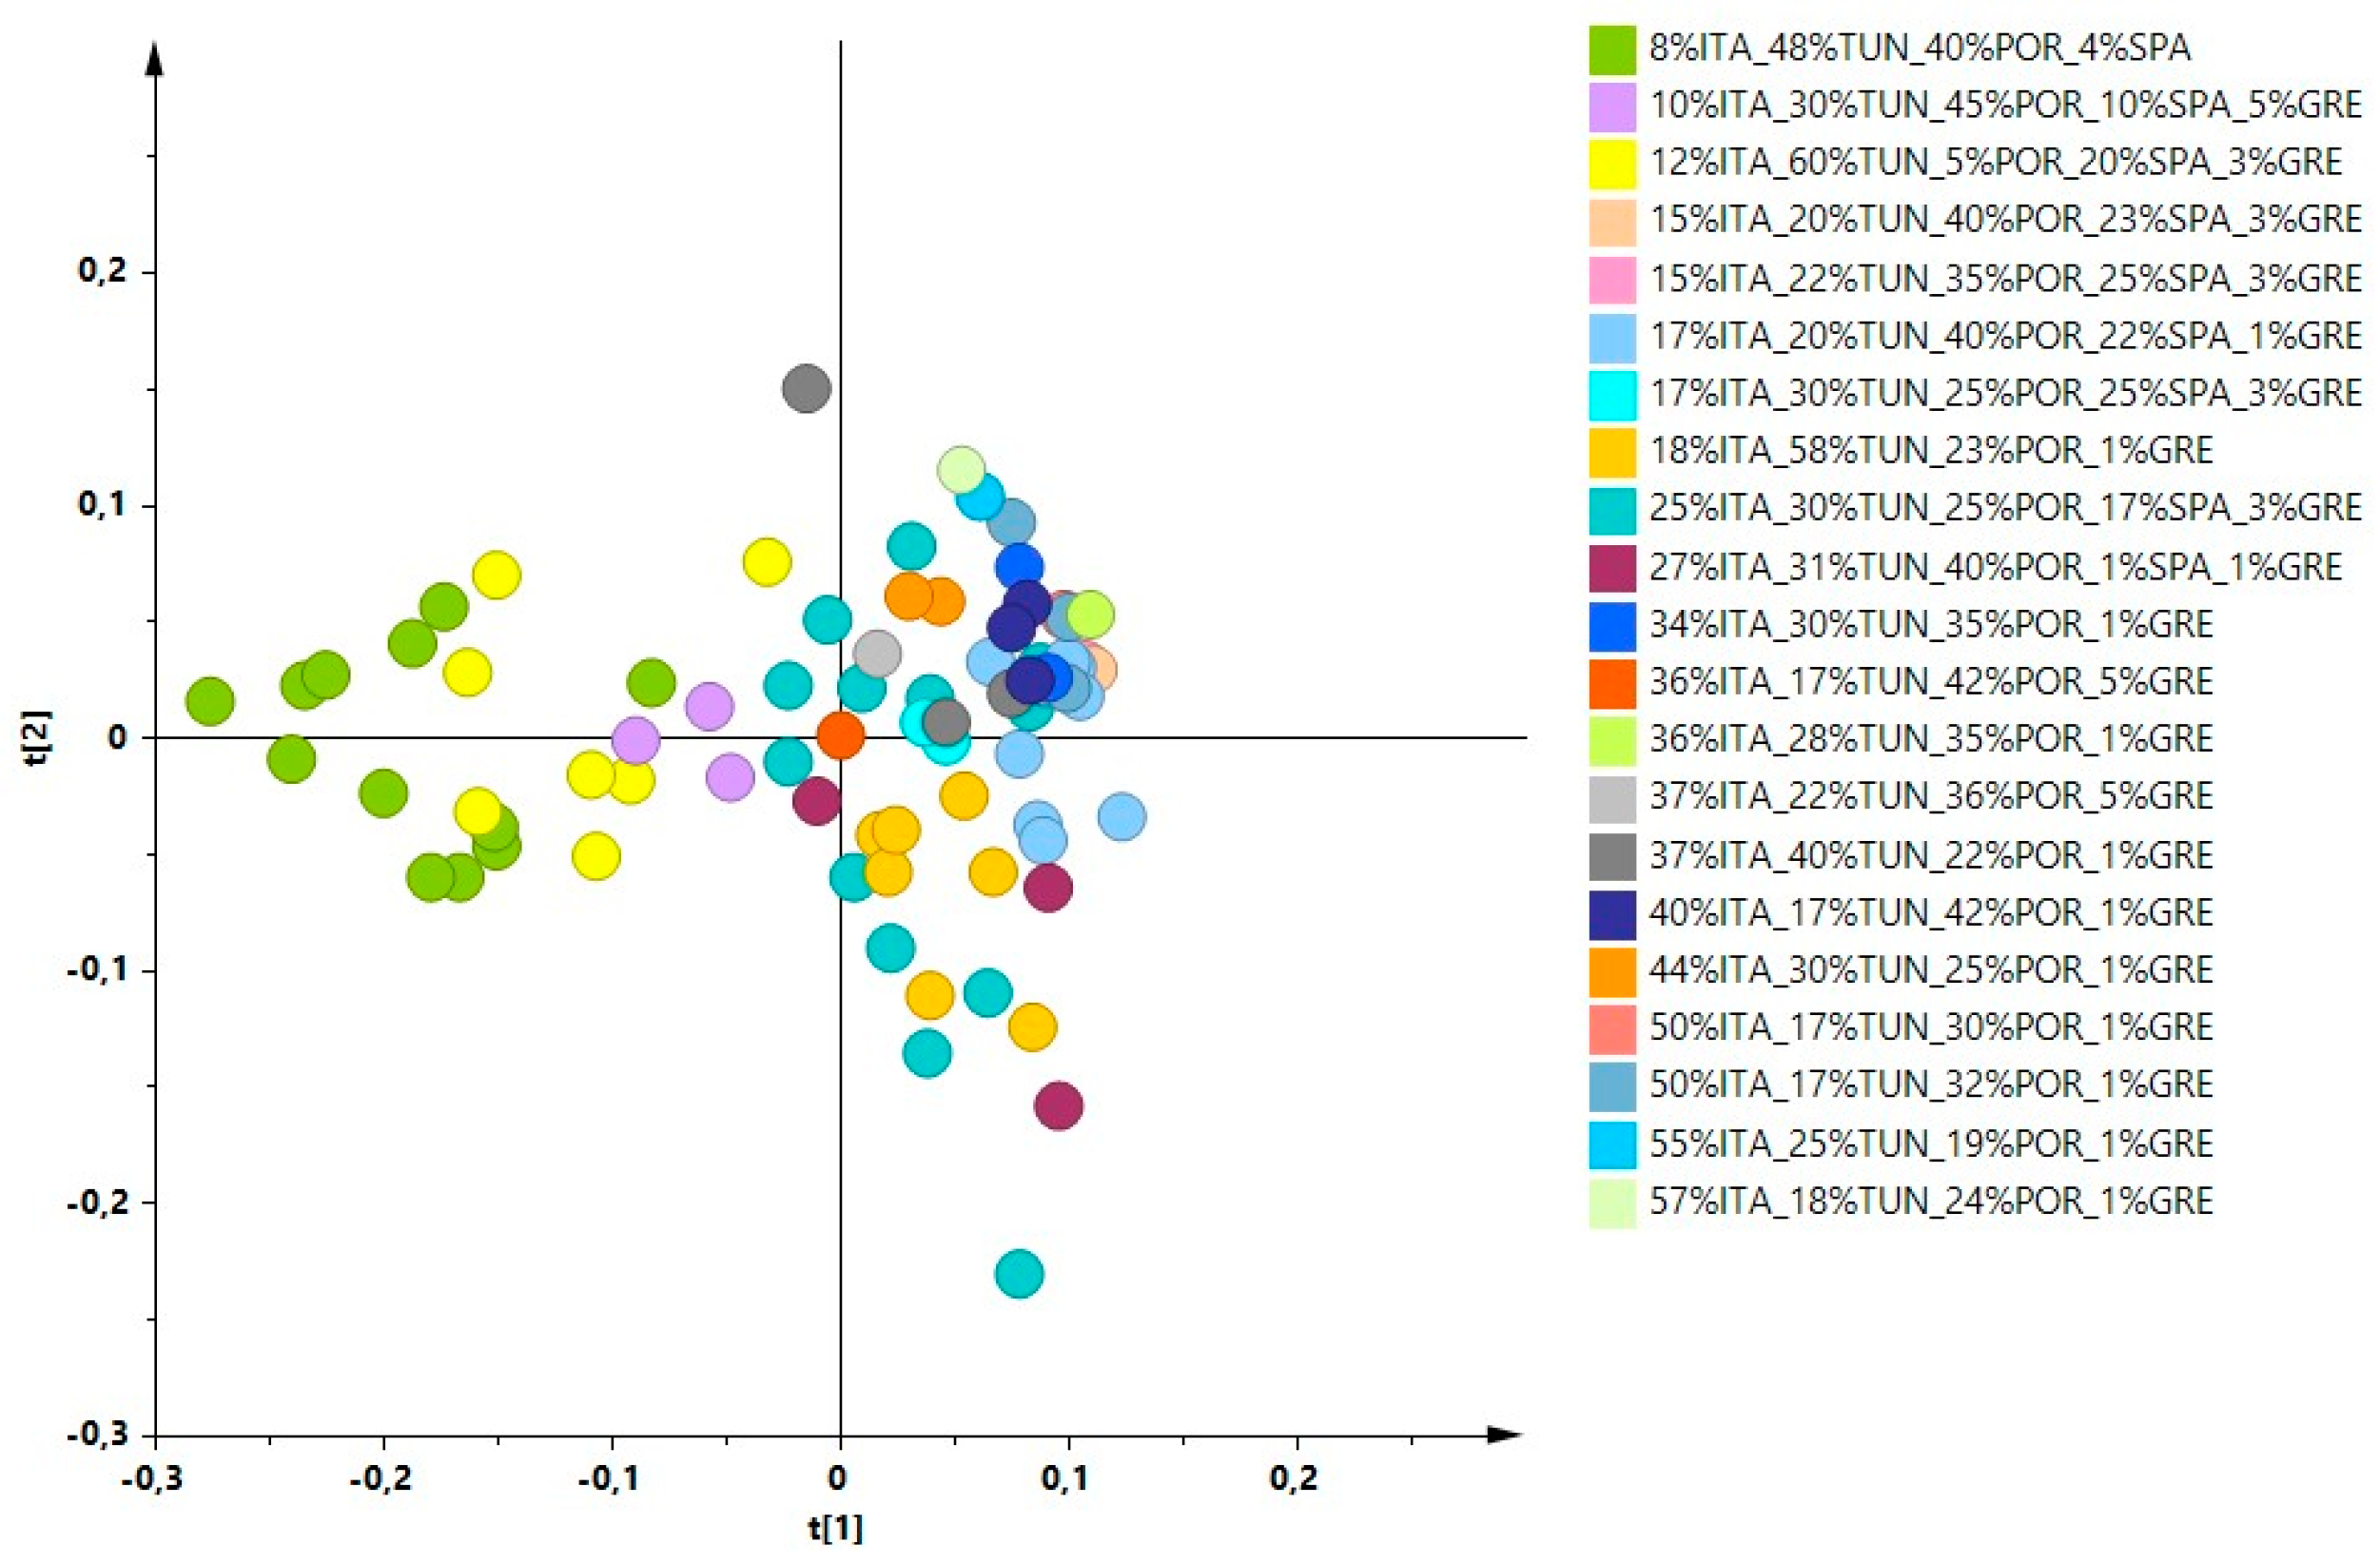
| Countries | Lower Percentage → Higher Percentage | % |
|---|---|---|
| Italy | 8 → 10 → 12 → 15 → 17 → 18 → 25 → 27 → 34 → 36 → 37 → 40 → 44 → 50 → 55 → 57 | % |
| Tunisia | 17 → 18 → 20 → 22 → 25 → 28 → 30 → 31 → 40 → 48 → 58 → 60 | % |
| Portugal | 5 → 19 → 22 → 23 → 24 → 25 → 30 → 32 → 35 → 36 → 40 → 42 → 45 | % |
| Spain | 1 → 4 → 10 → 17 → 20 → 22 → 23 → 25 | % |
| Greece | 1 → 3 → 5 | % |
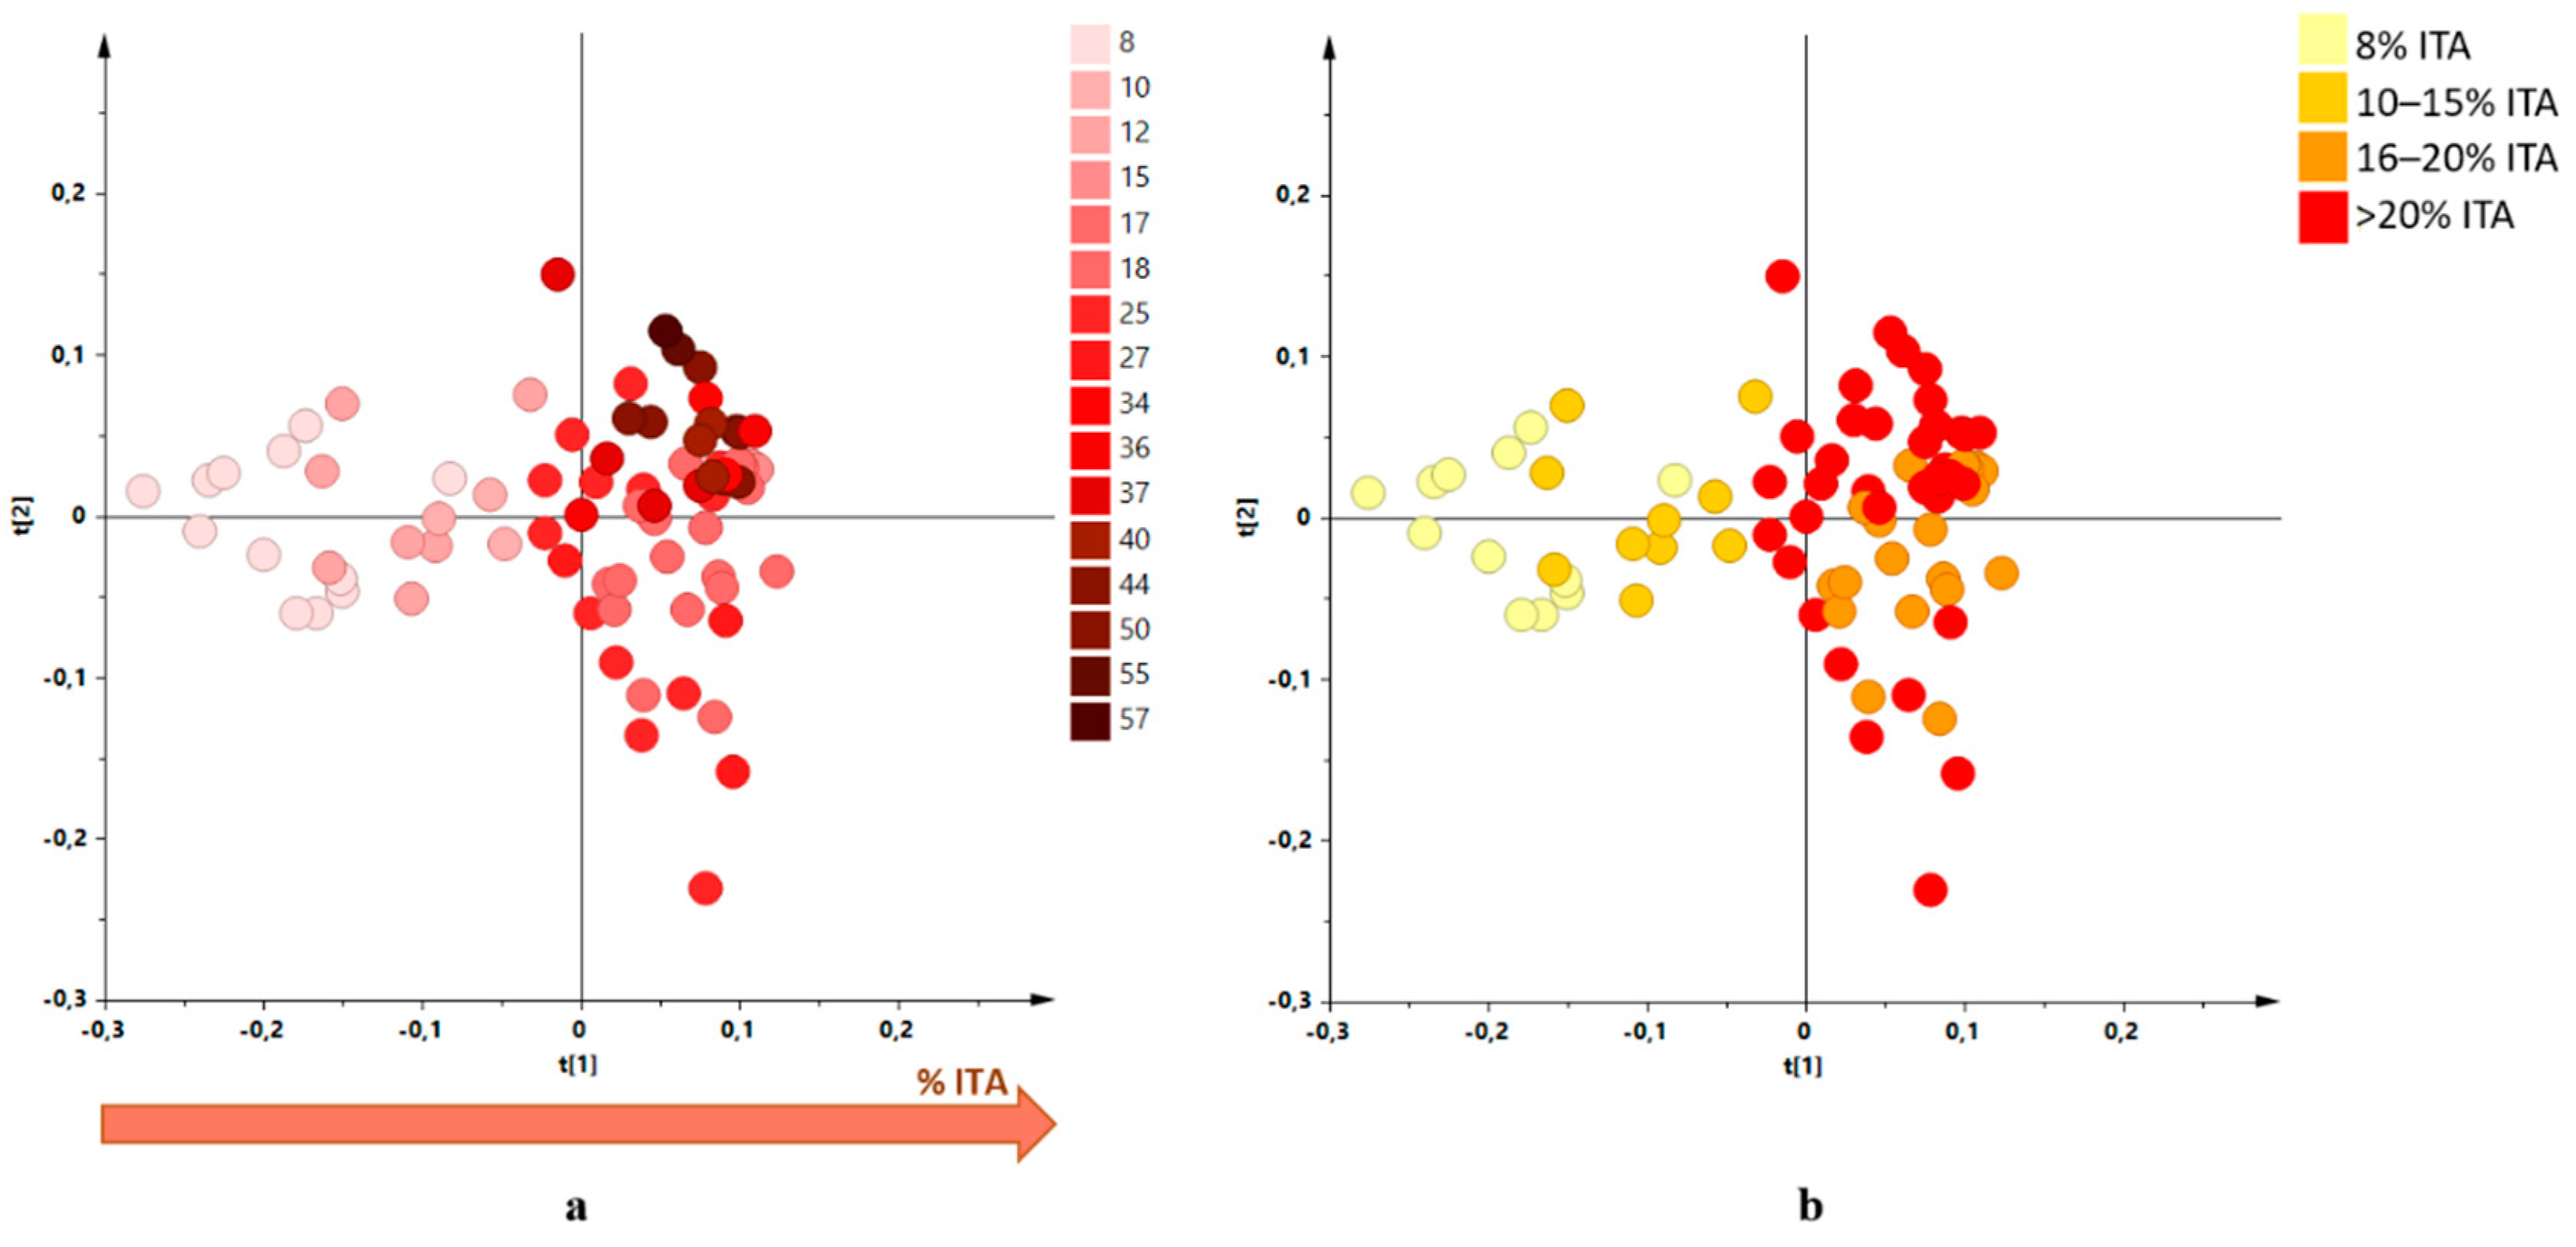
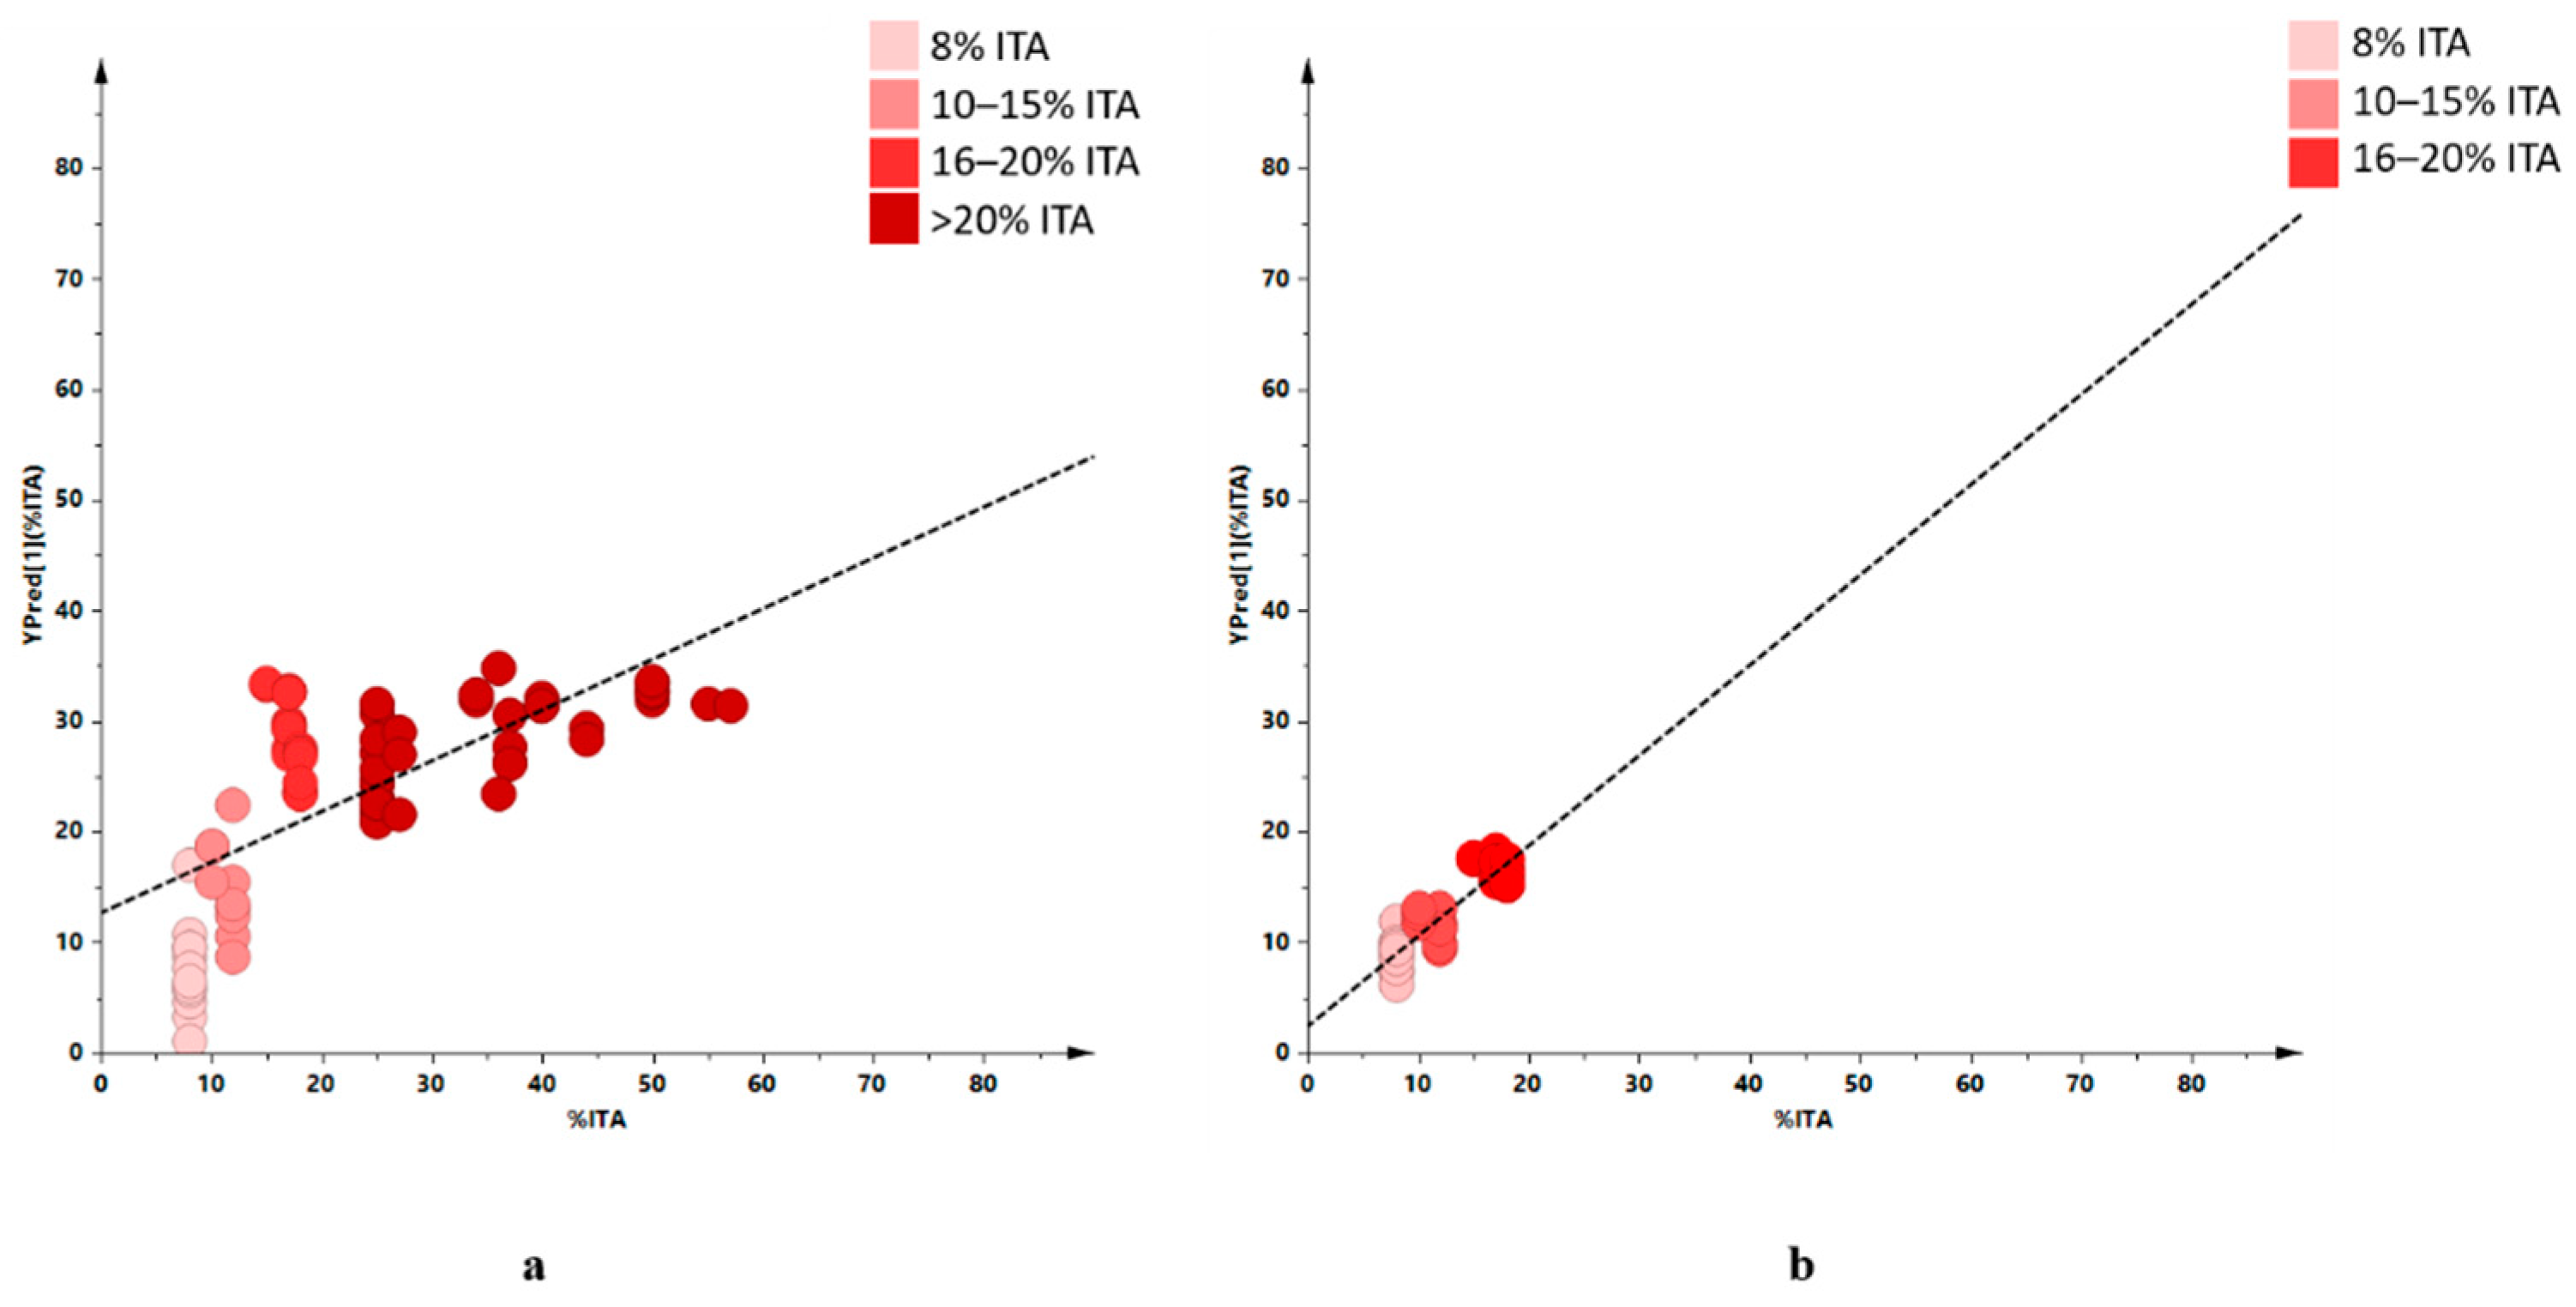
| Countries | R2 |
|---|---|
| %ITA (8–20%) | 0.8160 |
| %ITA (8–>20%) | 0.4585 |
| %TUN (17–60%) | 0.4397 |
| %SPA (0–25%) | 0.2019 |
| %GRE (0–5%) | 0.2407 |
| %POR (5–45%) | 0.1095 |
Publisher’s Note: MDPI stays neutral with regard to jurisdictional claims in published maps and institutional affiliations. |
© 2021 by the authors. Licensee MDPI, Basel, Switzerland. This article is an open access article distributed under the terms and conditions of the Creative Commons Attribution (CC BY) license (https://creativecommons.org/licenses/by/4.0/).
Share and Cite
Calò, F.; Girelli, C.R.; Angilè, F.; Del Coco, L.; Mazzi, L.; Barbini, D.; Fanizzi, F.P. 1H-NMR Profiling Shows as Specific Constituents Strongly Affect the International EVOO Blends Characteristics: The Case of the Italian Oil. Molecules 2021, 26, 2233. https://0-doi-org.brum.beds.ac.uk/10.3390/molecules26082233
Calò F, Girelli CR, Angilè F, Del Coco L, Mazzi L, Barbini D, Fanizzi FP. 1H-NMR Profiling Shows as Specific Constituents Strongly Affect the International EVOO Blends Characteristics: The Case of the Italian Oil. Molecules. 2021; 26(8):2233. https://0-doi-org.brum.beds.ac.uk/10.3390/molecules26082233
Chicago/Turabian StyleCalò, Francesca, Chiara Roberta Girelli, Federica Angilè, Laura Del Coco, Lucia Mazzi, Daniele Barbini, and Francesco Paolo Fanizzi. 2021. "1H-NMR Profiling Shows as Specific Constituents Strongly Affect the International EVOO Blends Characteristics: The Case of the Italian Oil" Molecules 26, no. 8: 2233. https://0-doi-org.brum.beds.ac.uk/10.3390/molecules26082233