Article

Biocompatible Ir(III) Complexes as Oxygen Sensors for Phosphorescence Lifetime Imaging

by
Ilya S. Kritchenkov
1,
Anastasia I. Solomatina
1,
Daria O. Kozina
1,
Vitaly V. Porsev
1,
Victor V. Sokolov
1,
Marina V. Shirmanova
2,
Maria M. Lukina
2,
Anastasia D. Komarova
2,
Vladislav I. Shcheslavskiy
2,3,
Tatiana N. Belyaeva
4,
Ilia K. Litvinov
4,
Anna V. Salova
4,
Elena S. Kornilova
4,5,
Daniel V. Kachkin
6 and
Sergey P. Tunik
1,*
1
Institute of Chemistry, St. Petersburg State University, Universitetskii av., 26, 198504 St. Petersburg, Russia
2
Institute of Experimental Oncology and Biomedical Technologies, Privolzhskiy Research Medical University, Minin and Pozharsky sq. 10/1, 603005 Nizhny Novgorod, Russia
3
Becker&Hickl GmbH, Nunsdorfer Ring 7-9, 12277 Berlin, Germany
4
Institute of Cytology of the Russian Academy of Sciences, Tikhoretsky av. 4, 194064 St. Petersburg, Russia
5
Institute of Biomedical Systems and Biotechnology, Peter the Great St. Petersburg Polytechnical University, Khlopina Str. 11, 194021 St. Petersburg, Russia
6
Faculty of Biology, St. Petersburg State University, Universitetskaya emb., 7/9, 199034 St. Petersburg, Russia
*
Author to whom correspondence should be addressed.
Submission received: 24 April 2021 / Revised: 6 May 2021 / Accepted: 7 May 2021 / Published: 13 May 2021
(This article belongs to the Special Issue Time-Resolved Luminescence Imaging and Spectroscopy)

Abstract

:
Synthesis of biocompatible near infrared phosphorescent complexes and their application in bioimaging as triplet oxygen sensors in live systems are still challenging areas of organometallic chemistry. We have designed and synthetized four novel iridium [Ir(N^C)2(N^N)]+ complexes (N^C–benzothienyl-phenanthridine based cyclometalated ligand; N^N–pyridin-phenanthroimidazol diimine chelate), decorated with oligo(ethylene glycol) groups to impart these emitters’ solubility in aqueous media, biocompatibility, and to shield them from interaction with bio-environment. These substances were fully characterized using NMR spectroscopy and ESI mass-spectrometry. The complexes exhibited excitation close to the biological “window of transparency”, NIR emission at 730 nm, and quantum yields up to 12% in water. The compounds with higher degree of the chromophore shielding possess low toxicity, bleaching stability, absence of sensitivity to variations of pH, serum, and complex concentrations. The properties of these probes as oxygen sensors for biological systems have been studied by using phosphorescence lifetime imaging experiments in different cell cultures. The results showed essential lifetime response onto variations in oxygen concentration (2.0–2.3 μs under normoxia and 2.8–3.0 μs under hypoxia conditions) in complete agreement with the calibration curves obtained “in cuvette”. The data obtained indicate that these emitters can be used as semi-quantitative oxygen sensors in biological systems.

Graphical Abstract

1. Introduction

Biochemical processes in living aerobic organisms in many aspects are critically dependent on oxygen, which is a key substrate of energy metabolism [1] and an important indicator of cell/tissue physiological status under healthy and diseased conditions. Misbalance of oxygen demand and supply is associated with many pathologies, such as cancers [2,3,4], neurological diseases [5,6], retinopathy, glaucoma, and nuclear cataracts [7,8,9], that inevitably stimulates the study of organs, tissues, and cell compartments’ oxygenation, see for example Chapters 4 and 12 in book [10], Chapter 17 in [11], and research articles [12,13,14]. Noteworthy that in vitro and in vivo real time monitoring of O2 concentration with high spatial and temporal resolution is one of the challenging tasks in medicine and biology, the solution of which can provide invaluable information related to metabolic status of cells and tissues in normal and diseased states. Among various modes of oxygen mapping in biological systems phosphorescence lifetime imaging (PLIM) provides considerable advantages due to its noninvasive nature, and reversible and rapid response onto variations in local oxygen content, which can be detected both at qualitative and quantitative levels either showing relative changes or giving absolute values of the analyte concentration. PLIM method is based on the phenomenon of the phosphorescence dynamic quenching by molecular oxygen due to excitation energy transfer from triplet excited state of emitter to O2 [15,16], which is a unique small molecule with triplet ground state, that ensure extremely high selectivity of this sensing procedure. The instrumentation for the PLIM measurements is now commercially available and data processing algorithms are very well developed [17,18]. Qualitative assessments of the hypoxia regions in living organisms and cell compartments have been already performed by using a range of Pt, Pd, Ir, and Ru phosphorescent complexes, see reviews [16,19,20,21,22] and some recent experimental papers [23,24,25,26,27,28,29], which demonstrated different lifetime sensitivity to oxygen and diverse levels of biocompatibility/toxicity. However, to exploit in full the PLIM mode of oxygen sensing, in particular, in order to obtain the quantitative spatial and temporal distribution of O2 in biological systems, the targeted chemical design of the sensor composition and structure is highly necessary.
The oxygen sensor works in a complicated physiological media containing a large variety of biomolecules, which may absorb relatively small and often hydrophobic sensor molecules thus changing Stern–Volmer quenching constant in an unpredictable manner. To prevent the cross-talking of several orthogonal parameters, which can significantly distort the result of the target value (O2 concentration) measurement, the sensor needs protection from the interaction with the other components of physiological media. Two research groups from Pennsylvania and Cork universities successfully solved this problem by packing the chromophore center(s) either into dendrimeric polyethyleneglycol (PEG) ligand corona [30,31,32] or into polymeric nanospecies [33,34,35] that prevents the chromophore pocketing into hydrophobic cavities of biomolecules. In both cases the emitters are based on platinum and palladium porphyrins, which demonstrate high quantum yields (QY), wide interval of lifetime variations in response to the changes in O2 concentration, and emission in the red and near infrared (NIR) regions that are well suited for sensing in biological systems. However, some specific features of these sensors limit their utilization, e.g., PEGylated Pt/Pd porphyrins (Oxyphors family), require challenging synthesis and are of rather large size (ca. 7 nm [32]) which makes impossible their uptake by cells and implies intravascular sensing as a major area of application. The nanoparticle based sensors (NanO2 and analogous species) display excellent brightness due to incorporation of a few emitter molecules into the particle core. However, being prepared of charged hydrophobic polymers [34,35] they lose electrostatic stability at physiological ionic strength and tend to aggregate in aqueous saline [33,36]. From the viewpoint of PLIM, one of the major problems for both types of sensors is very long emission lifetime, which typically span the interval of 30–70 μsec under physiological conditions that makes difficult real-time monitoring of oxygen concentration in appreciable spatial areas in microscopic experiments.
These considerations prompted us to investigate another popular luminescent platform [37,38] based on bis-cyclometalated iridium complexes with the aim to obtain water-soluble compounds suitable for effective application in biological systems as quantitative oxygen sensors in PLIM mode. These phosphorescent complexes (a) are relatively easy to prepare; (b) demonstrate high versatility relative to the structure and composition of ligand environment; (c) consequently allow for wide variations in photophysical parameters of emitter and chemical/biological properties of the target molecules, (d) are bright and stable to photobleaching luminophores. The last but not the least, emission lifetime changes through normal to hypoxic conditions fall in the range from hundreds of nanoseconds to a few microseconds that is more than order of magnitude shorter compared to the platinum and palladium porphyrins mentioned above. In our recent publication [27] we presented a series of iridium [Ir(N^C)2(N^N)]+ complexes, which contain oligo(ethyleneglycol) (OEG) functions {–C(O)NHCH-(CH2OC2H4OC2H4OCH3)2} at the periphery of the N^N and/or N^C ligands that made the hydrophobic core of these molecules water-soluble and suitable for semi-quantitative PLIM experiments on cell cultures. It has to be noted that the poly- and oligo-ethyleneglycole pendants have been already used to make molecular transition metal chromophores (Pt(II) [39,40,41], Pd(II) [42,43], Au(III) [44], Re(I) [45,46], Ir(III) [45,47,48,49], Ru(II) [50]) water-soluble, less toxic, and biocompatible. However, in all but one of these studies the authors functionalized only one of the ligands in metal coordination environment (using either OEG or PEG) that is chemically simpler but is evidently less effective compared to introduction of this pendants into all three chelates of typical iridium [Ir(N^C)2(N^N)]+ emitters. In the present article, we describe the synthesis, characterization, and photophysical study of iridium complexes functionalized at N^N and N^C ligands with branched “second generation” OEG substituents aimed at increased protection of the chromophores from the interaction with biomolecules. We compared the solubility and phosphorescence lifetime characteristics of the complexes of the “first” and “second generation” in different media to evaluate their potential as quantitative oxygen sensors in the cell studies using PLIM. We also complemented these investigations by the study the complexes’ cytotoxicity, dynamics of intracellular uptake, and their localization in three cell types.

2. Results

Synthesis of N^C and N^N ligands containing OEG pendants of various branching are shown in Scheme 1.
Details of experimental procedures are given in Experimental section, their 1H, 1H-1H COSY and NOESY NMR spectra (Figures S1–S12) and ESI+ mass spectra (Figures S13–S19) are presented in Supporting Materials file.
The iridium complexes have been obtained by using a standard reaction sequence (Scheme 2), which consists of preparation of iridium orthometalated dimer followed by its reaction with the diimine ligand to afford the target mononuclear [Ir(N^C)2(N^N)]+ compounds. Ir1 and Ir2 complexes differ in the composition of the OEG pendants, whereas Ir# and Ir#a contain Cl and PF6 counterions, respectively. The obtained compounds are well soluble and stable in aqueous solutions including model physiological media (fetal bovine serum, FBS).
The complexes were obtained as dark red amorphous solids and did not give crystals suitable X-ray crystallographic study. Therefore, their composition and structure in solution were studied by using 1H, 1H-1H COSY and NOESY NMR spectroscopy (Figures S20–S31) and mass-spectrometry (Figures S32–S37). The spectroscopic data obtained are completely compatible with the structural patterns shown in Scheme 1, see for example Figure 1.
Additionally we carried out optimization of the central core structure using DFT method, which gave molecular architecture (named Ir0) common for the complexes of this sort, see Figure 2, with the nitrogen atoms of the N^C ligands in trans position at coordination octahedron. Note that for the sake of simplicity optimization was performed for the molecule where OEG pendants were changed for methyl substituents. Cartesian coordinates of the optimized structure are given in a separate file (Ir0.xyz) supplied as Supporting Material, key structural characteristics are summarized in Table S1. These data are in good agreement with the structural parameters found earlier for the closely analogous iridium complex (Figure S38) [51].

3. Discussion

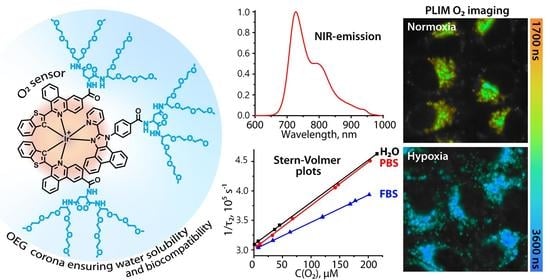
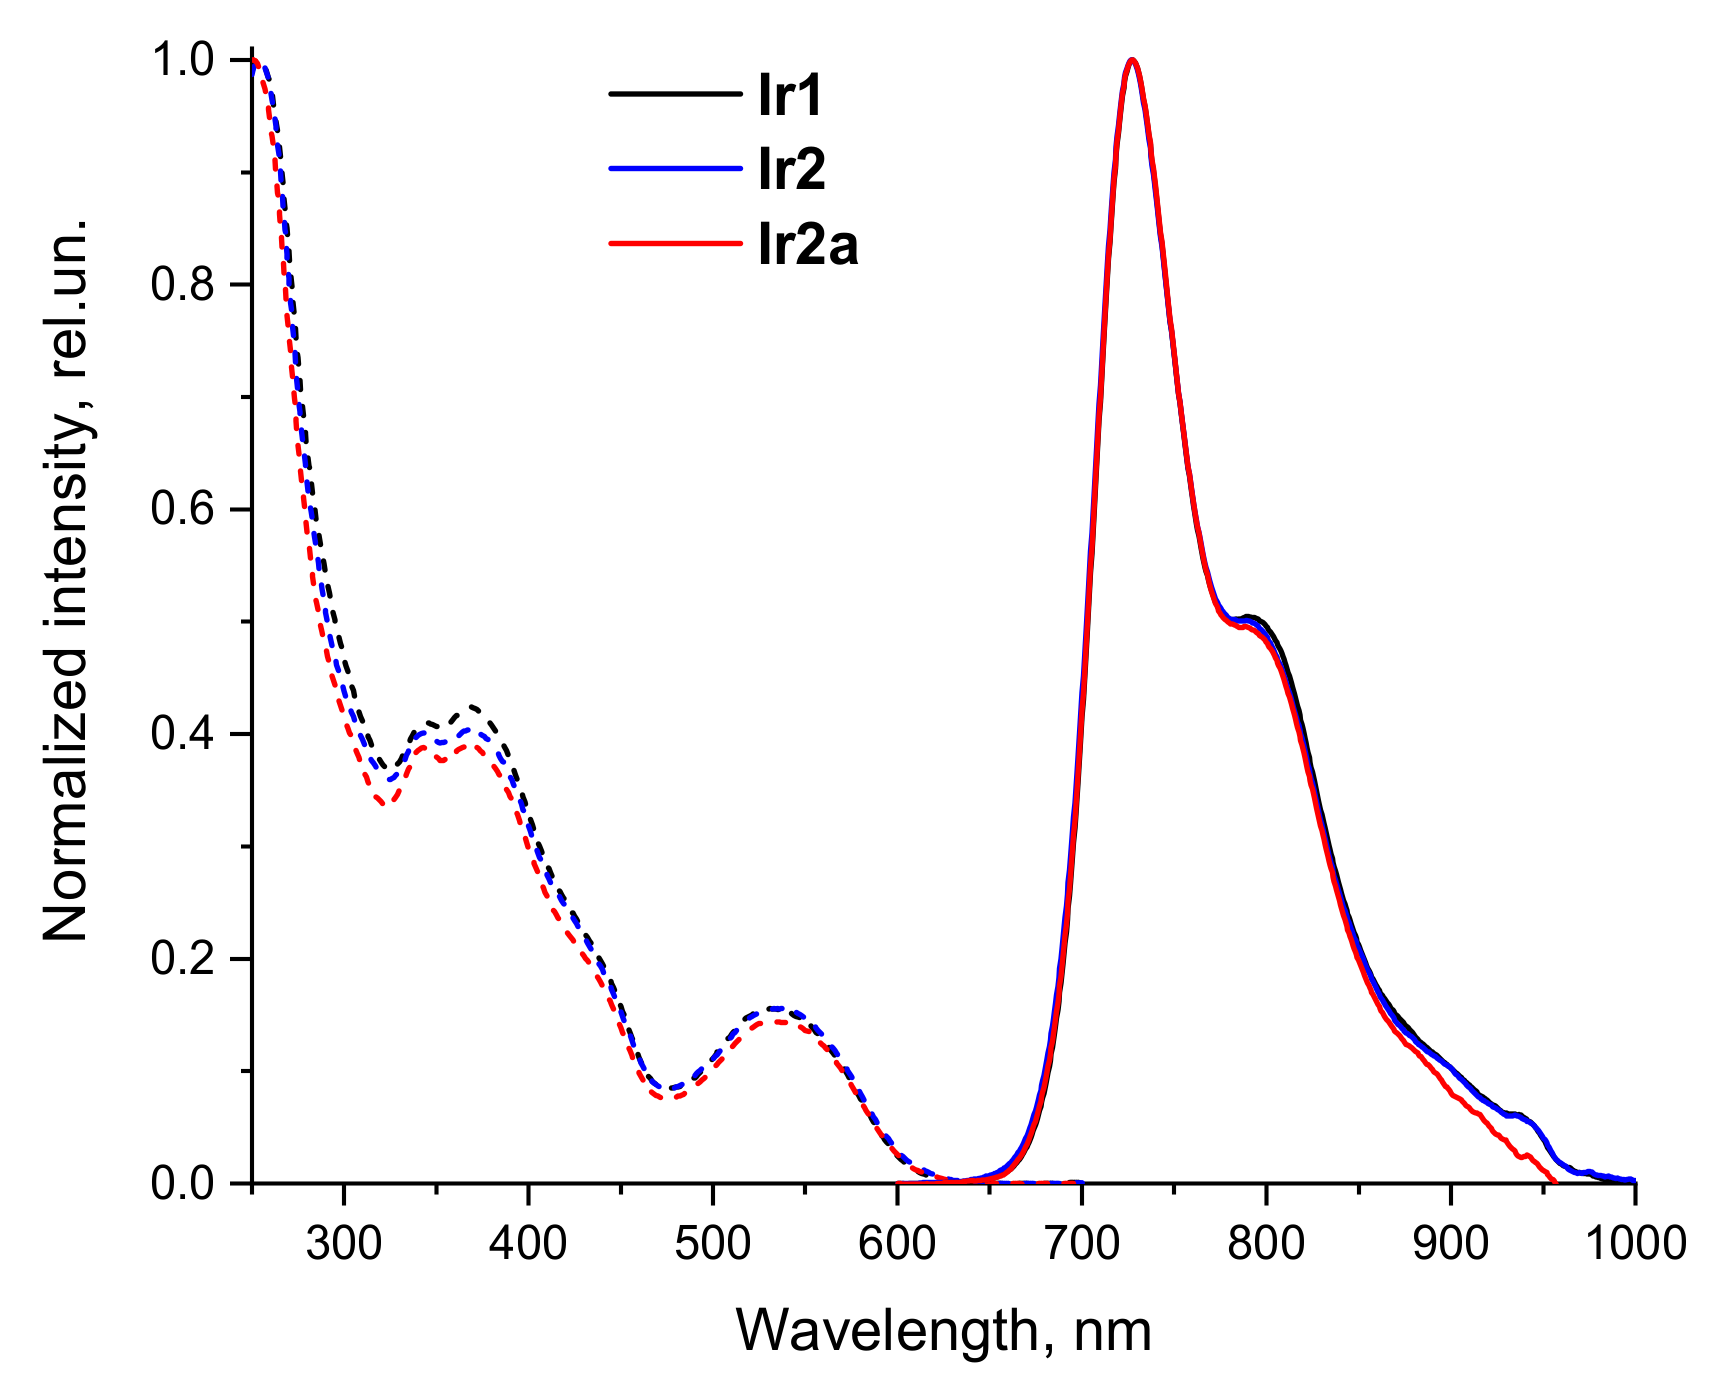
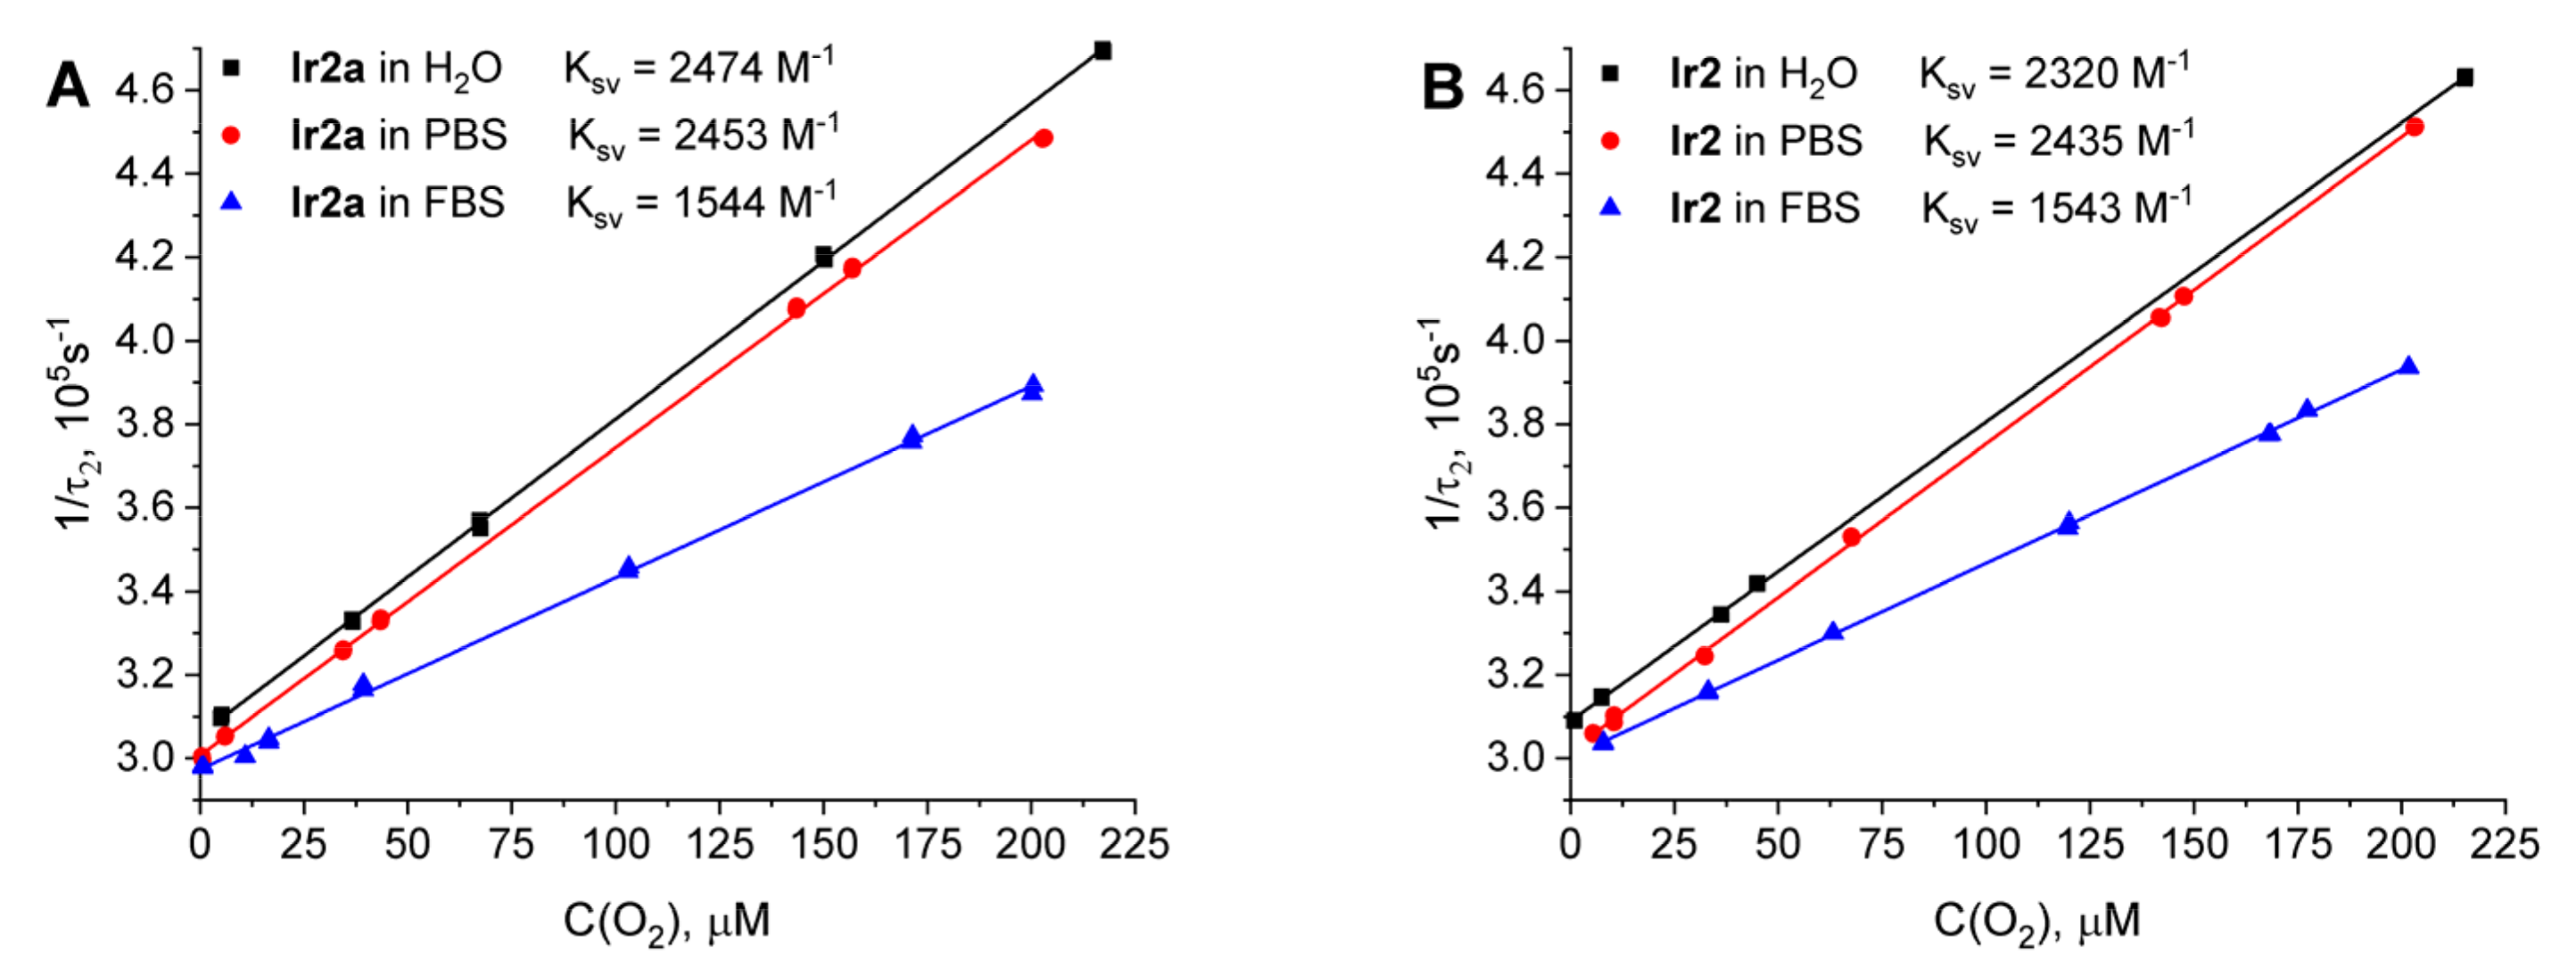
3.1. Photophysical Properties

All complexes are luminescent in aqueous media to give emission in NIR region with a rather high quantum yield, up to ca. 12% in degassed solution. Absorption, excitation, and emission spectra are shown in Figure S39 and Figure 3, respectively. The numerical photophysical data are summarized in Table 1.
The complexes display large Stokes shift, lifetime in microsecond domain, and emission quenching by molecular oxygen that points to the emission origin from triplet excited state, i.e., phosphorescence. According to the data of DFT calculations for closely analogous iridium complexes [52], the chromophore in the emitters of this sort is localized onto the central fragment of the molecule and observed emission can be assigned to ligand centered (LC) transition with some admixture of the ligand to ligand (LLCT) and metal to ligand (MLCT) charge transfer. The experimental data are in complete agreement with this assignment and indicate that the OEG pendants and counterions have nearly no effect onto photophysical characteristics of these complexes because of their lateral disposition relative to the chromophore center.
It is also worth noting that lifetime sensitivity of these complexes is relatively low that is typical for transition metal chromophores (e.g., iridium [27] and ruthenium [53] emitters) in aqueous media. Nevertheless, the lifetime interval of ca. 1 μsec between the values obtained in aerated and degassed solutions is large enough to estimate potential of these sensors for application as indicators of oxygen concentration variations in biological systems.
Dependence of emission lifetime on oxygen concentration in aqueous solution, PBS, and in FBS was investigated for the Ir2 and Ir2a complexes; note that Ir1 and Ir1a proved to be toxic to be used as sensors in biological systems, vide infra, therefore we did not make lifetime calibration on oxygen concentration for these complexes. The data obtained for Ir2 and Ir2a are summarized in Tables S2 and S3, the corresponding Stern–Volmer plots are shown in Figure 4. We found that in PBS and FBS solutions the emission decays are best-fitted using bi-exponential analysis, see Table S2. The shorter exponent of the decay commonly displays contribution in the range 10–20%, varies in a relatively narrow interval, and does not show systematic dependence on oxygen concentration, therefore in the calibration plots we used the lifetimes corresponding to the longer exponent, τ2 (Table S3). This emission parameter does not depend on pH and complex concentration (Table S4) but shows good linearity of the Stern–Volmer plot (Figure 4) that is indicative of dynamic character of emission collisional quenching with molecular oxygen.
The calibration plots and Stern–Volmer constants obtained in pure water and PBS solutions are similar and differ substantially from those recorded in FBS. However, it is worth noting that the lifetimes obtained in these three media are nearly identical at zero oxygen concentration, see Figure 4, whereas in the presence of oxygen, the lifetime values obtained in FBS are systematically higher and Ksv value is substantially lower. These data indicate that the key photophysical characteristics of the chromophores (rate constants of radiative and nonradiative transitions from the triplet excited state) do not depend on the media composition, whereas the oxygen quenching rate constants are lower in the solutions containing biomolecules. These observation are completely compatible with collisional quenching mechanism of Ir2 and Ir2a phosphorescence by molecular oxygen because quenching rate constant is a function of oxygen diffusion coefficient in the corresponding solution, which in turn is proportional to the media viscosity [54]. The study of τ2 dependence on the viscosity of aerated FBS solutions (Table S5, Figure S41) clearly shows systematic lifetime (τ2) growth upon increase in FBS concentration, which is accompanied by related increase in solution viscosity. These data are in line with the dynamic character of the phosphorescence quenching in the model viscous media. However, the effect of viscosity onto emission lifetime is relatively small and does not exceed 10% in the interval studied, which evidently covers the values typical for the intracellular media [55,56,57]. Comparison of the lifetime data obtained in cuvette using spectrometer and those obtained in PLIM experiments (Table S6) showed that they coincide within the margin of experimental uncertainty. The above analysis made possible to conclude that the Ir2 and Ir2a molecules are well shielded from noncovalent interaction with biomolecules, which could substantially distort the oxygen concentration determination in biological systems. The observed effect of media viscosity onto emission lifetime most probably are negligible for the measurements in biological samples and we can consider the calibration obtained in FBS solution (Figure 4) as a reliable estimation of oxygen concentration in cells using PLIM.

3.2. Biological Experiments

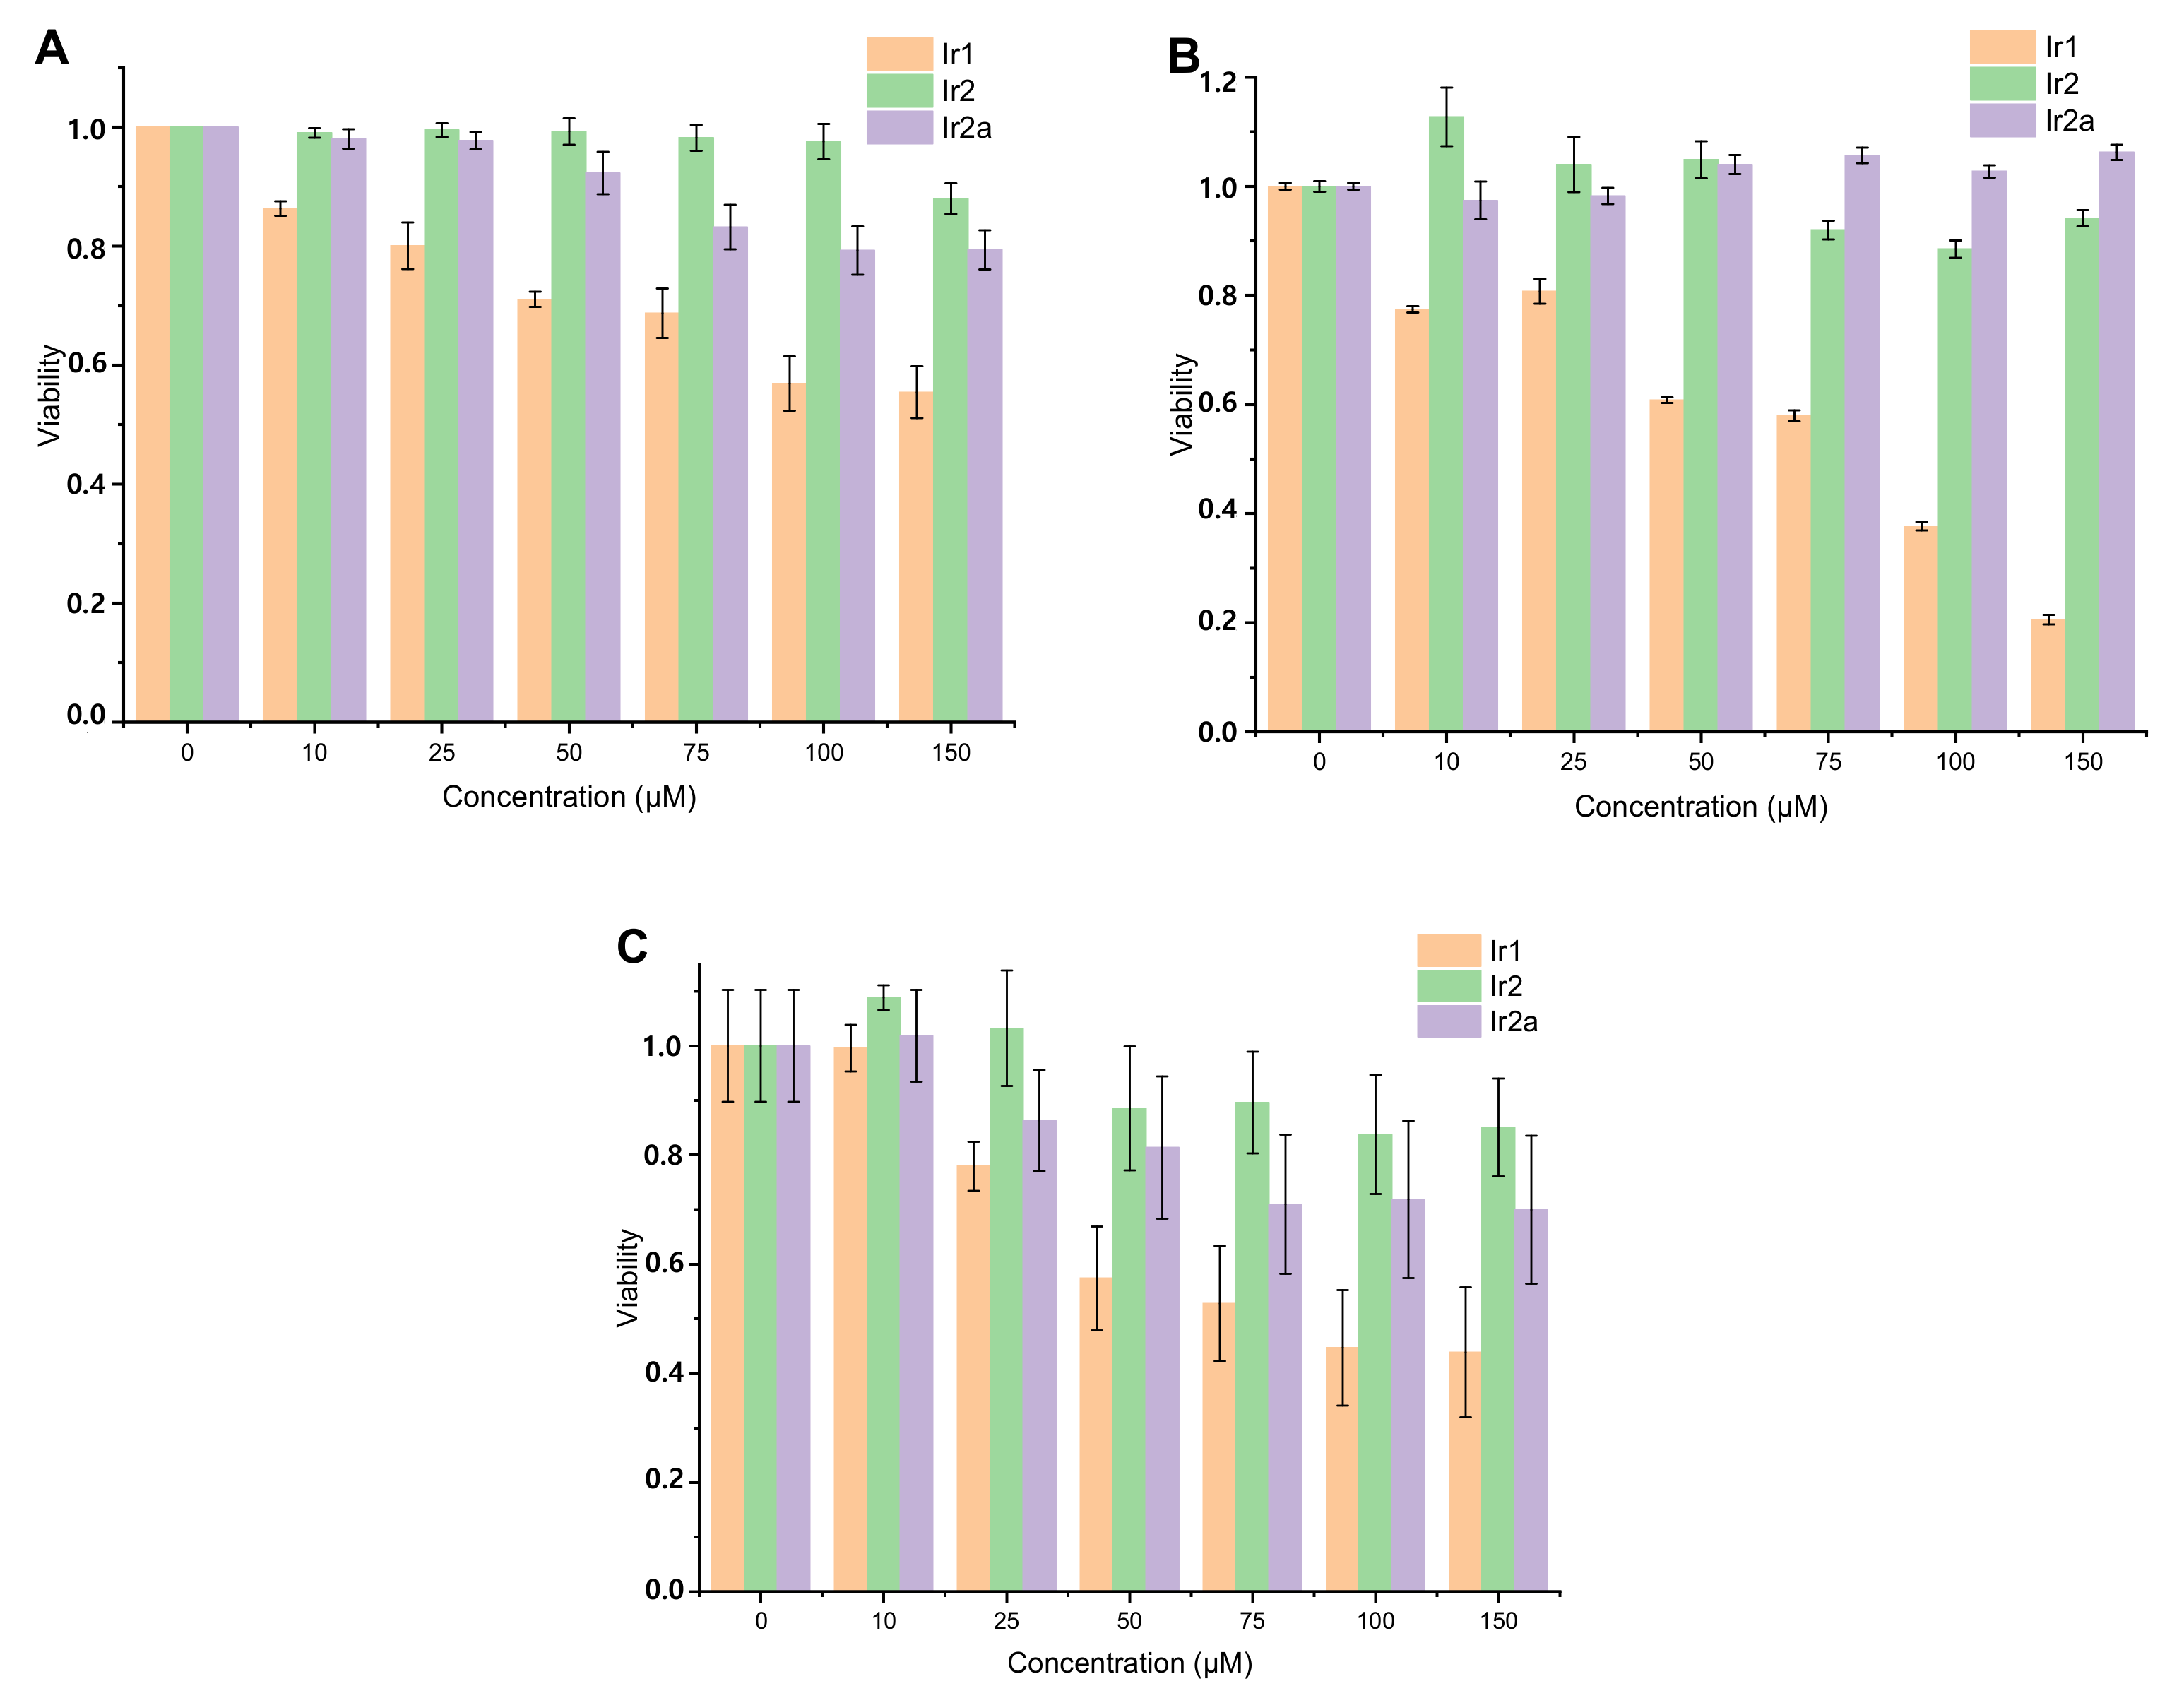
3.2.1. Cytotoxicity Tests

To assess viability of different cell lines in the presence of iridium complexes we used MTT colorimetric assay, Figure 5. The results of these tests indicate that:
(i)
Ir1 displays higher toxicity compared to its relatives (Ir2 and Ir2a) containing branched OEG pendants;
(ii)
Incubation of cancer (CT26 and HeLa) and normal (CHO-K1) cells with Ir1 at the concentrations above 25 μM reduced cell viability by >20%;
(iii)
For Ir2 comparable level of toxicity was not achieved even at the concentration 150 μM;
(iv)
Ir2a is only slightly more toxic than Ir2.
Figure 5. MTT assay of CT26 (A), HeLa (B), and CHO-K1 (C) cells after incubation with Ir1, Ir2, Ir2a for 24 h at different concentrations. Cell viability of control cells (without probe) was taken for 1. Mean ± standard deviation. N = 30 repetitions for CT26, 15 repetitions for HeLa, and 5 repetitions for CHO-K1 cells.
Molecules 26 02898 g005
These results are not unexpected because of higher hydrophobicity/lipophilicity of Ir1 compared the complexes of Ir2 series that was also evidenced by lower solubility of Ir1 in aqueous media. These observations are in agreement with the correlation between lipophilicity of metal complexes and their toxicity found earlier for PEGilated rhenium [46], platinum [58], and iridium [47,59] chromophores, which were used in biological experiments and studied from the viewpoint of their biocompatibility. These findings showed that applicability of Ir1 in biological experiments is limited to a low concentration range that makes difficult obtaining high quality PLIM data. Therefore all further imaging experiments have been performed with Ir2 and Ir2a.

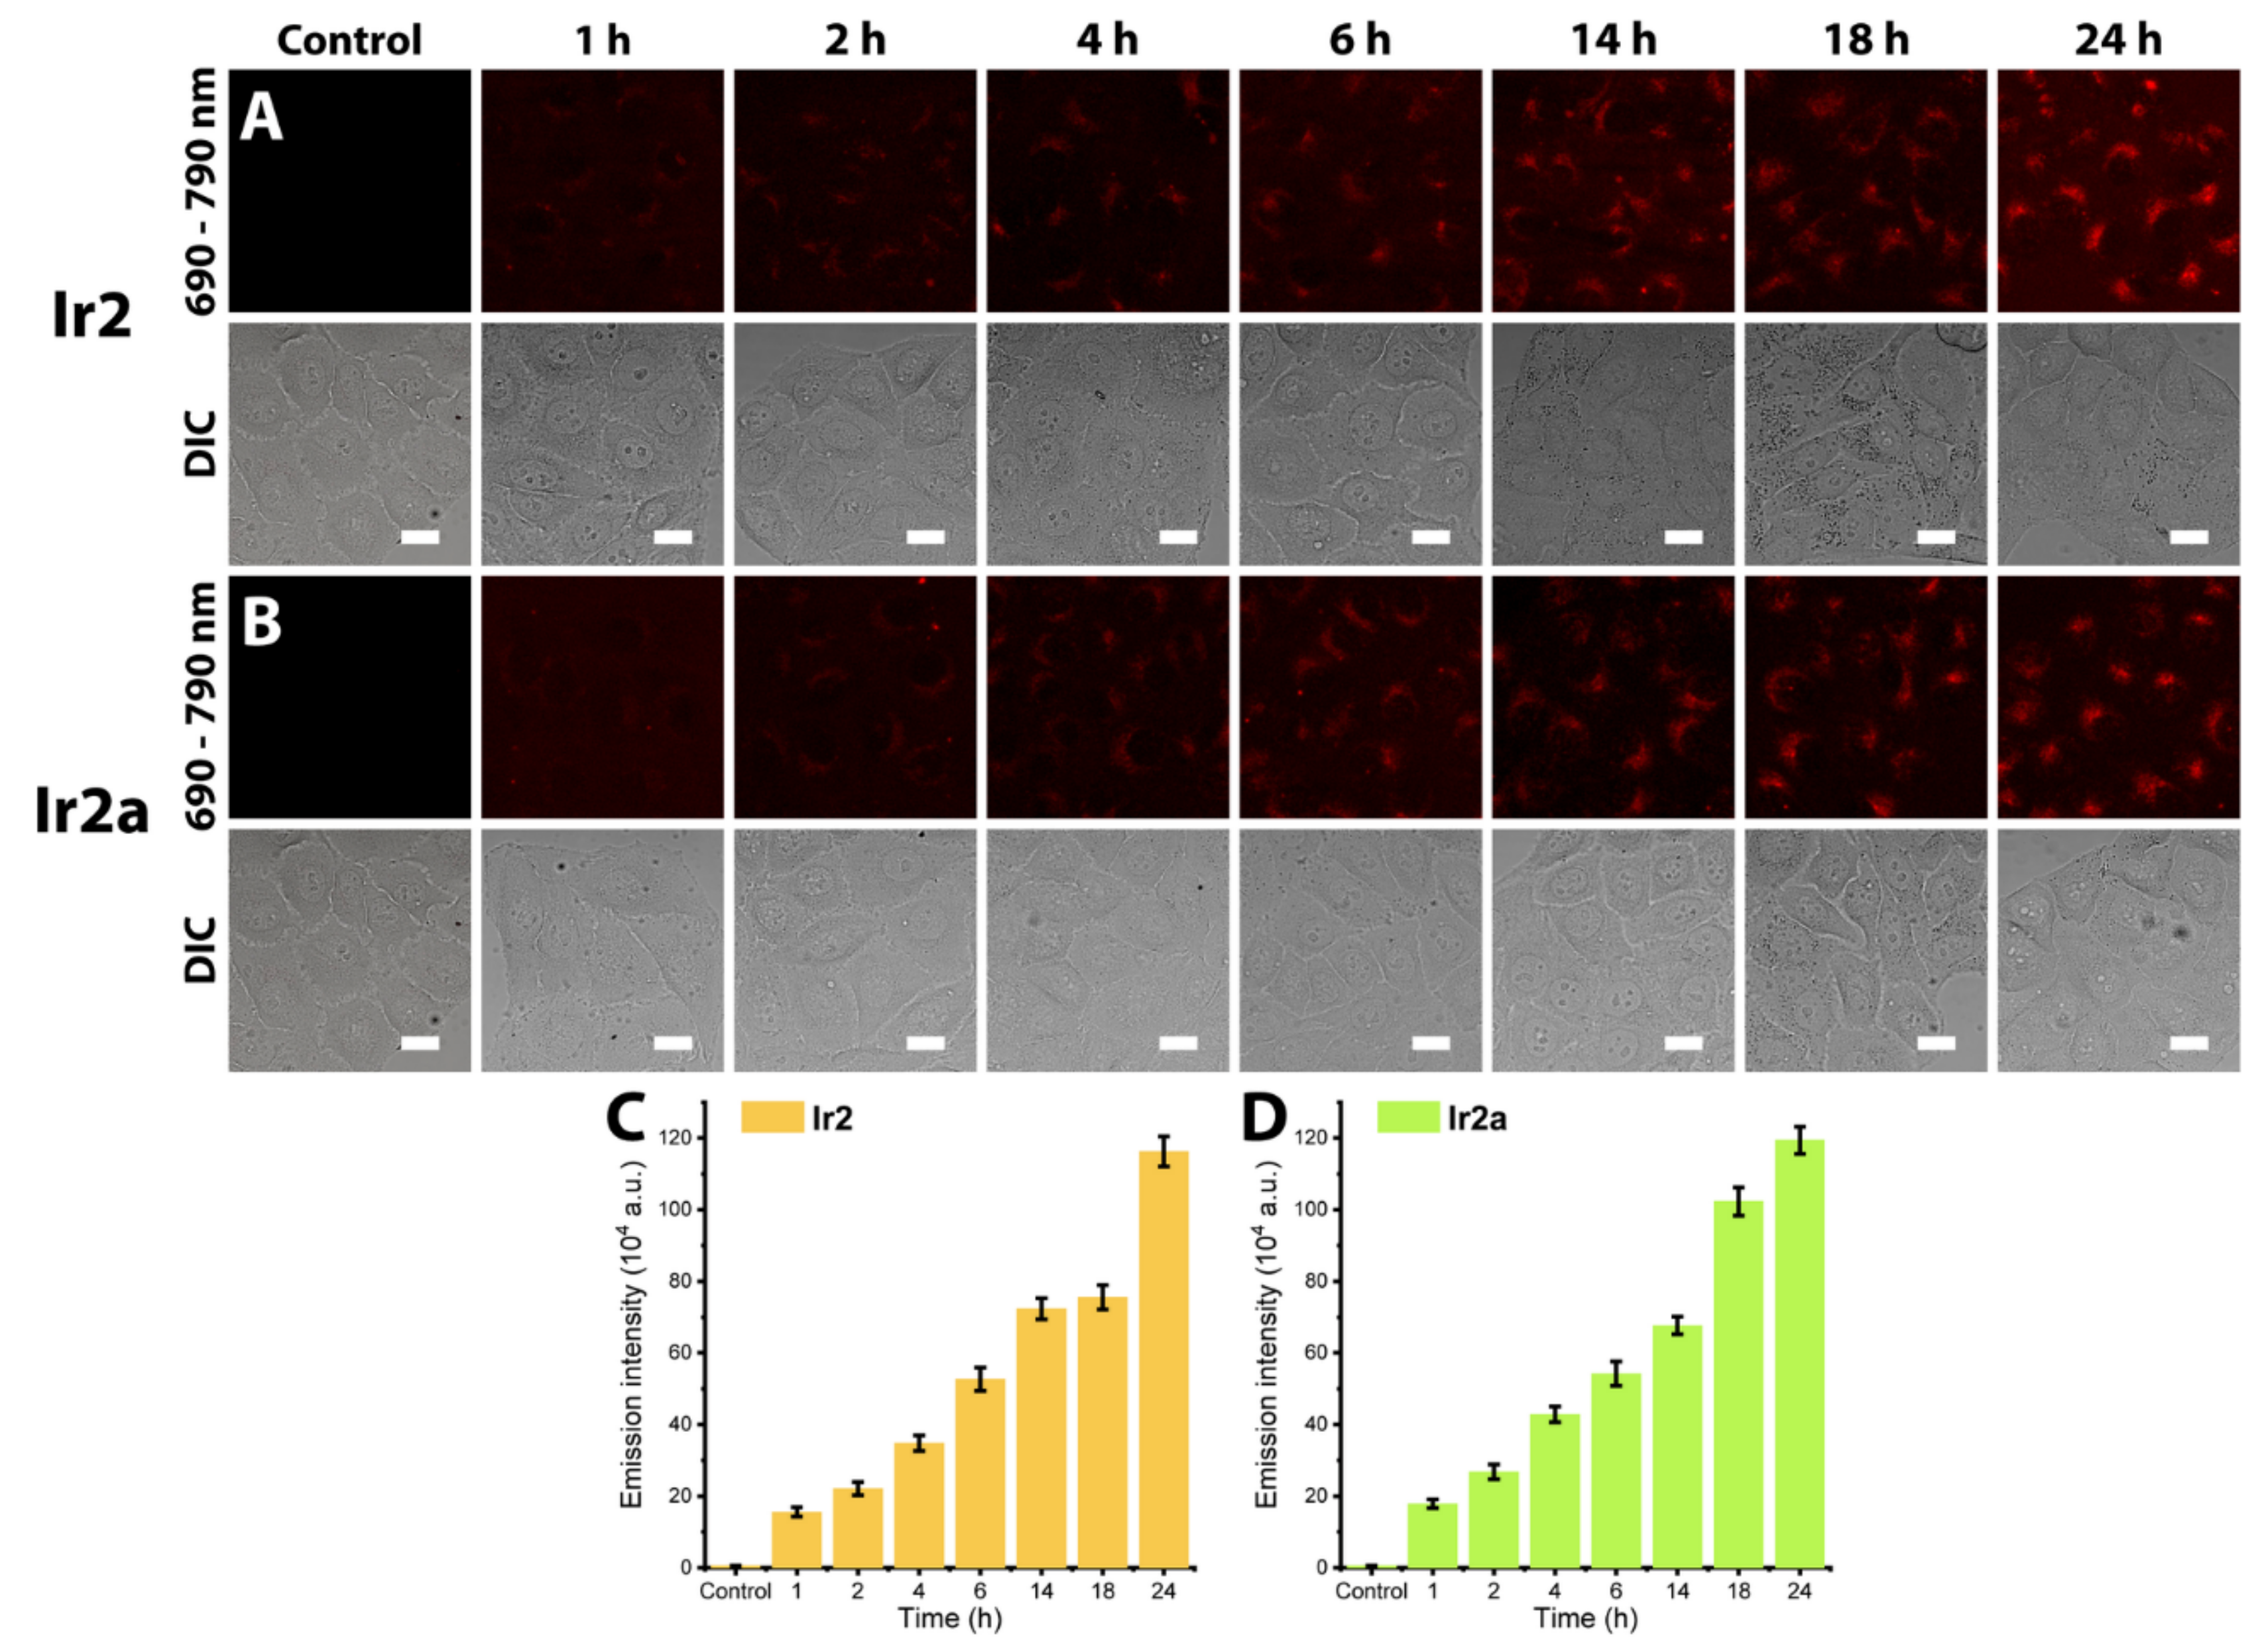
3.2.2. Dynamics of the Complexes’ Uptake.

In order to find out whether Ir2 and Ir2a are accumulated by the living cultured cells and to study the dynamics of the process, we monitored intracellular luminescence of the complexes using confocal laser scanning microscopy; see Figure 6 and Figures S42–S44. We found that both complexes enter different cell types and their luminescence intensity gradually increases with the time of incubation, indicating the increase of intracellular probe concentration. Maximum luminescence intensity was observed after 24-h incubation. It is important that the cells preserved typical morphology that is indicative of the absence of toxic effects, as it is seen from the bright-field microscopic images.
A very low diffuse signal of the complexes’ emissions in HeLa or CHO-K1 cells can be detected after 4 h of incubation for the both Ir2 and Ir2a. Phosphorescent signal is detected in perinuclear region after incubation for more than 4 h. However, it should be taken into account that resultant phosphorescence intensity of the complexes is not only proportional to their concentration in a certain area, but also inversely proportional to O2 level at the same location. This means that emission intensity can be only considered as a semi-qualitative measure of the complexes’ cellular uptake. Thus, the data obtained indicate that (i) distribution of the complexes throughout the cell is not uniform and they undergo slow accumulation into some intracellular compartment, (ii) in the areas with bright phosphorescence either the concentration of the probe is high or the low level of O2 is maintained. A similar uptake behavior was observed for the other two cell lines, see Figures S42–S44.

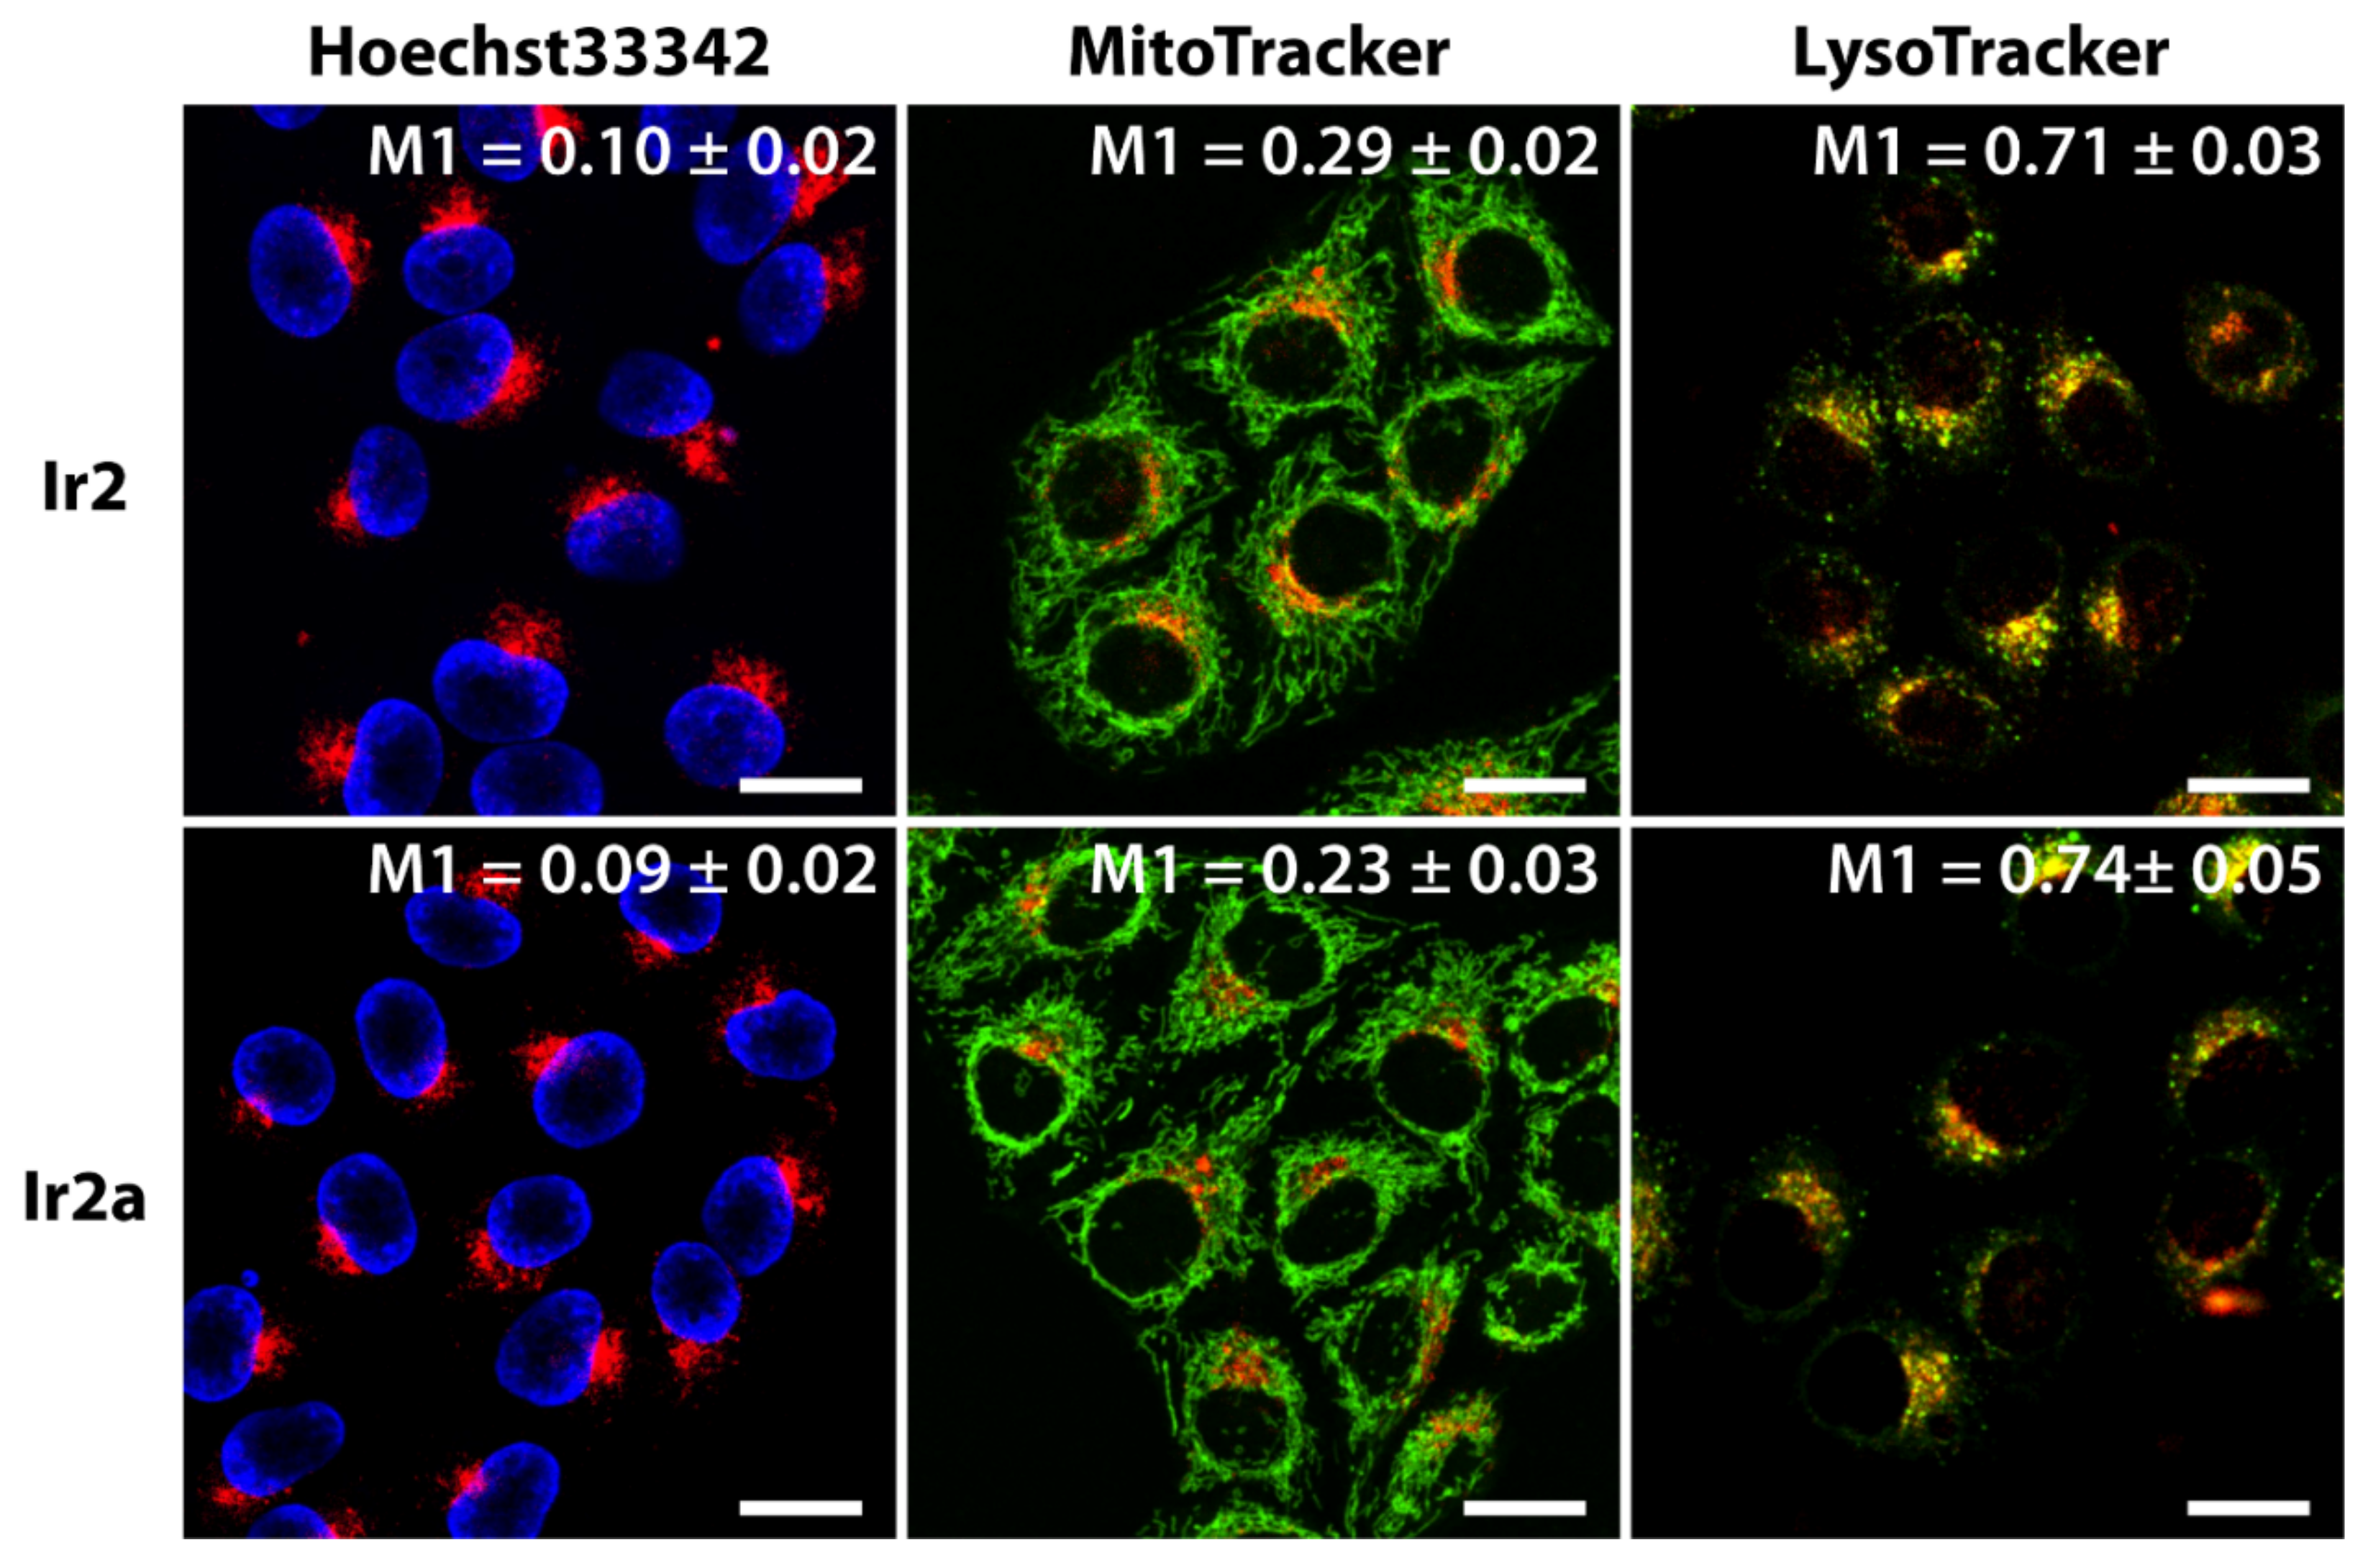
3.2.3. Colocalization Experiments.

To clarify selectivity in the probe accumulation inside the cells we tried to co-localize the areas with bright luminescent signal with the markers of some cellular compartments, using vital markers for nuclei, mitochondria, and acidic endolysosomes.
Co-staining of the cells with the complexes and organelle-specific dyes showed that both Ir2 and Ir2a display preferential accumulation in the lysosomes for all cell types studied with somewhat less selectivity in the case of CT 26 cell line (Figure 7, Figures S45 and S46). Considering relatively high molecular mass of the complexes, it can be reasonably suggested that they enter the cells by nonspecific fluid phase endocytosis (FPE) and finally are delivered to lysosomes. They are unlikely penetrate directly through the plasma and mitochondria membranes and slow dynamics of the dyes appearance in lysosomes perfectly fits characteristics of FPE.

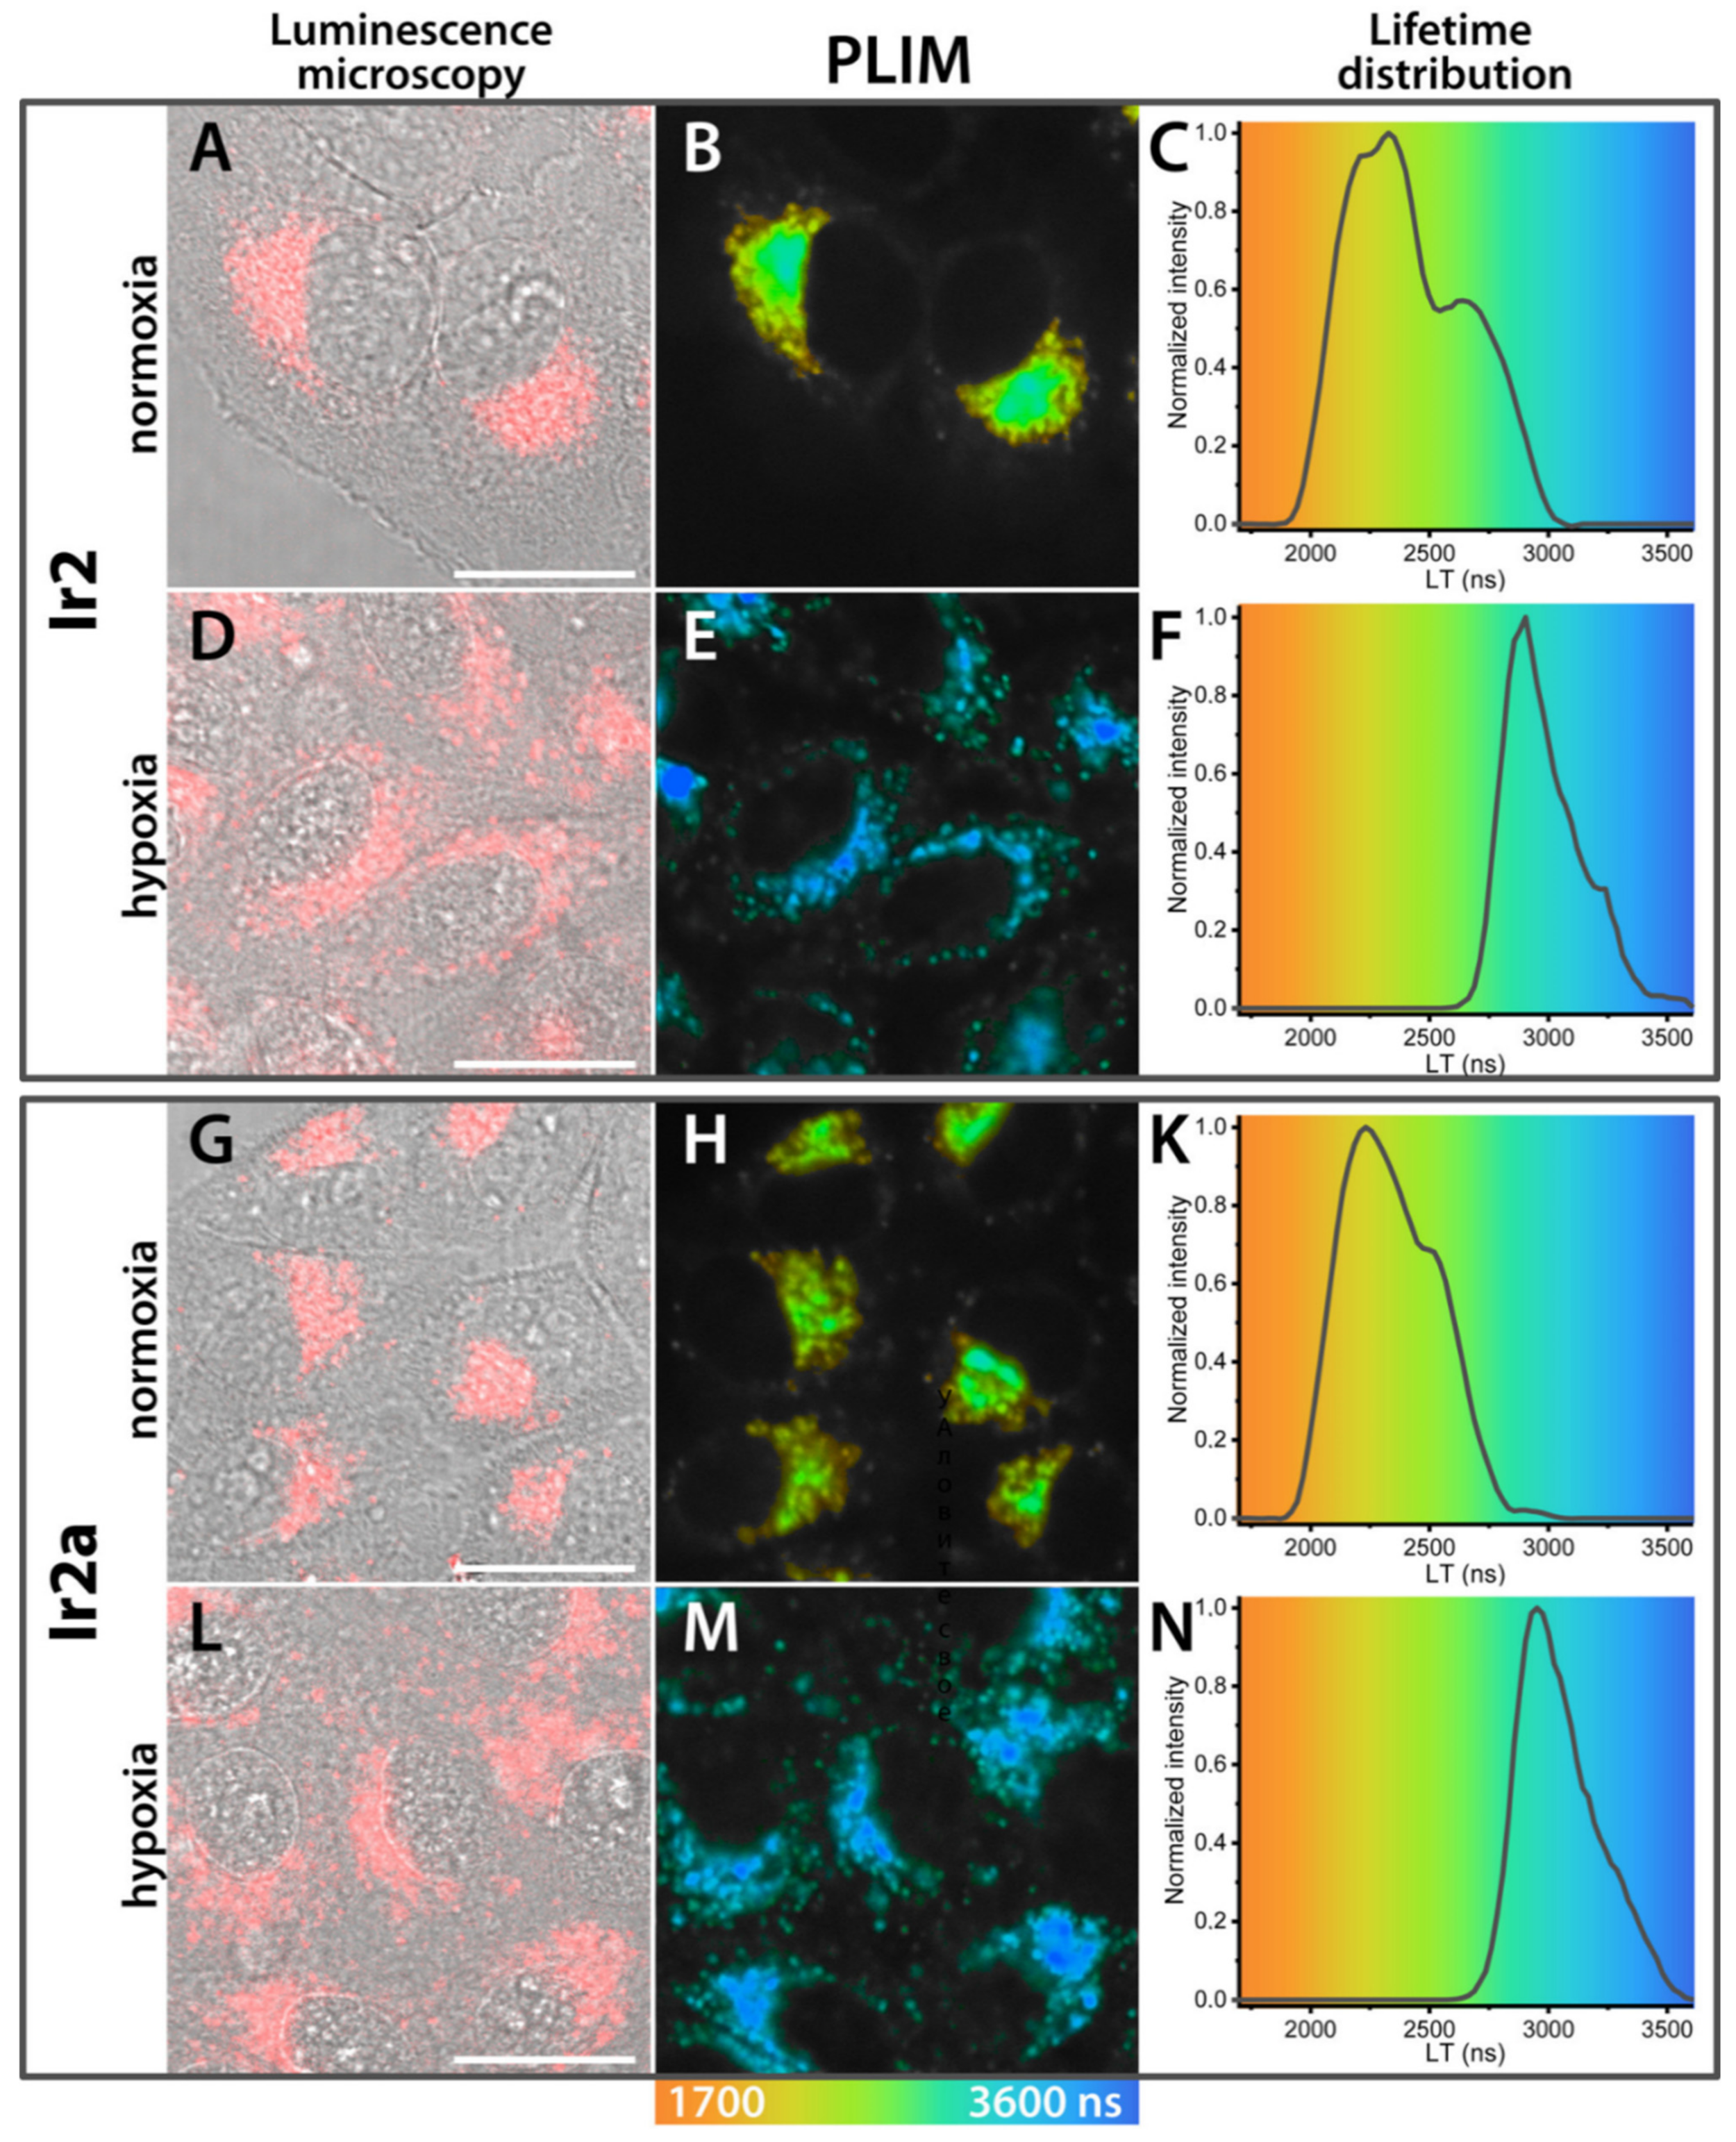
3.2.4. PLIM Experiments

Next, we assessed phosphorescence lifetimes of Ir2 and Ir2a in three cell lines mentioned above under normoxic and hypoxic conditions using PLIM, Figure 8, Figures S47 and S48. HeLa, CT26, and CHO-K1 were incubated with non-toxic concentration (40–100 µM) of the complexes; hypoxia was simulated by placing cover glass over cells monolayer for 2 h (equivalent to ~1–5% O2 [60]). The obtained data indicate that for all cell types under study the probes PLIM signal is localized in the same areas where phosphorescence was detected by confocal microscopy. In cellular environment both probes display monoexponential phosphorescence decay (χ2 ≤ 1.2) with the lifetime values, which fall in the τ2 range found for Ir2 and Ir2a in aerated and degassed FBS solutions, vide supra. Under hypoxic conditions the complexes display relatively narrow lifetime distributions; the weighted averages cover the interval 2.8 to 3.0 µs that is somewhat lower (for ca. 400 ns) than the values obtained for deaerated FBS solutions, Figure 8, Figure S47 and S48. This effect can be explained either by lower viscosity of cellular media or by incomplete deoxygenation of the corresponding compartment in living cells. A certain local inhomogeneity of the lifetime map is observed; however, the scatter does not exceed 150 ns (5%).
The lifetime distribution in aerated cells is expectedly characterized by substantially wider distribution profile and stronger inhomogeneity of the lifetime map. Similar to deaerated samples the weighted averages (2.0–2.4 µs) in aerated cells are slightly lower than τ2 values found in aerated FBS and this difference can be analogously ascribed to the variations in media viscosity and excessive accumulation of oxygen in a certain cell compartment. This uncertainty in the assignment of the observed local lifetime variations means that careful attention should be paid to interpretation of the PLIM results from the viewpoint of local oxygen concentrations. Nevertheless, one can see that both complexes display a good dynamic range in terms of phosphorescence lifetimes: hypoxia-induced changes are ~0.9 µs, or ~50% of the initial value, showing a high potential of the novel probes as phosphorescent sensors of intracellular oxygen.

4. Materials and Methods

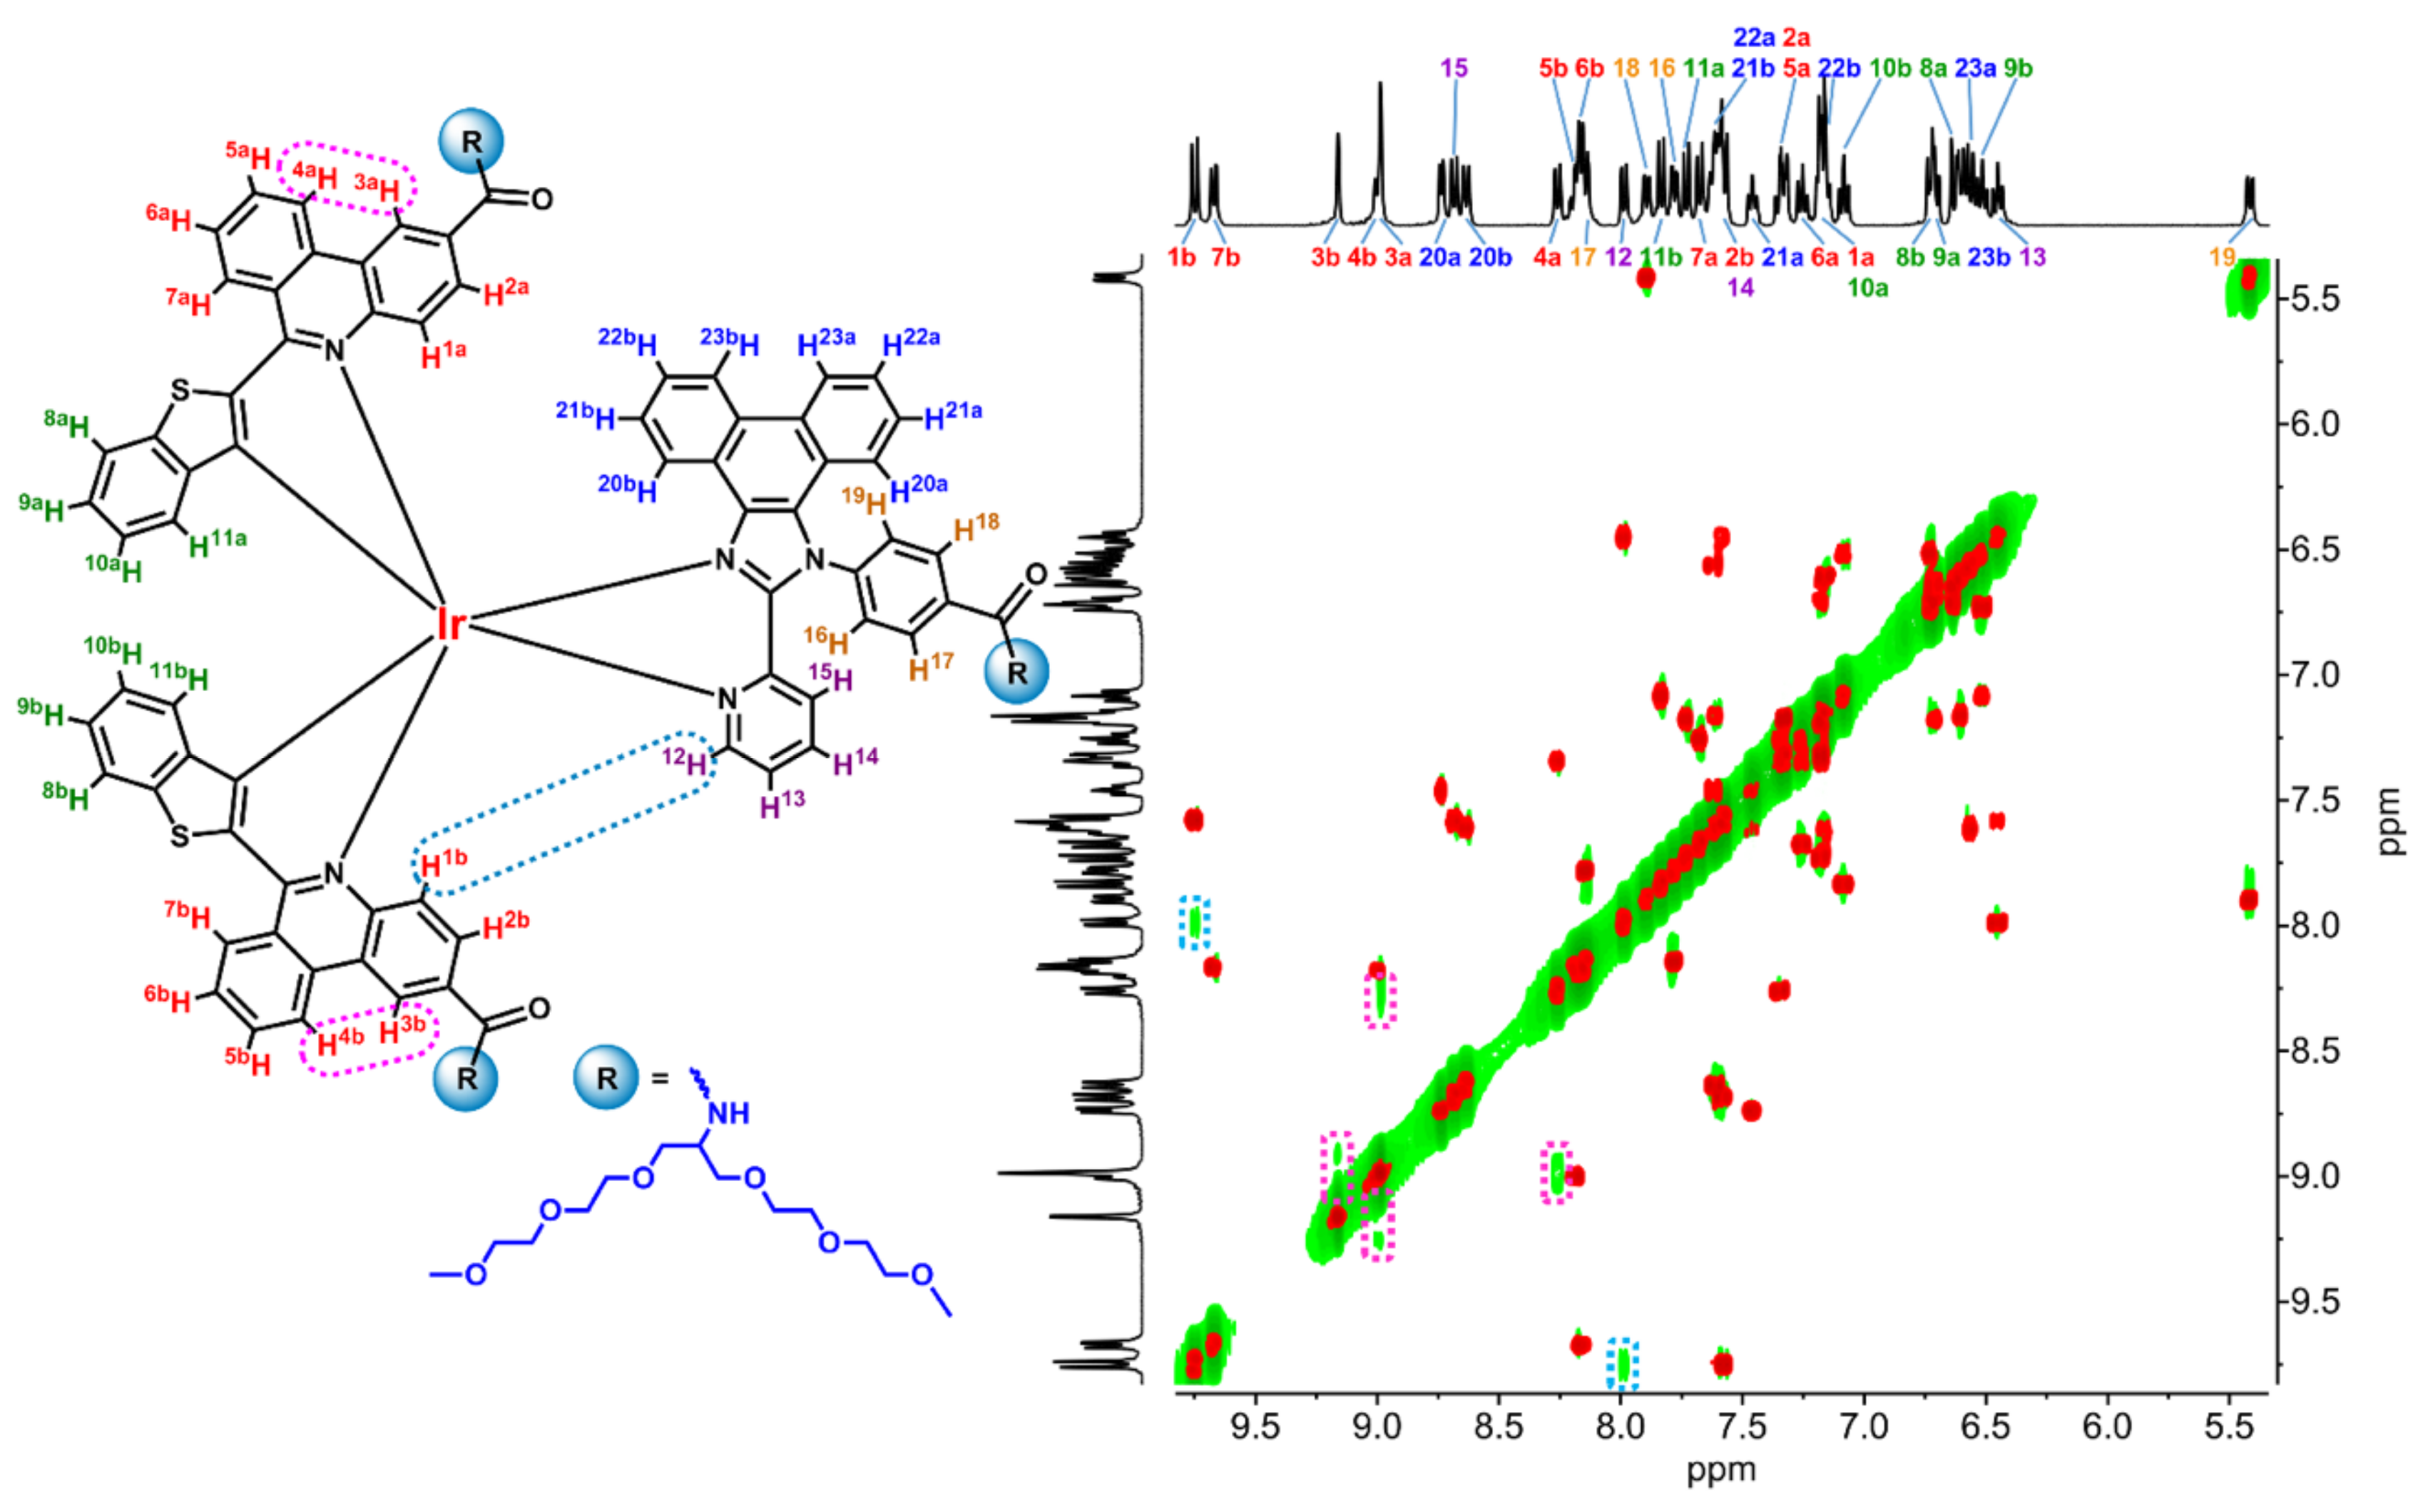
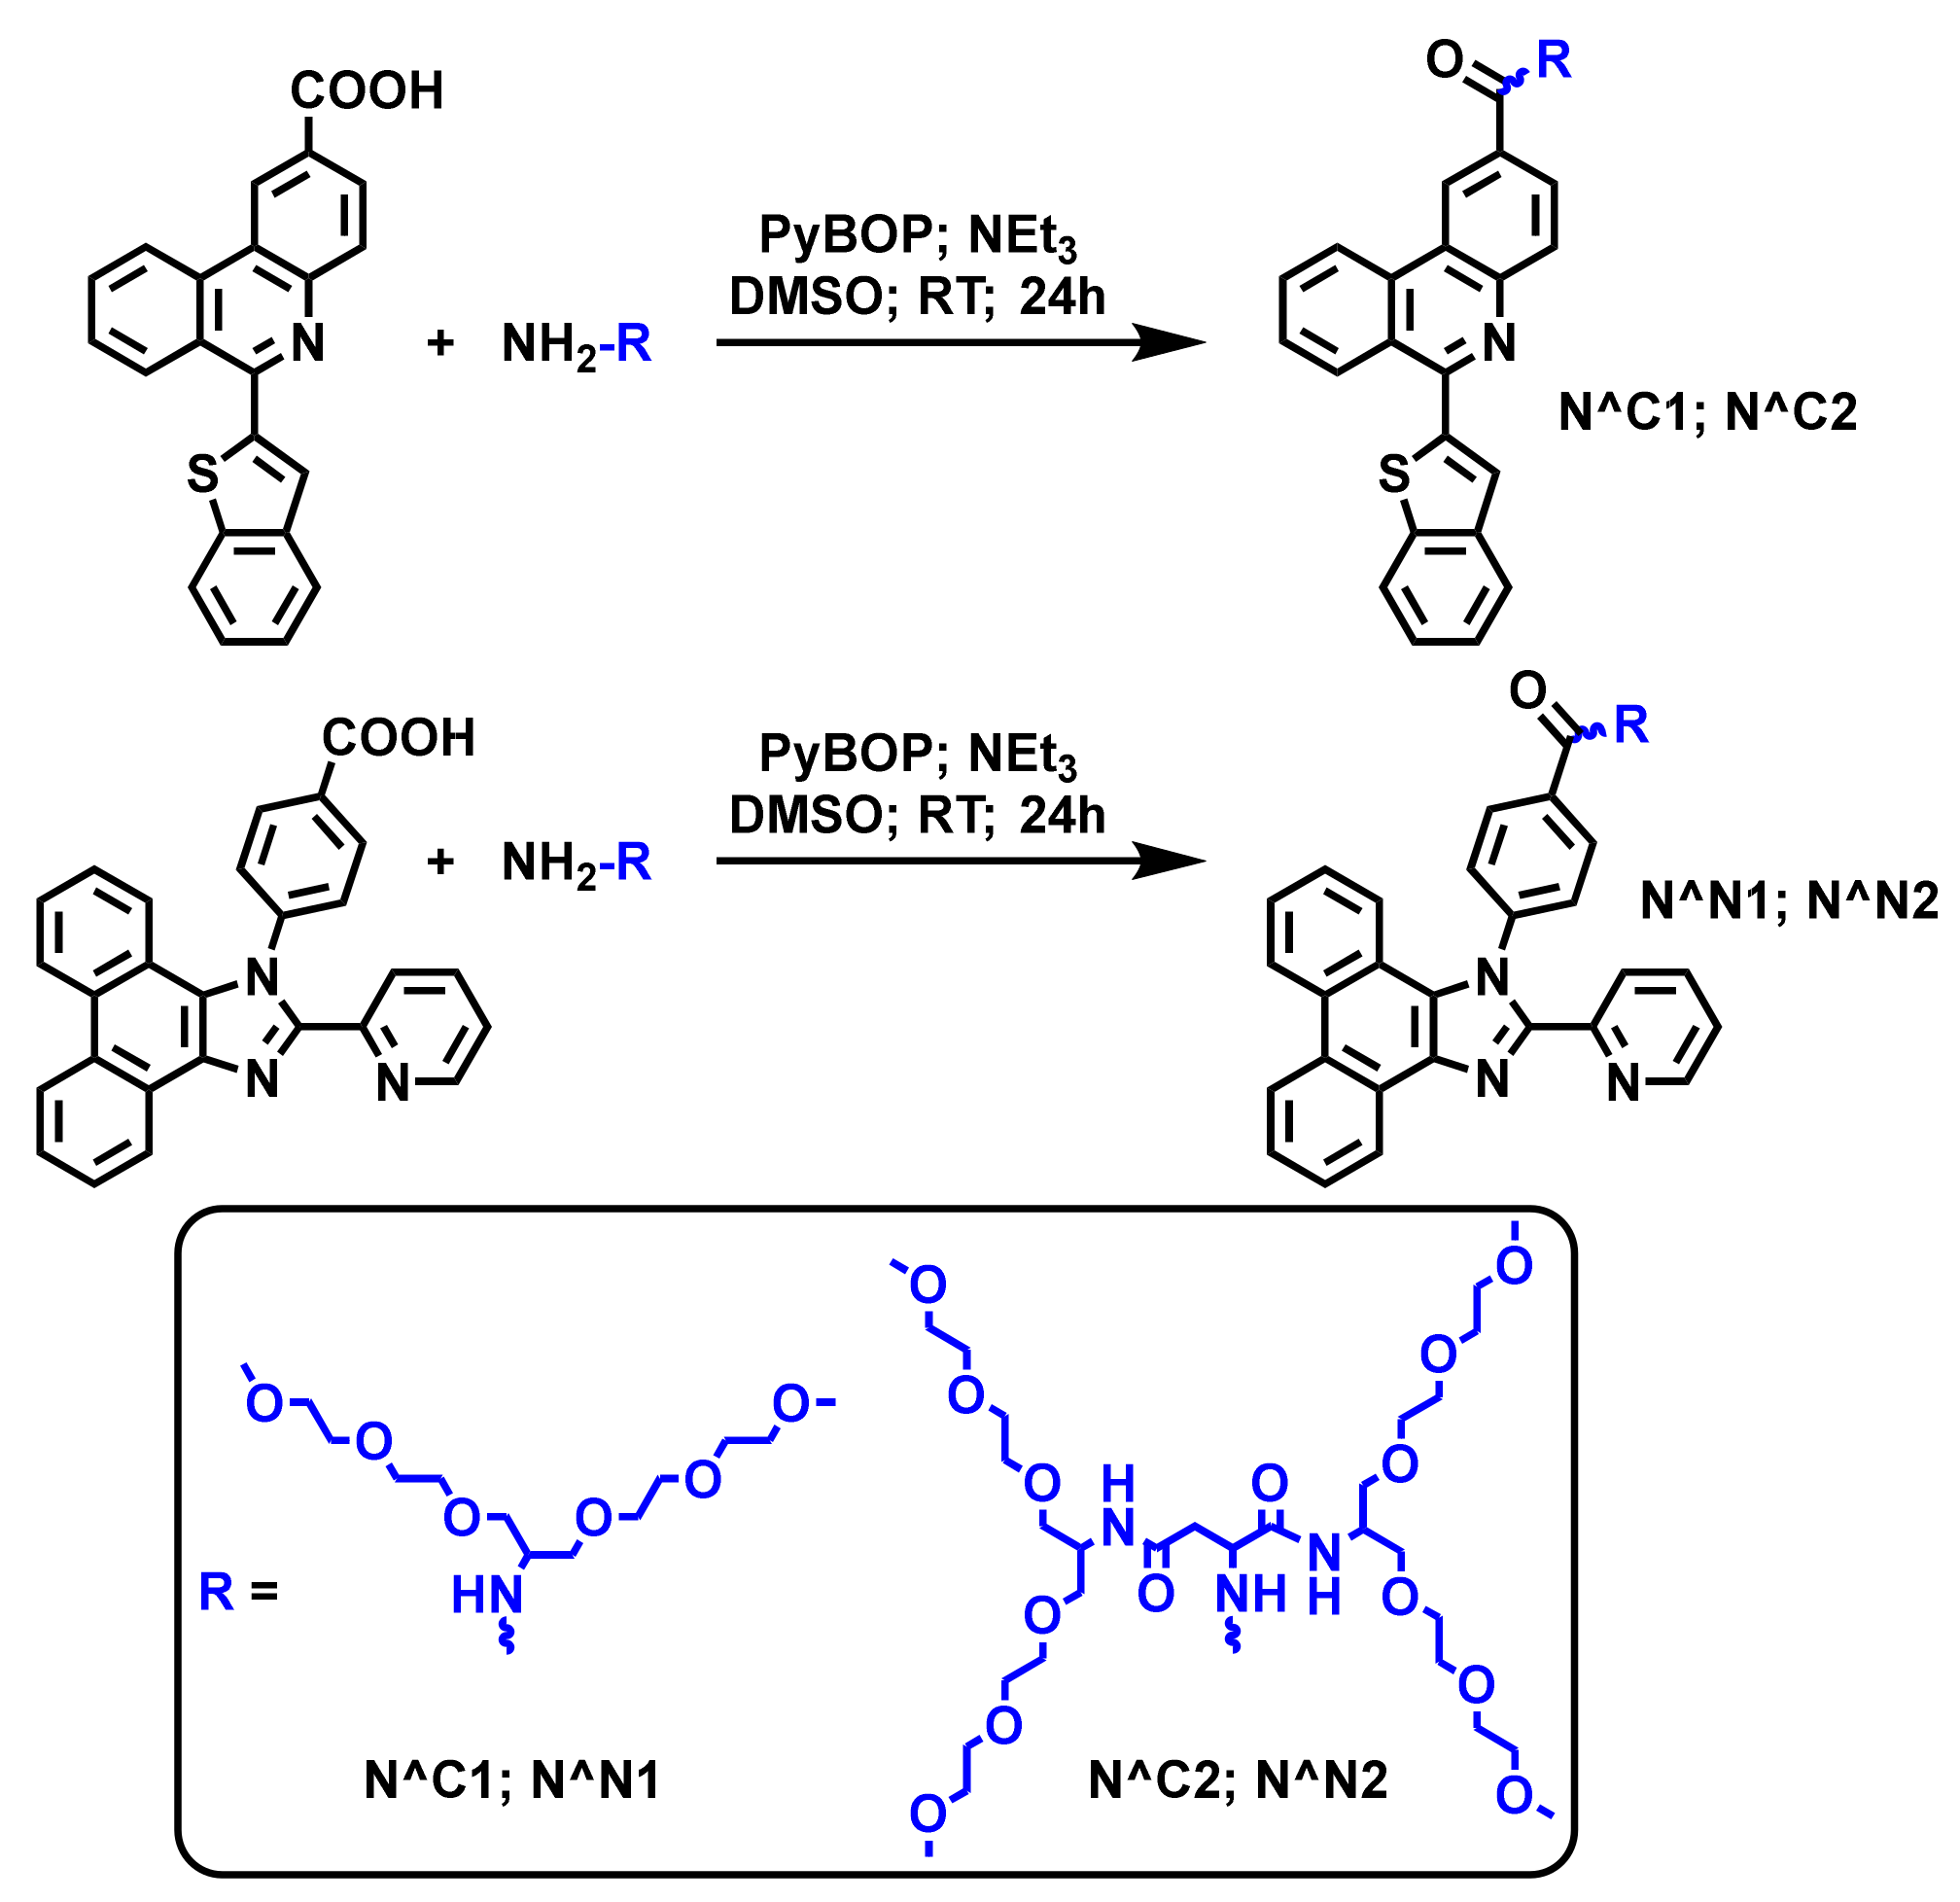
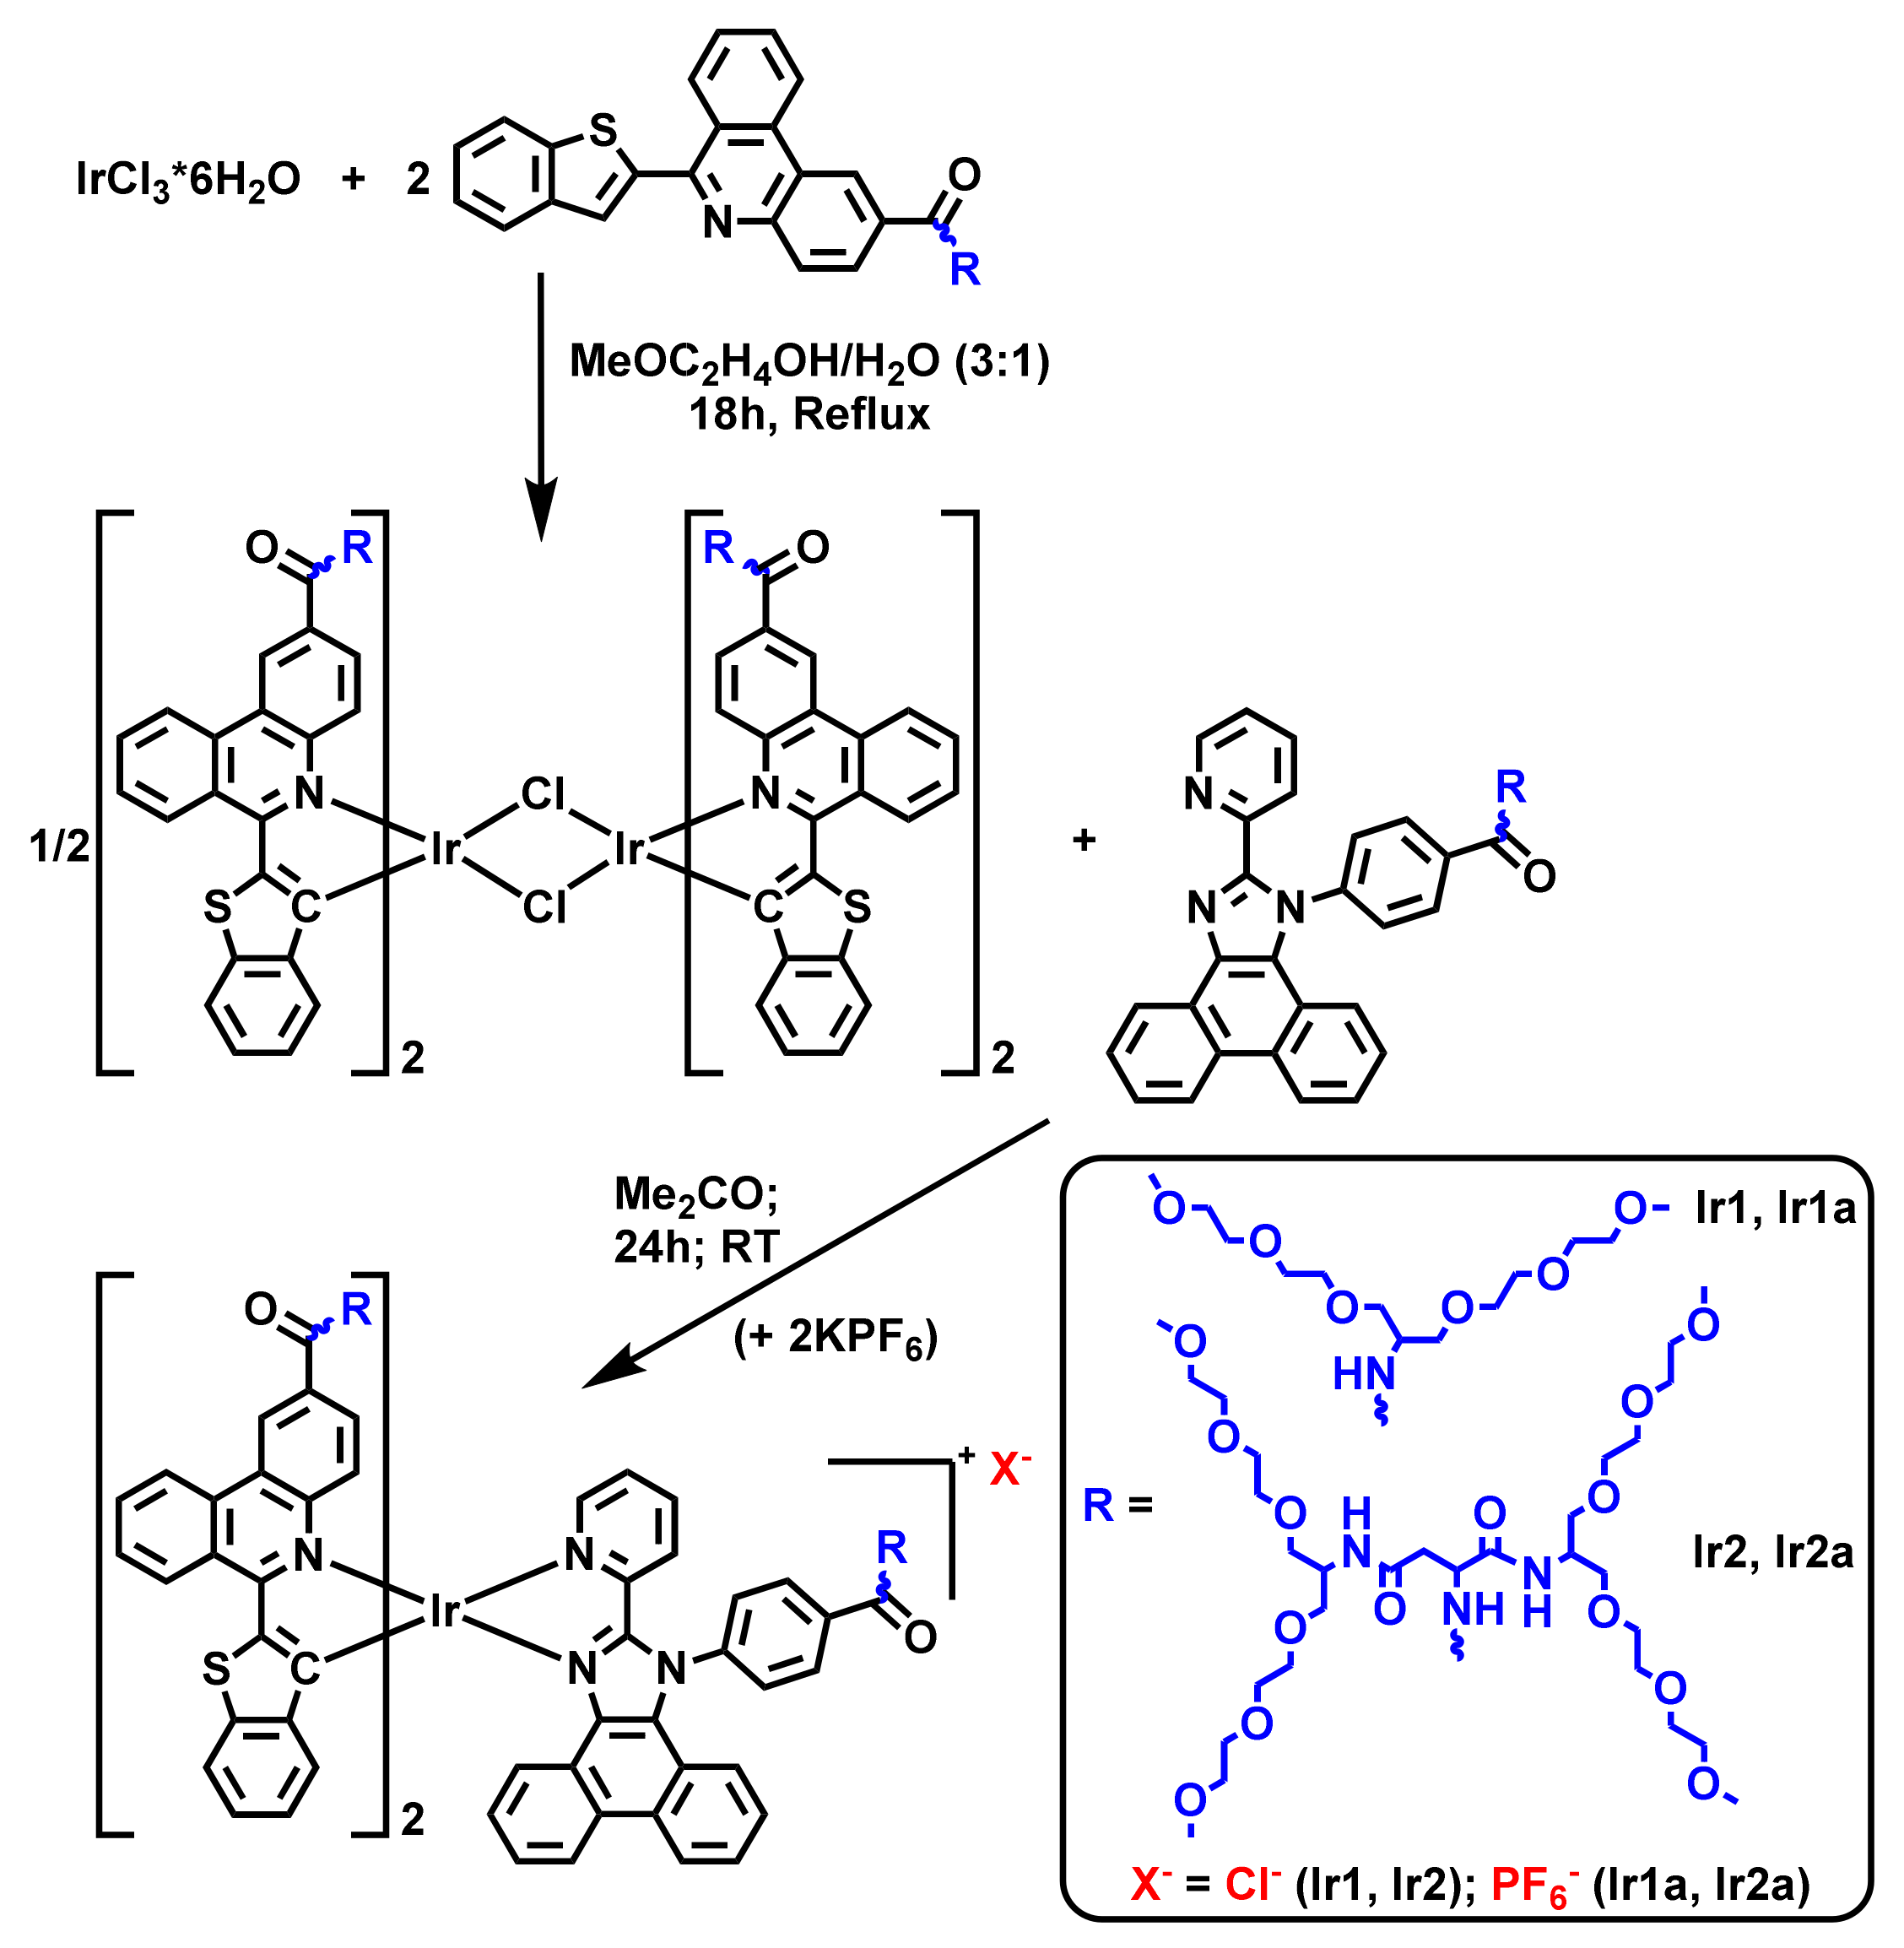
4.1. Synthesis of Ligands and Complexes

General comments. The 1H, 1H-1H COSY and NOESY (400 MHz) NMR spectra were recorded on a Bruker 400 MHz Avance; chemical shift values were referenced to the solvent residual signals. Mass spectra were recorded on a Bruker maXis HRMS-ESI-QTOF in the ESI+ mode. Boc-L-aspartic acid [61], 6-(benzo[b]thiophen-2-yl)phenanthridine-2-carboxylic [52] acid and 2,5,8,12,15,18-hexaoxanonadecan-10-amine [62] (NH2-2OEG) were obtained according to the published procedures. Other reagents (Merck KGaA, Darmstadt, Germany) and solvents (Vekton, St. Petersburg, Russia) were used as received without further purification. NMR and ESI-MS spectra for all substances obtained are presented in Supporting Materials file.
Synthesis of Boc-NH-4OEG. Boc-l-aspartic acid (93.2 mg, 0.400 mmol), the corresponding amine (NH2-2OEG, 129.8 mg, 0.440 mmol), benzotriazolyloxytripyrrolidinophosphonium hexafluorophosphate (PyBOP, 218.4 mg, 0.420 mmol), NEt3 (ca. 80 mg, 0.792 mmol) and dry DMSO (1.0 mL) were placed in a 5 mL vial. The reaction mixture was stirred for 18 h at RT and thoroughly evaporated. The dried residue was dissolved in 50 mL of chloroform and sequentially washed with (i) 5 mL of brine with 0.25 g of citric acid monohydrate, (ii) 5 mL of brine with 0.1 g of NaHCO3 and (iii) with 5 mL of pure brine. The organic layer was dried over Na2SO4 and then evaporated to give the oily substance. It was dissolved in EtOAc/n-hexane 5:1 mixture, and purified using column chromatography (sequentially eluted with EtOAc and EtOAc/methanol 5:1 mixture). After evaporation the resulting ligand was obtained as colorless viscous oil. 271 mg, yield 86%. 1H NMR (CDCl3, 400 MHz, δ): 7.08 (br d, 1H, NH), 6.62 (br d, 1H, NH), 6.16 (br d, 1H, NH), 4.44 (br m, 1H, CH), 4.17 (br m, 2H, CH), 3.69–3.47 (m, 40H, CH2), 3.39 (s, 12H, CH3), 2.85–2.52 (m, 2H, CH2), 1.45 (s, 9H, CH3). HRMS (ESI) m/z: 810.4576 calculated for C35H69N3NaO16+ [M + Na]+, found 810.4579.
Synthesis of NH2-4OEG. Solution of Boc-NH-4OEG (271 mg, 0.344 mmol) in 4 mL of 1:1 mixture of CH2Cl2/CF3CO2H was stirred for 5 h at RT in a 25 mL vial. The reaction mixture was thoroughly evaporated, the dried residue was dissolved in 100 mL of chloroform and sequentially washed two times with 10 mL of brine with addition 0.15 g of NaHCO3 and once with 5 mL of pure brine. The organic layer was dried over Na2SO4 and then evaporated to give the oily substance. 222 mg, yield 94%. 1H NMR (CDCl3, 400 MHz, δ): 7.68 (d, J = 8.6 Hz, 1H, NH), 6.92 (br d, 1H, NH), 4.22 (br m, 3H, CH), 3.72–3.49 (m, 40H, CH2), 3.40 (s, 12H, CH3), 2.77–2.42 (m, 2H, CH2). HRMS (ESI) m/z: 688.4232 calculated for C30H62N3O14+ [M + H]+, found 688.4225.
Synthesis of N^C# ligands (N^C1 and N^C2). 6-(benzo[b]thiophen-2-yl)phenanthridine-2-carboxylic acid (53.2 mg, 0.150 mmol), the corresponding amine (NH2-2OEG or NH2-4OEG, 0.165 mmol), benzotriazolyloxytripyrrolidinophosphonium hexafluorophosphate (PyBOP, 81.7 mg, 0.157 mmol), NEt3 (ca. 30 mg, 0.297 mmol) and dry DMSO (0.5 mL) were placed in a 5 mL vial. The reaction mixture was stirred for 18 h at RT and thoroughly evaporated. The dried residue was dissolved in 50 mL of chloroform and sequentially washed with (i) 5 mL of brine with 0.25 g of citric acid monohydrate, (ii) 5 mL of brine with 0.1 g of NaHCO3 and (iii) with 5 mL of pure brine. The organic layer was dried over Na2SO4 and then evaporated to give the oily substance. It was dissolved in EtOAc/n-hexane 5:1 mixture, and purified using column chromatography (eluted with EtOAc). After evaporation the resulting ligand was obtained as colorless viscous oil.
N^C1. 81.5 mg, yield 86%. 1H NMR ((CD3)2CO, 400 MHz, δ): 9.32 (s, 1H), 9.00 (d, J = 8.0 Hz, 1H), 8.84 (d, J = 8.0 Hz, 1H), 8.32 (d, J = 9.4 Hz, 1H), 8.19 (d, J = 8.6 Hz, 1H), 8.17 (s, 1H), 8.10 (d, J = 8.6 Hz, 1H, NH), 8.09–8.02 (m, 3H), 7.91 (dd, J = 8.6 Hz, J = 8.2 Hz, 1H), 7.52–7.47 (m, 2H), 4.55 (m, 1H, CH), 3.83–3.46 (m, 20H, CH2), 3.25 (s, 6H, CH3). HRMS (ESI) m/z: 655.2454 calculated for C35H39N2NaO7S+ [M + Na]+, found 655.2407.
N^C2. 119.9 mg, yield 78%. 1H NMR ((CD3)2CO, 400 MHz, δ): 9.46 (s, 1H), 9.20 (d, J = 8.0 Hz, 1H, NH), 9.09 (d, J = 8.4 Hz, 1H), 8.84 (d, J = 8.4 Hz, 1H), 8.36 (d, J = 9.0 Hz, 1H), 8.20 (d, J = 8.6 Hz, 1H), 8.18 (s, 1H), 8.09–8.03 (m, 3H), 8.02 (d, J = 7.4 Hz, 1H, NH), 7.91 (dd, J = 8.6 Hz, J = 8.2 Hz, 1H), 7.87 (d, J = 8.2 Hz, 1H, NH), 7.52–7.47 (m, 2H), 5.15 (m, 1H, CH), 4.26 (m, 2H, CH), 3.65–3.38 (m, 40H, CH2), 3.33–3.25 (m, 12H, CH3). HRMS (ESI) m/z: 1047.4613 calculated for C52H71N4NaO15S+ [M + Na]+, found 1047.4636.
Synthesis of 4-(2-(pyridin-2-yl)-1H-phenanthro [9,10-d]imidazol-1-yl)benzoic acid. Phenanthrene-9,10-dione (100 mg, 0.480 mmol), 4-aminobenzoic acid (165 mg, 1.200 mmol), 2-pyridinebenzaldehyde (52 mg, 0.480 mmol), ammonium acetate (185 mg, 2.400 mmol), and 5 mL of glacial acetic acid were stirred at 70 °C in a 25 mL round-bottom flask. After 3 h, the solution was evaporated. While cooling to room temperature, the resulted oil turned to beige precipitate. It was washed and centrifuged three times with 2 mL of methanol. Then the product was recrystallized from hot acetone and finally dried under vacuum. Yield: 50 mg, 25%. 1H NMR ((CD3)2SO, 400 MHz, δ): 13.26 (br s, 1H), 8.95 (d, J = 8.3 Hz, 1H), 8.89 (d, J = 8.4 Hz, 1H), 8.72 (d, J = 7.9, 1H), 8.29 (d, J = 7.7 Hz, 2H), 8.17 (d, J = 8.5 Hz, 2H), 7.95 (dd, J = 8.3 Hz, J = 7.9 Hz, 1H), 7.81 (dd, J = 8.5, J = 8.1, 1H), 7.77 (d, J = 8.5 Hz, 2H), 7.72 (dd, J = 8.6, J = 8.0, 1H), 7.59 (dd, J = 8.4, J = 7.8, 1H), 7.38 (dd, J = 8.7, J = 8.3, 1H), 7.34 (dd, J = 8.8, J = 8.0, 1H), 7.05 (d, J = 8.6, 1H). HRMS (ESI) m/z: 438.1218 calculated for C27H17N3NaO2+ [M + Na]+, found 438.1197.
Synthesis of N^N# ligands (N^N1 and N^N2). 4-(2-(pyridin-2-yl)-1H-phenanthro [9,10-d]imidazol-1-yl)benzoic acid (20.8 mg, 0.050 mmol), the corresponding amine (NH2-2OEG or NH2-4OEG, 0.055 mmol), benzotriazolyloxytripyrrolidinophosphonium hexafluorophosphate (PyBOP, 26.0 mg, 0.050 mmol), NEt3 (ca. 10 mg, 0.099 mmol), and dry DMSO (0.5 mL) were placed in a 5 mL vial. The reaction mixture was stirred for 18 h at RT and thoroughly evaporated. The dried residue was dissolved in 50 mL of chloroform and sequentially washed with (i) 5 mL of brine with 0.25 g of citric acid monohydrate, (ii) 5 mL of brine with 0.1 g of NaHCO3, and (iii) with 5 mL of pure brine. The organic layer was dried over Na2SO4 and then evaporated to give the oily substance. It was dissolved in EtOAc/n-hexane 5:1 mixture, and purified using column chromatography (sequentially eluted with EtOAc and EtOAc/methanol 5:1 mixture). After evaporation the resulting ligand was obtained as colorless viscous oil.
N^N1. 31.1 mg, yield 90%. 1H NMR (CD3OD, 400 MHz, δ): 8.86 (d, J = 8.0 Hz, 1H), 8.81 (d, J = 8.4 Hz, 1H), 8.76 (d, J = 8.0, 1H), 8.56 (d, J = 8.4 Hz, 1H, NH), 8.40 (d, J = 5.0 Hz, 1H), 8.07 (d, J = 8.4 Hz, 2H), 8.04 (d, J = 8.4 Hz, 1H), 7.89 (dd, J = 8.6, J = 8.0, 1H), 7.76 (dd, J = 8.4, J = 7.8, 1H), 7.72–7.66 (m, 3H), 7.57 (dd, J = 8.7, J = 8.3, 1H), 7.36 (dd, J = 8.8, J = 8.0, 1H), 7.28 (dd, J = 8.4, J = 7.8, 1H), 7.20 (d, J = 8.6, 1H), 4.49 (m, 1H, CH), 3.78–3.52 (m, 20H, CH2), 3.39–3.33 (m, 6H, CH3). HRMS (ESI) m/z: 715.3108 calculated for C40H44N4NaO7+ [M + Na]+, found 715.3089.
N^N2. 47.3 mg, yield 87%. 1H NMR (CD3OD, 400 MHz, δ): 8.87 (d, J = 8.1 Hz, 1H), 8.81 (d, J = 8.5 Hz, 1H), 8.77 (d, J = 8.1, 1H), 8.42 (d, J = 4.6 Hz, 1H), 8.11 (d, J = 8.6 Hz, 2H), 8.06–7.98 (m, 1H), 7.90 (dd, J = 8.5, J = 8.0, 1H), 7.76 (dd, J = 8.5, J = 8.0, 1H), 7.73–7.68 (m, 3H), 7.58 (dd, J = 8.6, J = 8.2, 1H), 7.38 (dd, J = 8.2, J = 7.8, 1H), 7.28 (dd, J = 8.4, J = 7.8, 1H), 7.18 (d, J = 9.2, 1H), 5.02 (m, 1H, CH), 4.21 (m, 2H, CH), 3.68–3.46 (m, 40H, CH2), 3.39–3.32 (m, 12H, CH3), 2.92–2.78 (m, 2H, CH2). HRMS (ESI) m/z: 565.2577 calculated for C57H76N6Na2O15+ [M + 2Na]2+, found 565.2566.
General procedure for the synthesis of dimeric complexes [Ir2(N^C#)4Cl2] (D1, D2). IrCl3·6H2O (12.2 mg, 0.030 mmol), the corresponding cyclometallating ligand (N^C1 or N^C2, 0.063 mmol), NaHCO3 (4.8 mg, 0.057 mmol), 2-methoxyethanol (4.5 mL), and distilled water (1.5 mL) were placed in a 25 mL round-bottom flask. The reaction mixture was stirred at 100 °C for 18 h. The resulting dark-red solution was dried. The solid residue was dissolved in 1.5 mL of benzene and centrifuged. The resulting solution was dried, dissolved in CH2Cl2/n-hexane 5:1 mixture, and purified using column chromatography (sequentially eluted with CH2Cl2 and CH2Cl2/methanol 10:1 mixture). The solution obtained was evaporated, the dried residue was dissolved in 0.2 mL of acetone and then precipitated by adding 9.0 mL of Et2O. The precipitate was isolated by centrifugation and then it was thoroughly vacuum-dried to give the resulting dimeric complex.
[Ir2(N^C1)4Cl2] (D1). Dark-red solid, 36.6 mg, yield 82%.1H NMR (CD3OD, 400 MHz, 298 K, δ): 8.86 (d, J = 8.1 Hz, 1H), 8.78 (s, 1H), 8.68 (d, J = 8.1 Hz, 1H), 8.14 (d, J = 8.1 Hz, 1H), 7.91 (dd, J = 6.0 Hz, J = 7.0 Hz, 1H), 7.82 (dd, J = 6.0 Hz, J = 7.0 Hz, 1H), 7.34 (br d, 1H), 6.65 (br dd, 1H), 6.35 (d, J = 8.6 Hz, 1H), 5.99 (dd, J = 7.6 Hz, 7.2 Hz, 1H), 5.34 (d, J = 8.0 Hz, 1H), 4.43 (br m, 1H, CH), 3.88–3.38 (m, 20H, CH2), 3.31–3.19 (m, 6H, CH3). HRMS (ESI) m/z: 728.2328 calculated for C70H79IrN4O14S22+ [Ir(N^C1)2+H]2+, found 728.2358.
[Ir2(N^C2)4Cl2] (D2). Dark-red solid, 53.2 mg, yield 78%.1H NMR (CD3OD, 400 MHz, 323K, δ): 8.95 (s, 1H), 8.94 (d, J = 8.6 Hz, 1H), 8.91 (d, J = 7.2 Hz, 1H), 8.81 (s, 1H), 8.62 (d, J = 8.3 Hz, 1H), 8.48 (d, J = 8.6 Hz, 1H), 8.03–7.90 (m, 5H), 7.85 (d, J = 8.3 Hz, 1H), 7.48 (d, J = 7.2 Hz, 2H), 6.74 (dd, J = 8.6 Hz, 8.2 Hz, 1H), 6.33 (d, J = 8.5 Hz, 1H), 6.24 (d, J = 9.0 Hz, 1H), 6.03–5.98 (m, 2H), 5.38 (m, 1H, CH), 5.34 (d, J = 8.4 Hz, 1H), 5.13 (m, 1H, CH), 4.52 (m, 1H, CH), 4.34 (m, 1H, CH), 4.25 (m, 2H, CH), 3.81–3.42 (m, 80H, CH2), 3.40–3.24 (m, 24H, CH3), 3.01–2.87 (m, 4H, CH2). HRMS (ESI) m/z: 747.6359 calculated for C104H144IrN8O30S23+ [Ir(N^C2)2+2H]3+, found 747.6369.
General procedure for the synthesis of iridium [Ir(N^C#)2(N^N#)]Cl complexes (Ir1, Ir2). The corresponding Ir(III) dimeric complex (D1 or D2, 0.010 mmol), the diimine ligand (N^N1 or N^N2, 0.021 mmol) and acetone (2 mL) were placed in a 5 mL vial. The reaction mixture was stirred for 18 h at RT. The solution obtained was evaporated, the residue was dissolved in 1.0 mL of water and centrifuged. Then the water solution was thoroughly evaporated, the dried substance was dissolved in 0.2 mL of acetone and precipitated by adding 9.0 mL of Et2O. The resulting suspension was solicited and centrifuged. The solid residue was additionally two times washed with 10 mL of Et2O using sonication and centrifuged. The precipitate was thoroughly vacuum-dried to give dark-red solid of the resulting complex.
[Ir(N^C1)2(N^N1)]Cl (Ir1). 40.1 mg, yield 92%. 1H NMR (CD3OD, 400 MHz, 323K, δ): 9.50-9.43 (m, 2H), 9.35 (s, 1H), 9.28 (bd, 1H), 9.19 (d, J = 8.6 Hz, 1H), 9.10 (bd, 1H), 8.89 (d, J = 8.2 Hz, 1H), 8.76 (s, 1H), 8.60 (d, J = 7.6 Hz, 1H), 8.22-8.17 (m, 6H), 8.11-7.98 (m, 3H), 7.78 (bd, 1H), 7.68 (d, J = 8.0 Hz, 1H), 7.59-7.53 (m, 2H), 7.42 (s, 2H), 7.25 (dd, J = 9.0 Hz, J = 8.6 Hz, 2H), 7.19 (dd, J = 8.0 Hz, J = 8.6 Hz, 2H), 6.91 (d, J = 7.8 Hz, 1H), 6.75-6.64 (m, 3H), 5.17-4.90 (m, 2H, CH2), 4.38 (m, 2H, CH), 4.12 (m, 1H, CH), 3.62-3.50 (m, 60H, CH2), 3.32-3.14 (m, 18H, CH3). HRMS (ESI) m/z: 1085.8859 calculated for C110H122IrN8NaO21S22+ [M + Na]2+, found 1085.8824.
[Ir(N^C2)2(N^N2)]Cl (Ir2). 60.0 mg, yield 89%. 1H NMR (CD3OD, 400 MHz, 323K, δ): 9.79 (d, J = 8.0 Hz, 1H), 9.72 (d, J = 8.0 Hz, 1H), 9.28 (s, 1H), 9.14 (d, J = 8.6 Hz, 1H), 9.00 (d, J = 8.4 Hz, 1H), 8.76 (s, 1H), 8.72 (d, J = 7.6 Hz, 1H), 8.67 (d, J = 8.6 Hz, 1H), 8.31-8.22 (m, 4H), 8.09 (d, J = 8.4 Hz, 1H), 8.01 (d, J = 8.2 Hz, 1H), 7.91 (d, J = 8.2 Hz, 1H), 7.81 (d, J = 8.3 Hz, 2H), 7.72 (d, J = 8.1 Hz, 2H), 7.66-7.59 (m, 3H), 7.53 (dd, J = 8.3 Hz, J = 8.1 Hz 1H), 7.42-7.30 (m, 3H), 7.25 (dd, J = 7.8 Hz, J = 8.0 Hz 1H), 7.21-7.14 (m, 3H), 6.76 (dd, J = 7.9 Hz, J = 8.3 Hz 1H), 6.72 (dd, J = 7.9 Hz, J = 8.3 Hz 1H), 6.65 (d, J = 8.4 Hz, 1H), 6.62-6.54 (m, 3H), 6.49 (dd, J = 7.7 Hz, J = 8.0 Hz 1H), 5.46 (m, 1H), 5.01 (m, 2H, CH), 4.87 (m, 1H, CH), 4.20 (m, 4H, CH), 4.09 (m, 2H, CH), 3.66-3.42 (m, 120H, CH2), 3.40-3.26 (m, 36H, CH3), 2.93-2.61 (m, 6H, CH2). HRMS (ESI) m/z: 1123.8030 calculated for C161H218IrN14Na2O45S22+ [M + 2Na]3+, found 1123.8099.
General procedure for the synthesis of iridium [Ir(N^C#)2(N^N#)]PF6 complexes (Ir1a, Ir2a). The corresponding Ir(III) complex (Ir1 or Ir2, 0.009 mmol), KPF6 (165.6 mg, 0.900 mmol) and acetone (2 mL) were placed in a 5 mL vial. The reaction mixture was stirred for 18 h at RT. The solution obtained was evaporated, suspended in 1.0 mL of 1,2-dichloroethane and centrifuged. The solid residue was sequentially washed two times with 0.3 mL of 1,2-dichloroethane and centrifuged. Then the combined 1,2-dichloroethane solution was evaporated. The dried substance was dissolved in 0.1 mL of acetone and precipitated by adding 4.5 mL of Et2O. The resulting suspension was solicited and centrifuged. The precipitate was thoroughly vacuum-dried to give dark-red solid of the resulting complex.
[Ir(N^C1)2(N^N1)]PF6 (Ir1a). 19.9 mg, yield 96%. Spectroscopic 1H, 1H-1H COSY and NOESY NMR (Figures S28 and S29) data are almost identical to those for the related Ir1 complex with Cl counterion. HRMS (ESI) m/z: 1074.3936 calculated for C110H123IrN8O21S22+ [M + H]2+, found 1074.3933.
[Ir(N^C2)2(N^N2)]PF6 (Ir2a). 29.0 mg, yield 93%. Spectroscopic 1H, 1H-1H COSY and NOESY NMR (Figures S30 and S31) data are almost identical to those for the related Ir2 complex with Cl counterion. HRMS (ESI) m/z: 1109.1484 calculated for C161H220IrN14O45S22+ [M + 2H]3+, found 1109.1521.

4.2. Photophysical Experiments

Photophysical measurements in solution were performed in aqueous media and, partially, in methanol. Absorption spectra were measured with a Shimadzu UV-1800 spectrophotometer (Shimadzu Corporation, Kyoto, Japan). The excitation spectra in solution were recorded using a Fluorolog-3 spectrofluorimeter (HORIBA Jobin Yvon Ltd., Kyoto, Japan). The emission spectra were registered using Avantes AvaSpec-2048 × 64 spectrometer (Avantes, Apeldoorn, Netherlands). The absolute emission quantum yield was determined in solution by a comparative method. LED (365 nm) was applied for pumping and [Ru(bpy)3][PF6]2 water solution (Φ = 0.040 air-saturated, 0.063 Ar-saturated) was used as the reference. Pulse laser TECH-263 Basic (wavelength 527 nm, pulse width 5 ns, repetition frequency 1000 Hz) (Laser Export, Moscow, Russia), a Hamamatsu H10682-01 photon counting head (Hamamatsu, Hamamatsu, Japan), a FASTComTec MCS6A1T4 multiple-event time digitizer (FAST ComTec, Oberhaching, Germany) and an Ocean Optics monochromator Monoscan-2000 (interval of wavelengths 1 nm) (Ocean Optics, Largo, FL, USA) were used for lifetime measurements. An oxygen meter PyroScience FireStingO2 (PyroScience GmbH, Aachen, Germany), equipped with an oxygen probe OXROB10 and a temperature sensor TDIP15, was used to determine partial pressure and concentration of molecular oxygen in aqueous solutions. Temperature control was performed by using a Quantum Northwest qpod-2e (Quantum Northwest Inc., Liberty Lake, WA, USA) cuvette sample compartment.

4.3. Cell Cultures

HeLa cells were maintained in Dulbecco’s modified Eagle medium (DMEM, Gibco, Carlsbad, CA, USA) with 10% fetal bovine serum (FBS, Biowest, Nuaille, France) and 1% penicillin/streptomycin (Gibco, Carlsbad, CA, USA). The Chinese hamster ovary CHO-K1 cells were cultured in DMEM/F12 (Biolot, St. Petersburg, Russia) medium supplemented with 10% FBS (Gibco, Carlsbad, CA, USA), 2 mM glutamine (Gibco, Carlsbad, CA, USA), and penicillin/streptomycin at a concentration 100 U/ mL (Thermo Fisher Scientific, Waltham, MA, USA). The murine colon carcinoma CT26 cells were cultured in DMEM (Gibco, Carlsbad, CA, USA) supplemented with 10% FBS (Gibco, Carlsbad, CA, USA), 2 mM glutamine (Gibco, Carlsbad, CA, USA), 10 µg/mL penicillin (Gibco, Carlsbad, CA, USA), and 10 mg/mL streptomycin (Gibco, Carlsbad, CA, USA).
All cell lines were maintained in a humidified incubator at 37 °C with 5% CO2 and passaged routinely using trypsin-EDTA (Thermo Fisher Scientific, Waltham, MA, USA). For live-cell confocal microscopy, the cells (1 × 10⁵ CT26 cells, 1 × 10⁵ HeLa cells, or 1 × 10⁵ CHO-K1 cells in 1.5–2 mL DMEM) were seeded in glass-bottomed 35 mm dishes (Ibidi GmbH, Gräfelfing, Germany) or Petri dishes with glass coverslips (Nunc, Thermo Fisher Scientific, Waltham, MA, USA) and incubated for 24–48 h until reaching a confluence of ~70%. Ir2 and Ir2a complexes dissolved in water were added to the cells in a final concentration of 40 µM for CHO-K1 cells, 75 µM for HeLa cells, and 100 µM for CT26 cells. For the study of internalization dynamics, the cells were incubated with the complexes and imaged at different time-points starting from 20 min. Before the cell imaging, the medium in the glass bottom dishes was changed to DMEM without phenol red.
For PLIM experiments, the cells were incubated with Ir2 and Ir2a for 3 h for CT26 cells and 24 h for HeLa and CHO-K1 cells and washed with fresh media prior to microscopy. Hypoxia was induced by placing a cover glass above the cell monolayer for 2 h.

4.4. MTT Assay

The cells (2 × 10³ CT26 cells, 2 × 10⁴ HeLa cells, 1 × 10⁴ CHO-K1 cells in 100–200 µL of culture medium/well) were seeded in 96-well plates (Nunc, Thermo Fisher Scientific, Waltham, MA, USA) and incubated overnight. The complexes were added to the cells at concentrations 0–150 µM for 24 h, afterwards the cells were treated with the MTT reagent 3(4,5-dimethyl-2-thiasolyl)-2,5-diphenyl-2H-tetrasole bromide (Thermo Fisher Scientific, Waltham, MA, USA) at the concentration 0.5 mg/mL according to the manufacturer’s protocol. Following further incubation at 37 °C under 5% CO2 for 4 h, the formazan crystals were dissolved in DMSO (Merck, Munich, Germany) and the absorbance was measured at 570 nm using a Thermo Scientific Multiskan FC microplate reader (Thermo Fisher Scientific, Waltham, MA, USA). The percentage of viable cells relative to the control was determined for each well. For each concentration of the complex MTT was repeated 30 times for CT26, 15 times for HeLa, and 5 times for CHO-K1 cells.

4.5. Cell Compartment Staining

For the vital staining of lysosomes and late endosomes in HeLa and CHO-K1 cells, LysoTracker Green DND-26 (Thermo Fisher Scientific, Waltham, MA, USA) was used at the concentration of 50 nM. For the vital staining of mitochondria in HeLa and CHO-K1 cells, MitoTracker Green FM (Thermo Fisher Scientific, Waltham, MA, USA) was used at the concentration of 50 nM. LysoTracker or MitoTracker was added into the culture medium for 30 min prior to confocal imaging. For the vital staining of the nuclei in HeLa and CHO-K1 cells, Hoechst 33342 (Thermo Fisher Scientific, Waltham, MA, USA) was used at the concentration of 1.6 μM for 5 min. For the staining of lysosomes and late endosomes in CT26 cells, LysoTracker Yellow HCK-123 (Thermo Fisher Scientific, Waltham, MA, USA) was used at the concentration of 3 µM. Mitochondria were identified by endogenous fluorescence from the reduced nicotinamide adenine dinucleotide NADH. The nuclei were stained with DAPI (Thermo Fisher Scientific, Waltham, MA, USA, 0.3 µM).

4.6. Confocal Microscopy and Colocalization Assay

The differential interference contrast (DIC) and fluorescence images of HeLa cells were taken using an Olympus FV3000 laser scanning confocal microscope (Olympus Corporation, Tokyo, Japan). Oil immersion lens 40/1.42× was used. The luminescence of Ir2, and Ir2a complexes was excited by a laser with a wavelength of 405 nm and recorded in the region of 690–790 nm. Hoechst 33342 fluorescence was excited at 405 nm and recorded in the 415–465 nm range. LysoTracker Green and MitoTracker Green fluorescence was excited at 488 nm and recorded in the 505–570 nm range.
Single sections or Z-series with a step of 1 μm were recorded (10–15 consecutive optical sections per cell). All data were obtained from at least three independent experiments. In each experiment, 6–8 fields containing 60–90 cells totally were imaged for each case.
Live CHO-K1 cells were imaged by using confocal inverted Nikon Eclipse Ti2 microscope (Nikon Corporation, Tokyo, Japan) with x60 oil immersion objective. Emission of iridium complexes was recorded using the excitation at 488 nm, emission at 663–738 nm. Hoechst 33342 fluorescence was excited at 405 nm and recorded in the 425–475 nm range. LysoTracker Green and MitoTracker Green fluorescence was excited at 488 nm and recorded in the 500–550 nm range. In addition to luminescent microphotographs, DIC images were also obtained.
The images were processed and analyzed using ImageJ software (National Institutes of Health, Bethesda, MY, USA). Z-stacks were projected onto single images using the max intensity method, then the analysis of Ir complexes’ luminescence intensity in cells was carried out using ImageJ.
The quantitative co-localization analysis was performed using ImageJ JACoP Plugin to determine Manders’ co-localization coefficient M1, which is defined as the sum of the intensities of the selected red objects containing green signal, divided by the sum of the intensities of all selected red objects. Thresholds were set by a visually estimated value for each channel. Results are represented as mean ± standard deviation.
Imaging of CT26 cells was performed on a laser scanning microscope LSM880 (Carl Zeiss, Jena, Germany). Oil immersion objective lens C Plan-Apochromat 40×/1.3 NA was used for image acquisition. Luminescence of Ir2 and Ir2a was excited with a He-Ne laser at the wavelength of 543 nm, the emission was detected in the range 650–750 nm. Fluorescence of LysoTracker Orange was excited at the wavelength of 488 nm and detected in the range 500–600 nm. Fluorescence of NADH was excited in two-photon mode with a Ti:Sa femtosecond laser MaiTai HP (Spectra-Physics Inc., Milpitas, CA, USA) at 750 nm and detected in the range 450–490 nm. DAPI was exited at 405 nm, the emission was recorded in the 415–465 nm range. The luminescence images were analyzed using ImageJ software. The Manders’ co-localization coefficient M1 was assessed using ZEN software (Carl Zeiss, Jena, Germany).
Quantification of luminescence intensity of Ir2 and Ir2a was performed in the cell cytoplasm by manual selection of the cytoplasm region of interest. Calculations were made for 30–50 cells in total from 5 fields of view for every time point. Dead cells identified by round morphology on the bright-field images were excluded from the analysis. Results are presented as mean ± standard deviation.

4.7. PLIM

Phosphorescence lifetime imaging microscopy (PLIM) of CHO-K1 and HeLa cells was carried out using the time-correlated single photon counting (TCSPC) DCS-120 module (Becker&Hickl GmbH, Berlin, Germany) integrated to the Nikon Eclipse Ti2 confocal devise. Picosecond laser (405 nm) was used as excitation source, 720/60 nm band pass filter was used to cut off background signal. PLIM images were obtained using the following settings: frame time 7.299 s, pixel dwell time 27.30 µs, time range of PLIM recording 16.40 µs, total acquisition time 120–130 s, and image size 512 × 512 pixels. Oil immersion 60× objective with zoom 5.33 provided a scan area of 0.05 mm × 0.05 mm.
PLIM of CT26 was performed using LSM880 equipped with TCSPC module SPC-150 (Becker & Hickl GmbH, Berlin, Germany). Phosphorescence was excited in two-photon mode with a Ti:Sa femtosecond laser MaiTai HP with 80 MHz and 140 fs at 760 nm, the emission was detected in the “window” 596–660 nm. Images were collected with an oil immersion objective lens C Plan-Apochromat 40×/1.3 NA. Scanning was performed at a frame time of 17.275 s, corresponding to a pixel dwell time 65.9 µs, time range of PLIM recording was 19.20 µs, the total acquisition time was 150 s. Image size was 512 × 512 pixels.
Phosphorescence lifetime distribution was calculated using SPCImage 8.1 software (Becker & Hickl GmbH, Berlin, Germany). The phosphorescence decay curves were fitted in monoexponential decay mode with an average goodness of the fit 0.8 ≤ χ2 ≤ 1.2. The average number of photons per curve were not less than 5000 at binning 3–4. The data are presented as mean phosphorescence lifetime per cell.

4.8. Computational Details

All calculations were performed using the Gaussian 16computer code (Gaussian Inc., Wallingford, CT, USA) [63] in DFT methodology. A hybrid density functional with empirical correction of dispersion interactions, APFD [64], was used. For carbon and hydrogen atoms, the Pople’s 6-31G* basis set was chosen. The Pople’s 6-311+G* basis set was used for all other atoms except for iridium. The Stuttgart–Dresden effective core pseudopotential and the corresponding basis set were used for iridium [65]. The Polarizable Continuum Model (PCM) was applied to account for non-specific solvation [66].
To simplify the calculations, a complete geometry optimization (Figure 2) of the model complex with -C(O)NH-Me fragments in the N^C and N^N ligands was carried out instead of -C(O)NH-OEG moieties.

5. Conclusions

We synthesized and characterized three novel luminescent iridium complexes (Ir1, Ir2, and Ir2a), which contain the same chromophoric center shielded from interaction with environment by oligoethyleneglycole crowns of various branching, two of them (Ir2 and Ir2a) are associated with different counterions. Photophysical study of these complexes in water, phosphate buffer (PBS) and in model biological media (FBS) revealed that these emitters display phosphorescence in NIR region with the quantum yields of ca. 12% in degassed aqueous solution and lifetime in microsecond domain. The complexes’ emissions display bi-exponential decay, the shorter component of which (τ1, contribution 10–20%) is independent of oxygen concentration, whereas the longer one (τ2) shows appreciable dependence on oxygen concentration to give linear Stern–Volmer plots that point to dynamic oxygen quenching of the complexes’ phosphorescence. The values ofτ2 obtained in different degassed media (water, PBS and FBS) coincide under the limit of experimental uncertainty that is indicative of effective protection of the chromophore from interaction with proteins and other biomolecules presented in FBS. This emission parameter is also independent of pH, probe concentration, and shows only slight dependence on media viscosity. All these observations indicate that these complexes are prospective for application as oxygen sensors in aqueous media by using the long (τ2) component of emission decay. However, the MTT study of the complexes showed that Ir1 displays unacceptable toxicity in the concentration range used in bioimaging experiments that is most probably a result of weaker iridium center shielding by less branched OEG corona. The Ir2 and Ir2a probes are considerably less toxic and show preferential localization in acidic endolysosomes upon incubation in HeLa, CT26, and CHO-K1 cells. The PLIM experiments with these complexes were successfully performed to analyze oxygen distribution in the cells under normoxia and hypoxia. These obtained results clearly demonstrated that the lifetime values of the calibration plots obtained in FBS media may be used for reliable estimation of oxygen concentration in cells. The probe’s localization in lysosomes paves the way to analysis of oxygen concentration changes in single endosomal structures, which is very important for understanding the mechanisms of redox reactions’ coordination in the whole cell during various intracellular processes. It is also worth noting that the PLIM lifetime maps obtained under aerated conditions show a certain inhomogeneity across the cell. However, the assignment of these lifetime variations requires additional studies, which are now in progress.

Supplementary Materials

The following are available online, Supplementary_Materials.pdf, Ir0_Structure.xyz.

Author Contributions

Conceptualization, S.P.T. and I.S.K.; methodology, S.P.T., I.S.K., V.V.P., M.V.S. and E.S.K.; validation, S.P.T., I.S.K., M.V.S., V.I.S., E.S.K. and T.N.B.; formal analysis, I.S.K., A.I.S., V.V.P., D.O.K., M.V.S., V.I.S., E.S.K. and T.N.B.; investigation, I.S.K., A.I.S., D.V.K., D.O.K., M.M.L., A.D.K., I.K.L., A.V.S. and V.V.S.; resources, S.P.T., M.V.S. and E.S.K.; data curation, I.S.K., A.I.S., M.V.S., V.I.S., E.S.K., I.K.L. and T.N.B.; writing—original draft preparation S.P.T., I.S.K., M.V.S. and E.S.K.; writing—review and editing, S.P.T., I.S.K., M.V.S. and E.S.K.; visualization, I.S.K., A.I.S., D.O.K., M.M.L., A.D.K., I.K.L. and A.V.S.; supervision, S.P.T., M.V.S. and E.S.K.; project administration, S.P.T., I.S.K., M.V.S., and E.S.K.; funding acquisition, I.S.K. and E.S.K. All authors have read and agreed to the published version of the manuscript.

Funding

This research was funded by the Russian Science Foundation, grant number 18-73-10021. The biological studies on HeLa cells were done with the support from the Russian Foundation for Basic Research, number No 20-04-00927.

Institutional Review Board Statement

Not applicable.

Informed Consent Statement

Not applicable.

Acknowledgments

This work was performed using the equipment of the Centers for Magnetic Resonance, for Optical and Laser Materials Research, for Chemical Analysis and Materials Research, Research Park of St. Petersburg State University.

Conflicts of Interest

Author Vladislav Shcheslavskiy is employed by the company Becker&Hickl GmbH. The remaining authors declare that the research was conducted in the absence of any commercial or financial relationships that could be construed as a potential conflict of interest.

Sample Availability

Samples of the compounds Ir1, Ir1a, Ir2 and Ir2a are available from the authors.

References

  1. Tsai, A.G.; Johnson, P.C.; Intaglietta, M. Oxygen gradients in the microcirculation. Physiol. Rev. 2003, 83, 933–963. [Google Scholar] [CrossRef] [Green Version]
  2. Masson, N.; Ratcliffe, P.J. Hypoxia signaling pathways in cancer metabolism: The importance of co-selecting interconnected physiological pathways. Cancer Metab. 2014, 2, 3. [Google Scholar] [CrossRef] [PubMed] [Green Version]
  3. Al Tameemi, W.; Dale, T.P.; Al-Jumaily, R.M.K.; Forsyth, N.R. Hypoxia-modified cancer cell metabolism. Front. Cell Dev. Biol. 2019, 7, 4. [Google Scholar] [CrossRef] [Green Version]
  4. Semenza, G.L. Regulation of oxygen homeostasis by hypoxia-inducible factor 1. Physiology 2009, 24, 97–106. [Google Scholar] [CrossRef] [PubMed] [Green Version]
  5. Sanderson, T.H.; Reynolds, C.A.; Kumar, R.; Przyklenk, K.; Hüttemann, M. Molecular mechanisms of ischemia–reperfusion injury in brain: Pivotal role of the mitochondrial membrane potential in reactive oxygen species generation. Mol. Neurobiol. 2013, 47, 9–23. [Google Scholar] [CrossRef] [Green Version]
  6. Ham, P.B.; Raju, R. Mitochondrial function in hypoxic ischemic injury and influence of aging. Prog. Neurobiol. 2017, 157, 92–116. [Google Scholar] [CrossRef]
  7. Sparrow, J.R.; Boulton, M. RPE lipofuscin and its role in retinal pathobiology. Exp. Eye Res. 2005, 80, 595–606. [Google Scholar] [CrossRef]
  8. Galloway, N.R.; Amoaku, W.M.K.; Galloway, P.H.; Browning, A.C. (Eds.) Basic anatomy and physiology of the eye. In Common Eye Diseases and their Management; Springer: London, UK, 2006; pp. 7–15. ISBN 978-1-84628-033-7. [Google Scholar]
  9. Holekamp, N.M.; Shui, Y.B.; Beebe, D.C. Vitrectomy surgery increases oxygen exposure to the lens: A possible mechanism for nuclear cataract formation. Am. J. Ophthalmol. 2005, 139, 302–310. [Google Scholar] [CrossRef]
  10. Borisov, S.M. Fundamentals of Quenched Phosphorescence O2 Sensing and Rational Design of Sensor Materials. In Quenched-phosphorescence Detection of Molecular Oxygen: Applications in Life Sciences; The Royal Society of Chemistry: London, UK, 2018; pp. 1–18. ISBN 978-1-78801-175-4. [Google Scholar]
  11. Mycek, M.A.; Pogue, B.W. Handbook of Biomedical Fluorescence; CRC Press: Boca Raton, FL, USA, 2003; ISBN 9781135542580. [Google Scholar]
  12. Felder, A.E.; Wanek, J.; Tan, M.R.; Blair, N.P.; Shahidi, M. A method for combined retinal vascular and tissue oxygen tension imaging. Sci. Rep. 2017, 7, 10622. [Google Scholar] [CrossRef] [PubMed] [Green Version]
  13. Mezu-Ndubuisi, O.J.; Teng, P.; Wanek, J.; Blair, N.P.; Chau, F.Y.; Reddy, N.M.; Raj, J.U.; Reddy, S.P.; Shahidi, M. In vivo retinal vascular oxygen tension imaging and fluorescein angiography in the mouse model of oxygen-induced retinopathy. Investig. Ophthalmol. Vis. Sci. 2013, 54, 6968–6972. [Google Scholar] [CrossRef]
  14. Yoshihara, T.; Karasawa, Y.; Zhang, S.; Hosaka, M.; Takeuchi, T.; Iida, Y.; Endo, K.; Imamura, T.; Tobita, S. In vivo phosphorescence imaging of cancer using iridium complexes. In Proceedings of the Reporters, Markers, Dyes, Nanoparticles, and Molecular Probes for Biomedical Applications; Achilefu, S., Raghavachari, R., Eds.; SPIE BiOS: San Jose, CA, USA, 2009; Volume 7190, p. 71900X. [Google Scholar]
  15. Carraway, E.R.; Demas, J.N.; DeGraff, B.A.; Bacon, J.R. Photophysics and photochemistry of oxygen sensors based on luminescent transition-metal complexes. Anal. Chem. 1991, 63, 337–342. [Google Scholar] [CrossRef]
  16. Baggaley, E.; Weinstein, J.A.; Williams, J.A.G. Time-resolved emission imaging microscopy using phosphorescent metal complexes: Taking flim and plim to new lengths. In Luminescent and Photoactive Transition Metal Complexes as Biomolecular Probes and Cellular Reagents; Lo, K.K.W., Ed.; Springer: Berlin/Heidelberg, Germany, 2015; pp. 205–256. ISBN 978-3-662-46718-3. [Google Scholar]
  17. Jenkins, J.; Dmitriev, R.I.; Papkovsky, D.B. Imaging cell and tissue O2 by TCSPC-PLIM. In Advanced Time-Correlated Single Photon Counting Applications; Becker, W., Ed.; Springer International Publishing: Cham, Switzerland, 2015; pp. 225–247. ISBN 978-3-319-14929-5. [Google Scholar]
  18. Becker, W.; Shcheslavskiy, V.; Rück, A. Simultaneous phosphorescence and fluorescence lifetime imaging by multi-dimensional tcspc and multi-pulse excitation. In Multi-Parametric Live Cell Microscopy of 3D Tissue Models; Dmitriev, R.I., Ed.; Springer International Publishing: Cham, Switzerland, 2017; pp. 19–30. ISBN 978-3-319-67358-5. [Google Scholar]
  19. Sud, D.; Mycek, M.A. Calibration and validation of an optical sensor for intracellular oxygen measurements. J. Biomed. Opt. 2009, 14, 1–3. [Google Scholar] [CrossRef] [PubMed] [Green Version]
  20. Papkovsky, D.B.; Dmitriev, R.I. Biological detection by optical oxygen sensing. Chem. Soc. Rev. 2013, 42, 8700–8732. [Google Scholar] [CrossRef] [PubMed]
  21. Wang, X.; Wolfbeis, O.S. Optical methods for sensing and imaging oxygen: Materials, spectroscopies and applications. Chem. Soc. Rev. 2014, 43, 3666–3761. [Google Scholar] [CrossRef] [PubMed] [Green Version]
  22. Zou, X.; Pan, T.; Chen, L.; Tian, Y.; Zhang, W. Luminescence materials for pH and oxygen sensing in microbial cells–structures, optical properties, and biological applications. Crit. Rev. Biotechnol. 2017, 37, 723–738. [Google Scholar] [CrossRef] [PubMed]
  23. Solomatina, A.I.; Su, S.H.; Lukina, M.M.; Dudenkova, V.V.; Shcheslavskiy, V.I.; Wu, C.H.; Chelushkin, P.S.; Chou, P.T.; Koshevoy, I.O.; Tunik, S.P. Water-soluble cyclometalated platinum(II) and iridium(III) complexes: Synthesis, tuning of the photophysical properties, and in vitro and in vivo phosphorescence lifetime imaging. RSC Adv. 2018, 8, 17224–17236. [Google Scholar] [CrossRef] [Green Version]
  24. Shcheslavskiy, V.I.; Neubauer, A.; Bukowiecki, R.; Dinter, F.; Becker, W. Combined fluorescence and phosphorescence lifetime imaging. Appl. Phys. Lett. 2016, 108, 91111. [Google Scholar] [CrossRef]
  25. Liu, S.; Wei, L.; Guo, S.; Jiang, J.; Zhang, P.; Han, J.; Ma, Y.; Zhao, Q. Anionic iridium(III) complexes and their conjugated polymer soft salts for time-resolved luminescent detection of intracellular oxygen levels. Sensors Actuators B Chem. 2018, 262, 436–443. [Google Scholar] [CrossRef]
  26. Shewring, J.R.; Cankut, A.J.; McKenzie, L.K.; Crowston, B.J.; Botchway, S.W.; Weinstein, J.A.; Edwards, E.; Ward, M.D. Multimodal probes: Superresolution and transmission electron microscopy imaging of mitochondria, and oxygen mapping of cells, using small-molecule Ir(iii) luminescent complexes. Inorg. Chem. 2017, 56, 15259–15270. [Google Scholar] [CrossRef] [PubMed]
  27. Kritchenkov, I.S.; Elistratova, A.A.; Sokolov, V.V.; Chelushkin, P.S.; Shirmanova, M.V.; Lukina, M.M.; Dudenkova, V.V.; Shcheslavskiy, V.I.; Kalinina, S.; Reeß, K.; et al. A biocompatible phosphorescent Ir(iii) oxygen sensor functionalized with oligo(ethylene glycol) groups: Synthesis, photophysics and application in PLIM experiments. New J. Chem. 2020, 44, 10459–10471. [Google Scholar] [CrossRef]
  28. Zhang, K.Y.; Gao, P.; Sun, G.; Zhang, T.; Li, X.; Liu, S.; Zhao, Q.; Lo, K.K.W.; Huang, W. Dual-phosphorescent Iridium(iii) complexes extending oxygen sensing from hypoxia to hyperoxia. J. Am. Chem. Soc. 2018, 140, 7827–7834. [Google Scholar] [CrossRef]
  29. Liu, J.; Liu, Y.; Bu, W.; Bu, J.; Sun, Y.; Du, J.; Shi, J. Ultrasensitive nanosensors based on upconversion nanoparticles for selective hypoxia imaging in vivo upon near-infrared excitation. J. Am. Chem. Soc. 2014, 136, 9701–9709. [Google Scholar] [CrossRef] [PubMed]
  30. Esipova, T.V.; Karagodov, A.; Miller, J.; Wilson, D.F.; Busch, T.M.; Vinogradov, S.A. Two new “protected” oxyphors for biological oximetry: Properties and application in tumor imaging. Anal. Chem. 2011, 83, 8756–8765. [Google Scholar] [CrossRef] [PubMed] [Green Version]
  31. Roussakis, E.; Spencer, J.A.; Lin, C.P.; Vinogradov, S.A. Two-photon antenna-core oxygen probe with enhanced performance. Anal. Chem. 2014, 86, 5937–5945. [Google Scholar] [CrossRef]
  32. Esipova, T.V.; Barrett, M.J.P.; Erlebach, E.; Masunov, A.E.; Weber, B.; Vinogradov, S.A. Oxyphor 2p: A high-performance probe for deep-tissue longitudinal oxygen imaging. Cell Metab. 2019, 29, 736–744. [Google Scholar] [CrossRef] [PubMed] [Green Version]
  33. Fercher, A.; Borisov, S.M.; Zhdanov, A.V.; Klimant, I.; Papkovsky, D.B. Intracellular O2 sensing probe based on cell-penetrating phosphorescent nanoparticles. ACS Nano 2011, 5, 5499–5508. [Google Scholar] [CrossRef] [PubMed]
  34. Kondrashina, A.V.; Dmitriev, R.I.; Borisov, S.M.; Klimant, I.; O’Brien, I.; Nolan, Y.M.; Zhdanov, A.V.; Papkovsky, D.B. A phosphorescent nanoparticle-based probe for sensing and imaging of (intra)cellular oxygen in multiple detection modalities. Adv. Funct. Mater. 2012, 22, 4931–4939. [Google Scholar] [CrossRef]
  35. Dmitriev, R.I.; Borisov, S.M.; Düssmann, H.; Sun, S.; Müller, B.J.; Prehn, J.; Baklaushev, V.P.; Klimant, I.; Papkovsky, D.B. Versatile conjugated polymer nanoparticles for high-resolution O2 imaging in cells and 3D tissue models. ACS Nano 2015, 9, 5275–5288. [Google Scholar] [CrossRef] [PubMed]
  36. Borisov, S.M.; Mayr, T.; Mistlberger, G.; Waich, K.; Koren, K.; Chojnacki, P.; Klimant, I. Precipitation as a simple and versatile method for preparation of optical nanochemosensors. Talanta 2009, 79, 1322–1330. [Google Scholar] [CrossRef]
  37. Deaton, J.C.; Castellano, F.N. Archetypal Iridium(iii) compounds for optoelectronic and photonic applications. In Photophysical Properties and Synthetic Methods; Zysman-Colman, E., Ed.; Wiley: Hoboken, NJ, USA, 2017; pp. 1–69. [Google Scholar]
  38. Zhang, K.Y.; Liu, S.; Zhao, Q.; Li, F.; Huang, W. Phosphorescent Iridium(iii) complexes for bioimaging BT-luminescent and photoactive transition metal complexes as biomolecular probes and cellular reagents. In Luminescent and Photoactive Transition Metal Complexes as Biomolecular Probes and Cellular Reagents; Lo, K.K.W., Ed.; Springer: Berlin/Heidelberg, Germany, 2015; pp. 131–180. ISBN 978-3-662-46718-3. [Google Scholar]
  39. Che, C.M.; Zhang, J.L.; Lin, L.R. PEG-Linked luminescent platinum(ii) complex as aqueous polymeric molecular light switch for protein binding reactions. Chem. Commun. 2002, 2556–2557. [Google Scholar] [CrossRef]
  40. Colombo, A.; Fiorini, F.; Septiadi, D.; Dragonetti, C.; Nisic, F.; Valore, A.; Roberto, D.; Mauro, M.; De Cola, L. Neutral N^C^N terdentate luminescent Pt(ii) complexes: Their synthesis, photophysical properties, and bio-imaging applications. Dalt. Trans. 2015, 44, 8478–8487. [Google Scholar] [CrossRef] [Green Version]
  41. Li, J.; He, X.; Zou, Y.; Chen, D.; Yang, L.; Rao, J.; Chen, H.; Chan, M.C.W.; Li, L.; Guo, Z.; et al. Mitochondria-targeted platinum(ii) complexes: Dual inhibitory activities on tumor cell proliferation and migration/invasion via intracellular trafficking of β-catenin. Metallomics 2017, 9, 726–733. [Google Scholar] [CrossRef]
  42. Potocny, A.M.; Riley, R.S.; O’Sullivan, R.K.; Day, E.S.; Rosenthal, J. Photochemotherapeutic properties of a linear tetrapyrrole Palladium(ii) complex displaying an exceptionally high phototoxicity index. Inorg. Chem. 2018, 57, 10608–10615. [Google Scholar] [CrossRef]
  43. Wang, J.; Potocny, A.M.; Rosenthal, J.; Day, E.S. Gold nanoshell-linear tetrapyrrole conjugates for near infrared-activated dual photodynamic and photothermal therapies. ACS Omega 2020, 5, 926–940. [Google Scholar] [CrossRef] [PubMed]
  44. Wang, F.; Lan, M.; To, W.P.; Li, K.; Lok, C.N.; Wang, P.; Che, C.M. A macromolecular cyclometalated gold(iii) amphiphile displays long-lived emissive excited state in water: Self-assembly and in vitro photo-toxicity. Chem. Commun. 2016, 52, 13273–13276. [Google Scholar] [CrossRef] [PubMed]
  45. Yip, A.M.H.; Lo, K.K.W. Luminescent rhenium(I), ruthenium(II), and iridium(III) polypyridine complexes containing a poly(ethylene glycol) pendant or bioorthogonal reaction group as biological probes and photocytotoxic agents. Coord. Chem. Rev. 2018, 361, 138–163. [Google Scholar] [CrossRef]
  46. Choi, A.W.T.; Louie, M.W.; Li, S.P.Y.; Liu, H.W.; Chan, B.T.N.; Lam, T.C.Y.; Lin, A.C.C.; Cheng, S.H.; Lo, K.K.W. Emissive behavior, cytotoxic activity, cellular uptake, and pegylation properties of new luminescent rhenium(i) polypyridine poly(ethylene glycol) complexes. Inorg. Chem. 2012, 51, 13289–13302. [Google Scholar] [CrossRef] [PubMed]
  47. Li, S.P.Y.; Lau, C.T.S.; Louie, M.W.; Lam, Y.W.; Cheng, S.H.; Lo, K.K.W. Mitochondria-targeting cyclometalated iridium(III)–PEG complexes with tunable photodynamic activity. Biomaterials 2013, 34, 7519–7532. [Google Scholar] [CrossRef] [PubMed]
  48. Lo, K.K.W.; Tso, K.K.S. Functionalization of cyclometalated iridium(iii) polypyridine complexes for the design of intracellular sensors, organelle-targeting imaging reagents, and metallodrugs. Inorg. Chem. Front. 2015, 2, 510–524. [Google Scholar] [CrossRef]
  49. Akiyama, H.; Takahashi, I.; Shimoda, Y.; Mukai, R.; Yoshihara, T.; Tobita, S. Ir(iii) complex-based oxygen imaging of living cells and ocular fundus with a gated ICCD camera. Photochem. Photobiol. Sci. 2018, 17, 846–853. [Google Scholar] [CrossRef]
  50. Wang, Y.P.; Wu, K.; Pan, M.; Li, K.; Mo, J.T.; Duan, X.H.; He, H.Z.; Shen, J.; Su, C.Y. One-/two-photon excited cell membrane imaging and tracking by a photoactive nanocage. ACS Appl. Mater. Interfaces 2020, 12, 35873–35881. [Google Scholar] [CrossRef] [PubMed]
  51. Solomatina, A.I.; Kuznetsov, K.M.; Gurzhiy, V.V.; Pavlovskiy, V.V.; Porsev, V.V.; Evarestov, R.A.; Tunik, S.P. Luminescent organic dyes containing a phenanthro[9,10-D]imidazole core and [Ir(N^C)(N^N)]+ complexes based on the cyclometalating and diimine ligands of this type. Dalton Trans. 2020, 49, 6751–6763. [Google Scholar] [CrossRef] [PubMed]
  52. Kritchenkov, I.S.; Chelushkin, P.S.; Sokolov, V.V.; Pavlovskiy, V.V.; Porsev, V.V.; Evarestov, R.A.; Tunik, S.P. Near-Infrared [Ir(N∧C)2(N∧N)]+ Emitters and Their Noncovalent Adducts with Human Serum Albumin: Synthesis and Photophysical and Computational Study. Organometallics 2019, 38, 3740–3751. [Google Scholar] [CrossRef]
  53. Hahn, U.; Luelf, H.; Winkler, H.D.F.; Schalley, C.A.; Vögtle, F.; De Cola, L. Encapsulation of luminescent homoleptic [Ru(dpp)3]2+-type chromophores within an amphiphilic dendritic environment. Chem. A Eur. J. 2012, 18, 15424–15432. [Google Scholar] [CrossRef] [PubMed]
  54. Lakowicz, J.R. Mechanisms and dynamics of fluorescence quenching. In Principles of Fluorescence Spectroscopy; Lakowicz, J.R., Ed.; Springer: Boston, MA, USA, 2006; pp. 331–351. ISBN 978-0-387-46312-4. [Google Scholar]
  55. Mogilner, A.; Manhart, A. Intracellular fluid mechanics: Coupling cytoplasmic flow with active cytoskeletal gel. Annu. Rev. Fluid Mech. 2018, 50, 347–370. [Google Scholar] [CrossRef] [Green Version]
  56. Ordóñez-Hernández, J.; Jiménez-Sánchez, A.; García-Ortega, H.; Sánchez-Puig, N.; Flores-Álamo, M.; Santillan, R.; Farfán, N. A series of dual-responsive Coumarin-Bodipy probes for local microviscosity monitoring. Dye. Pigment. 2018, 157, 305–313. [Google Scholar] [CrossRef]
  57. Kwapiszewska, K.; Szczepański, K.; Kalwarczyk, T.; Michalska, B.; Patalas-Krawczyk, P.; Szymański, J.; Andryszewski, T.; Iwan, M.; Duszyński, J.; Hołyst, R. Nanoscale viscosity of cytoplasm is conserved in human cell lines. J. Phys. Chem. Lett. 2020, 11, 6914–6920. [Google Scholar] [CrossRef]
  58. Guo, Z.; Tong, W.L.; Chan, M.C.W. Luminescent oligo(ethylene glycol)-functionalized cyclometalated platinum(ii) complexes: Cellular characterization and mitochondria-specific localization. Chem. Commun. 2014, 50, 1711–1714. [Google Scholar] [CrossRef]
  59. Li, S.P.-Y.; Liu, H.-W.; Zhang, K.Y.; Lo, K.K.-W. Modification of luminescent iridium(iii) polypyridine complexes with discrete poly(ethylene glycol) (PEG) pendants: Synthesis, emissive behavior, intracellular uptake, and pegylation properties. Chem. A Eur. J. 2010, 16, 8329–8339. [Google Scholar] [CrossRef]
  60. Conway, J.R.W.; Warren, S.C.; Herrmann, D.; Murphy, K.J.; Cazet, A.S.; Vennin, C.; Shearer, R.F.; Killen, M.J.; Magenau, A.; Mélénec, P.; et al. Intravital imaging to monitor therapeutic response in moving hypoxic regions resistant to PI3K pathway targeting in pancreatic cancer. Cell Rep. 2018, 23, 3312–3326. [Google Scholar] [CrossRef]
  61. Kiessling, F.; Heilmann, M.; Lammers, T.; Ulbrich, K.; Subr, V.; Peschke, P.; Waengler, B.; Mier, W.; Schrenk, H.-H.; Bock, M.; et al. Synthesis and characterization of HE-24.8:  A polymeric contrast agent for magnetic resonance angiography. Bioconjug. Chem. 2006, 17, 42–51. [Google Scholar] [CrossRef]
  62. Samudrala, R.; Zhang, X.; Wadkins, R.M.; Mattern, D.L. Synthesis of a non-cationic, water-soluble perylenetetracarboxylic diimide and its interactions with G-quadruplex-forming DNA. Bioorganic Med. Chem. 2007, 15, 186–193. [Google Scholar] [CrossRef] [PubMed]
  63. Frisch, M.J.; Trucks, G.W.; Schlegel, H.B.; Scuseria, G.E.; Robb, M.A.; Cheeseman, J.R.; Scalmani, G.; Barone, V.; Petersson, G.A.; Nakatsuji, H.; et al. Gaussian 16; revision A.03; Gaussian Inc.: Wallingford, CT, USA, 2016. [Google Scholar]
  64. Peverati, R.; Truhlar, D.G. Screened-exchange density functionals with broad accuracy for chemistry and solid-state physics. Phys. Chem. Chem. Phys. 2012, 14, 16187–16191. [Google Scholar] [CrossRef] [PubMed]
  65. Andrae, D.; Häußermann, U.; Dolg, M.; Stoll, H.; Preuß, H. Energy-adjustedab initio pseudopotentials for the second and third row transition elements. Theor. Chim. Acta 1990, 77, 123–141. [Google Scholar] [CrossRef]
  66. Tomasi, J.; Mennucci, B.; Cammi, R. Quantum mechanical continuum solvation models. Chem. Rev. 2005, 105, 2999–3094. [Google Scholar] [CrossRef] [PubMed]
Scheme 1. Synthesis of cyclometallating and diimine ligands N^C1, N^C2, N^N1 and N^N2.
Molecules 26 02898 sch001
Scheme 2. Synthesis of iridium complexes Ir1, Ir1a, Ir2, and Ir2a.
Molecules 26 02898 sch002
Figure 1. 1H-1H COSY and NOESY NMR spectra of Ir1, CD3OD, 323 K. Red diagonal and cross-peaks are related to the COSY spectrum, green diagonal and cross-peaks are from the NOESY spectrum. Pairs of protons generating NOESY cross-peaks, which do not coincide with the COSY signals, are circled with colored dashed lines both in the spectrum and in the structural pattern.
Molecules 26 02898 g001
Figure 2. Optimized structure of the model Ir0 complex (hydrogen atoms are omitted for clarity). The calculations have been slightly simplified by substitution of OEG pendants with methyl groups. Atom colors: Ir–blue; N–red; S–yellow; O–green; C–gray.
Molecules 26 02898 g002
Figure 3. Normalized excitation (dashed lines) and emission (solid lines) spectra of Ir1, Ir2, and Ir2a in aqueous solution at 298 K.
Molecules 26 02898 g003
Figure 4. Stern–Volmer oxygen quenching plots for Ir2 (A) and Ir2a (B) in aqueous solution, 0.01 M phosphate buffered saline (pH 7.4) and in fetal bovine serum (T = 37 °C). (Ksv-Stern–Volmer constant).
Molecules 26 02898 g004
Figure 6. Dynamics of Ir2 and Ir2a (75 µM) accumulation by HeLa cells during long-term incubation carried out in DMEM supplemented with 10% FBS. Scale bar 20 µm. (A,B) Representative microscopy images of cells in luminescence channel (upper row, excitation 405 nm, recording 690–790 nm, red color) and in transmission channel (bottom row). (C,D) Quantification of the experimental data shown in A and B, correspondingly. Integral luminescence intensity per cell is presented. 50 cells were processed for each time point. The results are given as the mean ± standard deviation. Scale bar 20 µm.
Molecules 26 02898 g006
Figure 7. Subcellular distribution of complexes Ir2 and Ir2a (75 µM) in HeLa cells (red color of luminescence). Cells were co-stained with complexes and organelle-specific probes for nuclei-Hoechst 33342 (blue color of luminescence), mitochondria-MitoTracker Green (green color of luminescence), and lysosomes-LysoTracker Green (green color of luminescence). Scale bar 20 µm. Manders’ overlap coefficients (M1) shown in the pictures are presented as mean + standard deviation, calculated for 50 cells for every variant.
Molecules 26 02898 g007
Figure 8. Phosphorescence lifetime distribution in HeLa cells incubated with 75 µM of Ir2 (AF) and Ir2a (GN) for 24 h under normoxia (A–C, G–K) and hypoxia conditions (D–F, L–N). A, D, G, L—luminescent microscopy (excitation 405 nm, detection 663–738 nm) stacked with DIC (differential interference contrast) image. B, E, H, M—PLIM images (excitation 405 nm, detection 690–750 nm), colors corresponds to the lifetime in the range 1700–3600 ns. C, F, K, N—lifetime distribution for whole PLIM image.
Molecules 26 02898 g008
Table 1. Photophysical data for complexes Ir1, Ir2, and Ir2a in aerated and degassed aqueous solution at 298 K (absorption, excitation and emission spectra, quantum yield) and 310 K (phosphorescence lifetime measurements).
λabs (nm)λexc (nm) aλem (nm) bτaer (μs) cτdeg (μs) cQYaer (%) bQYdeg (%) bkr, s−1
×105
knr, s−1
×105
Ir1252; 306sh; 344; 370; 441sh; 530; 570sh254; 344; 367; 442sh; 531; 550sh728; 790; 900sh2.343.238.412.20.382.72
Ir2253; 306sh; 345; 369; 441sh; 532; 570sh254; 344; 367; 442sh; 537; 555sh727; 789; 900sh2.163.288.211.90.362.73
Ir2a253; 305sh; 345; 368; 440sh; 532; 570sh251; 343; 369; 441sh; 532; 556sh727; 789; 898sh2.133.248.111.70.362.69
a recorded at 720 nm; b excitation at 365 nm; c excitation at 527 nm, values for degassed (deaerated) solutions are extrapolated according to calibration plots (Figure 4 and Figure S40).
Publisher’s Note: MDPI stays neutral with regard to jurisdictional claims in published maps and institutional affiliations.

