
Alternative Approach for Specific Tyrosinase Inhibitor Screening: Uncompetitive Inhibition of Tyrosinase by Moringa oleifera


Abstract
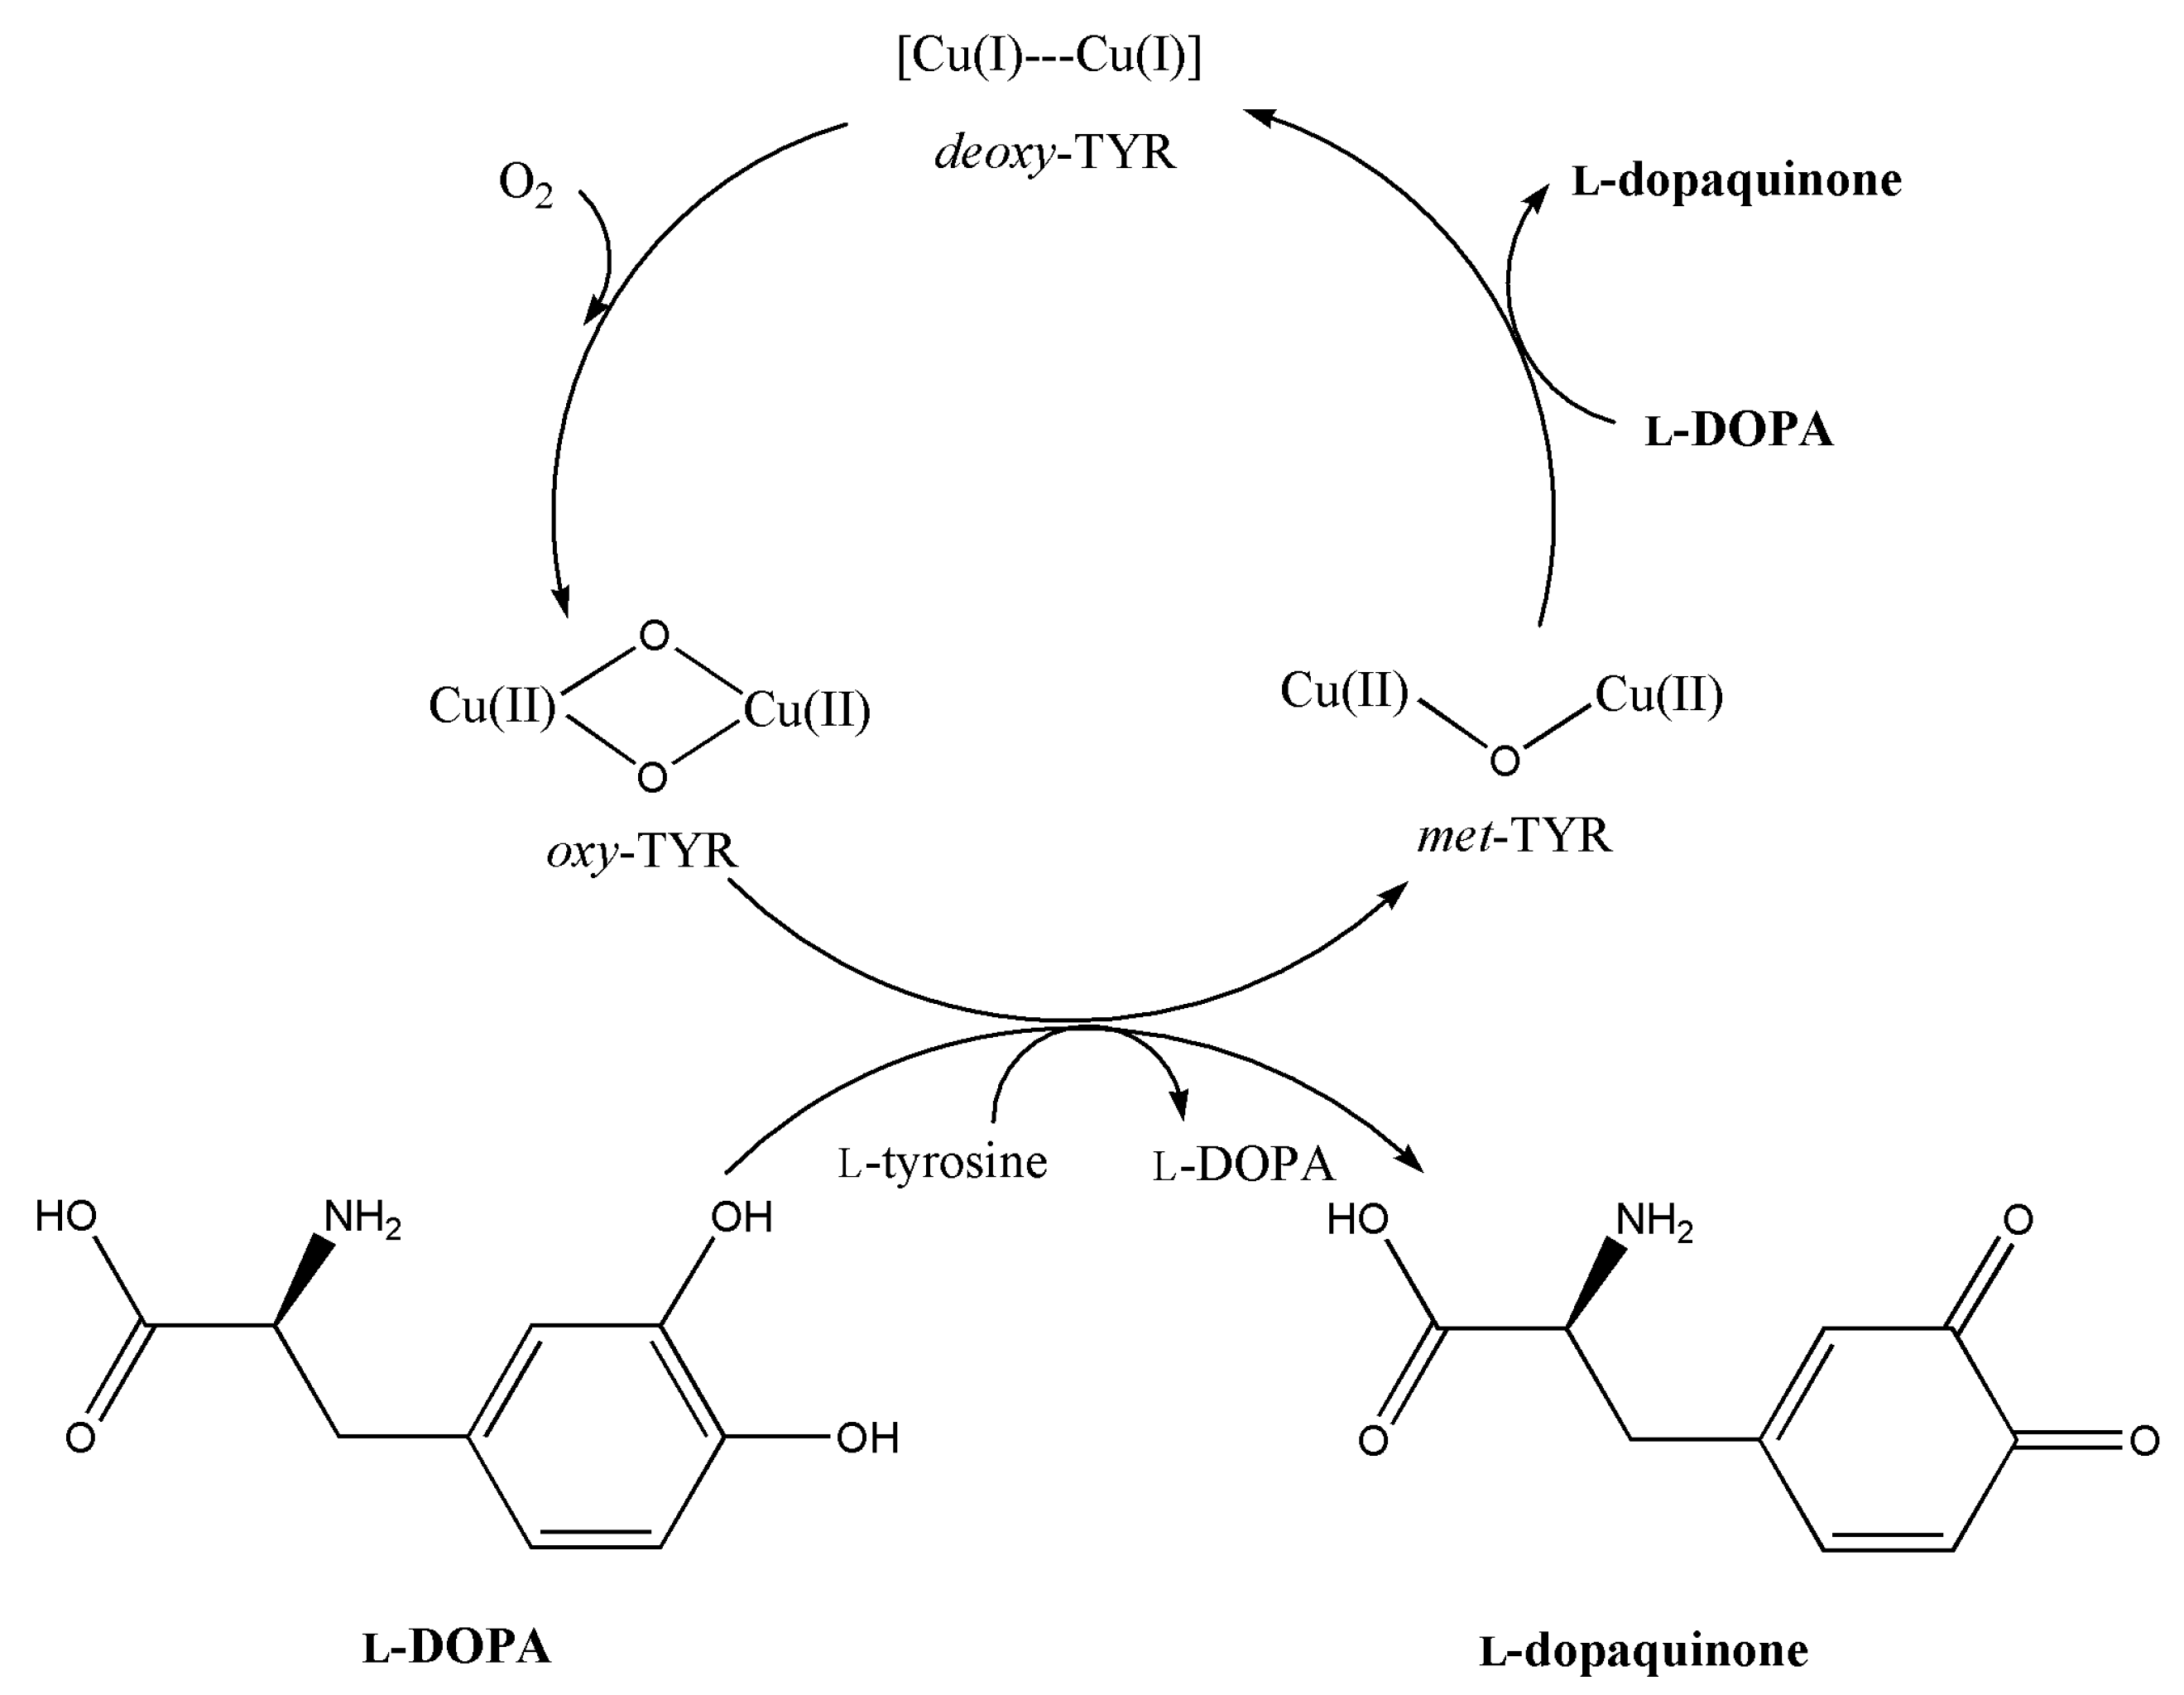
:1. Introduction
2. Results
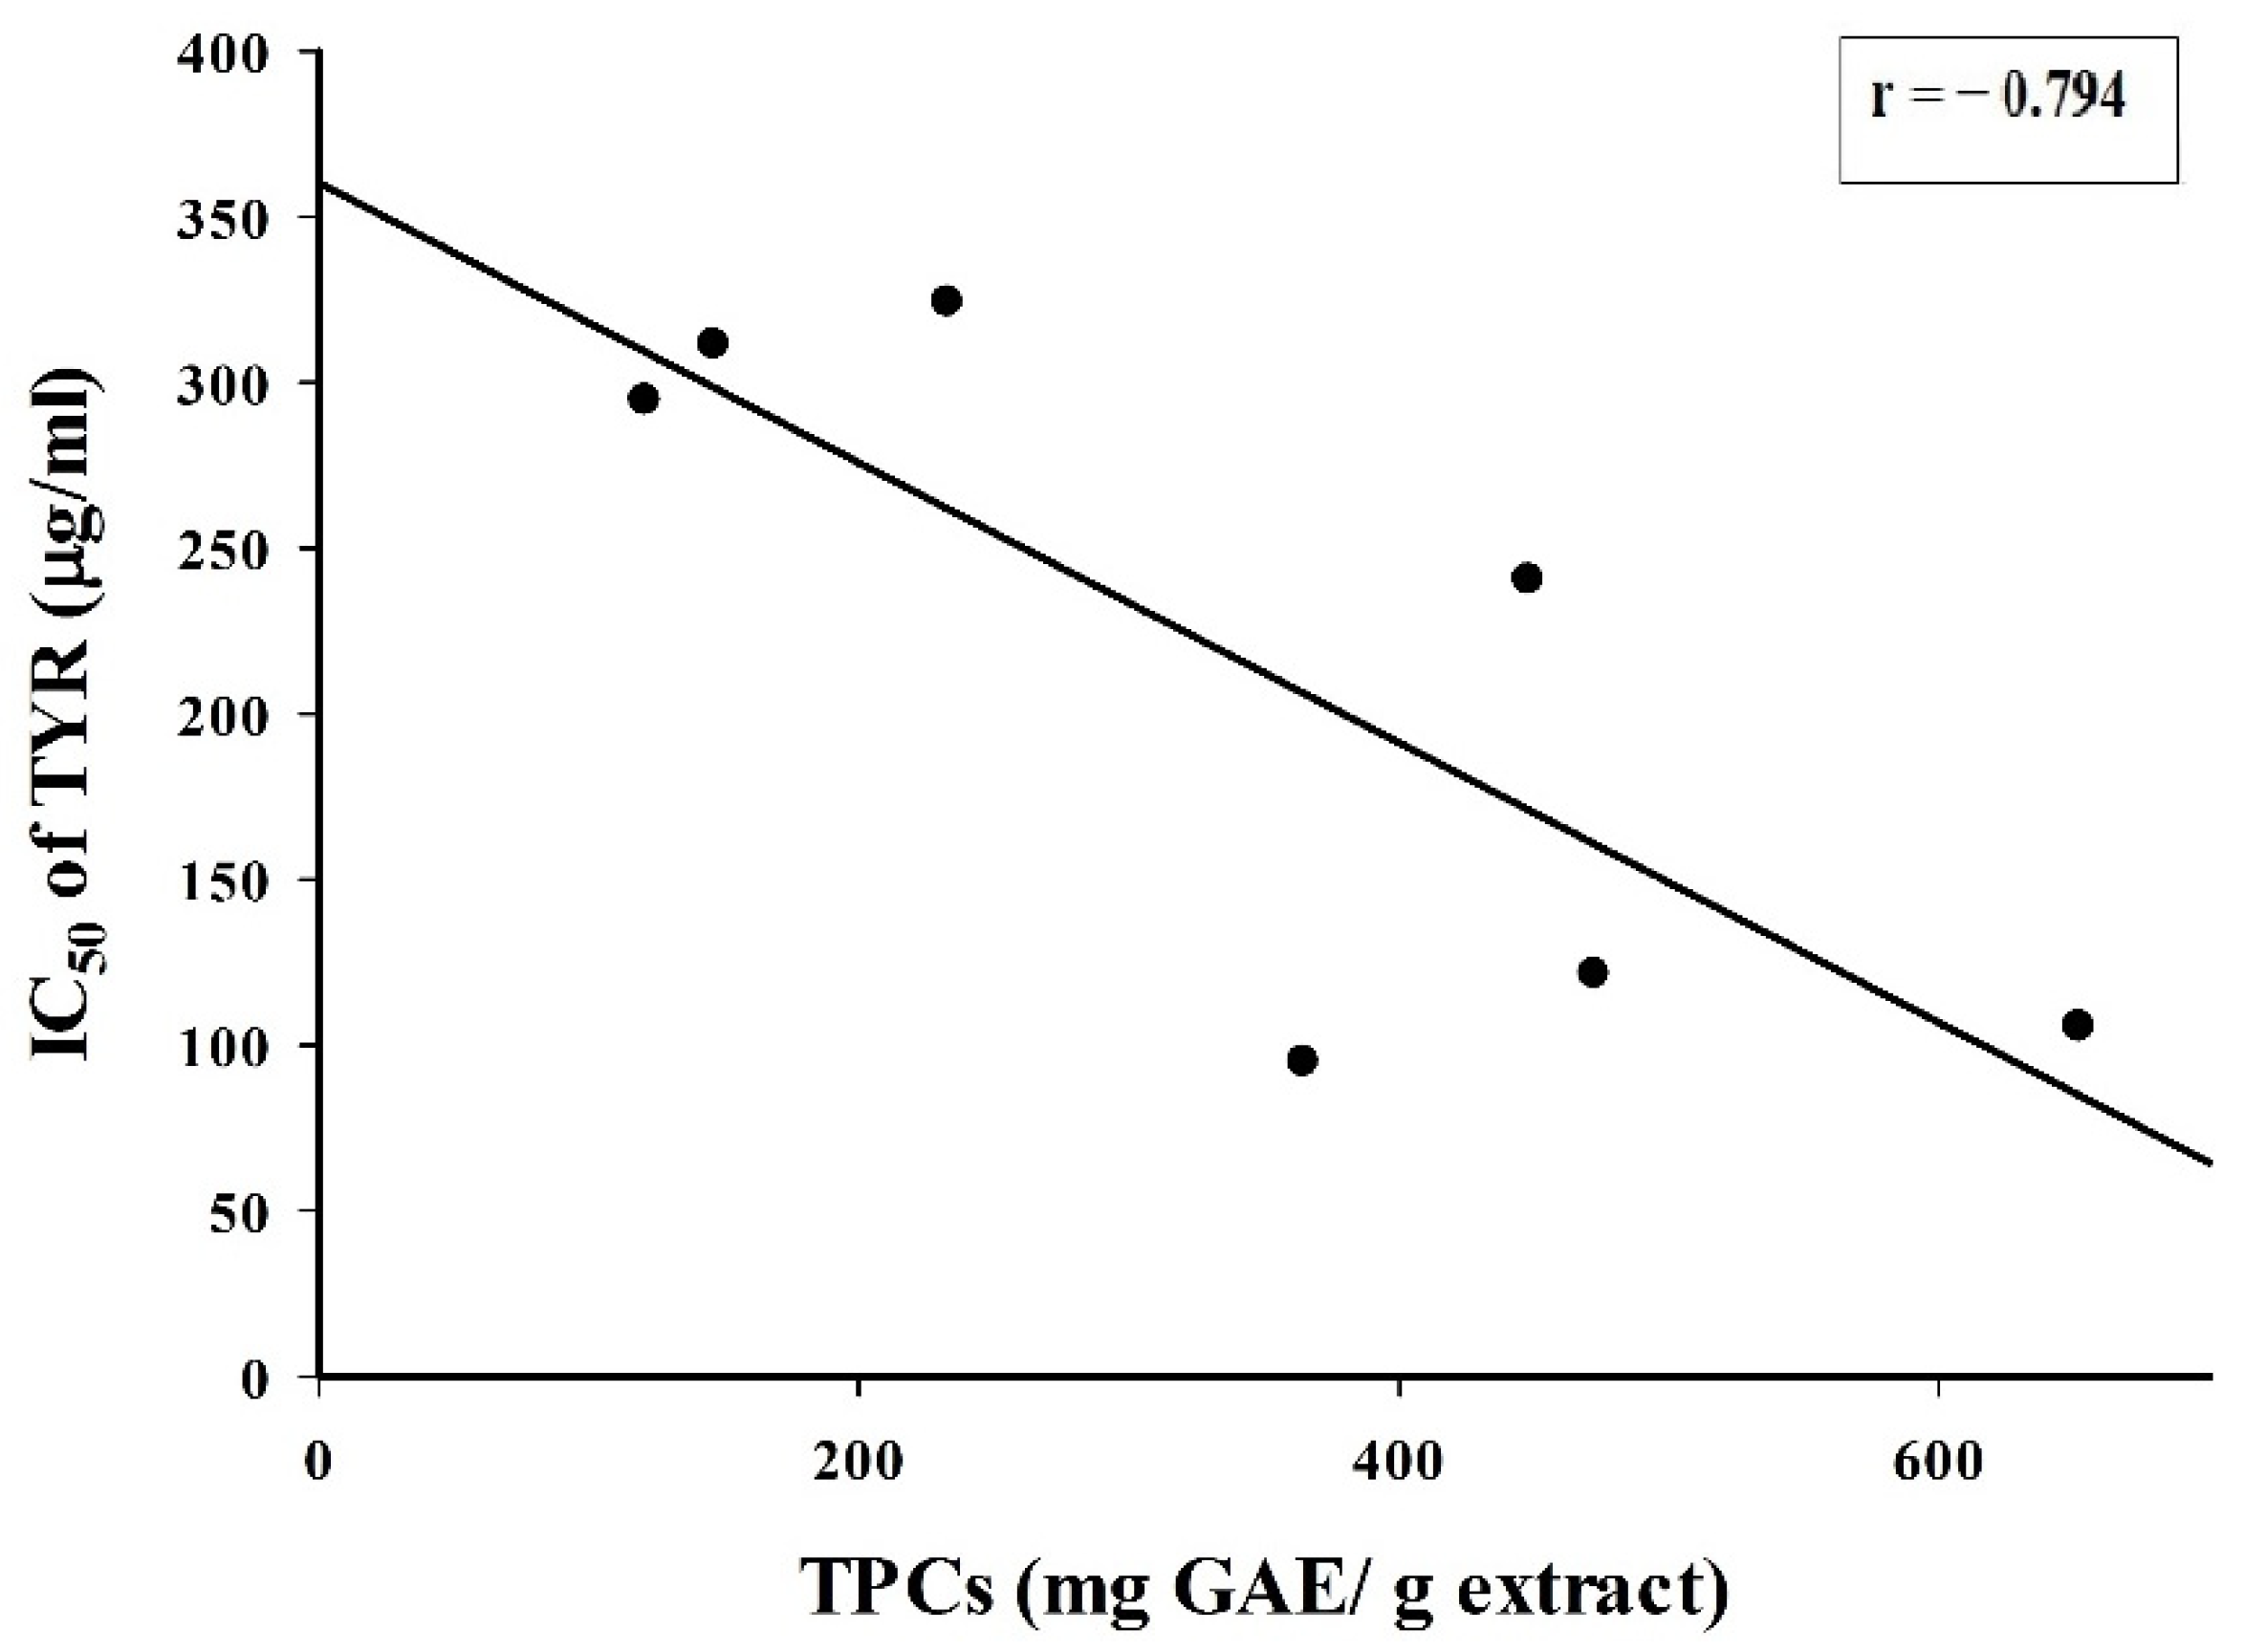
2.1. TPC and TYR Inhibition
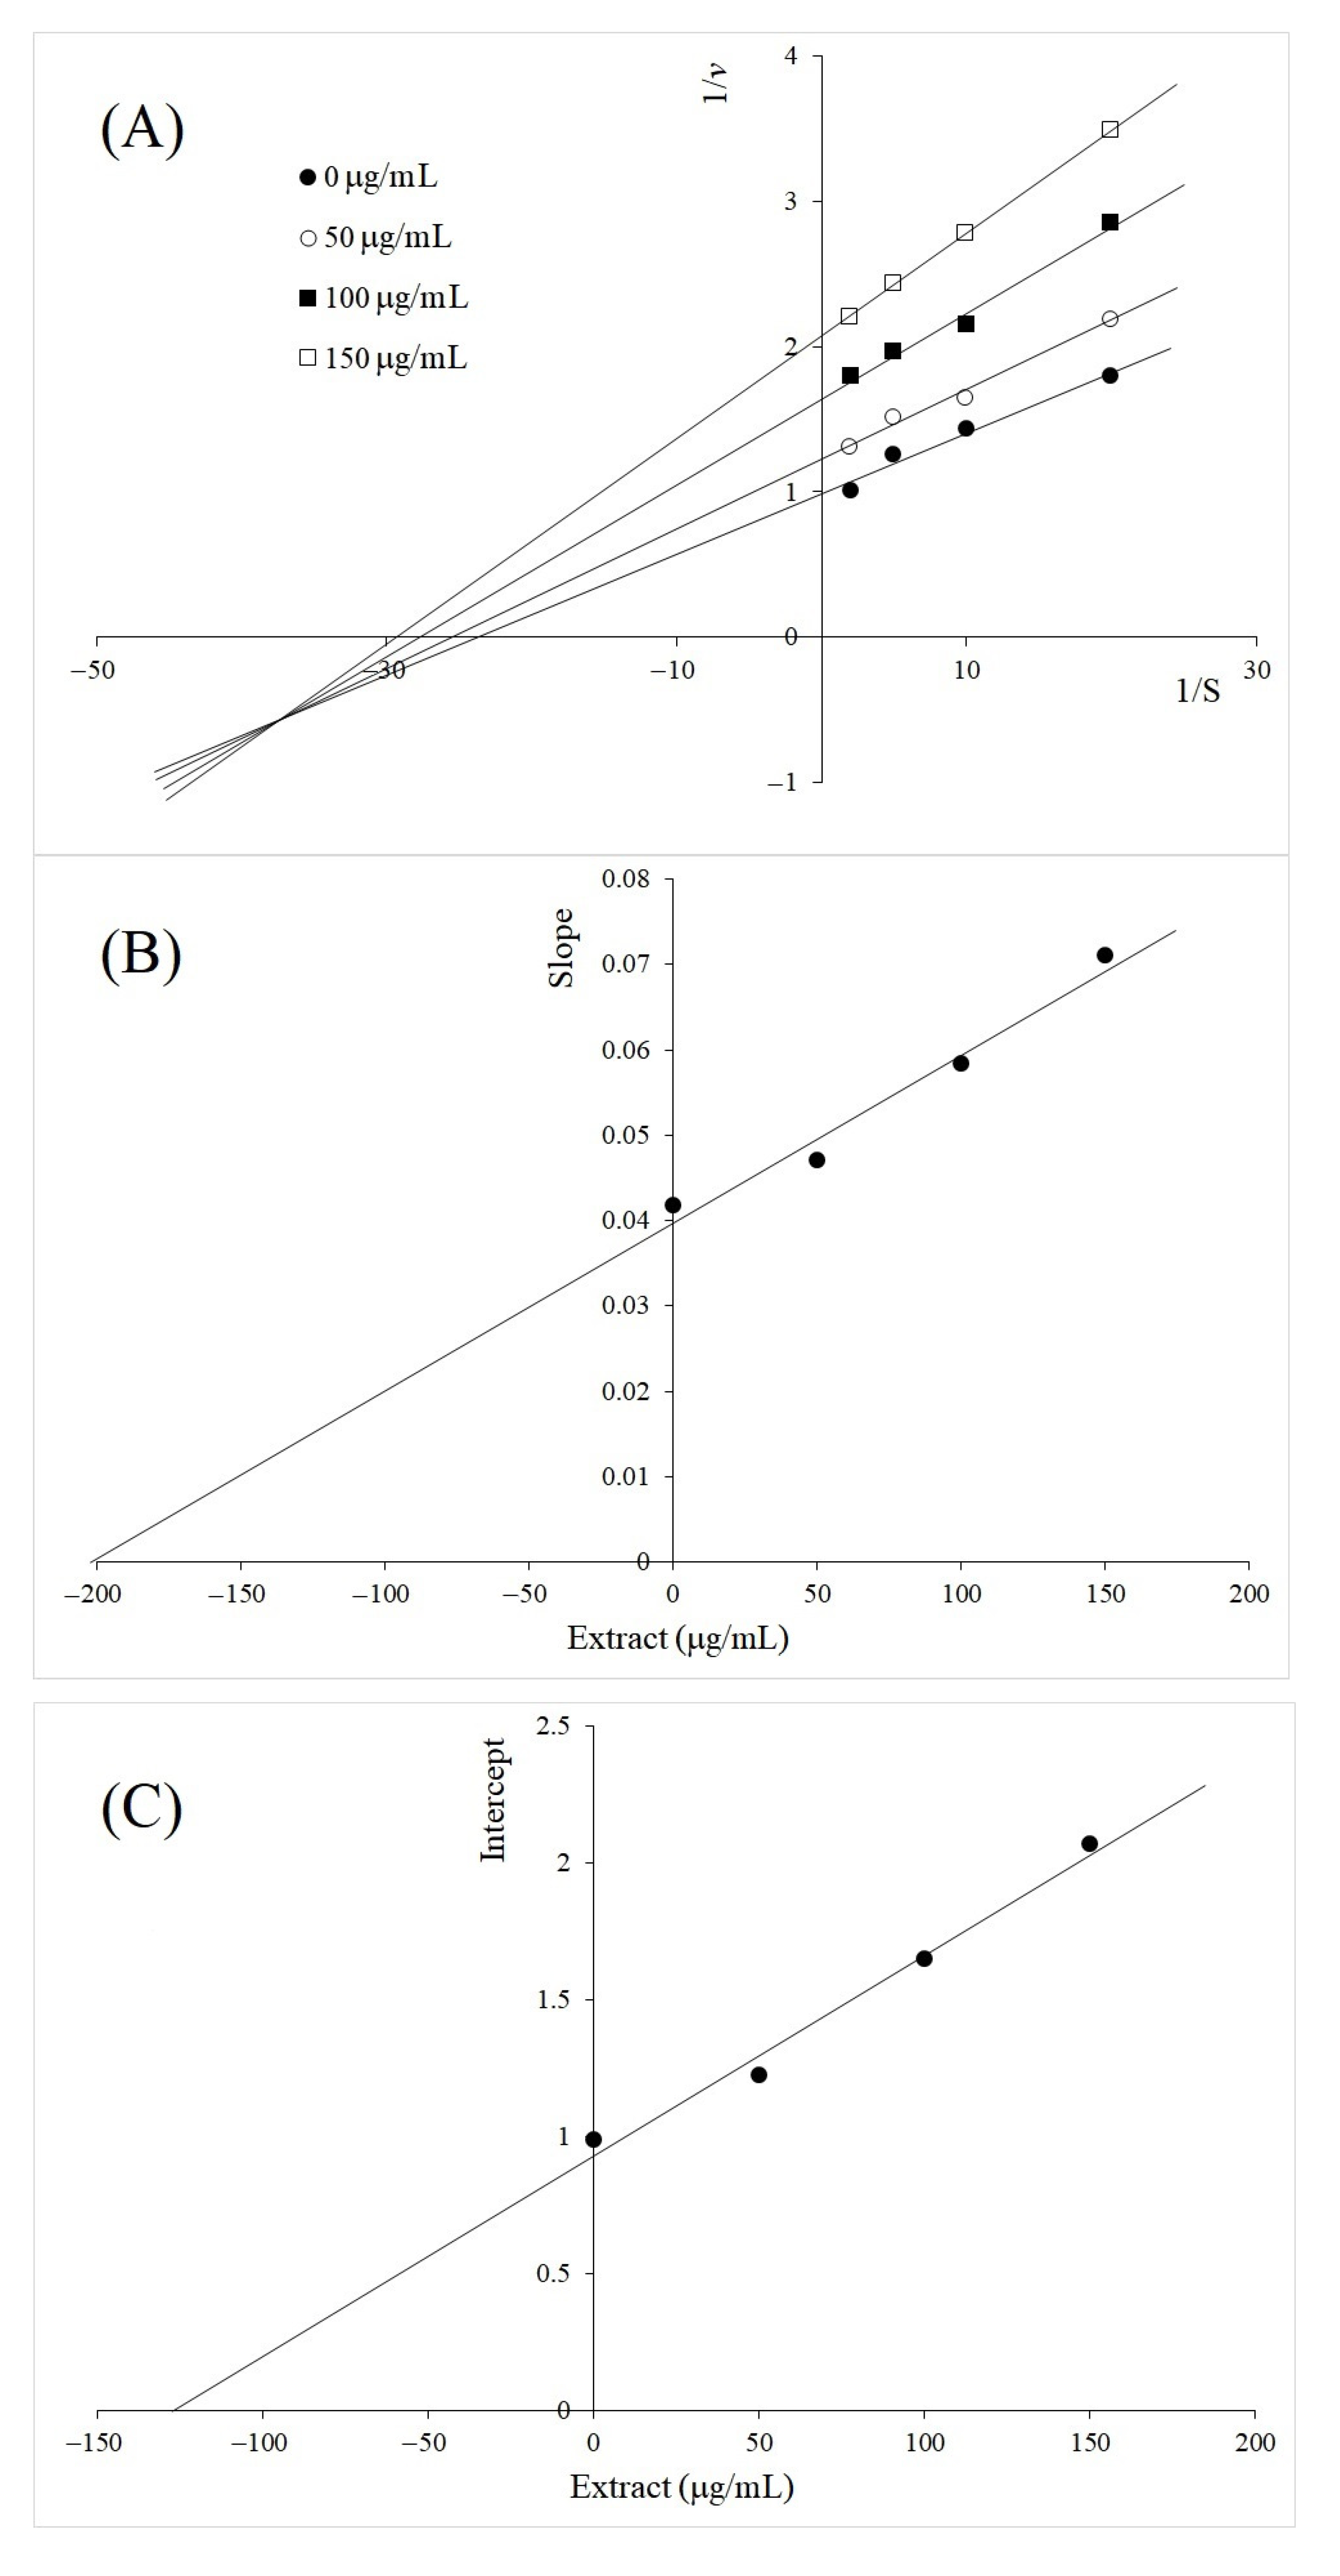
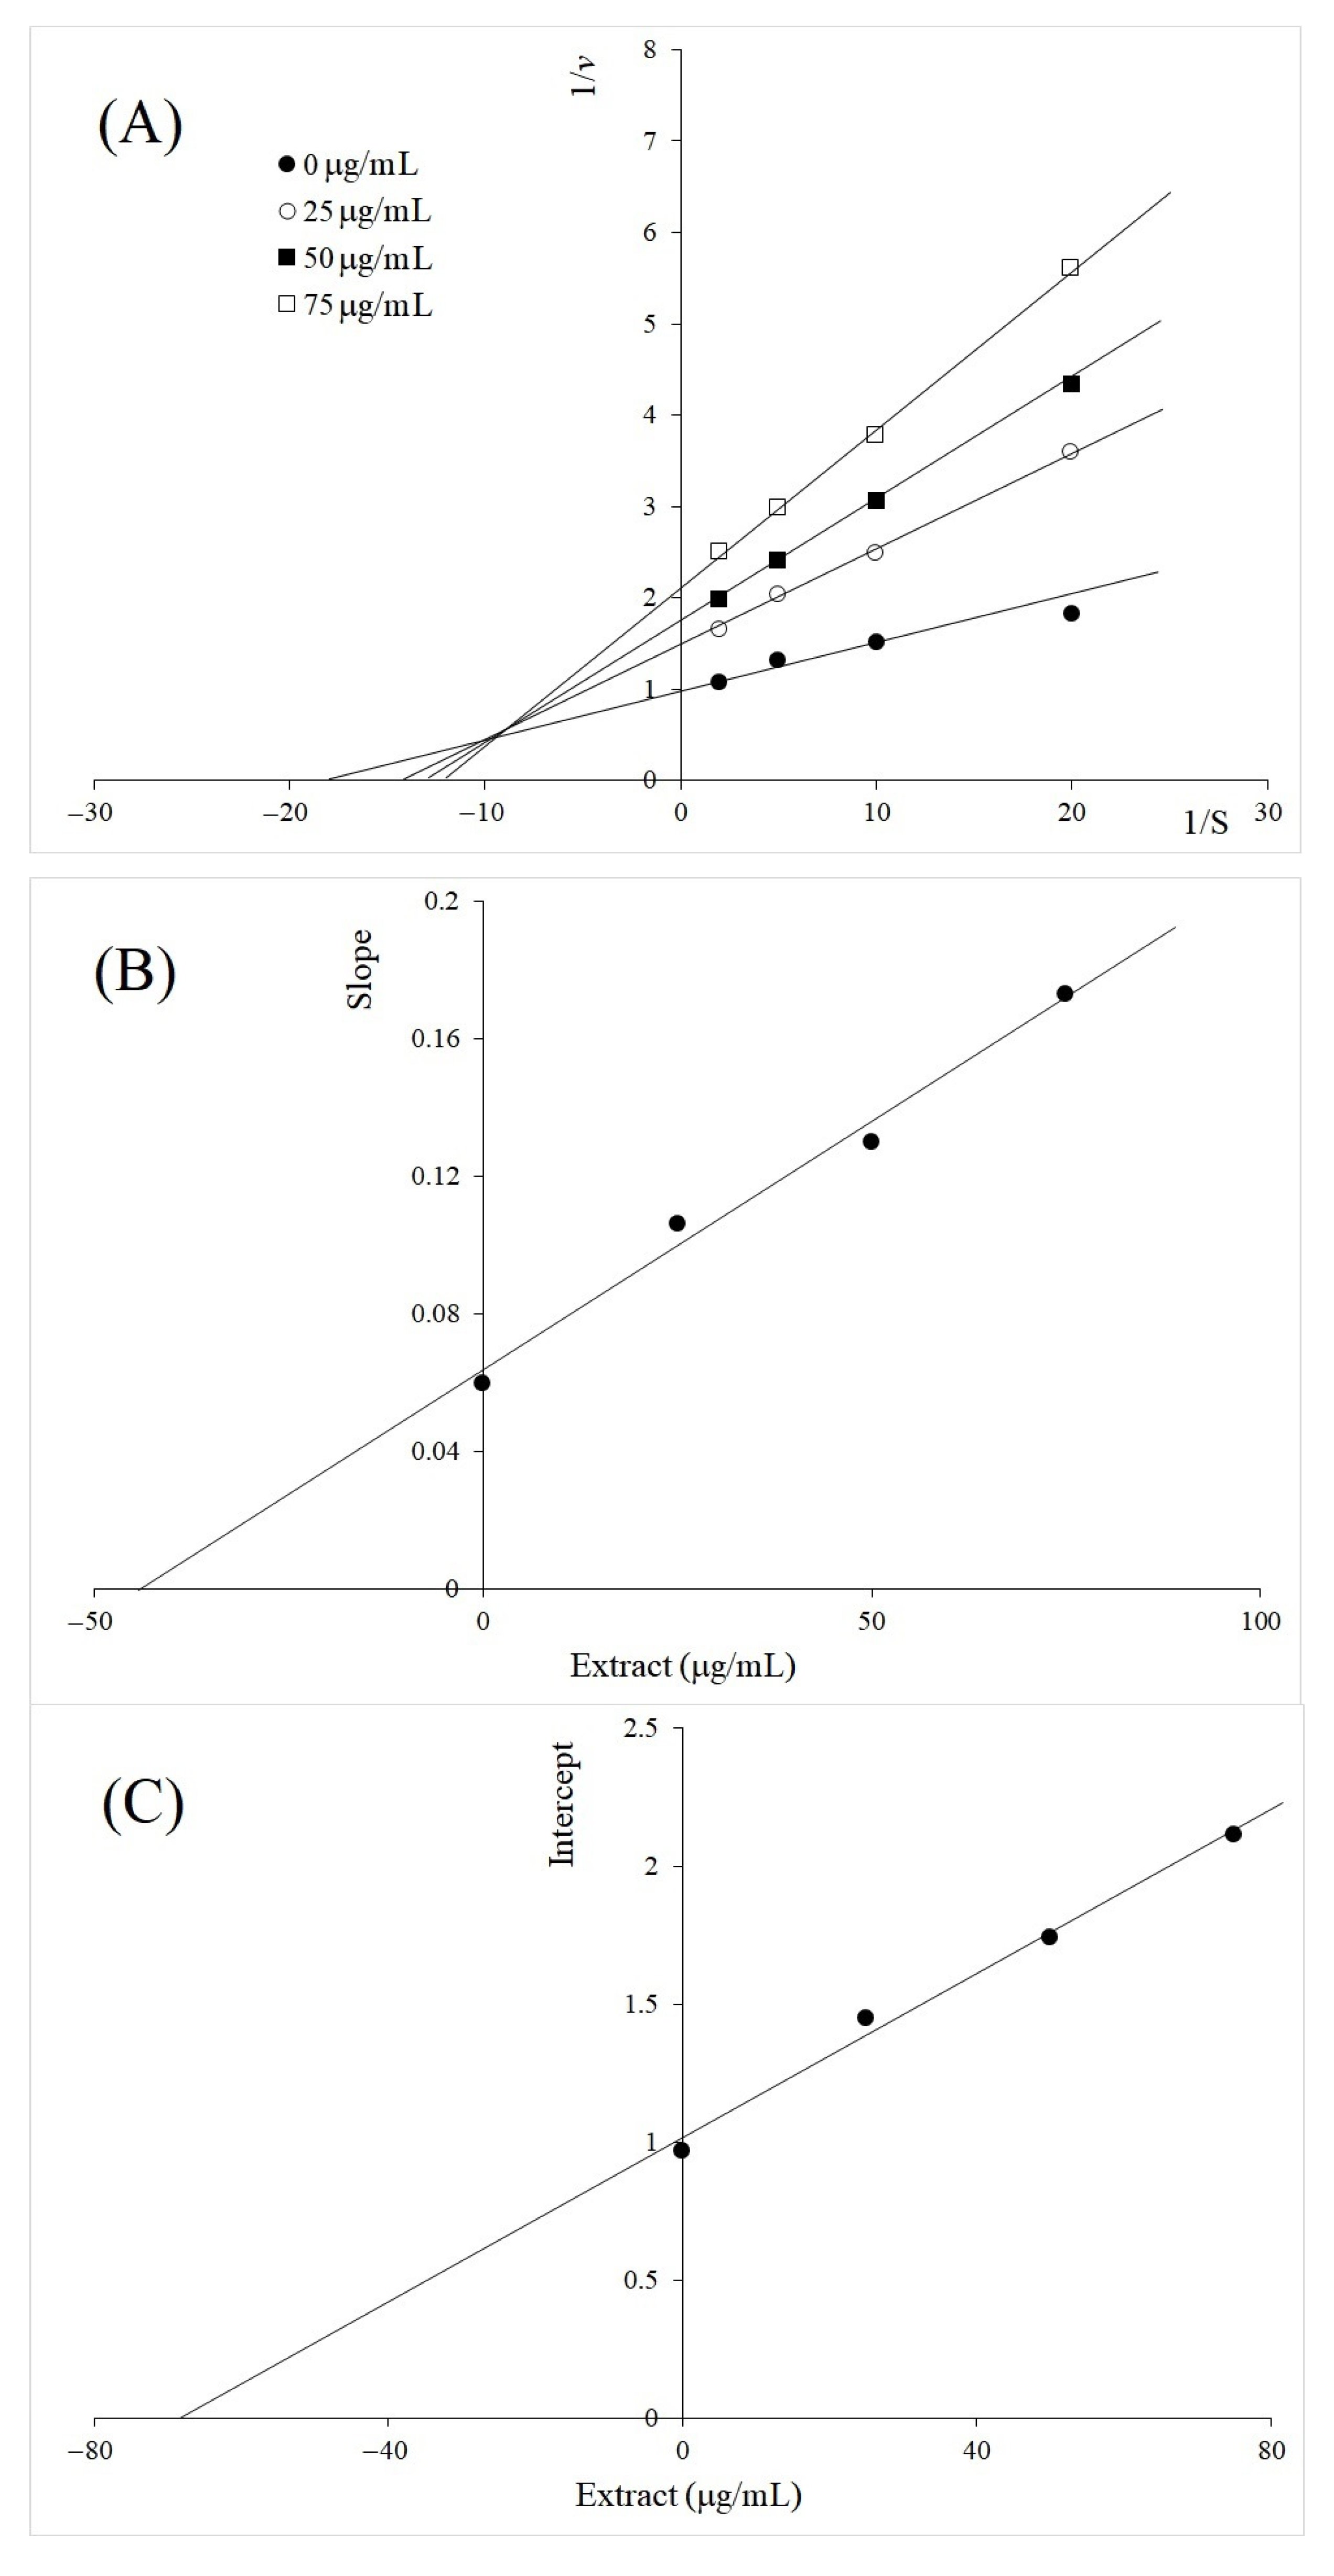
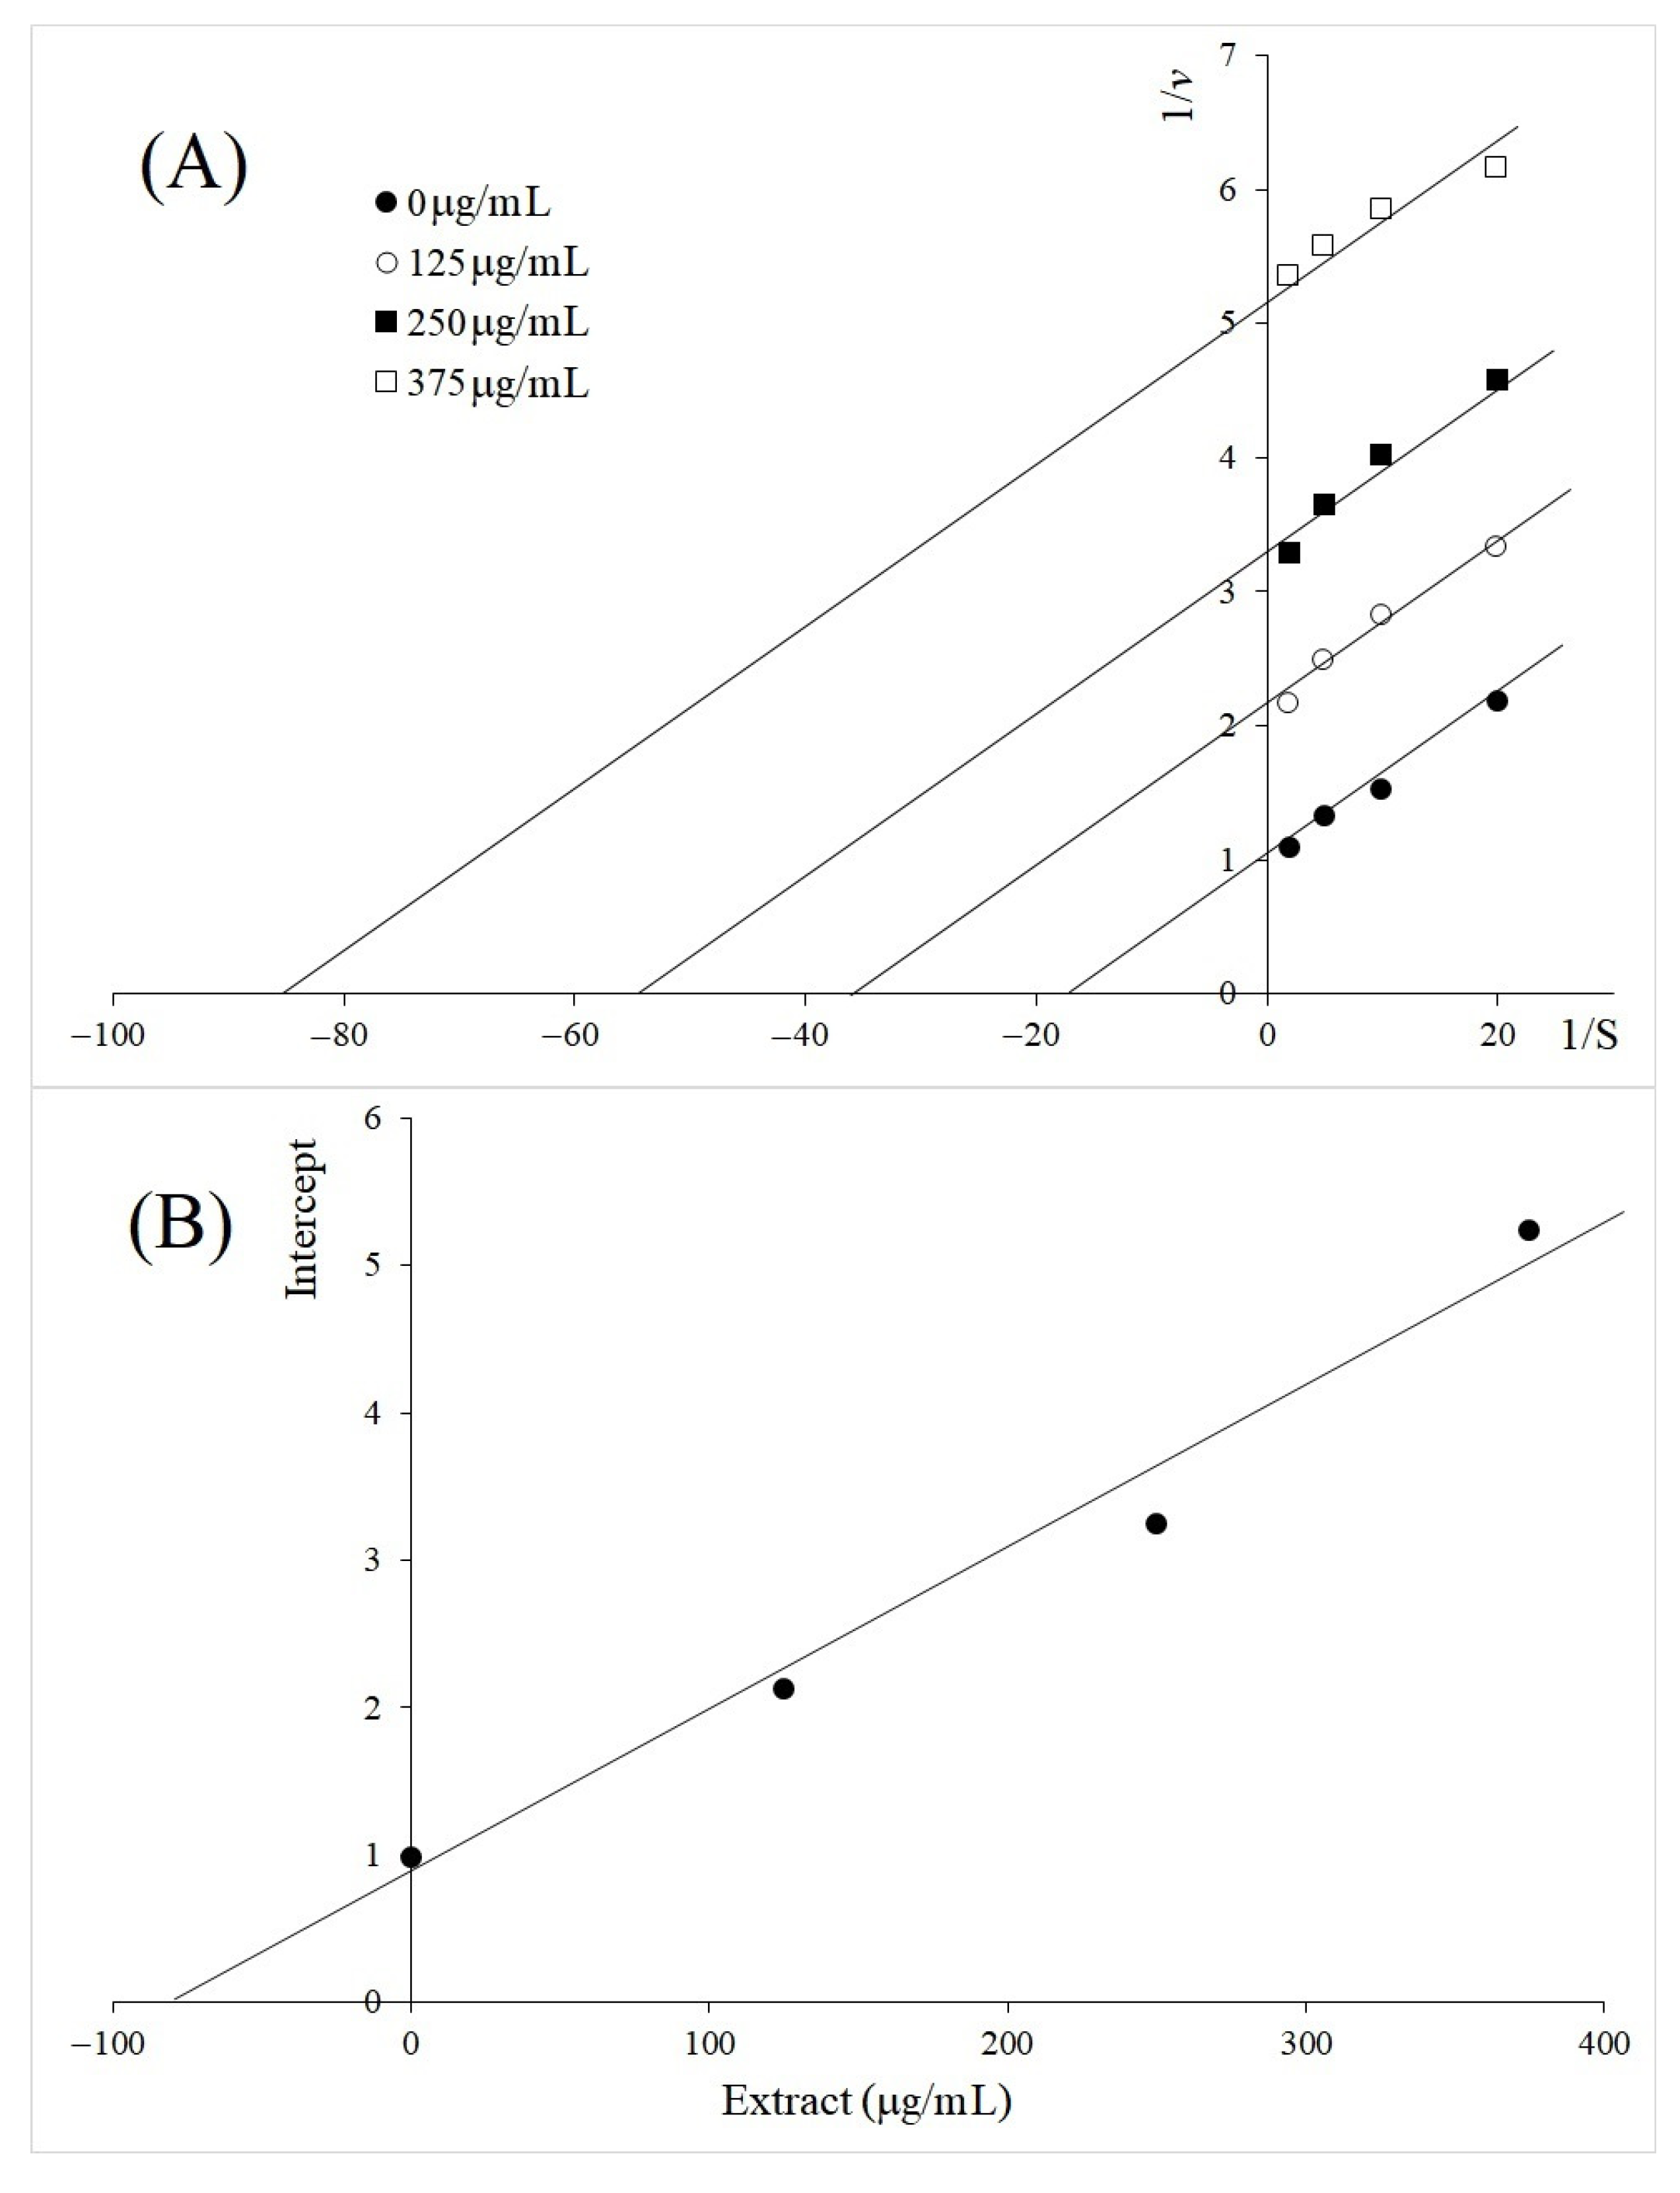
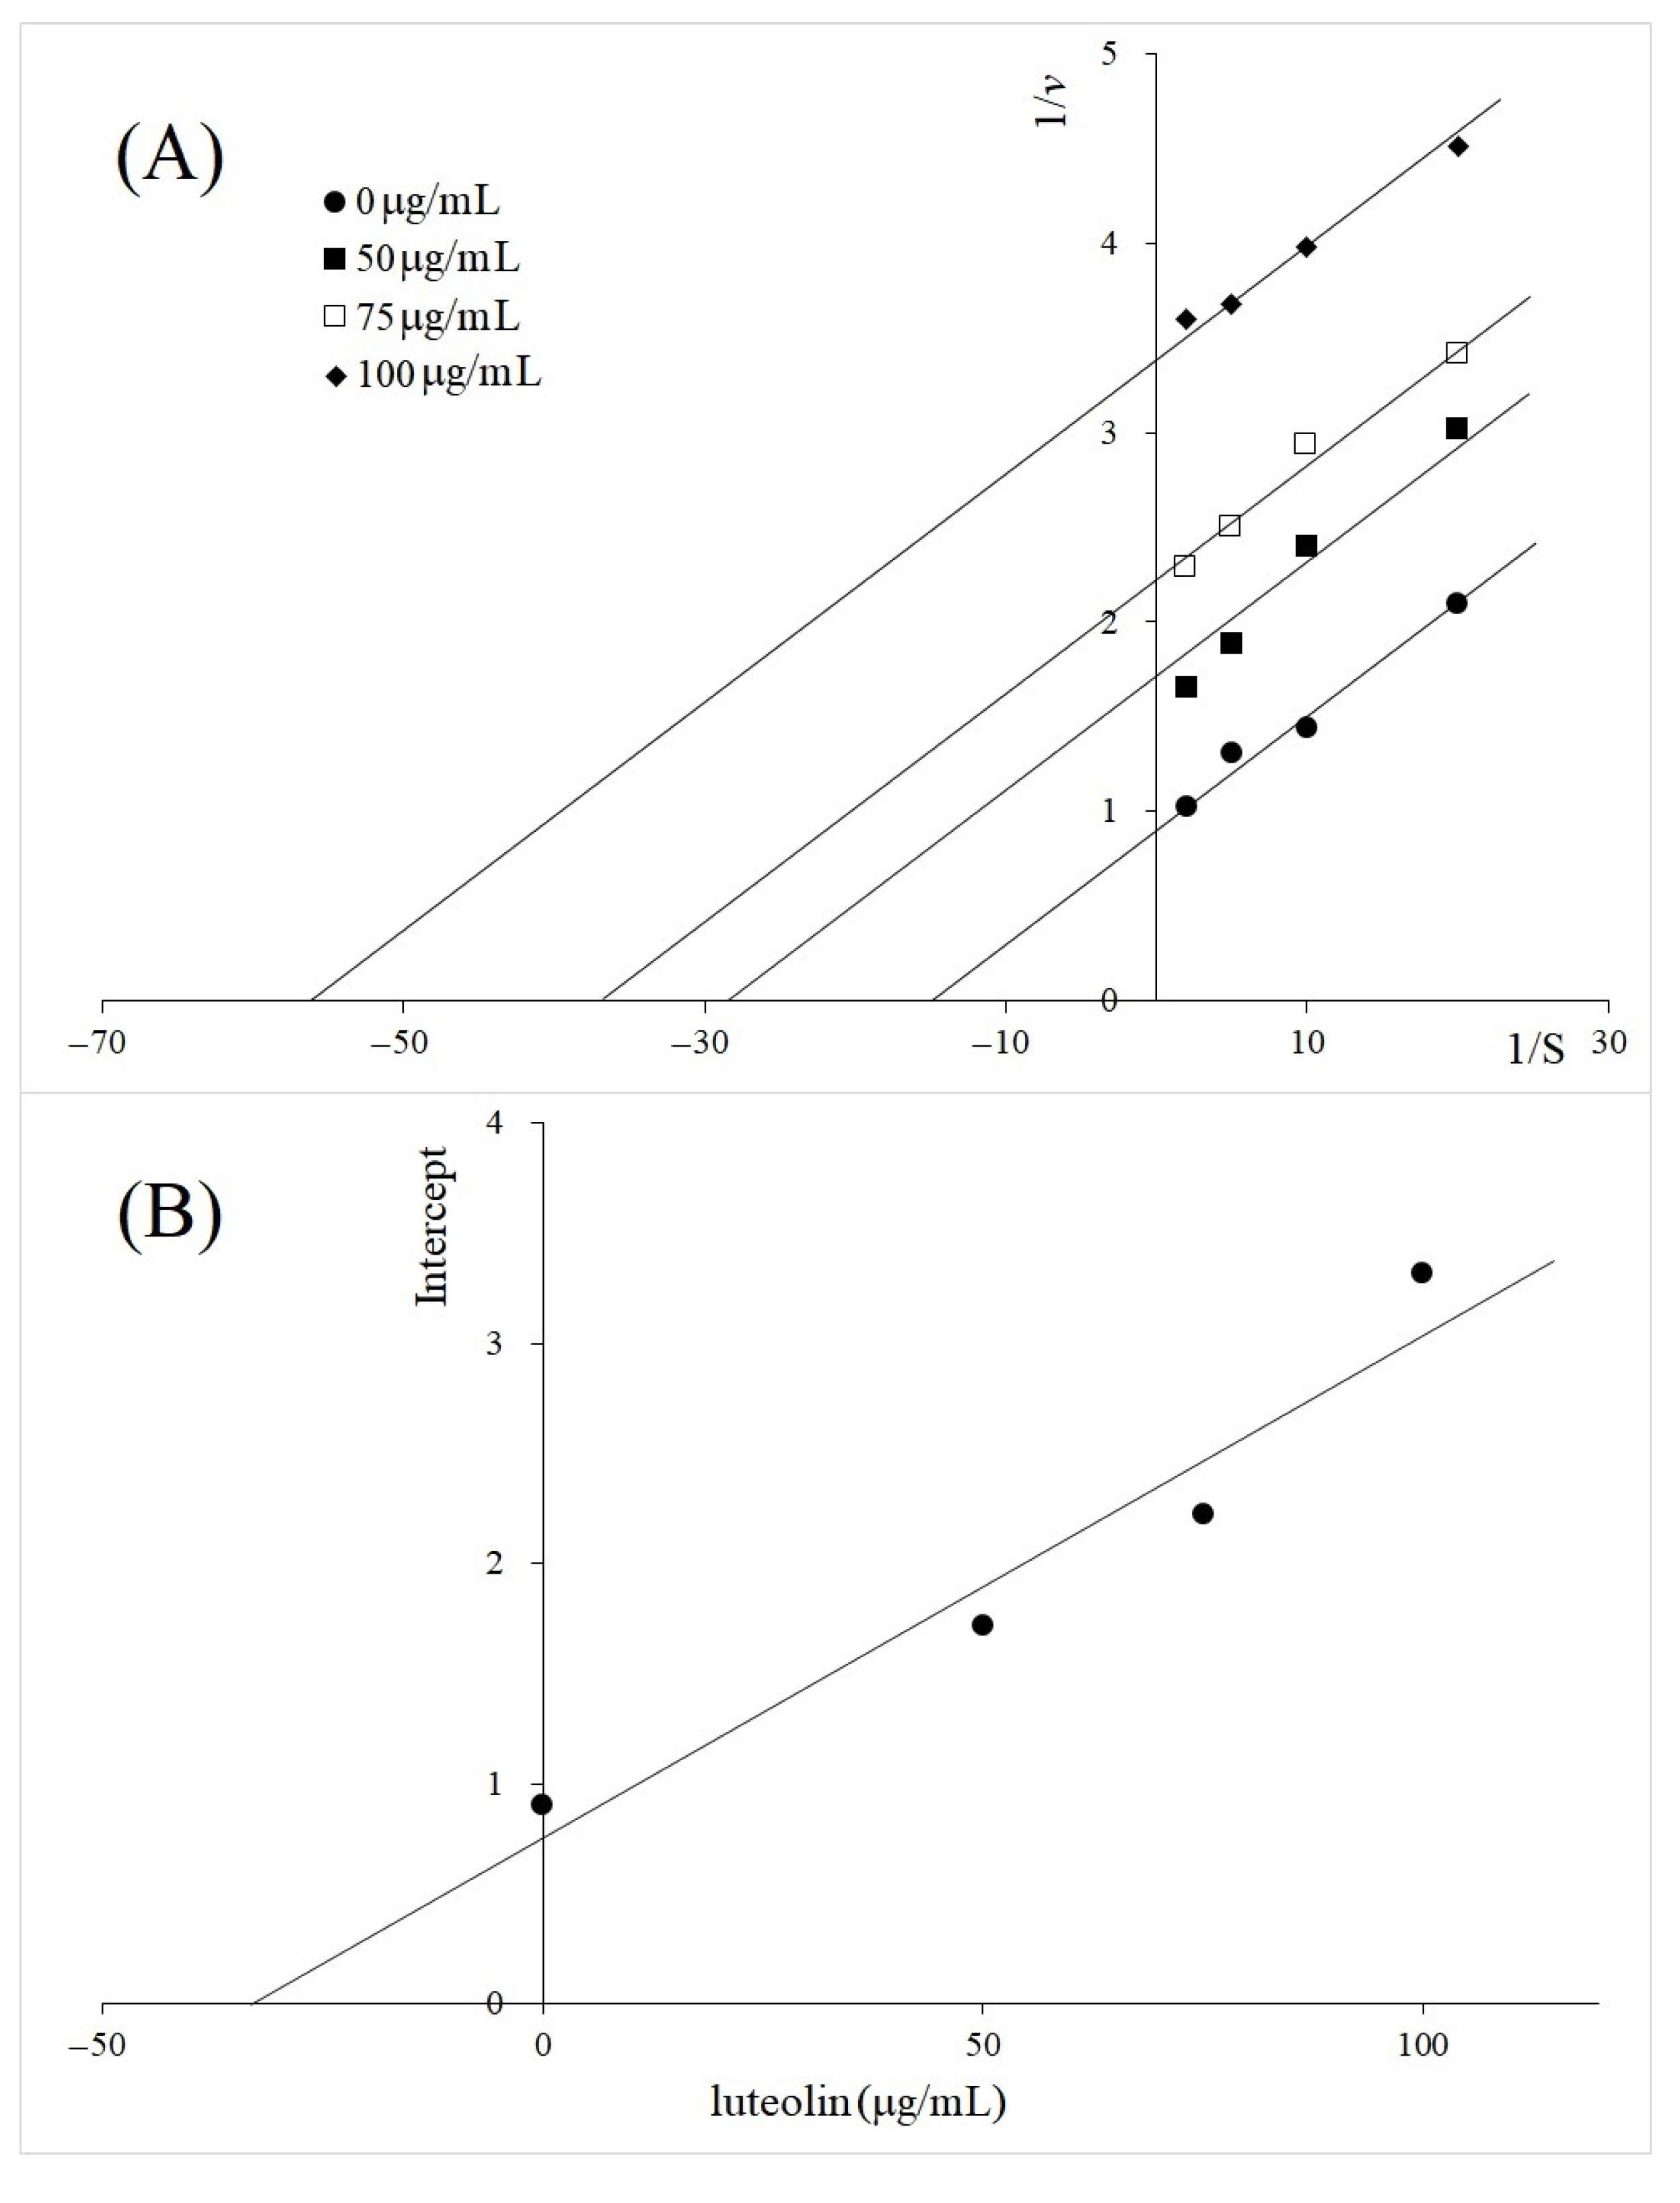
2.2. Kinetics Study of TYR Inhibition by A. galanga BL, M. oleifera and V. vinifera
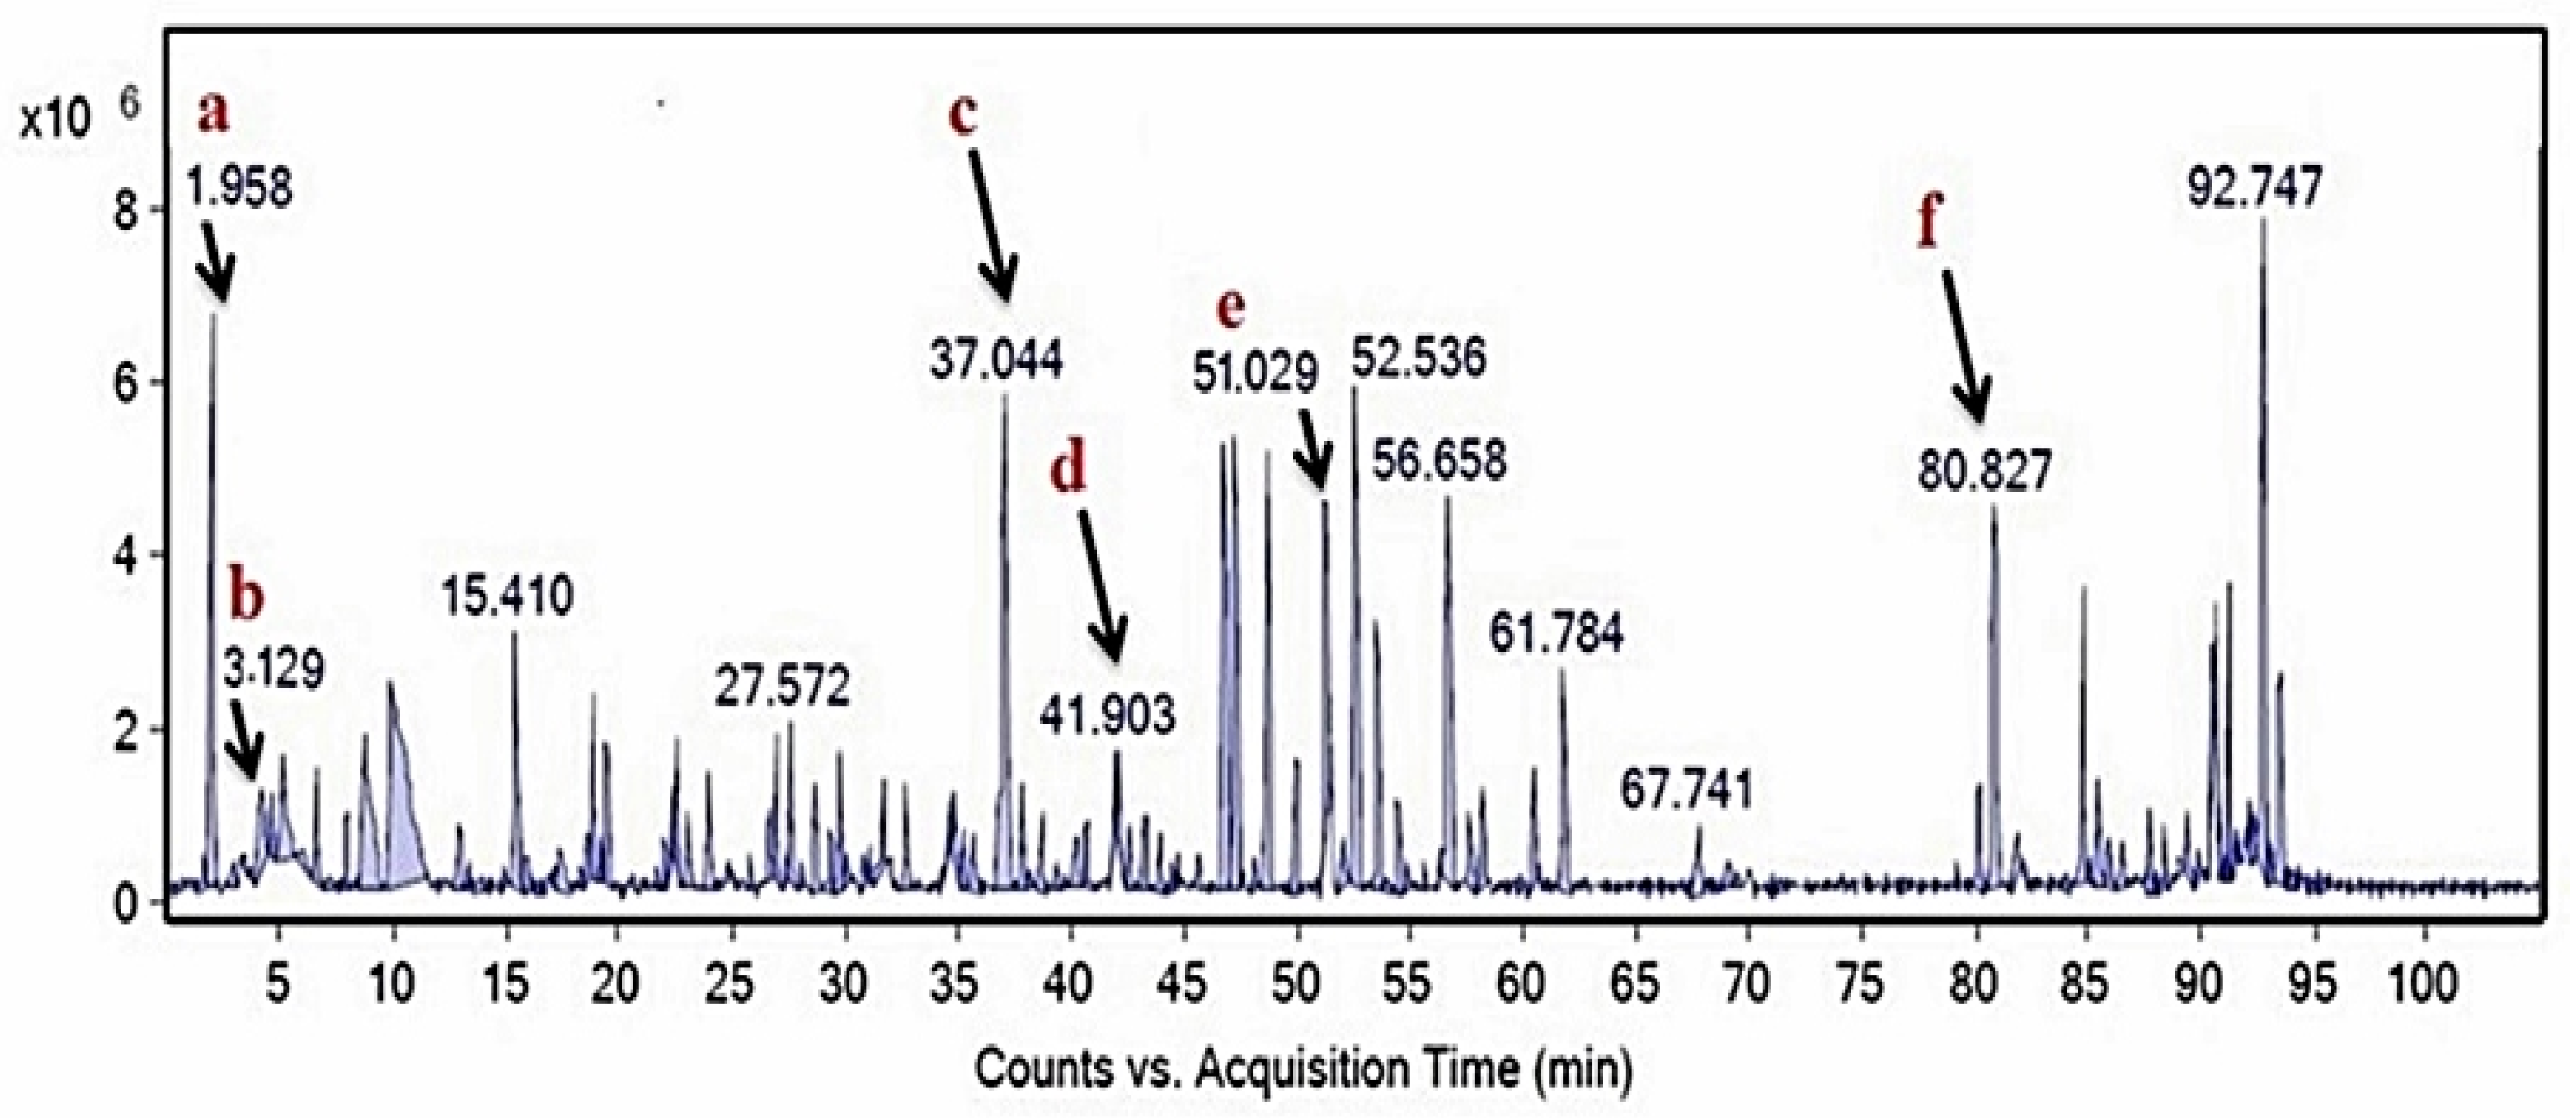
2.3. Compositional Analysis of M. oleifera Leaf Extract
3. Discussion
4. Materials and Methods
4.1. Chemicals and Reagents
4.2. Plant Materials and Extraction
4.3. Total Phenolic Content
4.4. Tyrosinase Inhibition
4.5. Kinetic Study of TYR Inhibition
4.6. HPLC-MS Analysis of M. oleifera Extract
Supplementary Materials
Author Contributions
Funding
Institutional Review Board Statement
Informed Consent Statement
Acknowledgments
Conflicts of Interest
Sample Availability
References
- Yarosh, D.; Dong, K.; Smiles, K. UV-induced degradation of collagen I is mediated by soluble factors released from keratinocytes. Photochem. Photobiol. 2007, 84, 67–68. [Google Scholar] [CrossRef] [PubMed]
- Mukherjee, P.K.; Biswas, R.; Sharma, A.; Banerjee, S.; Biswas, S. Validation of medicinal herbs for anti-tyrosinase potential. J. Herb. Med. 2018, 14, 1–16. [Google Scholar] [CrossRef]
- Solomon, E.I.; Heppner, D.E.; Johnston, E.M.; Ginsbach, J.W.; Cirera, J.; Qayyum, M.; Kieber-Emmons, M.T.; Kjaergaard, C.H.; Hadt, R.G.; Tian, L. Copper active sites in biology. Chem. Rev. 2014, 114, 3659–3853. [Google Scholar] [CrossRef] [Green Version]
- Goldfeder, M.; Kanteev, M.; Isachar-Ovdat, S.; Adir, N.; Fishman, A. Determination of tyrosinase substrate-binding modes reveals mechanistic differences between type-3 copper proteins. Nat. Commun. 2014, 5, 4505. [Google Scholar] [CrossRef] [PubMed]
- Garcia-Molina, F.; Munoz, J.L.; Varon, R.; Rodriguez-Lopez, J.N.; Garcia-Canovas, F.; Tudela, J. A review on spectrophotometric methods for measuring the monophenolase and diphenolase activities of tyrosinase. J. Agric. Food Chem. 2007, 55, 9739–9749. [Google Scholar] [CrossRef] [PubMed]
- Takizawa, T.; Imai, T.; Onose, J.; Ueda, M.; Tamura, T.; Mitsumori, K.; Izumi, K.; Hirose, M. Enhancement of hepatocarcinogenesis by kojic acid in rat two-stage models after initiation with N-bis(2-hydroxypropyl)nitrosamine or N-diethylnitrosamine. Toxicol. Sci. 2004, 81, 43–49. [Google Scholar] [CrossRef]
- Chang, T.S. An updated review of tyrosinase inhibitors. Int. J. Mol. Sci. 2009, 10, 2440–2475. [Google Scholar] [CrossRef] [Green Version]
- Ramsay, R.; Tipton, K.F. Assessment of enzyme inhibition: A review with examples from the development of monoamine oxidase and cholinesterase inhibitory drugs. Molecules 2017, 22, 1192. [Google Scholar] [CrossRef] [Green Version]
- Cornish-Bowden, A. Why is uncompetitive inhibition so rare? A possible explanation, with implications for the design of drugs and pesticides. FEBS Lett. 1986, 203, 3–6. [Google Scholar] [CrossRef] [Green Version]
- Ribeiro, A.; Estanqueiro, M.; Oliveira, M.; Sousa, L.J. Main benefits and applicability of plant extracts in skin care products. Cosmetics 2015, 2, 48–65. [Google Scholar] [CrossRef] [Green Version]
- Abdul, K.A.; Azlan, A.; Ismail, A.; Hashim, P.; Abd, G.S.S.; Zainudin, B.H.; Abdullah, N.A. Phenolic composition, antioxidant, anti-wrinkles and tyrosinase inhibitory activities of cocoa pod extract. BMC Complement. Altern. Med. 2014, 14, 381. [Google Scholar] [CrossRef] [PubMed] [Green Version]
- Han, J. Chemical aspects of gut metabolism of flavonoids. Metabolites 2019, 9, 136. [Google Scholar] [CrossRef] [Green Version]
- Tan, S.R.S.; Eser, B.E.; Han, J. Gut metabolism of furanocoumarins: Proposed function of Co O-methyltransferase. ACS Omega 2020, 5, 30696–30703. [Google Scholar] [CrossRef]
- Burapan, S.; Kim, M.; Han, J. Curcuminoid demethylation as an alternative metabolism by human intestinal microbiota. J. Agric. Food Chem. 2017, 66, 3305–3310. [Google Scholar] [CrossRef]
- Lo, C.Y.; Liu, P.L.; Lin, L.C.; Chen, Y.T.; Hseu, Y.C.; Wen, Z.H.; Wang, H.M. Antimelanoma and antityrosinase from Alipinia galangal constituents. Sci. World J. 2013, 2013, 186505. [Google Scholar] [CrossRef] [PubMed]
- Ma, Z.F.; Zhang, H. Phytochemical constituents, health benefits, and industrial applications of grape seeds: A mini-review. Antioxidants 2017, 6, 71. [Google Scholar] [CrossRef] [Green Version]
- Jeon, S.H.; Kim, K.H.; Koh, J.U.; Kong, K.H. Inhibitory effects on L-dopa oxidation of tyrosinase by skin-whitening agents. Bull. Korean Chem. Soc. 2005, 26, 1135–1137. [Google Scholar]
- Karbassi, F.; Saboury, A.A.; Khan, M.T.H.; Choudhary, I.; Saifi, Z.S. Mushroom tyrosinase inhibition by two potent uncompetitive inhibitors. J. Enzym. Inhib. Med. Chem. 2004, 19, 349–353. [Google Scholar] [CrossRef] [PubMed]
- Xie, L.P.; Chen, Q.X.; Huang, H.; Wang, H.Z.; Zhang, R.Q. Inhibitory effects of some flavonoids on the activity of mushroom tyrosinase. Biochemistry 2003, 68, 487–491. [Google Scholar] [PubMed]
- Baell, J.B. Feeling Nature’s PAINS: Natural Products, Natural Product Drugs, and Pan Assay Interference Compounds (PAINS). J. Nat. Prod. 2016, 79, 616–628. [Google Scholar] [CrossRef]
- Singleton, V.L.; Orthofer, R.; Lamuela-Raventós, R.M. Analysis of total phenols and other oxidation substrates and antioxidants by means of Folin-Ciocalteu reagent. Meth. Enzymol. 1999, 299, 152–178. [Google Scholar]
- Shin, N.H.; Ryu, S.Y.; Choi, E.J.; Kang, S.H.; Chang, I.M.; Min, K.R.; Kim, Y. Oxyresveratrol as the potent inhibitor on dopa oxidase activity of mushroom tyrosinase. Biochem. Biophys. Res. Commun. 1998, 243, 801–808. [Google Scholar] [CrossRef] [PubMed]


| Plant Extract | TPC (mg GAE/g Extract) | IC50 (µg/mL) of TYR |
|---|---|---|
| Alpinia galanga leaf | 448.1 ± 2.3 | 240.4 ± 0.3 |
| Alpinia galanga rhizome BL | 651.9 ± 4.2 | 105.4 ± 0.2 |
| Alpinia galanga rhizome YL | 121.0 ± 0.3 | 294.6 ± 0.3 |
| Moringa oleifera leaf | 472.4 ± 2.8 | 121.3 ± 0.4 |
| Panax ginseng leaf | 146.5 ± 0.8 | 311.2 ± 0.4 |
| Panax ginseng rhizome | 233.0 ± 1.0 | 324.0 ± 0.5 |
| Vitis vinifera seed | 364.8 ± 1.2 | 94.8 ± 0.2 |
| Ascorbic acid | - 1 | 235.7 ± 1.0 |
| Kojic acid | - 1 | 192.3 ± 0.4 |
| Plant Extract | Type of Inhibition | Inhibition Constants, µg/mL | |
|---|---|---|---|
| Ki | Kii | ||
| Alpinia galanga rhizome BL | Mixed | 200 | 128 |
| Vitis vinifera leaf | Mixed | 42 | 68 |
| Molinga oleifera leaf | Uncompetitive | 73 | |
| Luteolin | Uncompetitive | 33 | |
Publisher’s Note: MDPI stays neutral with regard to jurisdictional claims in published maps and institutional affiliations. |
© 2021 by the authors. Licensee MDPI, Basel, Switzerland. This article is an open access article distributed under the terms and conditions of the Creative Commons Attribution (CC BY) license (https://creativecommons.org/licenses/by/4.0/).
Share and Cite
Hashim, F.J.; Vichitphan, S.; Han, J.; Vichitphan, K. Alternative Approach for Specific Tyrosinase Inhibitor Screening: Uncompetitive Inhibition of Tyrosinase by Moringa oleifera. Molecules 2021, 26, 4576. https://0-doi-org.brum.beds.ac.uk/10.3390/molecules26154576
Hashim FJ, Vichitphan S, Han J, Vichitphan K. Alternative Approach for Specific Tyrosinase Inhibitor Screening: Uncompetitive Inhibition of Tyrosinase by Moringa oleifera. Molecules. 2021; 26(15):4576. https://0-doi-org.brum.beds.ac.uk/10.3390/molecules26154576
Chicago/Turabian StyleHashim, Farah J., Sukanda Vichitphan, Jaehong Han, and Kanit Vichitphan. 2021. "Alternative Approach for Specific Tyrosinase Inhibitor Screening: Uncompetitive Inhibition of Tyrosinase by Moringa oleifera" Molecules 26, no. 15: 4576. https://0-doi-org.brum.beds.ac.uk/10.3390/molecules26154576