
Ultrasound-Assisted Extraction of Carotenoids from Carrot Pomace and Their Optimization through Response Surface Methodology

 , , , , and
Abstract
:1. Introduction
2. Materials and Methods
2.1. Chemicals
2.2. Carrot Pomace Powder Preparation
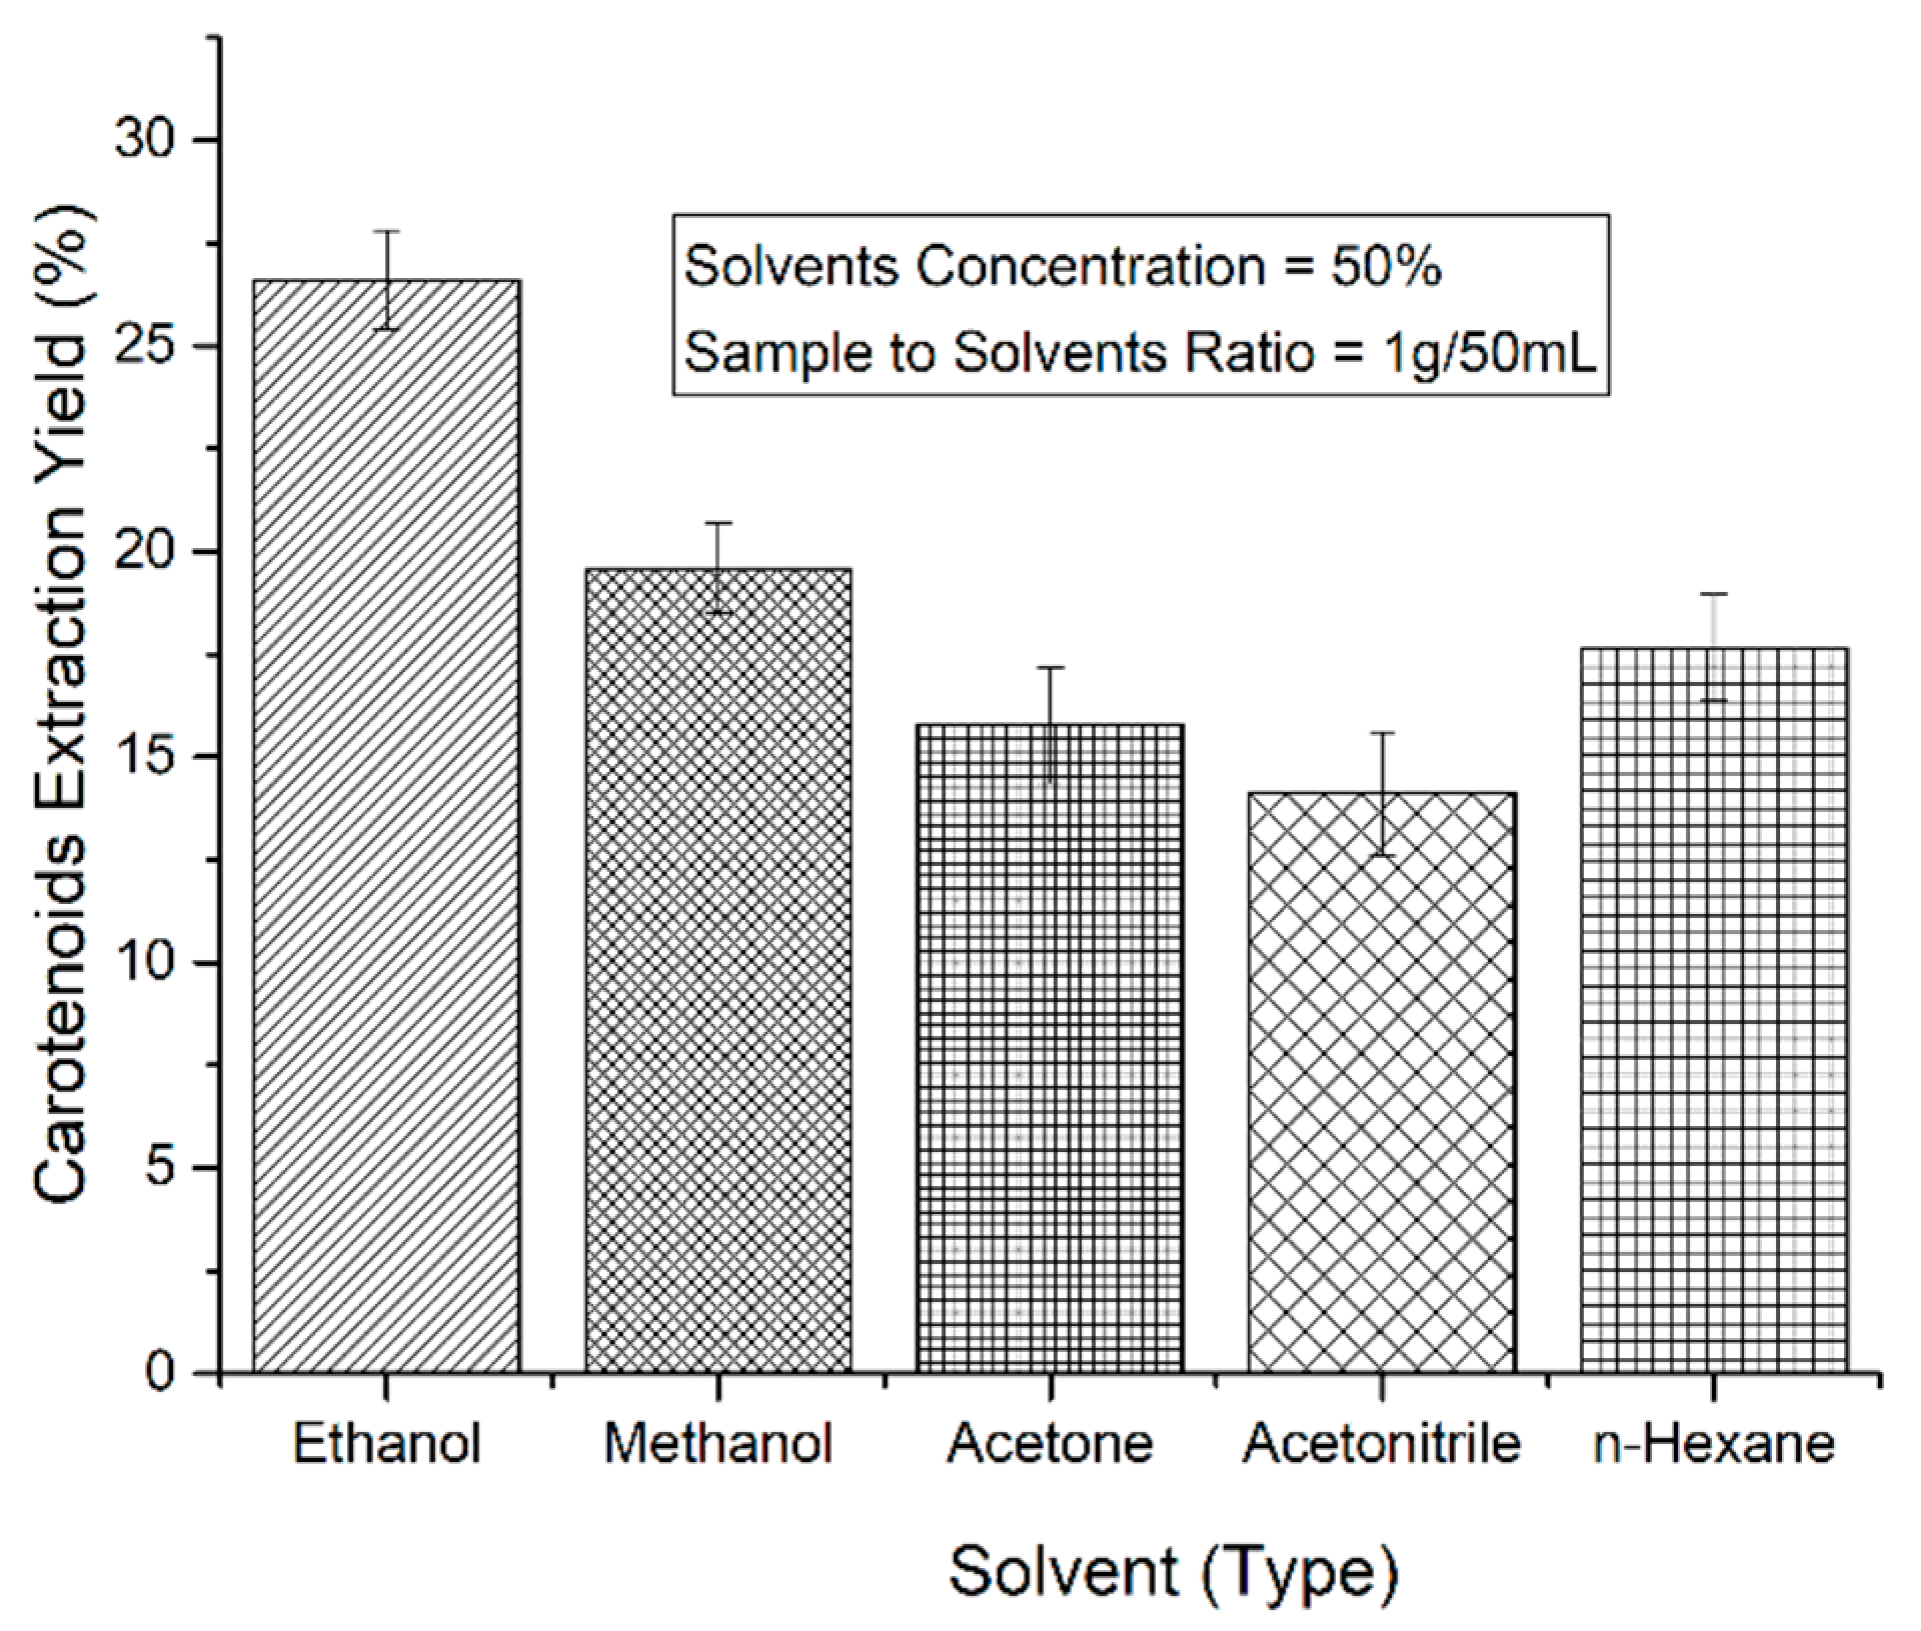
2.3. Optimization of Different Solvents
2.4. Ultrasound-Assisted Extraction (UAE)
2.5. Experiment Design
2.6. Determination of Total Carotenoids
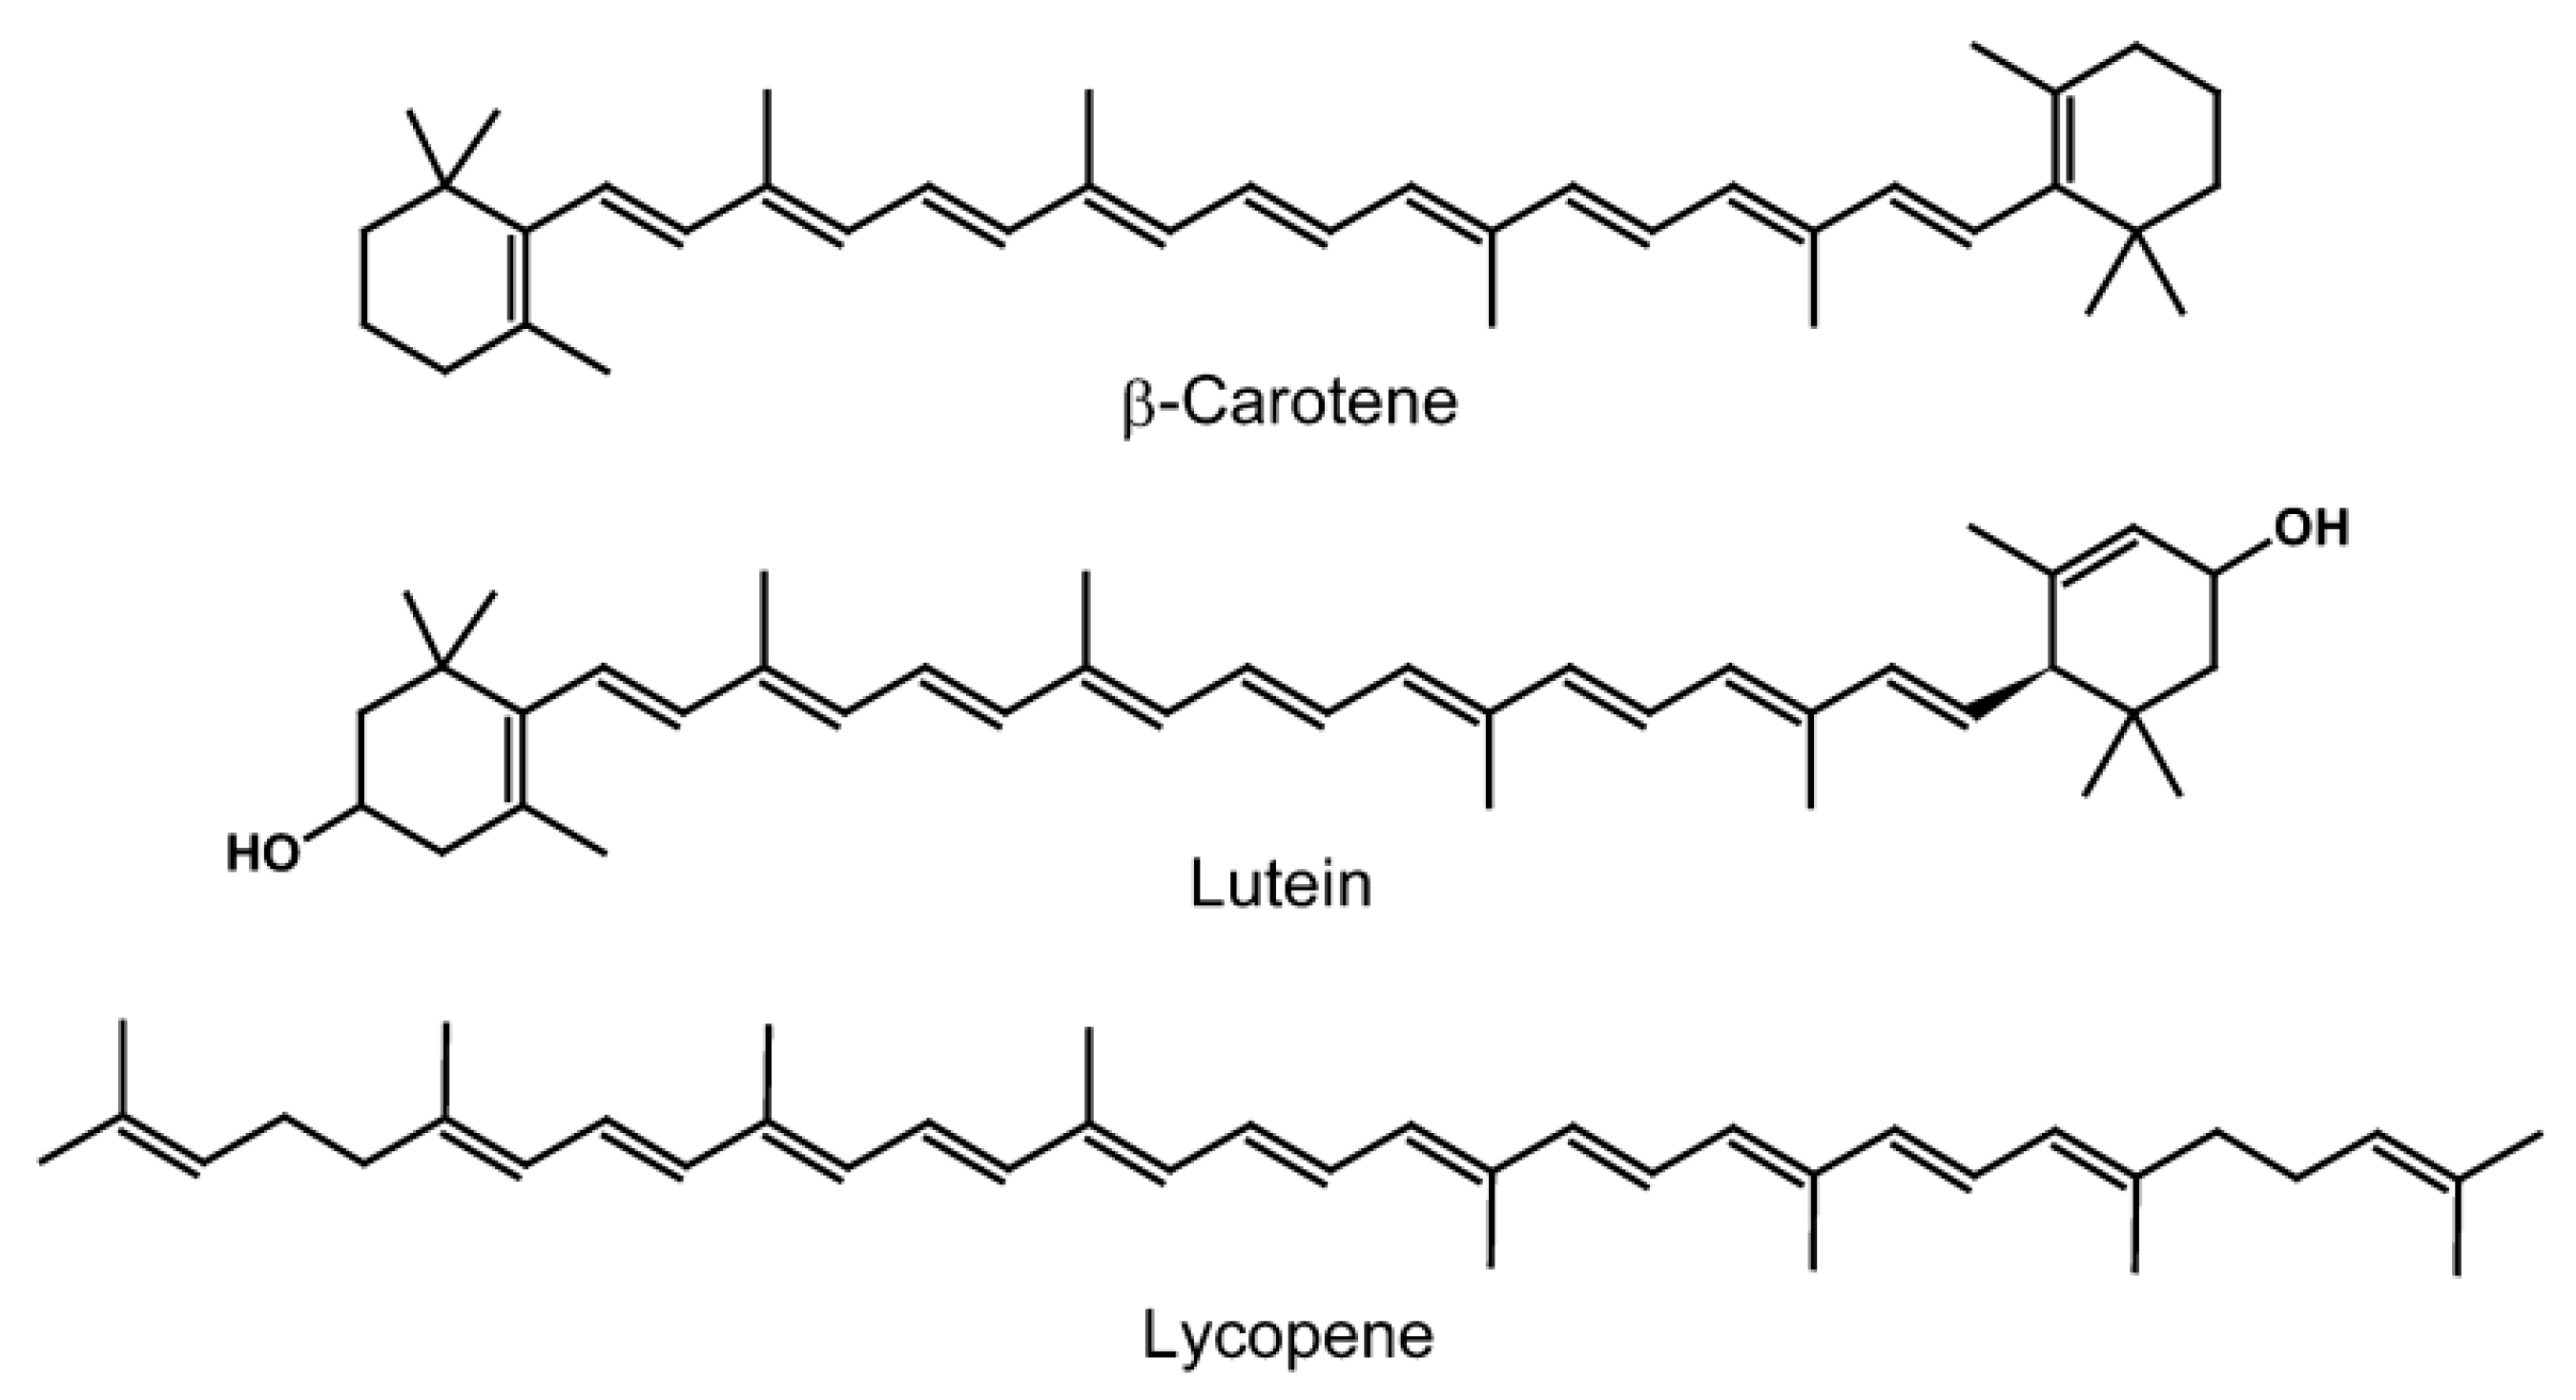
2.7. Determination of β-Carotene and Lutein
2.8. Determination of Lycopene
2.9. Statistical Analysis
3. Results and Discussion
3.1. Fitting the Response Surface Models
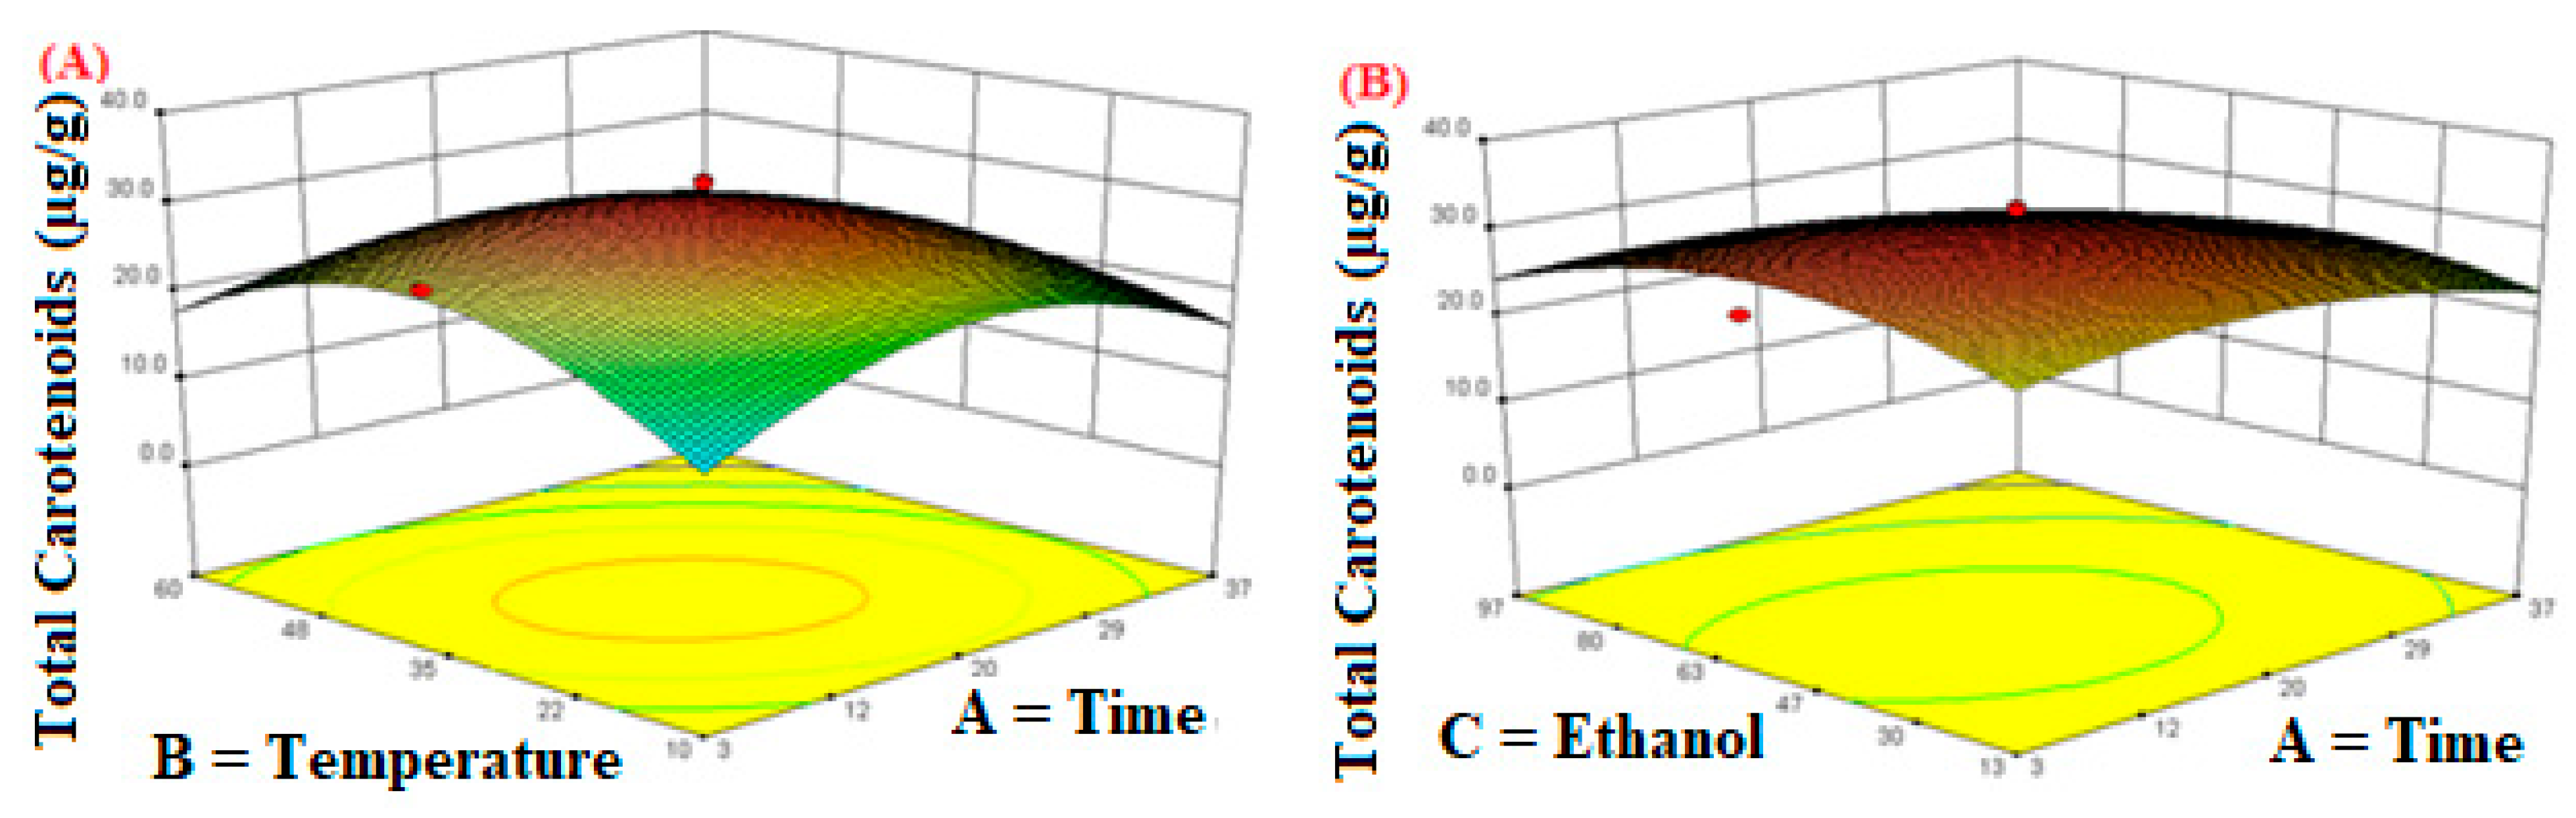
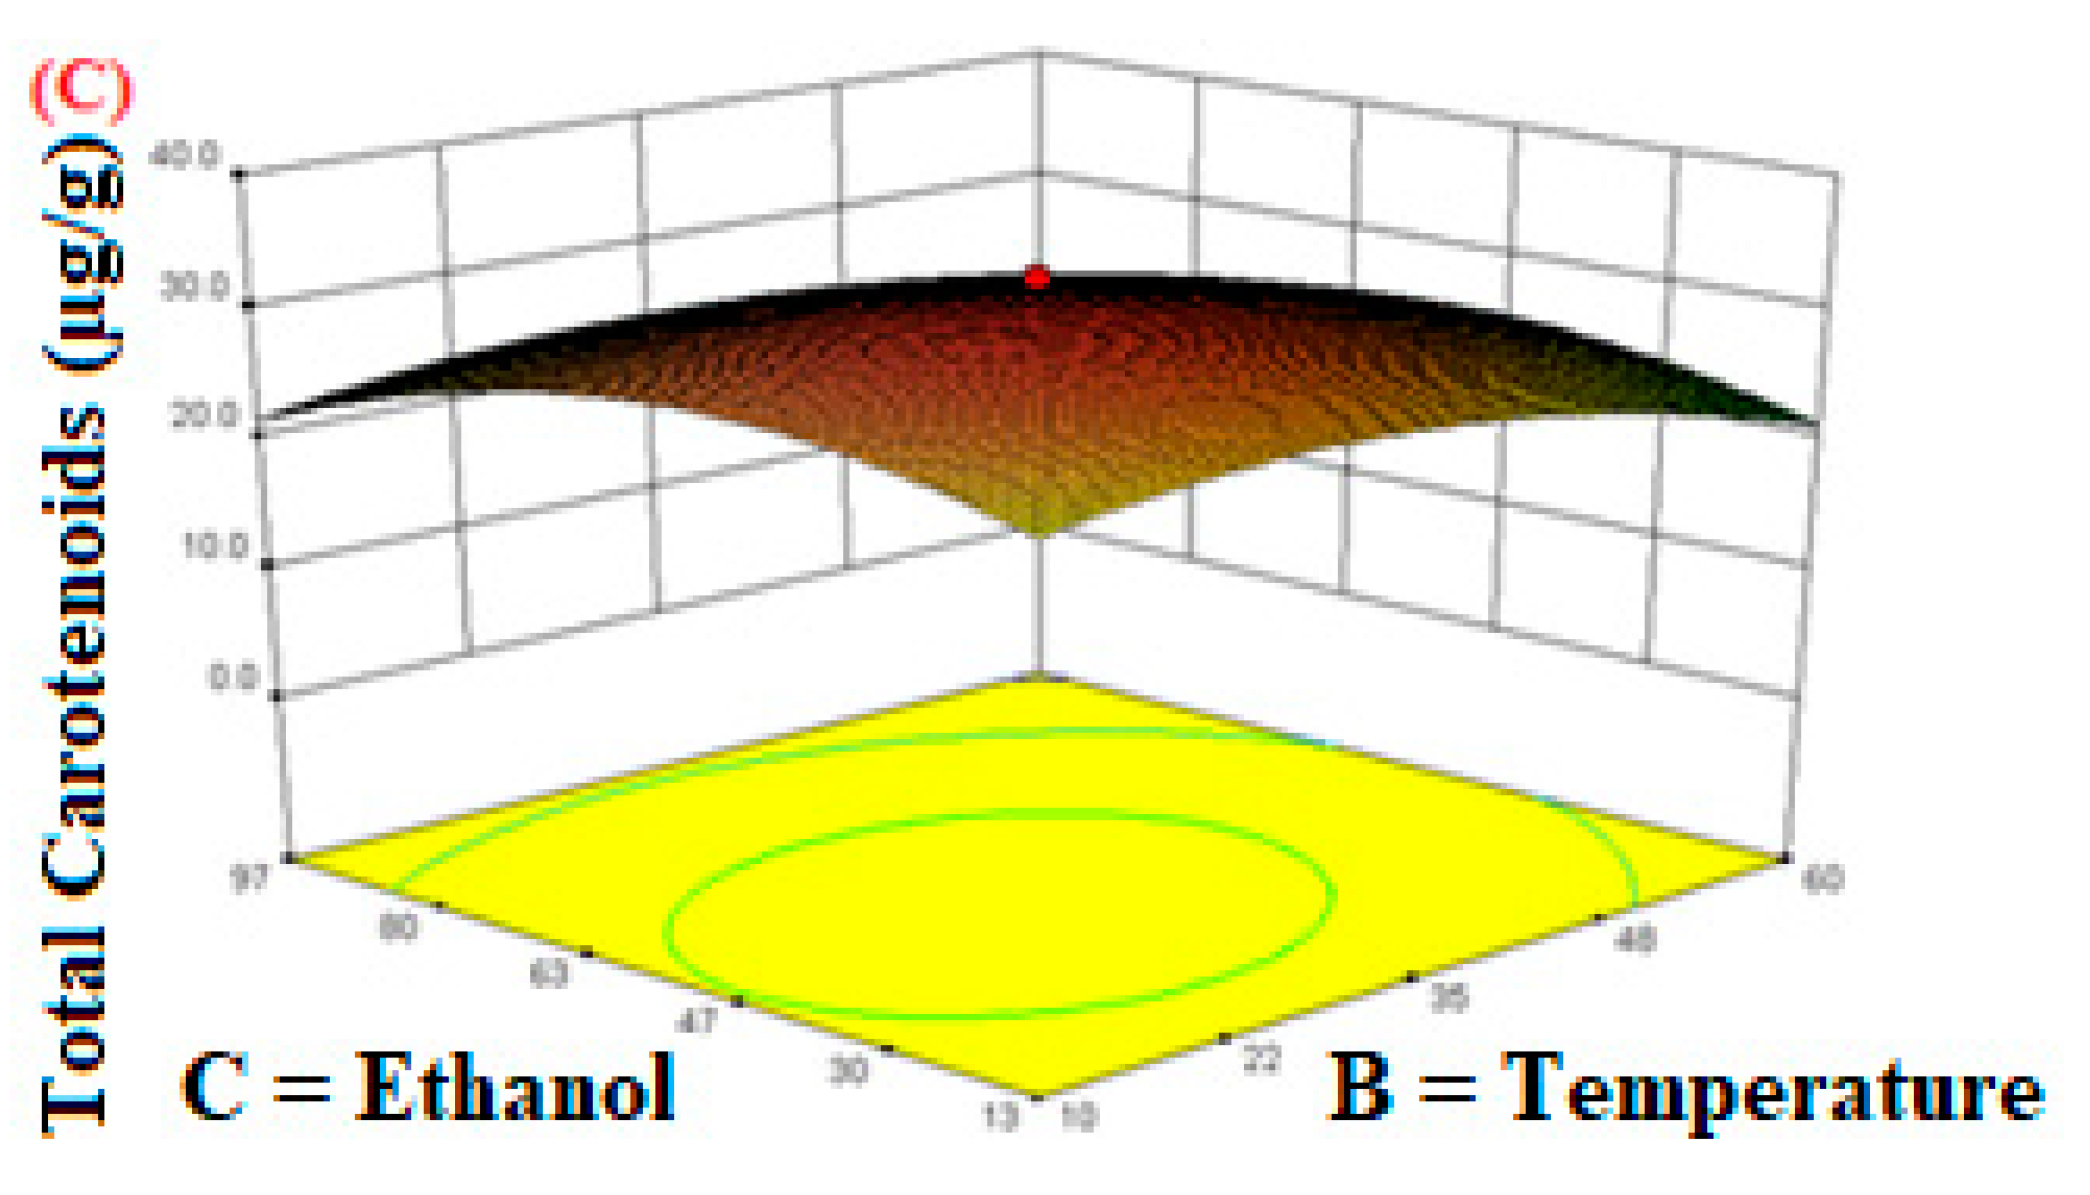
3.2. Influence of Independent Parameters on the Extraction of Total Carotenoids
3.3. Influence of Independent Variables on the Extraction of Different Carotenoids
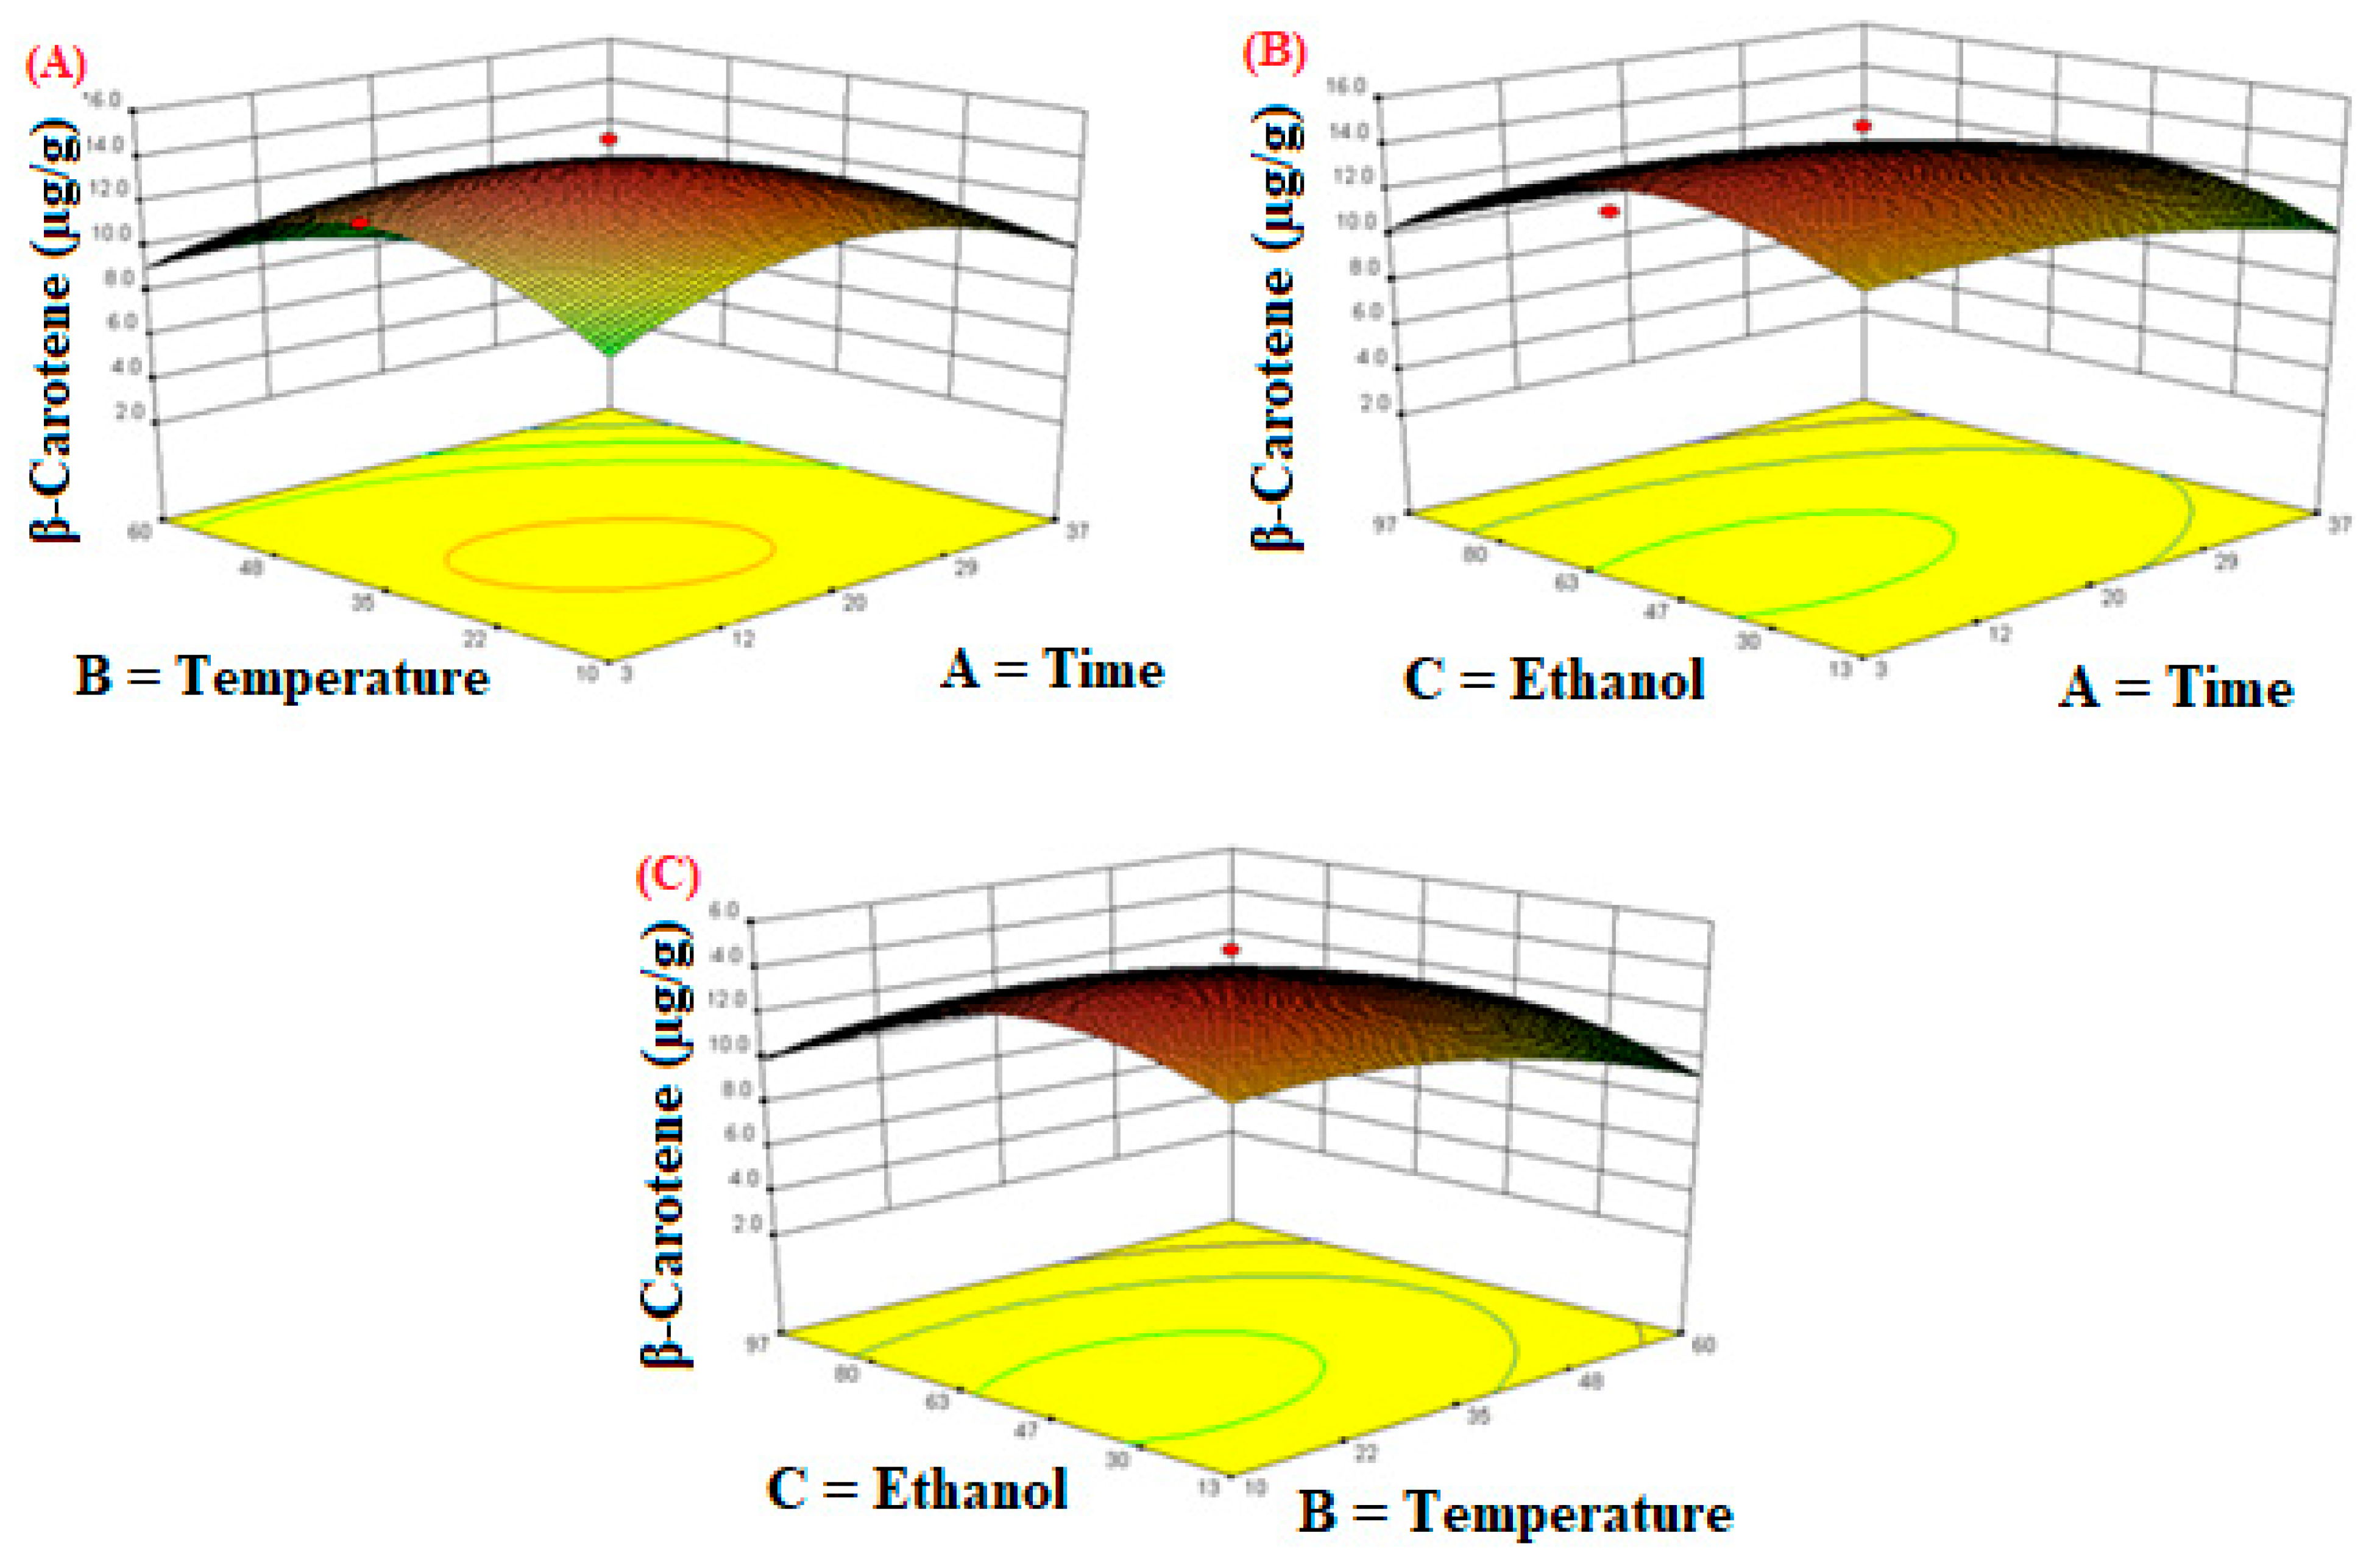
3.3.1. β-Carotene
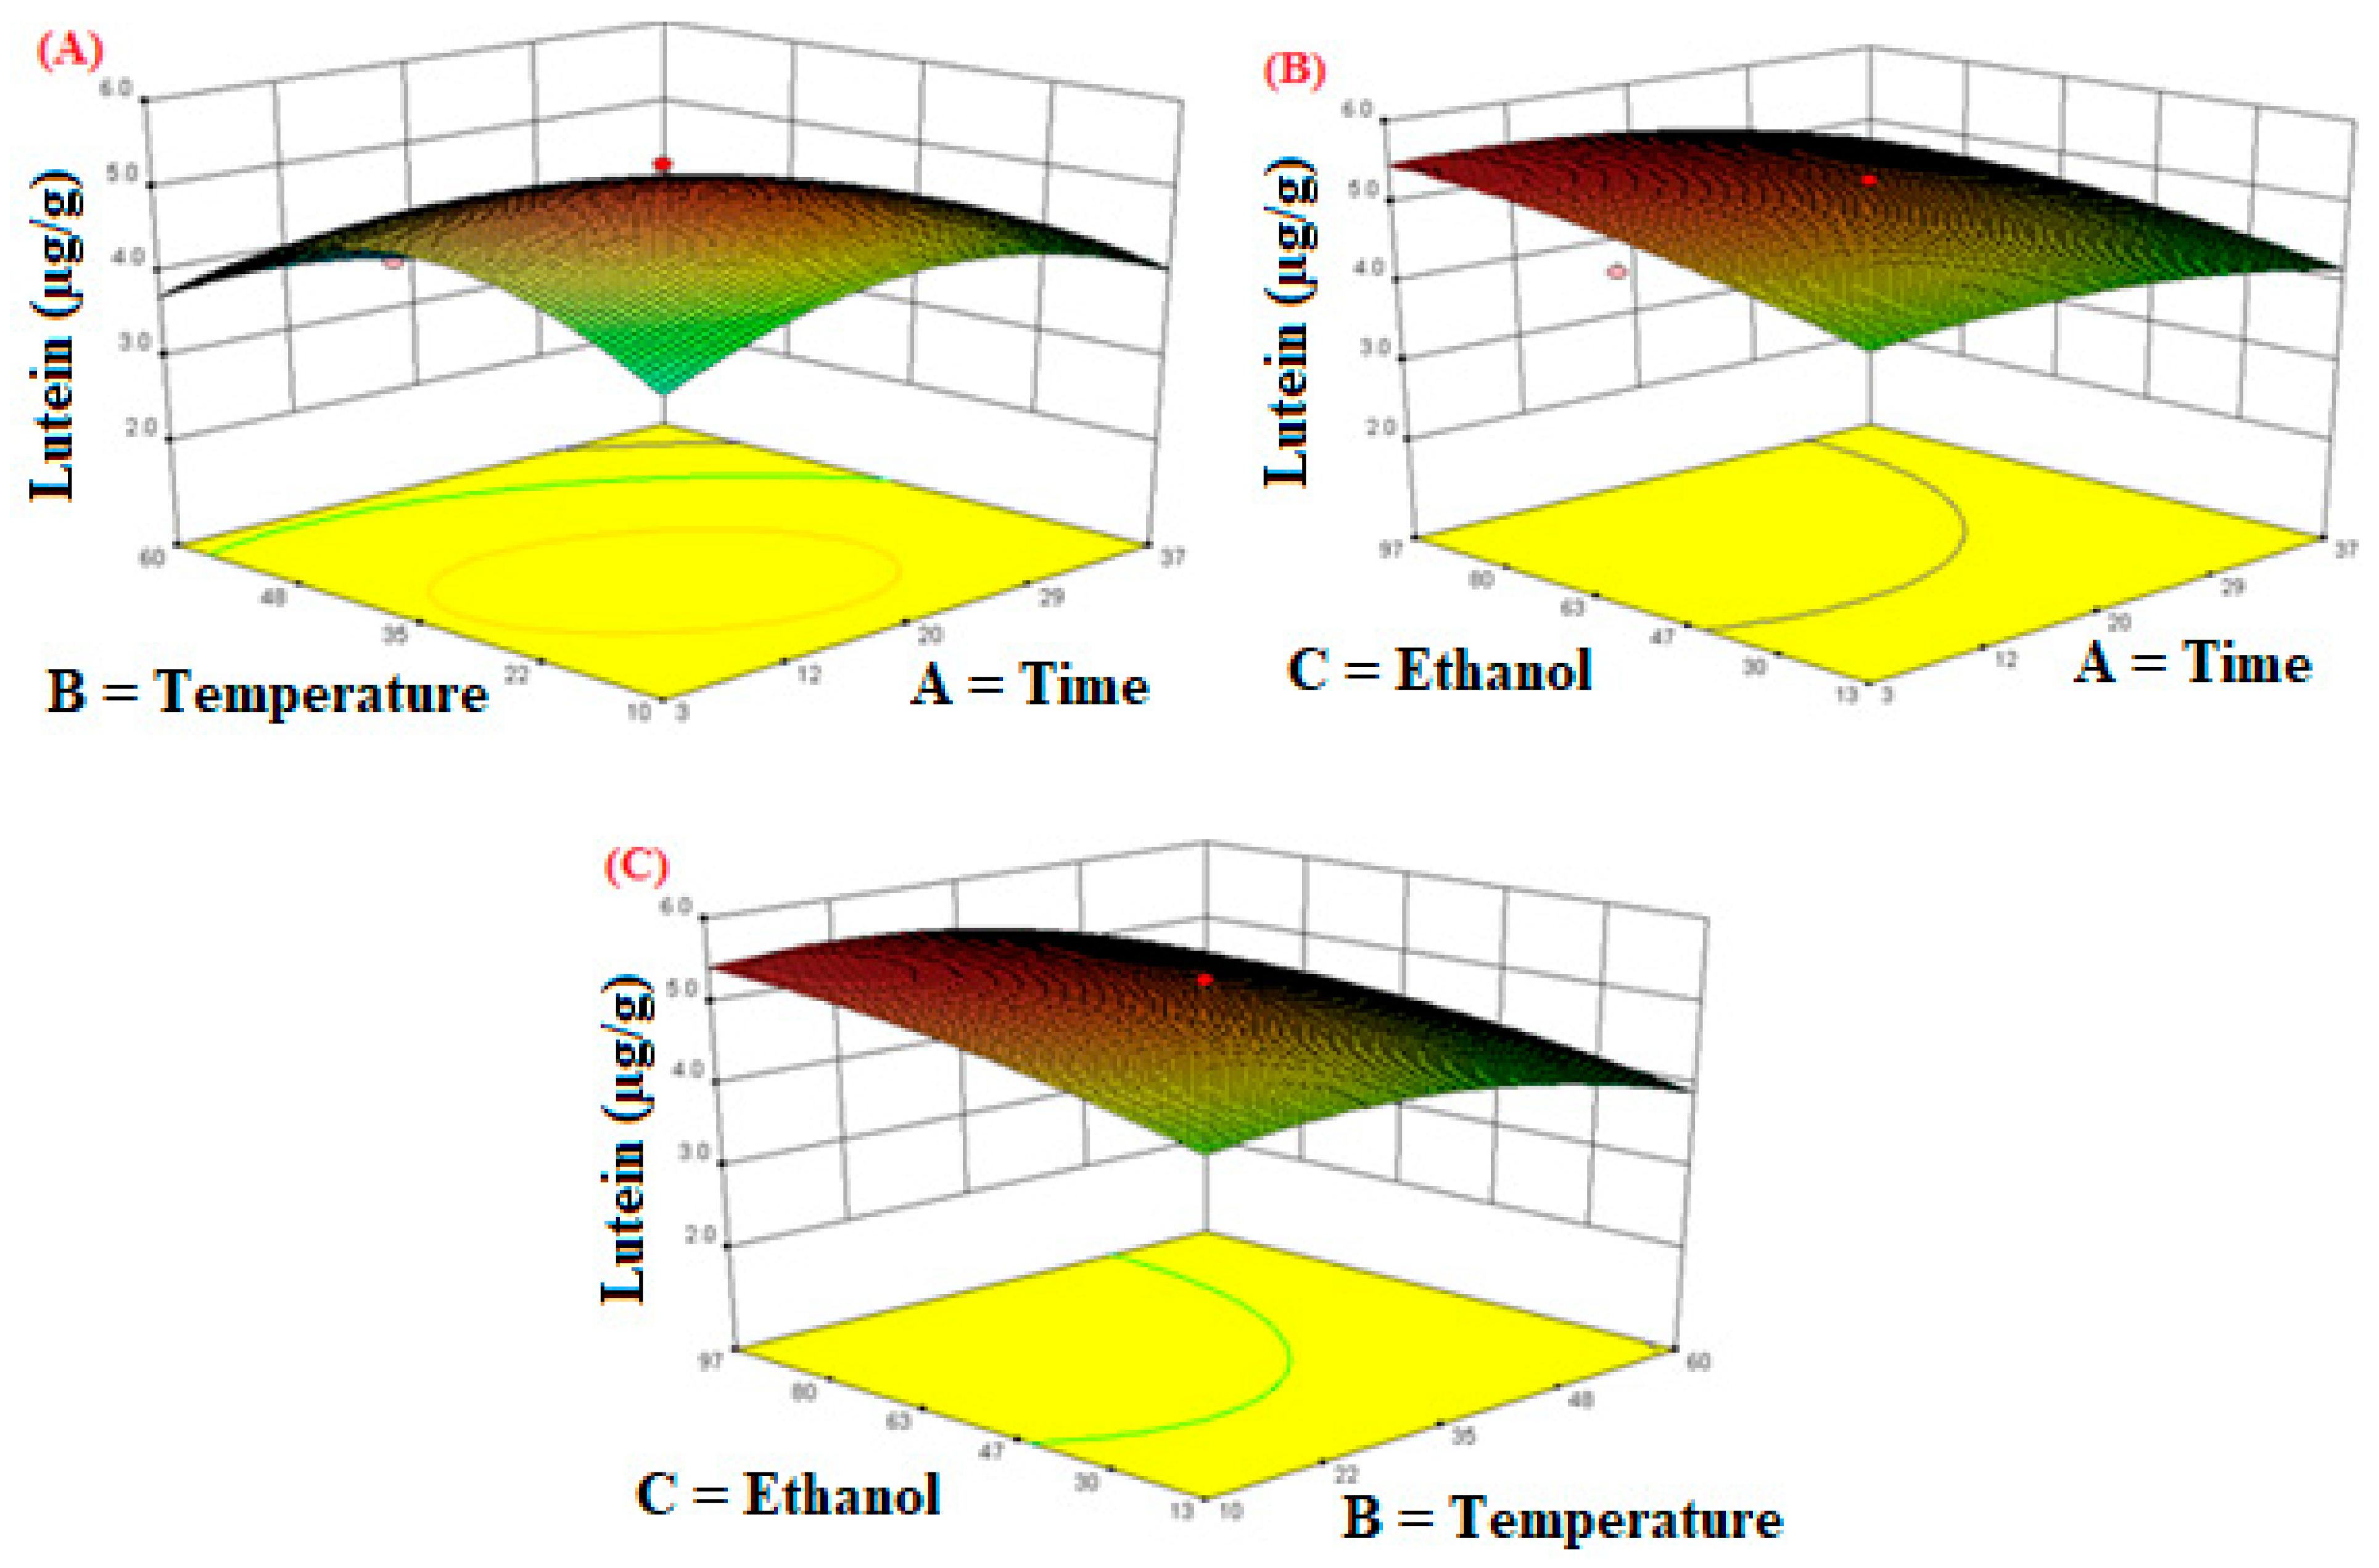
3.3.2. Lutein
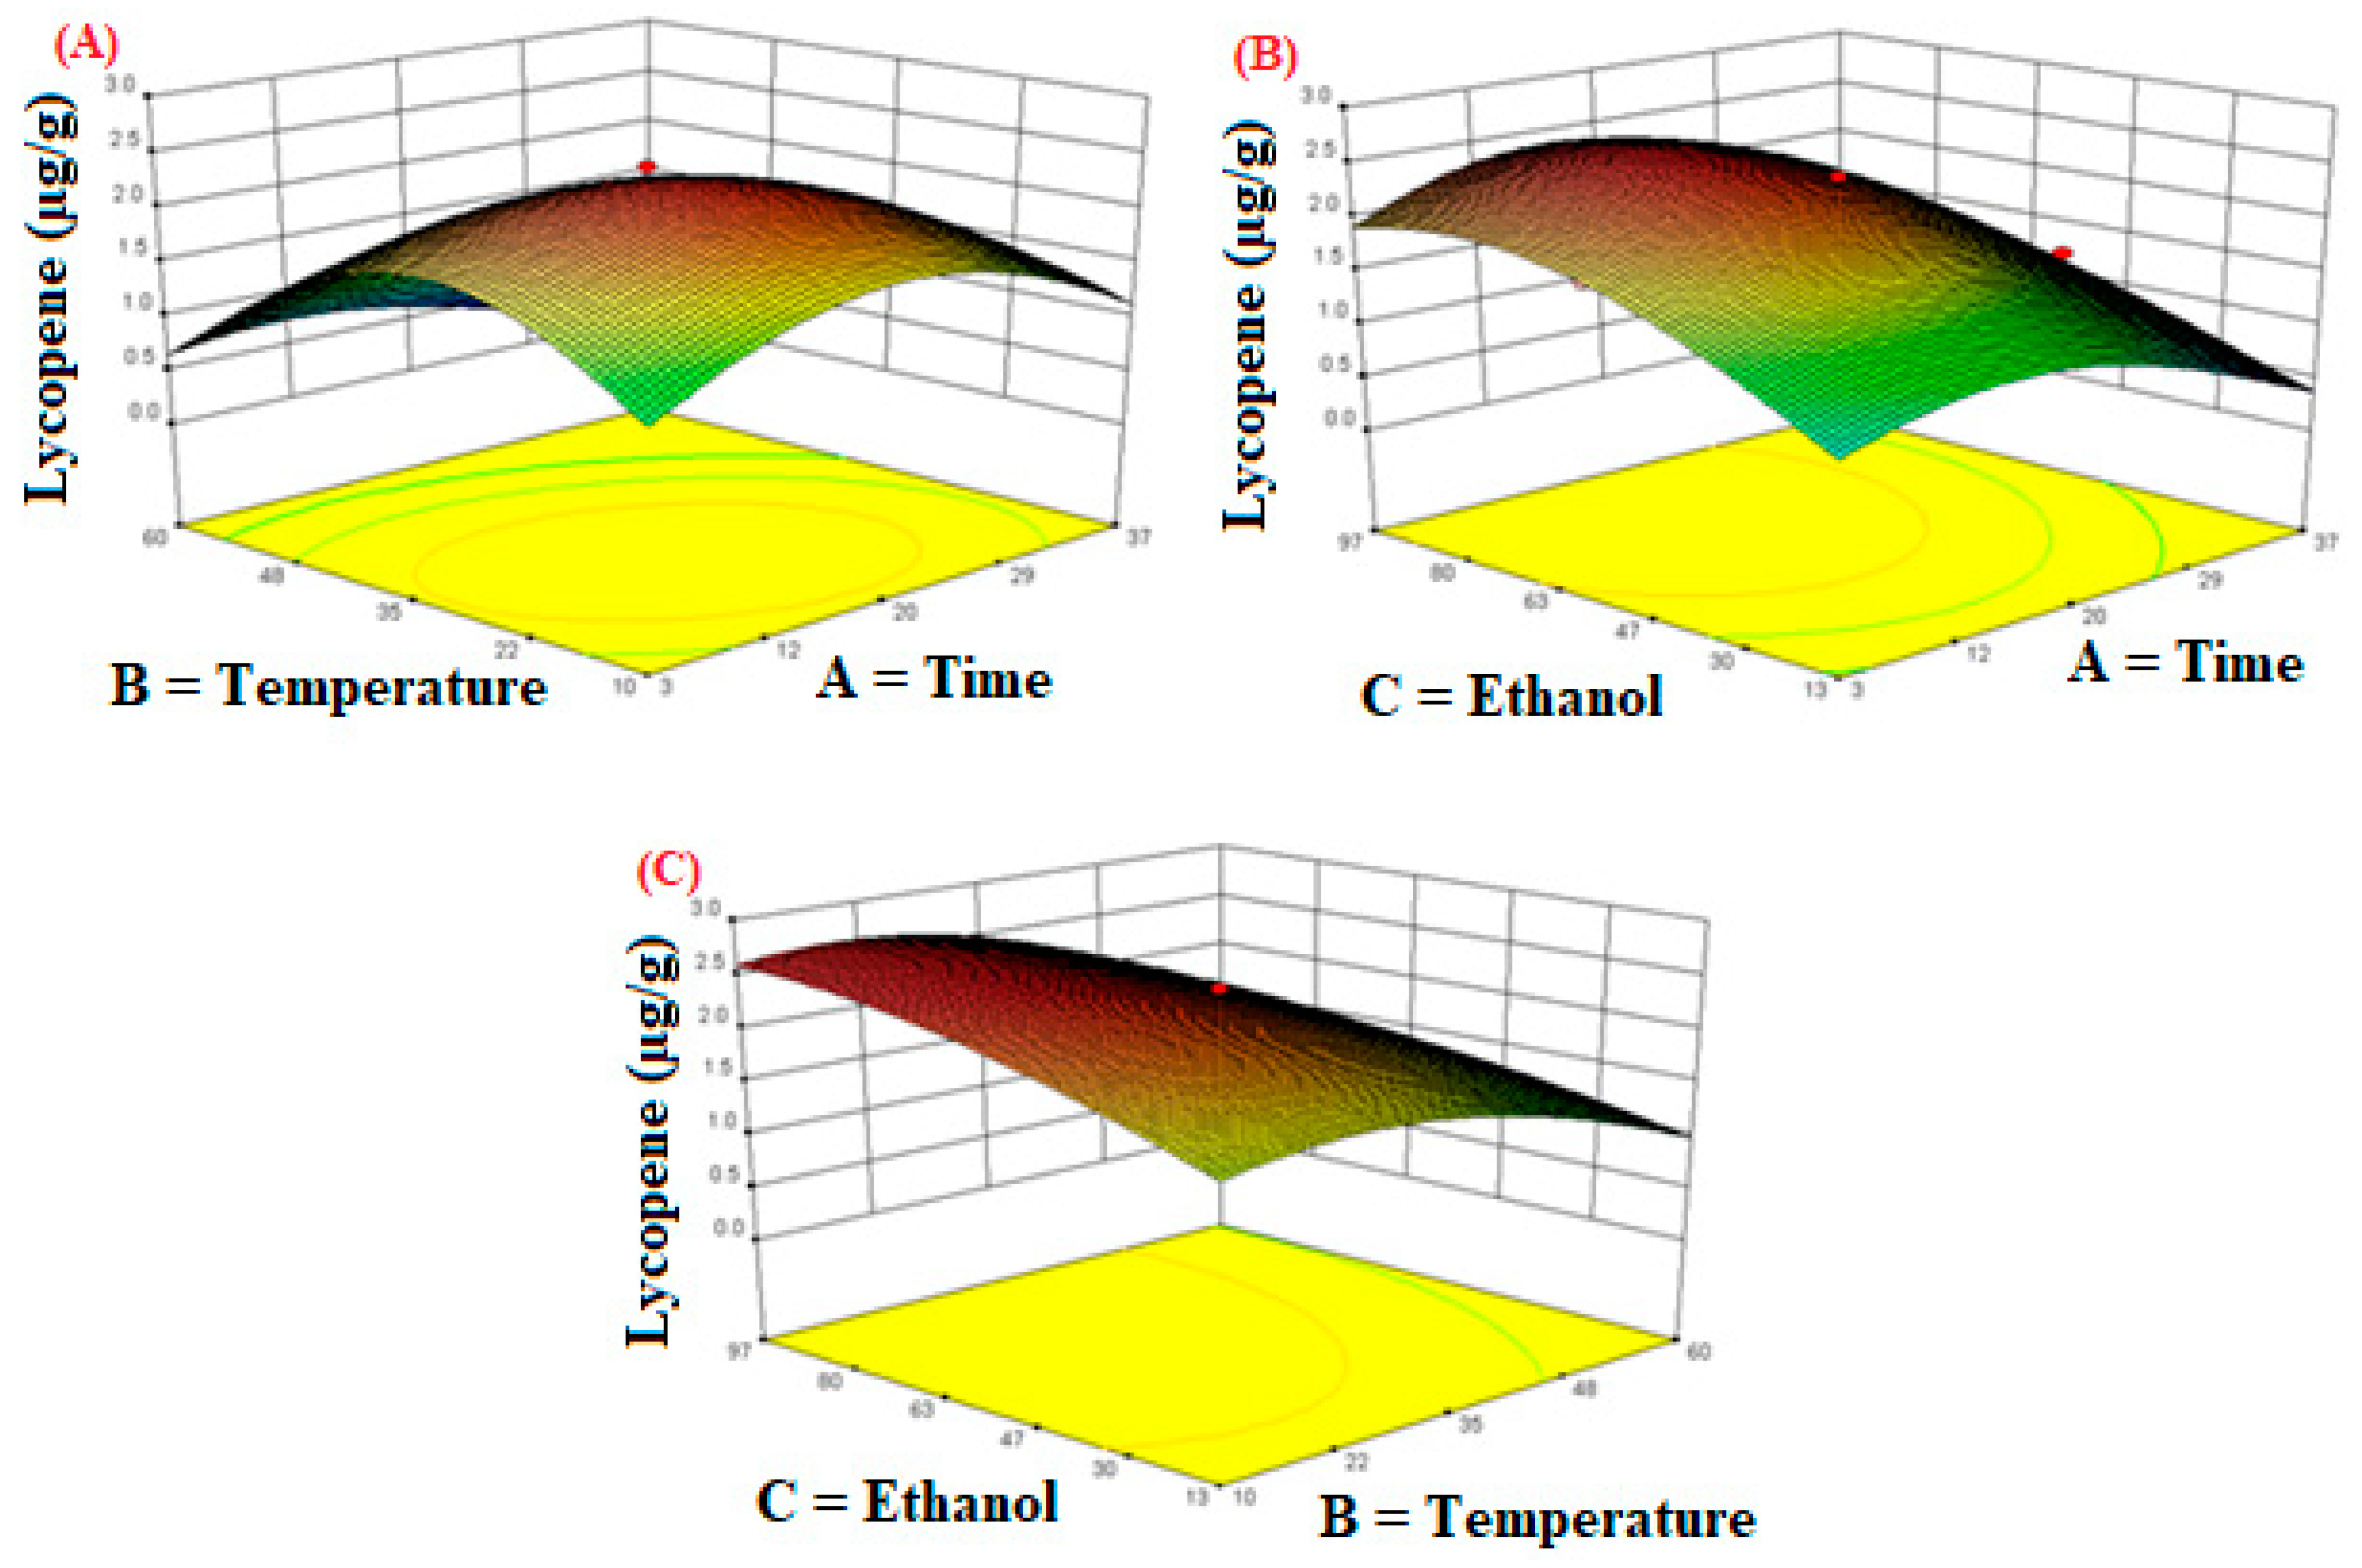
3.3.3. Lycopene
3.4. Predictive Models Verification
4. Conclusions
Author Contributions
Funding
Institutional Review Board Statement
Informed Consent Statement
Data Availability Statement
Conflicts of Interest
Sample Availability
References
- Mekouar, M.A. Food and Agriculture Organization of the United Nations (FAO). Yearb. Int. Environ. Law 2018, 29, 448–468. [Google Scholar] [CrossRef]
- Rejman, K.; Górska-Warsewicz, H.; Czeczotko, M.; Laskowski, W. Nonalcoholic Beverages as Sources of Nutrients in the Average Polish Diet. Nutrients 2020, 12, 1262. [Google Scholar] [CrossRef] [PubMed]
- Umair, M.; Jabbar, S.; Nasiru, M.M.; Senan, A.M.; Zhuang, H.; Zhang, J. Sequential Application of High-Voltage Electric Field Cold Plasma Treatment and Acid Blanching Improves the Quality of Fresh Carrot Juice (Daucus carota L.). J. Agric. Food Chem. 2020, 68, 15311–15318. [Google Scholar] [CrossRef]
- Arumugam, T.; Sona, C.L.; Maheswari, M.U. Fruits and vegetables as Superfoods: Scope and demand. J. Pharm. Innov. 2021, 10, 119–129. [Google Scholar]
- Umair, M.; Jabbar, S.; Nasiru, M.M.; Sultana, T.; Senan, A.M.; Awad, F.N.; Zhang, J. Exploring the potential of high-voltage electric field cold plasma (HVCP) using a dielectric barrier discharge (DBD) as a plasma source on the quality parameters of carrot juice. Antibiotics 2019, 8, 235. [Google Scholar] [CrossRef] [Green Version]
- Madia, V.N.; De Vita, D.; Ialongo, D.; Tudino, V.; De Leo, A.; Scipione, L.; Messore, A. Recent Advances in Recovery of Lycopene from Tomato Waste: A Potent Antioxidant with Endless Benefits. Molecules 2021, 26, 4495. [Google Scholar] [CrossRef] [PubMed]
- Agcam, E.; Akyıldız, A.; Kamat, S.; Balasubramaniam, V. Bioactive Compounds Extraction from the Black Carrot Pomace with Assistance of High Pressure Processing: An Optimization Study. Waste Biomass Valorization 2021, 12, 5959–5977. [Google Scholar] [CrossRef]
- Sharma, K.D.; Karki, S.; Thakur, N.S.; Attri, S. Chemical composition, functional properties and processing of carrot-a review. J. Food Sci. Technol. 2012, 49, 22–32. [Google Scholar] [CrossRef] [Green Version]
- Klettenhammer, S.; Ferrentino, G.; Zendehbad, S.H.; Morozova, K.; Scampicchio, M. Bioactive Compounds from Carrot Pomace as Natural Antioxidants to Enhance the Oxidative Stability of Linseed Oil Encapsulated by Particles from Gas Saturated Solutions Technique. Chem. Eng. Trans. 2021, 87, 145–150. [Google Scholar]
- Kumar, N.; Kumar, K. Development of carrot pomace and wheat flour based cookies. J. Pure Appl. Sci. Technol. 2011, 1, 5–11. [Google Scholar]
- Meléndez-Martínez, A.J.; Mapelli-Brahm, P. The undercover colorless carotenoids phytoene and phytofluene: Importance in agro-food and health in the Green Deal era and possibilities for innovation. Trends Food Sci. Technol. 2021, 116, 255–263. [Google Scholar] [CrossRef]
- Meléndez-Martínez, A.J.; Böhm, V.; Borge, G.I.A.; Cano, M.P.; Fikselová, M.; Gruskiene, R.; Brahm, P.M. Carotenoids: Considerations for Their Use in Functional Foods, Nutraceuticals, Nutricosmetics, Supplements, Botanicals, and Novel Foods in the Context of Sustainability, Circular Economy, and Climate Change. Annu. Rev. Food Sci. Technol. 2021, 12, 433–460. [Google Scholar] [CrossRef]
- Vorobyova, V.; Skiba, M.; Miliar, Y.; Frolenkova, S. Enhanced phenolic compounds extraction from apricot pomace by natural deep eutectic solvent combined with ultrasonic-assisted extraction. J. Chem. Technol. Metall. 2021, 56, 919–931. [Google Scholar]
- Picot-Allain, C.; Mahomoodally, M.F.; Ak, G.; Zengin, G. Conventional versus green extraction techniques-A comparative perspective. Curr. Opin. Food Sci. 2021, 40, 144–156. [Google Scholar] [CrossRef]
- Jabbar, S.; Abid, M.; Wu, T.; Hashim, M.M.; Saeeduddin, M.; Hu, B.; Zeng, X. Ultrasound-assisted extraction of bioactive compounds and antioxidants from carrot pomace: A response surface approach. J. Food Process. Preserv. 2015, 39, 1878–1888. [Google Scholar] [CrossRef]
- Kaur, S.; Panesar, P.S.; Chopra, H.K. Standardization of ultrasound-assisted extraction of bioactive compounds from kinnow mandarin peel. Biomass Convers. Biorefin. 2021, 1–11. [Google Scholar] [CrossRef]
- Umair, M.; Jabbar, S.; Senan, A.M.; Sultana, T.; Nasiru, M.M.; Shah, A.A.; Jianhao, Z. Influence of combined effect of ultra-sonication and high-voltage cold plasma treatment on quality parameters of carrot juice. Foods 2019, 8, 593. [Google Scholar]
- Sharma, M.; Bhat, R. Extraction of carotenoids from pumpkin peel and pulp: Comparison between innovative green extraction technologies (ultrasonic and microwave-assisted extractions using corn oil). Foods 2021, 10, 787. [Google Scholar] [CrossRef] [PubMed]
- Chen, X.; Wang, Z.; Kan, J. Polysaccharides from ginger stems and leaves: Effects of dual and triple frequency ultrasound assisted extraction on structural characteristics and biological activities. Food Biosci. 2021, 42, 101166. [Google Scholar] [CrossRef]
- Rahman, M.M.; Lamsal, B.P. Ultrasound-assisted extraction and modification of plant-based proteins: Impact on physicochemical, functional, and nutritional properties. Compr. Rev. Food Sci. Food Saf. 2021, 20, 1457–1480. [Google Scholar] [CrossRef]
- Santos, K.A.; da Silva, E.A.; da Silva, C. Ultrasound-assisted extraction of favela (Cnidoscolus quercifolius) seed oil using ethanol as a solvent. J. Food Process. Preserv. 2021, 45, e15497. [Google Scholar] [CrossRef]
- Dash, D.R.; Pathak, S.S.; Pradhan, R.C. Improvement in novel ultrasound-assisted extraction technology of high value-added components from fruit and vegetable peels. J. Food Process. Eng. 2021, 44, e13658. [Google Scholar] [CrossRef]
- Liu, Y.; Liu, H.-Y.; Xia, Y.; Guo, H.; He, X.-Q.; Li, H.; Li, H.-B. Screening and process optimization of ultrasound-assisted extraction of main antioxidants from sweet tea (Lithocarpus litseifolius [Hance] Chun). Food Biosci. 2021, 43, 101277. [Google Scholar] [CrossRef]
- Vilkhu, K.; Mawson, R.; Simons, L.; Bates, D. Applications and opportunities for ultrasound assisted extraction in the food industry—A review. Innov. Food Sci. Emerg. Technol. 2008, 9, 161–169. [Google Scholar] [CrossRef]
- Wen, C.; Zhang, J.; Zhang, H.; Dzah, C.S.; Zandile, M.; Duan, Y.; Luo, X. Advances in ultrasound assisted extraction of bioactive compounds from cash crops—A review. Ultrason. Sonochem. 2018, 48, 538–549. [Google Scholar] [CrossRef]
- Gundupalli, M.P.; Bhattacharyya, D. Effect of different mineral acids on coconut coir for recovery of reducing Sugar: Process optimization using response surface Methodology (RSM). Mater. Today Proc. 2021. [Google Scholar] [CrossRef]
- Pais-Chanfrau, J.M.; Núñez-Pérez, J.; del Carmen Espin-Valladares, R.; Lara-Fiallos, M.V.; Trujillo-Toledo, L.E. Uses of the Response Surface Methodology for the Optimization of Agro-Industrial Processes; IntechOpen: London, UK, 2021. [Google Scholar] [CrossRef]
- Salehi, L.; Dinani, S.T. Application of electrohydrodynamic ultrasonic procedure for extraction of β-carotene from carrot pomace. J. Food Meas. Charact. 2020, 14, 3031–3039. [Google Scholar] [CrossRef]
- Tiwari, S.; Upadhyay, N.; Singh, A.K.; Meena, G.S.; Arora, S. Organic solvent-free extraction of carotenoids from carrot bio-waste and its physico-chemical properties. J. Food Sci. Technol. 2019, 56, 4678–4687. [Google Scholar] [CrossRef]
- Jayesree, N.; Hang, P.K.; Priyangaa, A.; Krishnamurthy, N.P.; Ramanan, R.N.; Turki, M.A.; Ooi, C.W. Valorisation of carrot peel waste by water-induced hydrocolloidal complexation for extraction of carote and pectin. Chemosphere 2021, 272, 129919. [Google Scholar] [CrossRef]
- Elik, A.; Yanık, D.K.; Göğüş, F. Microwave-assisted extraction of carotenoids from carrot juice processing waste using flaxseed oil as a solvent. LWT-Food Sci. Technol. 2020, 123, 109100. [Google Scholar] [CrossRef]
- Hiranvarachat, B.; Devahastin, S. Enhancement of microwave-assisted extraction via intermittent radiation: Extraction of carotenoids from carrot peels. J. Food Eng. 2014, 126, 17–26. [Google Scholar] [CrossRef]
- Nowacka, M.; Wedzik, M. Effect of ultrasound treatment on microstructure, colour and carotenoid content in fresh and dried carrot tissue. Appl. Acoust. 2016, 103, 163–171. [Google Scholar] [CrossRef]
- de Andrade Lima, M.; Charalampopoulos, D.; Chatzifragkou, A. Optimisation and modelling of supercritical CO2 extraction process of carotenoids from carrot peels. J. Supercrit. Fluids 2018, 133, 94–102. [Google Scholar] [CrossRef]
- Pataro, G.; Carullo, D.; Falcone, M.; Ferrari, G. Recovery of lycopene from industrially derived tomato processing by-products by pulsed electric fields-assisted extraction. Innov. Food Sci. Emerg. Technol. 2020, 63, 102369. [Google Scholar] [CrossRef]
- Roohinejad, S.; Everett, D.W.; Oey, I. Effect of pulsed electric field processing on carotenoid extractability of carrot purée. Int. J. Food Sci. 2014, 49, 2120–2127. [Google Scholar] [CrossRef]
- Roohinejad, S.; Oey, I.; Everett, D.W.; Niven, B.E. Evaluating the effectiveness of β-carotene extraction from pulsed electric field-treated carrot pomace using oil-in-water microemulsion. Food Bioprocess. Technol. 2014, 7, 3336–3348. [Google Scholar] [CrossRef]
- Tow, W.W.; Premier, R.; Jing, H.; Ajlouni, S. Antioxidant and antiproliferation effects of extractable and nonextractable polyphenols isolated from apple waste using different extraction methods. J. Food Sci. 2011, 76, T163–T172. [Google Scholar] [CrossRef] [PubMed]
- Jabbar, S.; Abid, M.; Hu, B.; Wu, T.; Hashim, M.M.; Lei, S.; Zeng, X. Quality of carrot juice as influenced by blanching and sonication treatments. LWT-Food Sci. Technol. 2014, 55, 16–21. [Google Scholar] [CrossRef]
- Liao, H.; Sun, Y.; Ni, Y.; Liao, X.; Hu, X.; Wu, J.; Chen, F. The effect of enzymatic mash treatment, pressing, centrifugation, homogenization, deaeration, sterilization and storage on carrot juice. J. Food Process. Eng. 2007, 30, 421–435. [Google Scholar] [CrossRef]
- Kim, H.Y.; Gerber, L.E. Influence of processing on quality of carrot juice. Korean J. Food Sci. Technol. 1988, 20, 683–690. [Google Scholar]
- Oliu, G.O.; Serrano, I.O.; Fortuny, R.S.; Belloso, O.M. Effects of high-intensity pulsed electric field processing conditions on lycopene, vitamin C and antioxidant capacity of watermelon juice. Food Chem. 2009, 115, 1312–1319. [Google Scholar] [CrossRef]
- Sun, Y.; Liu, D.; Chen, J.; Ye, X.; Yu, D. Effects of different factors of ultrasound treatment on the extraction yield of the all-trans-β-carotene from citrus peels. Ultrason. Sonochem. 2011, 18, 243–249. [Google Scholar] [CrossRef] [PubMed]
- Capelo, J.L.; Maduro, C.; Vilhena, C. Discussion of parameters associated with the ultrasonic solid-liquid extraction for elemental analysis (total content) by electrothermal atomic absorption spectrometry. An overview. Ultrason. Sonochem. 2005, 12, 225–232. [Google Scholar] [CrossRef] [PubMed]
- Romdhane, M.; Gourdon, C. Investigation in solid-liquid extraction: Influence of ultrasound. Chem. Eng. Sci. 2002, 87, 11–19. [Google Scholar] [CrossRef]
- Sánchez-Moreno, C.; Plaza, L.; De Ancos, B.; Cano, M.P. Impact of high-pressure and traditional thermal processing of tomato purée on carotenoids, vitamin C and antioxidant activity. J. Sci. Food Agric. 2006, 86, 171–179. [Google Scholar] [CrossRef]
- Corrales, M.; García, A.F.; Butz, P.; Tauscher, B. Extraction of anthocyanins from grape skins assisted by high hydrostatic pressure. J. Food Eng. 2009, 90, 415–421. [Google Scholar] [CrossRef]
- Paniwnyk, L.; Beaufoy, E.; Lorimer, J.; Mason, T. The extraction of rutin from flower buds of Sophora japonica. Ultrason. Sonochem. 2001, 8, 299–301. [Google Scholar] [CrossRef]
- Wang, L.; Weller, C.L. Recent advances in extraction of nutraceuticals from plants. Trends Food Sci. Technol. 2006, 17, 300–312. [Google Scholar] [CrossRef]
- Entezari, M.H.; Kruus, P. Effect of frequency on sonochemical reactions II. Temperature and intensity effects. Ultrason. Sonochem. 1996, 3, 19–24. [Google Scholar] [CrossRef]
- Rawson, A.; Tiwari, B.; Patras, A.; Brunton, N.; Brennan, C.; Cullen, P.; O’Donnell, C. Effect of thermosonication on bioactive compounds in watermelon juice. Food Res. Int. 2011, 44, 1168–1173. [Google Scholar] [CrossRef]
- Shi, J.; Maguer, M.L. Lycopene in tomatoes: Chemical and physical properties affected by food processing. Crit. Rev. Food Sci. Nutr. 2000, 40, 1–42. [Google Scholar] [CrossRef] [PubMed]
- Cole, E.; Kapur, N. The stability of lycopene I-Degradation by oxygen. J. Sci. Food Agric. 1957, 8, 360–365. [Google Scholar] [CrossRef]
- Cole, E.; Kapur, N. The stability of lycopene II-Oxidation during heating of tomato pulps. J. Sci. Food Agric. 1957, 8, 366–368. [Google Scholar] [CrossRef]
- Butz, P.; Edenharder, R.; García, A.F.; Fister, H.; Merkel, C.; Tauscher, B. Changes in functional properties of vegetables induced by high pressure treatment. Int. Food Res. J. 2002, 35, 295–300. [Google Scholar] [CrossRef]


| Extraction Method | Waste Material | Compounds Recovered | Conclusion | References |
|---|---|---|---|---|
| Water-induced hydrocolloidal complexation for extraction | Carrot Peel | β-carotene | The adaptability of the carotene–pectin hydrocolloidal complexation in the extraction of carotene from carrot peel waste was proven to be successful. The complexation process requires no organic solvent and relies on water addition to induce the formation of hydrocolloidal system. The purity of b-carotene fractionated from the complex is identical to the b-carotene extracted using solvent extraction, which was 96%. | [30] |
| Microwave-assisted extraction | Carrot pomace and peel | Total carotenoids, β-carotene content | A 77.48% recovery of carotenoid was achieved successfully at optimum conditions (165 W of microwave power, 9.39 min of extraction time, and 8.06:1 g/g of oil-to-waste ratio); hence the carotenoid extraction by using oil under microwave irradiation is a promising process. The use of intermittent microwave radiation to enhance the MAE of b-carotene and carotenoids from carrot peels was investigated. Combined use of lower microwave power (180 W) and solvent volume (75 mL) or higher microwave power (300 W) and solvent volume (150 mL) along with a lower intermittency ratio (a = 1/4) resulted in higher contents of b-carotene and total carotenoids of the extracts | [31,32] |
| Electrohydrodynamic-ultrasonic procedure for extraction | Carrot pomace | β-carotene | In this research, the influence of the EHD process before the ultrasonic process for β-carotene extraction from carrot pomace powder was investigated. The results showed that increasing the EHD time from 2.5 to 20 min increased the β-carotene concentration. | [28] |
| Ultrasound treatment | Carrot slice | Total carotenoids | The changes in carrot tissue caused by ultrasound treatment had an impact on total carotenoid content and color changing. Ultrasonic treatment, especially in the case of using ultrasound at 35 kHz, resulted in a substantial increase in carotenoids content in comparison to raw carrot, which was probably related to the destruction of the original cellular structure and could facilitate the extraction of these compounds. | [33] |
| Supercritical CO2 extraction process | Carrot peel | Total carotenoids | This work aimed to assess and optimize the extraction of carotenoids from carrot peels by supercritical CO2 (SCO2), utilizing ethanol as a co-solvent. The evaluated variables were temperature, pressure and co-solvent concentration. According to the validated model, the optimal conditions for maximum mass yield (5.31%, d.b.) were found at 58.5 °C, 306 bar, and 14.3% of ethanol, and at 59.0 °C, 349 bar, and 15.5% ethanol for carotenoid recovery (86.1%). | [34] |
| Pulsed electric field | Carrot puree Carrot pomace Tomato peel | Total carotenoids, β-carotene, lycopene | This study shows the feasibility of using PEF treatment to develop functional natural food ingredients, for example, carrot pomace with improved carotenoid extractability. Electroporation due to PEF treatment can be used to improve the extractability of carotenoids in carrot pomace with limited loss of carotenoids into the juice during extraction. The suitable extraction conditions were obtained at extraction time 49.4 min, extraction temperature 52.2 °C, and extraction ratio 1:70 (w/w). Under these conditions, the response variables were predicted to be 19.6 μg/g, 0.27, and 74 nm for β-carotene content. The results of this work demonstrated that the application of PEF pre-treatment of moderate intensity (5 kV/cm) and relatively low energy input (5 kJ/kg) before solvent extraction process with either acetone or ethyl lactate, can represent a sustainable, environmentally friendly, and food safety approach to intensify the extractability of carotenoids, especially lycopene, from industrial tomato peels residues. | [35,36,37] |
| Symbols | Independent Parameters | Units | Low Level | Mid Level | High Level |
|---|---|---|---|---|---|
| A | Time | Min | 03 | 20 | 37 |
| B | Temperature | °C | 10 | 35 | 60 |
| C | Ethanol | % | 13 | 55 | 97 |
| Run | A (Min) | B (°C) | C (%) | Total Carotenoids | β-Carotene | Lutein | Lycopene |
|---|---|---|---|---|---|---|---|
| 1 | 3.00 | 35.00 | 55.00 | 26.60 | 13.20 | 4.77 | 1.87 |
| 2 | 10.00 | 20.00 | 80.00 | 19.58 | 9.57 | 5.41 | 2.50 |
| 3 | 20.00 | 35.00 | 55.00 | 32.63 | 13.79 | 5.27 | 2.38 |
| 4 | 10.00 | 50.00 | 30.00 | 19.67 | 9.65 | 4.00 | 1.10 |
| 5 | 10.00 | 20.00 | 30.00 | 22.53 | 12.26 | 4.44 | 1.54 |
| 6 | 20.00 | 10.00 | 55.00 | 24.52 | 12.29 | 4.61 | 1.71 |
| 7 | 20.00 | 35.00 | 13.00 | 20.90 | 8.23 | 4.06 | 1.17 |
| 8 | 20.00 | 35.00 | 55.00 | 29.34 | 13.57 | 5.14 | 2.25 |
| 9 | 37.00 | 35.00 | 55.00 | 18.78 | 9.30 | 4.12 | 1.22 |
| 10 | 30.00 | 20.00 | 80.00 | 17.65 | 9.19 | 5.01 | 2.11 |
| 11 | 30.00 | 20.00 | 30.00 | 21.79 | 11.32 | 4.25 | 1.36 |
| 12 | 30.00 | 50.00 | 30.00 | 15.76 | 7.28 | 3.36 | 0.46 |
| 13 | 20.00 | 35.00 | 97.00 | 14.11 | 5.24 | 5.29 | 2.40 |
| 14 | 20.00 | 35.00 | 55.00 | 32.14 | 14.80 | 5.05 | 2.16 |
| 15 | 30.00 | 50.00 | 80.00 | 11.53 | 6.16 | 3.75 | 0.85 |
| 16 | 20.00 | 60.00 | 55.00 | 18.10 | 8.20 | 3.60 | 0.70 |
| 17 | 10.00 | 50.00 | 80.00 | 22.07 | 9.02 | 4.86 | 1.46 |
| Source | Total Carotenoids | β-Carotene | Lutein | Lycopene |
|---|---|---|---|---|
| γ0 | −0.0786 b | 1.1602 a | 1.2015 a | −0.2010 a |
| A | 0.1759 b | 0.0606 a | 0.0294 a | 0.0431 b |
| B | 0.1203 c | 0.0498 a | 0.0279 a | 0.0494 a |
| C | 0.0911 c | 0.0605 b | 0.0128 a | 0.0205 a |
| AB | −0.0012 d | −0.0006 c | −0.0003 c | −0.0004 d |
| AC | −0.0005 NSa | 0.0000 NSb | −0.0001 NSb | 0.0000 NSb |
| BC | 0.0002 NSb | 0.0001 NSa | 0.0000 NSb | −0.0001 NSb |
| A2 | −0.0033 b | −0.0013 b | −0.0006 b | −0.0010 b |
| B2 | −0.0017 b | −0.0008 a | −0.0004 a | −0.0007 a |
| C2 | −0.0009 a | −0.0006 a | −0.0001 c | −0.0001 c |
| p-Value | 0.0002 | <0.0001 | <0.0001 | <0.0001 |
| F-Value | 25.08 | 68.51 | 54.93 | 39.76 |
| R2 | 0.9699 | 0.9888 | 0.9860 | 0.9808 |
| Adj. R2 | 0.9313 | 0.9743 | 0.9681 | 0.9561 |
| Lack-of-fit | 0.5306 NSb | 0.7477 NSb | 0.4764 NSb | 0.2664 NSb |
| Response Variables | Optimum Extraction Conditions | Maximum Value (μg/g) | |||
|---|---|---|---|---|---|
| Time (Min) | Temp (°C) | Ethanol (%) | Predicted | Experimental a | |
| Total carotenoids | 17 | 32 | 51 | 32.20 | 31.82 ± 0.55 |
| β-carotene | 16 | 29 | 59 | 14.37 | 14.89 ± 0.40 |
| Lutein | 16 | 29 | 59 | 5.35 | 5.77 ± 0.19 |
| Lycopene | 16 | 29 | 59 | 2.50 | 2.65 ± 0.12 |
Publisher’s Note: MDPI stays neutral with regard to jurisdictional claims in published maps and institutional affiliations. |
© 2021 by the authors. Licensee MDPI, Basel, Switzerland. This article is an open access article distributed under the terms and conditions of the Creative Commons Attribution (CC BY) license (https://creativecommons.org/licenses/by/4.0/).
Share and Cite
Umair, M.; Jabbar, S.; Nasiru, M.M.; Lu, Z.; Zhang, J.; Abid, M.; Murtaza, M.A.; Kieliszek, M.; Zhao, L. Ultrasound-Assisted Extraction of Carotenoids from Carrot Pomace and Their Optimization through Response Surface Methodology. Molecules 2021, 26, 6763. https://0-doi-org.brum.beds.ac.uk/10.3390/molecules26226763
Umair M, Jabbar S, Nasiru MM, Lu Z, Zhang J, Abid M, Murtaza MA, Kieliszek M, Zhao L. Ultrasound-Assisted Extraction of Carotenoids from Carrot Pomace and Their Optimization through Response Surface Methodology. Molecules. 2021; 26(22):6763. https://0-doi-org.brum.beds.ac.uk/10.3390/molecules26226763
Chicago/Turabian StyleUmair, Muhammad, Saqib Jabbar, Mustapha M. Nasiru, Zhaoxin Lu, Jianhao Zhang, Muhammad Abid, Mian Anjum Murtaza, Marek Kieliszek, and Liqing Zhao. 2021. "Ultrasound-Assisted Extraction of Carotenoids from Carrot Pomace and Their Optimization through Response Surface Methodology" Molecules 26, no. 22: 6763. https://0-doi-org.brum.beds.ac.uk/10.3390/molecules26226763