Article

Synthesis, Structural Characterization, and In Vitro and In Silico Antifungal Evaluation of Azo-Azomethine Pyrazoles (PhN2(PhOH)CHN(C3N2(CH3)3)PhR, R = H or NO2)

by
Dorancelly Fernandez
1,
Andrés Restrepo-Acevedo
2,
Cristian Rocha-Roa
3,4,
Ronan Le Lagadec
2,
Rodrigo Abonia
5,
Susana A. Zacchino
6,
Jovanny A. Gómez Castaño
7,* and
Fernando Cuenú-Cabezas
1,*
1
Laboratorio de Química Inorgánica y Catálisis, Programa de Química, Universidad del Quindío, Carrera 15, Calle 12 Norte, Armenia 630004, Colombia
2
Instituto de Química UNAM, Circuito Exterior s/n, Ciudad Universitaria, Ciudad de México 04510, Mexico
3
Grupo GEPAMOL, Centro de Investigaciones Biomédicas, Universidad del Quindío, Carrera 15, Calle 12 Norte, Armenia 630004, Colombia
4
Biophysics of Tropical Diseases, Max Planck Tandem Group, Universidad de Antioquia, Medellín 050010, Colombia
5
Departamento de Química, Universidad del Valle, Calle 13 No. 100-00, A.A. 25360, Cali 76001, Colombia
6
Área Farmacognosia, Facultad de Ciencias Bioquímicas y Farmacéuticas, Universidad Nacional de Rosario (UNR), Suipacha 531, Rosario S2002LRK, Argentina
7
Grupo Química-Física Molecular y Modelamiento Computacional (QUIMOL®), Facultad de Ciencias, Universidad Pedagógica y Tecnológica de Colombia (UPTC), Avenida Central del Norte, Tunja, Boyacá 050030, Colombia
*
Authors to whom correspondence should be addressed.
Submission received: 15 October 2021 / Revised: 23 November 2021 / Accepted: 24 November 2021 / Published: 8 December 2021
(This article belongs to the Special Issue The Chemistry of Imines)

Abstract

:
The azo-azomethine imines, R1-N=N-R2-CH=N-R3, are a class of active pharmacological ligands that have been prominent antifungal, antibacterial, and antitumor agents. In this study, four new azo-azomethines, R1 = Ph, R2 = phenol, and R3 = pyrazol-Ph-R’ (R = H or NO2), have been synthesized, structurally characterized using X-ray, IR, NMR and UV–Vis techniques, and their antifungal activity evaluated against certified strains of Candida albicans and Cryptococcus neoformans. The antifungal tests revealed a high to moderate inhibitory activity towards both strains, which is regulated as a function of both the presence and the location of the nitro group in the aromatic ring of the series. These biological assays were further complemented with molecular docking studies against three different molecular targets from each fungus strain. Molecular dynamics simulations and binding free energy calculations were performed on the two best molecular docking results for each fungus strain. Better affinity for active sites for nitro compounds at the “meta” and “para” positions was found, making them promising building blocks for the development of new Schiff bases with high antifungal activity.

1. Introduction

Azomethine compounds (Schiff bases), with the general formula RHC=NR’, are highly relevant ligands in pharmaceutical and medical chemistry. These structures are recognized for their high anticancer, antifungal, antiparasitic, antitubercular, cytotoxic, and herbicidal characteristics [1,2,3,4]. The substitution of the R and R′ groups with functionalized aromatic or heterocyclic moieties has been shown to be a promising pharmacological strategy to enhance the biological activity of azomethine ligands as anti-inflammatory [5], antitumor [6,7], antimicrobial [8], antidiabetic [9], antileishmaniacic [10], and antitubercular [11] agents, among others [12,13].
R′ substituted azomethine derivatives with functionalized pyrazole rings have revealed both potent and varied biological activities. Compounds such as 2- and 4-[(5-Methyl-2,4-diphenyl-2H-pyrazol-3-ylimino)-methyl]-phenol (structures (a) and (b) in Figure 1), have been evaluated as ligands in more than 700 biological assays each [14,15]. These compounds were revealed to have antileishmaniasis and antibacterial characteristics, inhibitors of CHOP to regulate the unfolded protein response to ER stress, binders of estrogen receptors, antagonist of Human D1 Dopamine Receptor: qHTS, molecule activators of BRCA1 expression, and inhibitors of KCNQ1 potassium channels, among others. Likewise, the compound 2-[(E)-(2-Phenylpyrazol-3-yl)iminomethyl]phenol (structure (c) in Figure 1), has been evaluated in multiple bioassays, thus identifying it as a potent inhibitor of the TEAD-YAP interaction [16]. Meanwhile, the reduced R-NR″-C3H2N2-Ph azomethine analogs (R = (HOPh)(Me)2- or CH2CHCH2-(PhOH)-, and R″ = H or Me, structures (d) and (e) in Figure 1) are well known to be effective anti-inflammatory agents [17,18].
One of the most promising biological applications of azomethine pyrazole derivatives, as well as their azo analogs, has been their fungicidal activity. In this regard, Sreenivasa et al. recently carried out the synthesis of new Schiff bases by coupling a pyrazole nucleus through azomethine linkage with different aromatic amines [19]. The synthesized compounds were tested in vitro against C. albicans strains, showing significant antifungal activity compared to the standard drug fluconazole, especially for derivatives prepared from aromatic amines substituted with nitro groups in the para and meta positions (structure (a) in Figure 2). On the other hand, Al-Azmi recently synthesized a series of novel azopyrazole carbonitrile derivatives (structure (b) in Figure 2) which showed antifungal activities against C. albicans strains when the reference drug cycloheximide failed to do so with a concentration of 1 mg mL−1 [20]. Likewise, high antifungal effects have been reported against strains of C. albicans and C. glabrata for heterocyclic disazo dyes based on dipirazole rings, with electron-acceptor and electron-donor groups in their ortho, meta and para positions, (structure (c) in Figure 2) [21]. These dyes had a fungicidal effect like fluconazole against C. albicans strains and showed a lower active concentration than fluconazole against C. glabrata strains. Additionally, some Schiff bases of pyrazole-pyridine, pyrazole-thiophene and pyrazole-phenyl (structure (d) in Figure 2) have revealed effective antifungal activities against strains of Aspergillus mold species [22].
Due to the effective antifungal activity detected both for azomethine compounds containing pyrazole rings substituted with nitrated aromatics and for their azo derivatives [19,20,21,22], we have decided to design new Schiff bases constructed by assembling azo fragments functionalized with aromatic groups and aromatic pyrazoles substituted in ortho, meta or para positions by nitro groups. Therefore, this study has resulted in the synthesis, structural characterization (XRD, GC-MS, NMR, IR, and UV–Vis), and antifungal evaluation of four novel azo-pyrazole-azomethines with the general formula R-(PhOH)-(H)C=N-((C3HN2)(tert-butyl)(R’)) with R = Ph-N=N- and R′ = Ph- or -Ph-NO2 in the search for new azomethine Schiff bases derivatives [23,24]. Biological tests were performed against certified strains of Candida albicans (ATCC 10231) and Cryptococcus neoformans (ATCC 32264). Additionally, the antifungal assays were complemented with in silico studies using different target macromolecules.

2. Results and Discussion

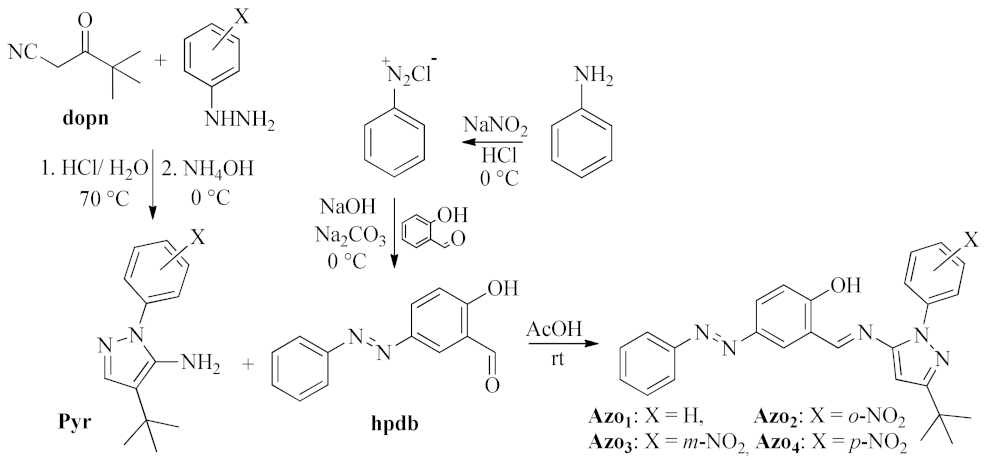
2.1. Synthesis and Molecular Identification

The new family of azo-pyrazole-azomethines derivatives (Schiff bases), labeled as Azo1 to Azo4 (Figure 3), were synthesized and resulted in a good yield (75–89%) using a simple and environmentally friendly technique that consisted of the direct condensation of pyrazole-amines (Pyr1 to Pyr4) and (E)-2-hydroxy-4-(phenyldiazenyl)benzaldehyde (hpdb) and mechanical maceration. Their molecular formula (C26H25N5O for Azo1 and C26H24N6O3 for Azo2 to Azo4) were initially identified by elemental analysis (Section 3.1.3) and further confirmed by GC–MS spectrometry. The mass fragmentation spectra and fragmentation patterns for compounds Azo1 to Azo4 are presented in the Supplementary Materials (see Figures S1–S5).

2.2. Spectroscopy Characterization

2.2.1. Fourier Transform Infrared (FTIR) Spectroscopy

The experimental and theoretical IR spectra of compounds Azo1 to Azo4 are presented in Figure S6 in the Supplementary Materials, while the corresponding vibrational frequencies are listed and assigned in Table 1. High correlation coefficients (R2) of 0.990 (Azo1), 0.998 (Azo2), 0.997 (Azo3), and 0.998 (Azo4) were obtained from the linear correlation curves between the calculated and experimental frequencies (see Figure S7 in Supplementary Materials). As can be observed in Table 1 and Figure S6, the O-H stretching mode was observable only in the IR spectrum of the Azo1 compound, as a low intensity band centered at 3440 cm−1. According to our spectroscopic results (FT-IR, NMR and UV–Vis) the Azo1–Azo4 molecules were found in their enol-imine form. Consequently, a proton transfer phenomenon was ruled out as the possible source of the absence of OH signals in the Azo2 to Azo4 series, since neither the N-H stretching band (expected around 3000 cm−1) nor the C=O stretching band (expected around 1800 cm−1) were observed in their FTIR spectra. Instead, the lack of this signal in the FTIR spectra of the Azo2 to Azo4 compounds was consistent with the formation of a stronger hydrogen bond (HB) between the hydrogen of the hydroxyl group and the nitrogen of the azomethine group [1,25], which is favored by the attractive electronic effects generated by the presence of the NO2 group on the aromatic ring of these three structures. Theoretical values for O-H vibration of the Azo1 to Azo4 series were calculated at 3152, 3159, 3157, and 3169 cm−1, respectively. The trend in the O-H···N=C HB strength in the series was also supported by the frequency order of the C=N stretching mode [1,26], which was observed as a strong signal at 1598 (Azo1), 1604 (Azo2), 1604 (Azo3), and 1605 (Azo4) cm−1, with estimated theoretical values at 1583, 1583, 1580, and 1580 cm−1, respectively.

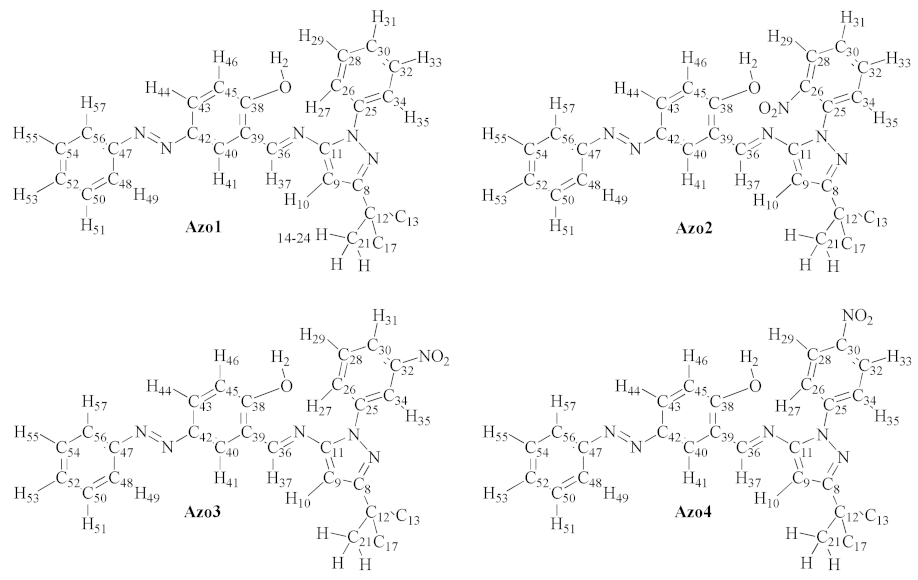
2.2.2. Nuclear Magnetic Resonance (NMR) Spectroscopy

The assignment of chemical shifts (in ppm) in the 1H-NMR spectra of the Azo1–Azo4 series is presented in Table 2, which was carried out considering the nuclei labeling as shown in Figure 4.
The 1H-NMR spectra of the Azo1 and Azo4 compounds (Figures S8–S11 in Supplementary Materials) are characterized by the presence of 13 and 12 signals, which correspond to a total of 25 and 24 protons, respectively, as expected. However, the 1H-NMR spectra of the compounds Azo2 and Azo3 each show 13 signals that integrate for 23 protons, i.e., one proton less than expected. As noted in Table 2, the missing signal in the 1H-NMR spectra of the Azo2 and Azo3 compounds corresponds to the hydrogen (H-2) of the hydroxyl group, the absence of which suggests the formation of strong intermolecular interactions, e.g., O-H···O=S<, between the solvent molecules (dmso-d6) and this group. Figure S23 (in Supplementary Materials) shows the correlation coefficients (R2) plots obtained between the experimental and theoretical 1H chemical shifts, in all cases with values very close to 1.0.
The 13C-NMR spectrum of the Azo1 compound (Figure S8 in Supplementary Materials) showed 20 signals, while 22 signals were observed in each of the 13C-NMR spectra of the Azo2 to Azo4 compounds (Figures S9–S11 in Supplementary Materials). In all cases, the signals correspond to a total of 26 carbons, as expected. The assignments of these signals are presented in Table 3, which were made based on the analysis of the two-dimensional (DEPT, HSQC, HMBC, and COSY) NMR spectra (Figures S12–S22 in Supplementary Materials) and supported by the numerical values predicted by the DFT calculations. The correlation coefficient (R2) plots between the experimental and theoretical 13C chemical shifts are presented in Figure S24 (see Supplementary Materials), with values ranging between 0.96–0.99.

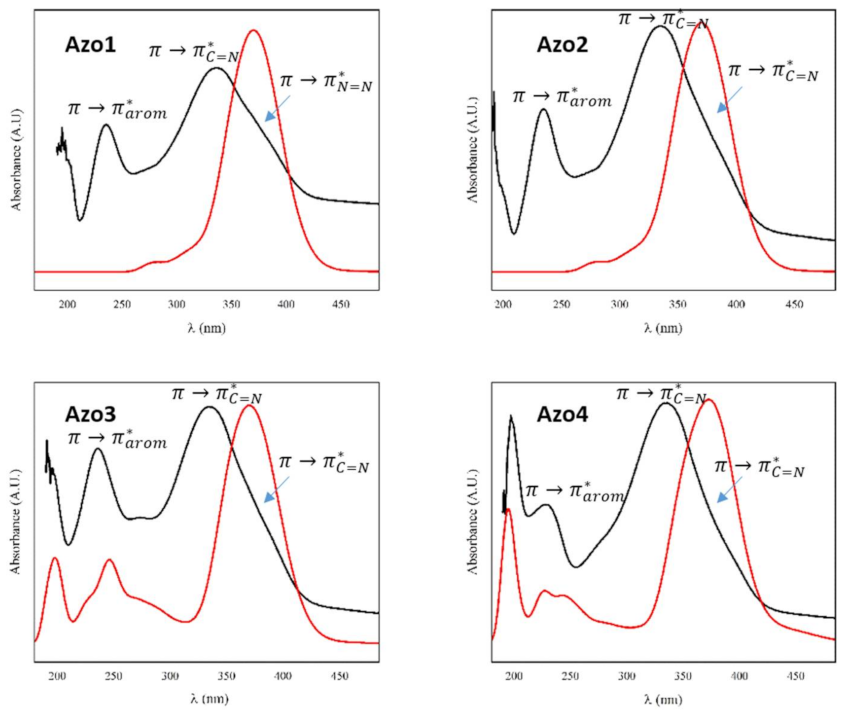
2.2.3. Absorption Electronic UV–Visible Spectroscopy

The experimental and calculated UV–Vis spectra of compounds Azo1 to Azo4 are presented in Figure 5, whereas the respective log ε value, excitation energy, and orbital contributions for each absorption are shown in Table S1 in Supplementary Materials. All compounds presented an experimental absorption band around 234 nm that is consistent with a typical π→π* transition in aromatic compounds [24,25,26,28]. Theoretical calculations indicate that this band is associated with the transition HOMO→LUMO+4 (77%, logε 4.461), HOMO→LUMO+3 (26%, logε 4.623), HOMO-3→LUMO+3 (79%, logε 4.715), and HOMO-1→LUMO+6 (78%, logε 5.051) for compounds Azo1 to Azo4, respectively, which is further associated with the pyrazole and the phenyl rings [1]. On the other hand, the absorption band observed at 335 nm in the UV–Vis spectra of this series was attributed to the HOMO-2→LUMO (75%, logε 4.575), HOMO→LUMO+2 (87%, logε 4.798), HOMO→LUMO+2 (86%, logε 4.832), and HOMO→LUMO+2 (86%, logε 5.369) transitions, respectively, and further related to the azomethine group -C=N [23,25]. Finally, the shoulder at around 362 nm in these spectra was assigned to the π→π* transition related to the azo group (N=N), linked to the aromatic groups.

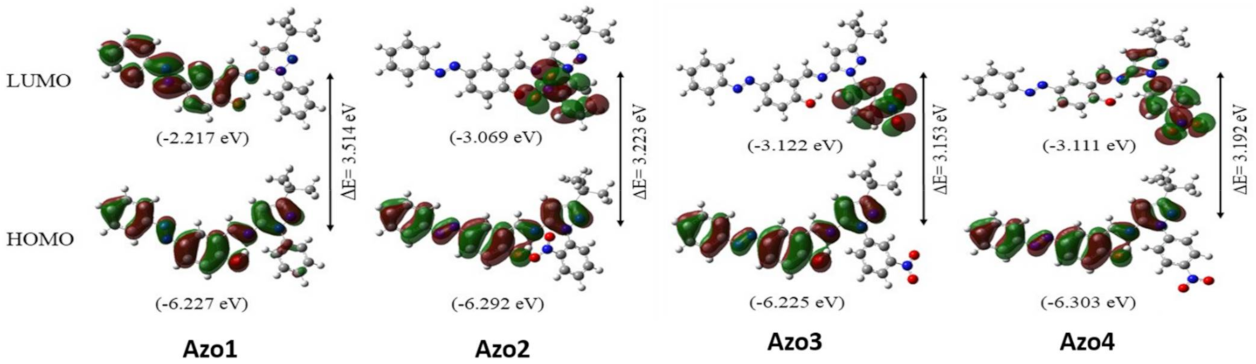
2.3. Frontier Molecular Orbitals

Figure 6 shows the molecular surfaces, energies, and energy gaps (∆E) for the HOMO and LUMO orbitals in the isolated molecules Azo1 and Azo2 calculated using the B3LYP/6-311++G(d,p) level of approximation. The spatial distribution of the HOMO orbitals in all compounds (Figure 6) is related to an extensive pi delocalization coplanar molecular system that involves the phenyl ring of the azo group, the phenol ring, the imine group, and the pyrazole ring. These fragments correspond to electron donor sites in this series of molecules. On the other hand, the LUMO orbital showed significant differences between the compound Azo1 and its nitro congeners (Azo2 to Azo4). In Azo1, the LUMO orbital is related to a pi delocalization system that encompasses the phenyl azo ring, the phenol ring, and the imine group, while in the Azo2 to Azo4 compounds the LUMO orbital is centered on the nitro-substituted aromatic ring. HOMO-LUMO orbital gaps (∆E) also show differences between the Azo1 compound and the Azo2 to Azo4 set. Nitro derivatives (Azo2–Azo4) are characterized by a lower ∆E value (3.153–3.223 eV) compared to Azo1 ∆E (3.514 eV). A lower ∆E gap together with the opposite spatial distribution of the HOMO and LUMO orbitals enables an intramolecular charge transfer that favors the action of nucleophilic attacks on the Azo2–Azo4 series. The extension of the pi delocalization system in the Azo1 to Azo4 series is schematized using resonance structures in Figure S25 (in Supplementary Materials).

2.4. Crystalline Structural Analysis

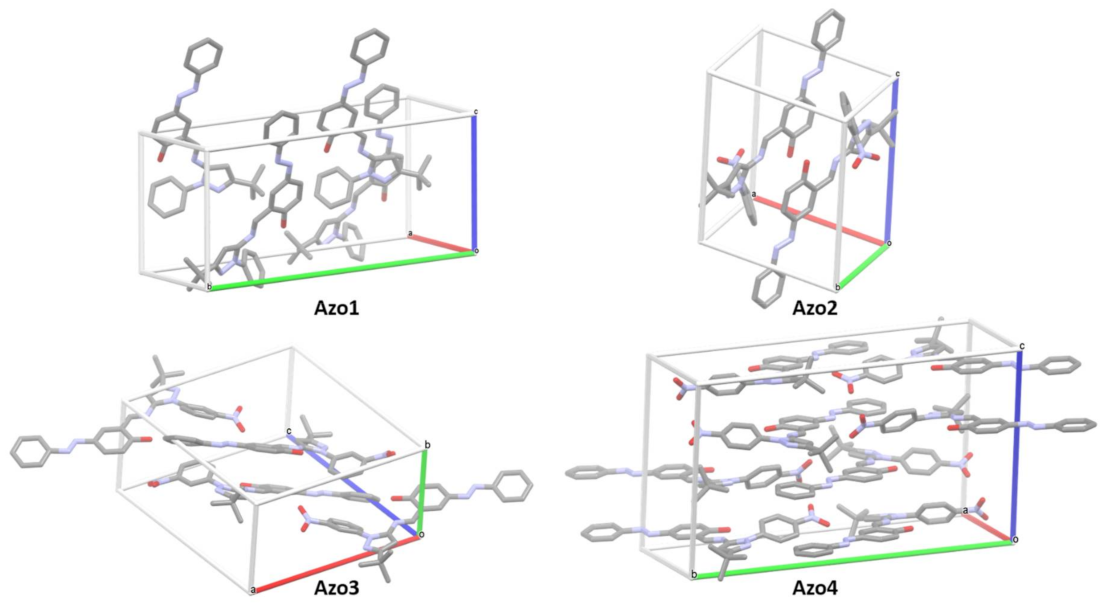
2.4.1. Single Crystal X-ray Diffraction

All compounds of the Azo1 to Azo4 series formed individual yellow (Azo1, Azo3, and Azo4) and brown (Azo2) crystals as the toluene solvent slowly evaporated. Details of the crystallographic data and refinement parameters of these solids are summarized in Table S2 (in Supplementary Materials).
The compounds Azo1, Azo3, and Azo4 crystallized in monoclinic lattices with symmetries corresponding to the space groups Cc, P21/c, and P21/c respectively, while the compound Azo2 crystallized in a triclinic lattice according to the space group P 1 . The crystals from the Azo1 and Azo3 compounds each presented four molecules per unit cell, with cell lengths of a = 10.4561 (9), b = 21.462 (2), and c = 10.3280 (9) Å, β= 96.416(3)° and a cell volume of 2303.18 Å3 for the Azo1, meanwhile Azo3 crystal presented values of a = 17.0887(15), b = 7.3346(7), and c = 19.741(3) Å, β = 102.358(8)° and a cell volume of 2416.98 Å3. The Azo2 compound had two molecules per unit cell, with cell values of a = 9.5873(8), b = 11.2315(9), and c = 12.4374(10) Å, α = 82.489(2)°, β = 73.168(2)°, γ = 75.204(2)° and a cell volume of 1237.04 Å3. The Azo4 crystal was the only one in the series that showed two crystallographically distinct molecular units and a total of eight molecules per unit cell. The cell parameters of the Azo4 crystal were: a = 14,217(2), b = 23,397(4), and c = 15,917 (2) Å, β = 112,515(3)°, and a cell volume of 4891 Å3. Molecular representations of crystal packing in Azo1 to Azo4 compounds are presented in Figure 7.
In the Azo1 crystal, two of the four molecular units project semi-parallel into the cell along the c direction (Figure 7). These two molecules interact with each other through mutually intercalated H-O···H-C hydrogen bonds (HB) with a distance of 2.692 Å, formed between the hydroxyl hydrogen of one unit and an ortho hydrogen in the phenolic ring of the other unit. The other two molecules of the Azo1 crystal lie on opposite sides in the cb plane of the unit cell (see Figure 7). Each of these molecules forms infinite chains along the c direction that are held together through intermolecular N=N···H-C interactions (d = 2.679 Å), formed between an azo nitrogen (that is linked to the aromatic ring) of one unit and an ortho aromatic hydrogen of the next unit. This same interaction is also present throughout the infinite chains formed by each of the two molecules located within the unit cell. Additionally, the chains formed by the molecules of the cb plane interact with each other by means of H-O···H-C HBs (d = 2.692 Å), formed between an oxygen and the ortho hydrogen of their phenol rings.
The two molecules of the Azo2 crystal in the unit cell are packed in the a direction in an antiparallel fashion (see Figure 7). Both molecules interact with each other through two identical C-H···N=N HBs (d = 2.667 Å), formed between the ortho hydrogen of the derivative-nitro ring and the azo nitrogen closest to the aromatic ring. Each molecule forms infinite chains that propagate along the c direction by means of H-O···H-C HBs (d = 2.525 Å), formed between the hydroxyl hydrogen and a meta hydrogen of the aromatic ring and pi-stacking interactions between the aromatic rings (d = 2.854 Å). The interactions between pairs of molecules propagate along the a direction through mutual hydrogen bonds N=O···H-C = C (d = 2.413 Å), formed between an oxygen of the nitro group and the imido hydrogen. The second oxygen of the nitro group has distances of 3.011 and 3.177 Å with a methyl hydrogen and the hydrogen of the pyrazole ring of the next molecule located in a direction, respectively.
Crystalline packing in Azo3 is characterized by the stacking along the b direction in pairs of antiparallel molecules located in the center of the unit cell, while two other diametrically opposite molecules are located centered on the origin vertex ( abc ), see Figure 7. The pairs of antiparallel molecules are stabilized by mutual pi-stacking interactions between the aromatic ring and the nitro-derived aromatic ring. Each nitro group forms three different types of HBs: one nitro oxygen forms an HB (d = 2.705 Å) with the ortho hydrogen of the phenol of a second unit, while the second nitro oxygen forms an HB (d = 2.635 Å) with the meta hydrogen of phenol and an HB (d = 2.675 Å) with the imino hydrogen of a third unit. Meanwhile, the oxygen of the hydroxyl group forms an HB (d = 2.694 Å) with the meta hydrogen of the aromatic ring of another unit.
The eight molecules in the unit cell in the Azo4 crystal stack in the c direction to form four layers, each layer propagating infinitely in the b direction (see Figure 7). Inside each layer, the molecules interact with each other through N=O···H-C HBs (d = 2.569 and 2.650 Å), formed from the same nitro oxygen with the imido hydrogen and a meta hydrogen of the phenol group, respectively. The layers interact with each other through pi-stacking interactions formed between the nitro-aromatic ring and the phenol ring (2.895 Å) or the aromatic ring (2.900 Å).

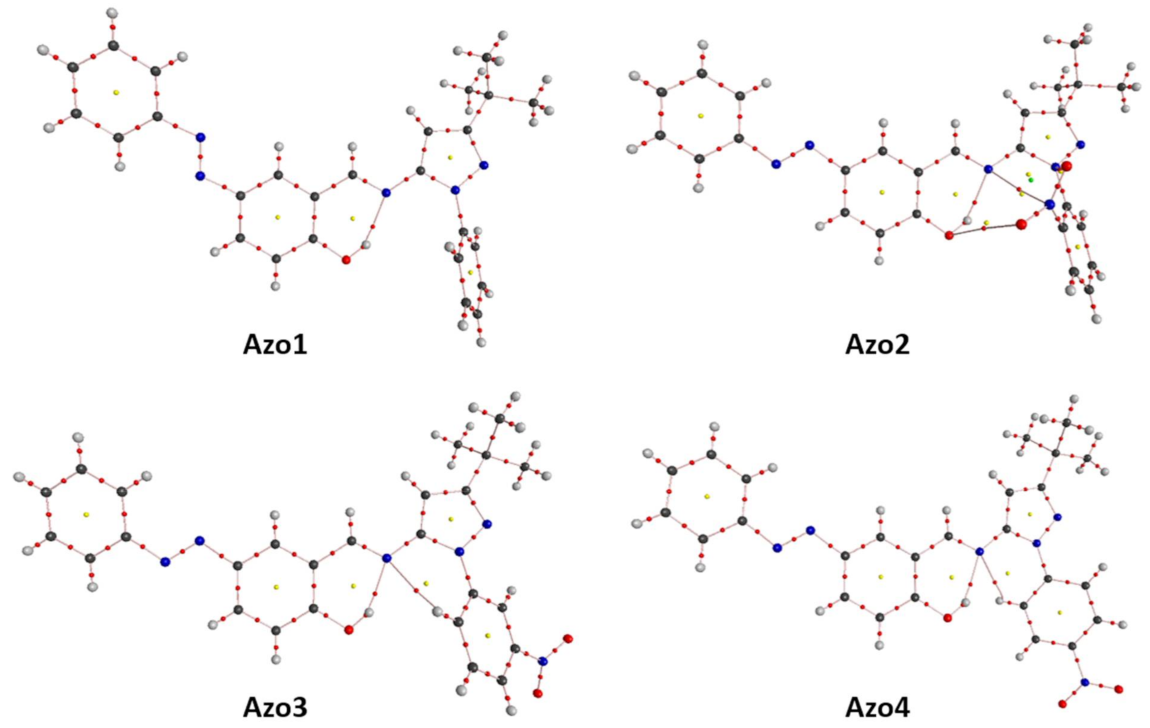
2.4.2. Topological Analysis on Electron Density (ρ)

The application of QTAIM [29] to the isolated molecules extracted from the Azo1 to Azo4 crystals allowed the detection of 123, 135, 129, and 129 critical points (CPs), respectively, which were classified according to their rank (ω) and signature (σ) as presented in Table 4. In all cases, the Poincaré–Hopf relationship (PHR) was satisfied (nNCPnBCP + nRCPnCCP = 1), thus verifying the completeness of these characteristic sets. The molecular graph for each of the molecules from Azo1 to Azo4 are presented in Figure 8, while the main topological properties of the BCPs found for these isolated molecular systems are presented in Tables S3–S6 (in Supplementary Materials).
The 61 BCPs (3,-1) detected in the Azo1 molecule topology comprised the 60 expected covalent BCPs and one closed-shell BCP. The former was related to a bond path (distance = 1.90 Å, ϱ = 0 . 034 au, ε = 0 . 029 , and 2 = 0 . 124 au) between the hydroxyl hydrogen and the nitrogen of the imine moiety (Figure 8). As observed in Figure 8, the five retrieved RCP (3,+1) are associated to: the two aromatic rings, the phenol ring, the pyrazole ring, and the six-membered pseudo-ring formed as a result of the intramolecular O-H···N=C HB.
Apart from the expected 62 covalent BCPs (3,−1), the ρ topology of Azo2 molecule presents four closed-shell BCPs. The latter revealed the formation of a long O-O bond path (distance = 3.48 Å, ϱ = 2.96 × 10 3 au, ε = 1.488 , and 2 = 3.13 × 10 3 au) between a nitro oxygen and the hydroxyl oxygen, an N-N bond path (distance = 2.94 Å, ϱ = 9.24 × 10 3 au, ε = 1.183 , and 2   = 9.41 × 10 3 au) between nitro nitrogen and imine nitrogen, a O-N bond path (distance = 2.84 Å, ϱ = 0.013 au, ε = 7.511 , and 2 = 0.014 au) between the second nitro oxygen and one of the pyrazole nitrogens, and a OH···N=C bond path (distance = 1.90 Å, ϱ = 0 . 033 au, ε = 0 . 034 , and 2 = 0 . 127 au) similar to that observed in the Azo1 molecule. As a consequence of the formation of four RCPs (3,+1) related to the nitro group in ortho position, a CCP (3,+3) was detected for the Azo2 molecule (Figure 8).
For each of the crystalline molecules from the Azo3 and Azo4 compounds, 64 BCPs (3,-1) were found which comprise the expected 62 covalent BCPs and two closed-shell BCPs. The latter revealing the formation of two intramolecular bonding paths with the nitrogen of the imino group; one with the hydroxyl hydrogen O-H···N=C (distance = 1.85 Å, ρ = 0 . 037 au, ε = 0 . 033 , and 2 = 0 . 129 au for Azo3, and distance = 1.91 Å, ρ = 0 . 033 au, ε = 0 . 029 , and 2   = 0 . 103 au for Azo4) and the other with the hydrogen in the ortho position of the nitro-aromatic ring C-H···N=C (distance = 2.56 Å, ϱ = 0 . 013 au, ε = 0.325 , and 2   = 0.044 au for Azo3 and 2.49 Å, ϱ = 0.013 au, ε = 0.240 , and 2   = 0.047 au for Azo4) as seen in Figure 8. Consequently, the six RCPs (3,+1) retrieved for each of these molecules are related to: the aromatic, nitro-aromatic, phenol, and pyrazole rings, as well as the two pseudo-rings derived from the formation of the two intramolecular bond paths.

2.5. In Vitro and In Silico Studies on the Antifungal Activity

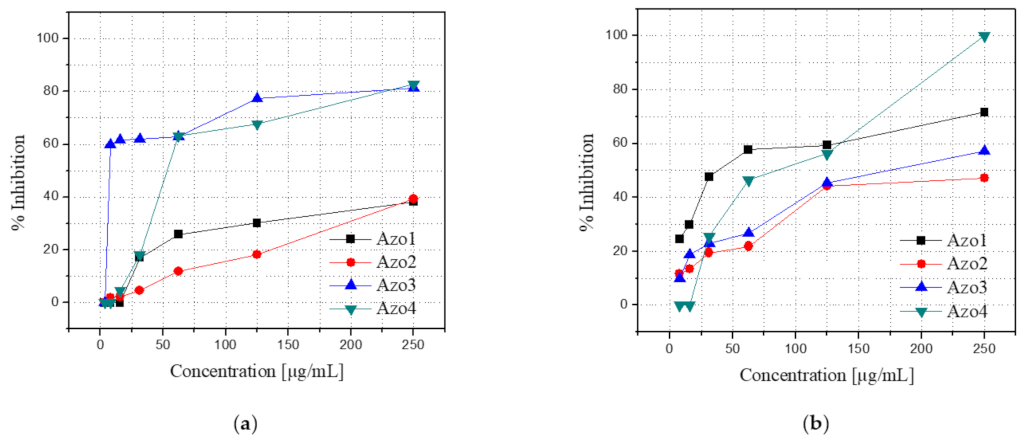
2.5.1. Antifungal Activity Evaluation

Each Azo1–Azo4 compound was dissolved in RPMI-1640 at concentrations of 3.9, 7.8, 15.6, 31.2, 62.5, 125, and 250 μg/mL and its antifungal activity was evaluated against certified strains of C. albicans (ATCC 10231) and C. neoformans (ATCC 32264) using the standardized microplate method of the Clinical and Laboratory Standard Institute (CLSI) [30]. In these assays, amphotericin B was used as a positive control, for which 100% inhibition was achieved for both strains in the entire range of concentrations used. The results of the in vitro antifungal evaluation for the Azo1–Azo4 series are graphically presented in Figure 9.
As observed in Figure 9a, the Azo3 compound exhibited the highest inhibitory activity against the C. albicans strain, for which an inhibition of 59.8% was recorded using a concentration of 7.8 μg/mL. On the other hand, the compound Azo1, Figure 9b, exhibited the best activity against the C. neoformans strain. For this compound, an inhibition of 47.6% was recorded using a concentration of 31.2 μg/mL. In contrast, the compound Azo2 was the agent in the series that revealed the lowest antifungal activity against both strains. The compound Azo4 was the only member of the series to exhibit 100% inhibition against the C. neoformans strain, using a concentration of 250 μg/mL. At this same concentration, the Azo4 compound exhibited the highest inhibition (82.9%) of the entire series against the C. albicans strain, closely followed by an 81.4% inhibition exhibited by the Azo3 compound.

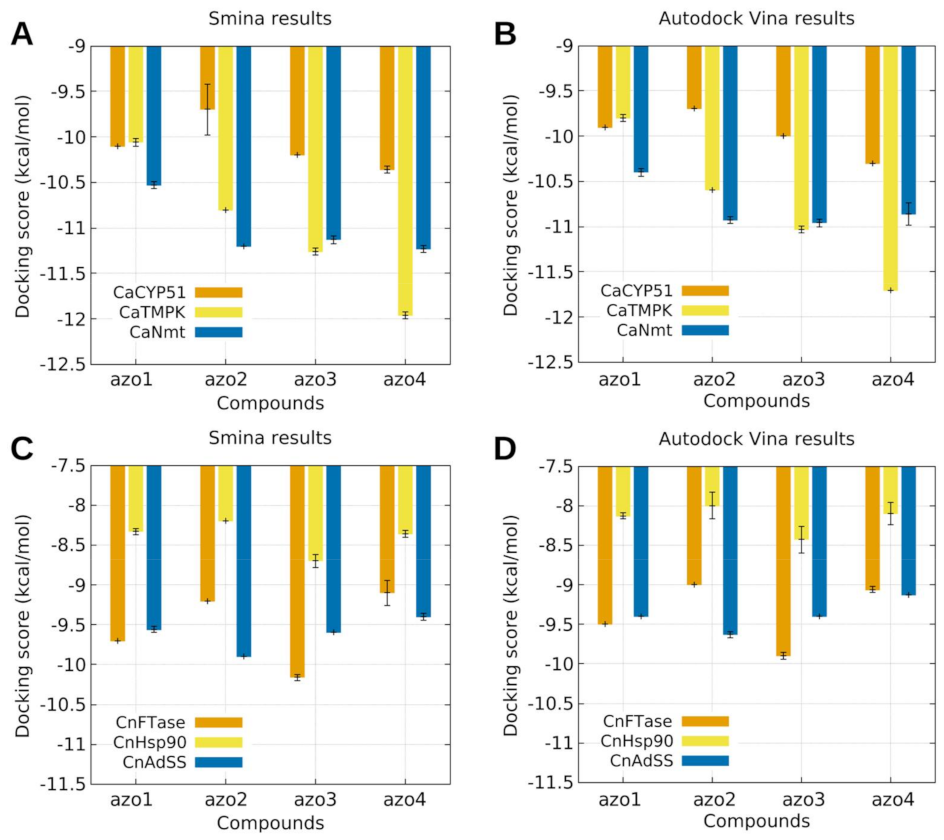
2.5.2. Molecular Docking Modelling

The in silico antifungal evaluation of the azoimine-pyrazole ligands (Azo1 to Azo4) was approached through molecular docking studies against three different molecular targets for each of the selected fungus strains (i.e., C. albicans and C. neoformans). In the case of the C. albicans strain, the targets were the proteins sterol 14-alpha demethylase (CaCYP51), thymidylate kinase (CaTMPK), and N-myristoyltransferase (CaNmt). Likewise for the C. neoformans strain, the molecular targets were the farnesyltransferase protein (CnFTase), the Hsp90 nucleotide binding domain (CnHsp90), and the adenylosuccinate synthetase protein (CnAdSS). Figure 10 presents the scoring function values obtained from these molecular docking calculations using both the Autodock Vina and Smina programs.
As can be seen in the upper graphs of Figure 10, the Azo1–Azo4 ligand series showed a better docking affinity with the CaNMT and CaTMK proteins. A systematic increase in affinity towards the CaTMK target was observed in the order Azo1 < Azo2 < Azo3 < Azo4, while the nitrated ligands (Azo2–Azo4) exhibited a better docking response with the CaNMT protein than the Azo1 ligand. These results indicate that both the presence and the position of the nitro group in these azo-imine-pyrazole compounds plays a fundamental role in the inhibitory activity of these two proteins.
On the other hand, the results of molecular docking obtained using the CnFTase, CnHsp90, and CnAdSS proteins from the C. neoformans strain (graphs below, Figure 10) show that the presence and position of the nitro group in the Azo1–Azo4 series does not generate a marked influence or trend with the corresponding active sites; however, a better protein–ligand interaction is observed for the CnFtase and CnAdSS proteins with respect to the interaction observed with the CnHsp90 protein.

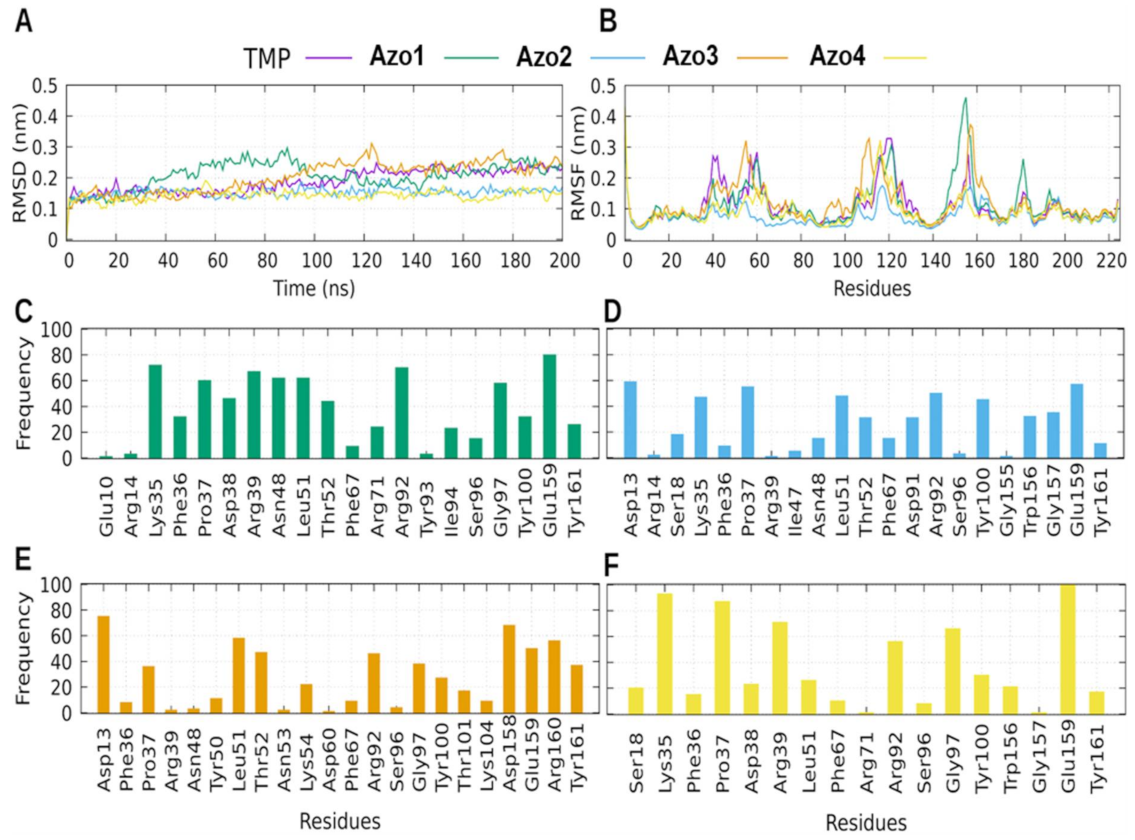
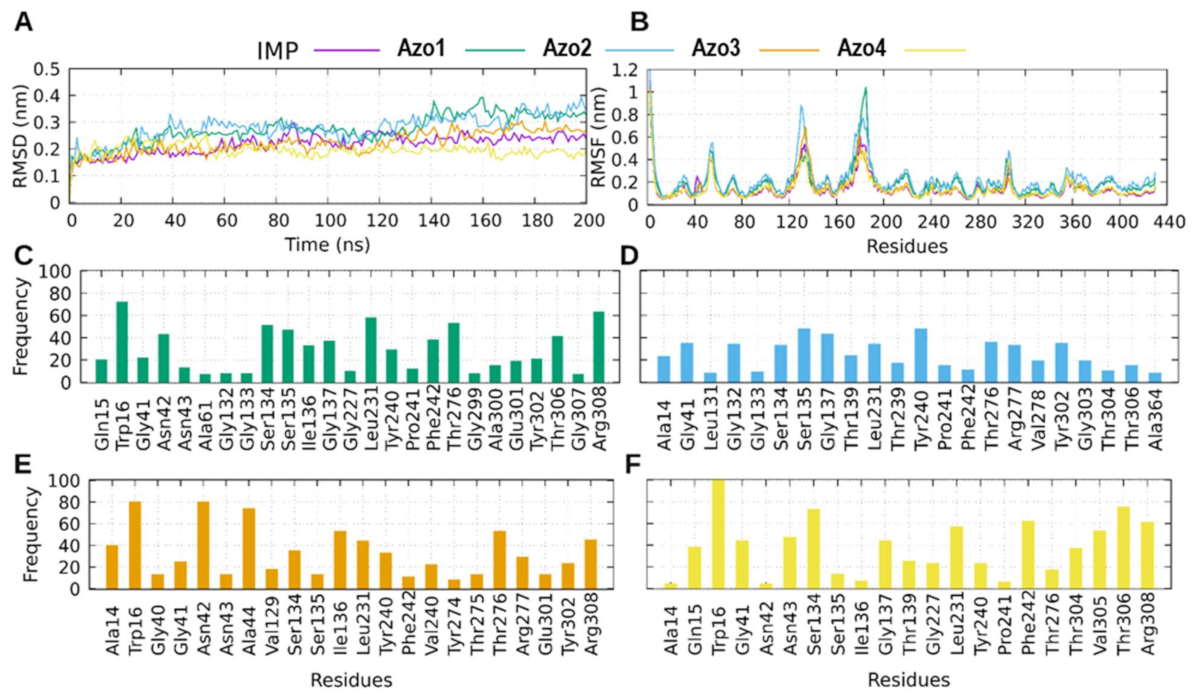
2.5.3. Molecular Dynamics (MD) Simulation

To dive into the ligand–protein binding modes, MD simulations and binding free energy (∆Gbind) calculations were performed for the best molecular docking results. Table 5 shows the free binding energies calculated for the two best ligand–protein couplings per fungus species for each of the compounds Azo1 to Azo4.
Figure 11 shows the analysis of the MD trajectories of each protein–ligand complex formed with the CaTMPK protein. This protein represents a promising target for drug design because it presents regions that are unique for Candida species and differentiates them from human TMPK. It is also important because of its relevant role in the life cycle of the cell, since it is involved in the synthesis of thymidine which is necessary for DNA replication [31,32].
All the CaTMPK complexes showed low RMSD values throughout 200 ns of MD simulations. Values less than ~0.25 nm suggested that the protein was stable in the simulation. Complexes for Azo2 and Azo4 showed even lower RMSD values than the TMP control (Figure 11A). Among the regions with the greatest flexibility were the Ca-loop (His108 to Asn122) and the LID region (Arg153 to Leu163). It has been reported that the flexibility of Ca-loop does not alter the global topology of the protein; however, the flexibility of the LID region has been reported to alter the catalytic activity of the protein [31].
In the case of ΔGbind calculations for C. neoformans, it was observed that neither of the two simulated proteins (CnFTase and CnAdSS) represented the trend of our experimental results. However, it was also observed that the values for ΔGbind were better for the CnAdSS protein, which is why the MD simulations of the protein-ligand complexes formed with this protein were analyzed (Figure 12). AdSS is an important enzyme for the cycle of a cell since it is directly involved with the biosynthesis of ATP [33]. Its inhibition in C. neoformans has been shown to result in complete loss of virulence in the murine model [33]. Figure 12A shows the RMSD as a function of time for the complexes with the CnAdSS protein. In all cases the protein behaved in a stable way, since the RMSD reaches values lower than 0.4 nm and behaved homogeneously during the simulations. It is noteworthy to mention that the complexes with Azo4 and Azo3 were the complexes that presented the least variation in RMSD, on average ~0.2 nm and ~0.3 nm for Azo4 and Azo3, respectively. Interestingly, this behavior was preserved when analyzing the flexibility of the protein residues by means of the RMSF graph (orange and yellow lines in Figure 12B). The protein in the presence of Azo4 and Azo3, presented the smallest increases in the flexibility of the residues which were very similar to the behavior obtained for the natural substrate inosine monophosphate (IMP). Conversely, compounds Azo1 and Azo2 presented the highest RMSD (Figure 12A) and RMSF (Figure 12B) values. Three regions with high flexibility have been described in the CnAdSS protein, which in our simulations preserved its flexible character, showing RMSF values between approximately 1 and 0.5 nm (Figure 12B). These regions are from amino acids Arg51 to Thr58, the second from Ile122 to Lys141, and the third from Arg171 to Met194. Of these three regions, our compounds only interacted with the region that goes from Ile122 to Lys141.
Regarding the protein–ligand contacts with the CnAdSS, the compounds shared interactions with residues such as Gly41, Ser134, Ser135, Leu231, Tyr240, Phe242, Thr276, and Arg308, of which Gly41, Ser134, Leu231, and Phe242 are residues highly involved in stabilization of the natural substrate IMP, suggesting that if the protein-inhibitor interaction occurs, our compounds (especially Azo4 and Azo3) could hinder the CnAdSS-IMP interaction. Azo4 presented the best value for the ΔGbind. This is related to the fact that their interaction at the IMP binding site was more stable than that of the other compounds as they presented higher contact frequencies (for example with Trp16, Thr306, and Ser134). Additionally, Azo4 presented a unique interaction of almost 60% with the Val305 residue, which in the human orthologue changes to a Threonine. This could favor its binding with respect to the other compounds and allows us to think about specific interactions in C. neoformans.

3. Materials and Methods

3.1. Synthesis

3.1.1. Synthesis of Aminepyrazole Derivatives

The precursor pyrazoles (Pyr in Figure 3) were synthesized following the methodology reported in the literature [34,35]. A measure of 35.18 mmol of 4,4-dimethyl-3-oxopentanenitrile (dopn in Figure 3) and 35.18 mmol of phenylhydrazine (2-nitrophenylhydrazine, 3-nitrophenylhydrazine, 4-nitrophenylhydrazine) were mixed in an Erlenmeyer flask. Then 4 mL of concentrated hydrochloric acid and 32 mL of distilled water were added, and the resulting mixture was heated to 70 °C with constant stirring. After reacting for one hour, 4 mL of concentrated hydrochloric acid was added, and the mixture was heated for an additional hour. The reaction was cooled to room temperature, then placed in an ice bath and neutralized with the careful addition of ammonium hydroxide until a precipitate formed. The solids formed were vacuum filtered and washed initially with water (5 × 50 mL) and then with hexane (2 × 50 mL).

3.1.2. Synthesis of (E)-2-hydroxy-4-(phenyldiazenyl)benzaldehyde

(E)-2-hydroxy-4-(phenyldiazenyl)benzaldehyde (hpdb in Figure 3) was synthesized by following the reported methodologies [36,37]. Measures of 1.0 g of aniline and 5 mL of a 2:1 mixture of concentrated HCl and water were added to a 100 mL beaker and the resulting solution was stirred at room temperature. After 10 min, the mixture was placed in an ice bath until reaching a temperature close to 0 °C. NaNO2 (0.891 g) was then dissolved in distilled water and added dropwise. The reaction mixture was stirred for 30 min to generate (in situ) the diazonium salt. To this solution, an aqueous solution formed by salicylaldehyde (1.313 g), sodium hydroxide (0.430 g), and sodium carbonate (5.703 g) was added dropwise until the formation of a brown precipitate. The mixture was left in an ice bath for 1 h and then filtered under vacuum. Then 5 mL of a mixture of HCl and water (2:1) was added to the solid obtained while stirring for 10 min and then filtered to obtain the hpdb compound.

3.1.3. Synthesis and Physicochemical Properties of Azo-imine-pyrazoles

Azo-imine-pyrazole derivatives Azo1 to Azo4 were synthesized by following reported methodologies [25]. A measure of 0.41 mmol of the corresponding aminepyrazole, 50 mg of compound hpdb (0.41 mmol), and 3 drops of glacial acetic acid were vigorously macerated with a micro spatula until the complete reaction of its precursors. The solids obtained were washed with a cold water/ethanol mixture (5 × 20 mL). Then, the solids were vacuum filtered until dry. Single crystals suitable for X-ray diffraction were obtained by slowly evaporating the solution at room temperature from a solution in toluene for all compounds.
2-((E)-((3-(tert-butyl)-1-phenyl-1H-pyrazol-5-yl)imino)methyl)-4-((E)-phenyldiazenyl)phenol (Azo1). Yellow. Yield: 89%. Anal. Calc. for C26H25N5O: %C 73.74, %H 5.95, %N 16.54, %O 3.78 found: %C 73.68, %H 5.84, %N 16.66, %O 3.65, m.p. 196–198 °C. MS (70 eV) m/z (%) 423 [M+] (100), 424 [M+ +1] (20.33), 425 [M+ +2] (3.72), 408 [M+ -15] (9.66), 366 [M+ −57] (2.15)). FT-IR ATR (cm−1) ν(O-H) 3440, ν(C-H) 3127 (pyrazole), ν(C-H) 3063 (aromatic), ν(C-H) 3005 (imine), νas(C-H) 2960 (t-butyl), νs (C-H) 2862 (t-butyl), ν(C=N) 1598 (imine), ν(C=C) 1576 (aromatic), ν(N=N) 1503 (azo), δas(C-H) 1454 (t-butyl), δs(C-H) 1358 (t-butyl), ν(C-O) 1281. 1H-NMR (300 MHz, acetone-d6, δ ppm) 1.39 (s, 9H, tBu-H), 6.75 (s, 1H, H-10), 7.09 (d, 1H, 3J = 8.85 Hz, H-46), 7.45 (t, 1H, 3J = 7.40 Hz, H-31), 7.54 (m, 1H, H-53), 7.56 (m, 4H, H-29), 7.59 (m, 4H, H-51), 7.69 (d, 2H, 3J = 7.45 Hz, H-27), 7.91 (d, 2H, H-49), 8.06 (dd, 1H, 3J = 8.84 Hz, 4J = 2.32 Hz, H-44); 8.25 (d, 1H, 4J = 2.25 Hz, H-41), 9.26 (s, 1H, H-37), 12.58 (s, 1H, OH). 13C-NMR (75 MHz, acetone-d6, δ ppm) 29.78 (tBu-C), 34.68 (C-12), 91.12 (C-9), 117.76 (C-45), 119.17 (C-39), 122.44 (C-48), 124.95 (C-26), 127.49 (C-43), 127.62 (C-30), 128.42 (C-40), 129.02 (C-50), 129.21 (C28), 130.54 (C-52), 139.33 (C-25), 145.69 (C-42), 147.35 (C-11), 152.87 (C-47), 162.09 (C-8), 163.12 (C-38), 164.03 (C-36). The atoms were numbered according to Figure 4. UV–Vis, MeCN, λ max nm, (log ε): λ1 200 (4.36), λ2 234 (4.46), λ3 335, λ4 362 (4.44).
2-((E)-((3-(tert-butyl)-1-(2-nitrophenyl)-1H-pyrazol-5-yl)imine)methyl)-4-((E)-phenyldiazenyl)phenol (Azo2). Brown. Yield: 75%. Anal Calc for C26H24N6O3: %C 66.65, %H 5.16, %N 17.90, %O 10.24, found: %C 66.74, %H 5.07, %N 18.08, %O 10.13, m.p. 180-182 °C. MS (70 eV) m/z (%) 468 [M+] (82.71), 469 [M+ +1] (27.72), 470 [M+ +2] (4.52), 453 [M+ -15] (3.55), 391 [M+ −77] (0.77), 77 (100), 57 (42.98). FT-IR ATR (cm−1) ν(C-H) 3122 (pyrazole), ν(C-H) 3064 (aromatic), ν(C-H) 3011 (aromatic), νas(C-H) 2964 (t-butyl), νs(C-H) 2861 (t-butyl), ν(C=N) 1604 (imine), ν(C=C) 1586, νas(NO2) 1528, ν(N=N) 1478 (azo), δas(C-H) 1459 (t-butyl), δs(C-H) 1362(t-butyl), νs(NO2) 1352, ν(C-O) 1285. 1H-NMR (300 MHz, DMSO-d6, δ ppm) 1.25 (s, 9H, tBu-H), 6.70 (s, 1H, H-28), 7.05 (s, 1H, H-24), 7.52 (d, 3H, H-43), 7.55 (d, 3H, H-45), 7.68 (t, 1H, H-35), 7.77 (m, 4H, 3J = 7.12 Hz, H-37), 7.80 (m, 4H, H-39), 7.86 (m, 4H, 3J = 7.62 Hz, H-32), 7.93 (d, 1H, 4J = 1.46 Hz, H-26), 8.08 (d, 1H, 3J = 7.80 Hz, H-30), 8.19 (s, 1H, H-20), 9.16 (s, 1H, H-22). 13C-NMR (75 MHz, DMSO-d6, δ ppm) 30.26 (tBu-C), 32.40 (C-33), 91.58 (C-27), 118.09 (C-23), 120.59 (C-13), 122.68 (C-38), 125.39 (C-29), 125.68 (C-34), 125.92 (C-19), 128.00 (C-25), 129.48 (C-36), 129.89 (C-44), 134.06 (C-31), 131.53 (C-42), 145.12 (C-14), 145.38 (C-11), 149.27 (C-12), 151.92 (C-15), 153.51 (C-18), 161.18 (C-21), 162.29 (C-17), 163.17 (C-16). The atoms were numbered according to Figure 4. UV–Vis MeCN, λ max nm, (log ε): λ1 296 (4.52), λ2 233 (4.62), λ3 335 (4.79), λ4 362 (4.64).
2-((E)-((3-(tert-butyl)-1-(3-nitrophenyl)-1H-pyrazol-5-yl)imino)methyl)-4-((E)-phenyldiazenyl)phenol (Azo3). Yellow. Yield: 80%. Anal. Calc. for C26H24N6O3: %C 66.65, %H 5.16, %N 17.90, %O 10.24, found: %C 66.71, %H 5.14, %N 17.87, %O 10.25, m.p. 184-186 °C. MS (70 eV) m/z (%) 468 [M+] (100), 469 [M+ +1] (29.24), 470 [M+ +2] (5.19), 453 [M+ −15] (3.21), 391 [M+ −77] (2.13), 57 (32.04). FT-IR ATR (cm−1) ν(C-H) 3123 (pyrazole), ν(C-H) 3061 (aromatic), ν(C-H) 3011 (aromatic), νas(C-H) 2965 (t-butyl), νs(C-H) 2861 (t-butyl), ν(C=N) 1604 (imine), ν(C=C) 1586, νas(NO2) 1529, ν(N=N) 1478 (azo), δas(C-H) 1460 (t-butyl), δs(H-C) 1363 (t-butyl), νs(NO2) 1352, ν(C-O) 1286. 1H-NMR (300 MHz, DMSO-d6, δ ppm) 1.32 (s, 9H, tBu-H), 6.75 (s, 1H, H-10), 7.15 (d, 1H, 3J = 8.84 Hz, H-43), 7.55 (m, 3H, H-22), 7.57 (m, 3H, H-51), 7.78 (m, 3H, H-24), 7.80 (m, 3H, H-53), 7.96 (dd, 1H, 3J = 8.82 Hz, 4J = 2.44 Hz, H-45), 8.18 (dd, 2H, 4J = 2.11 Hz, H-20), 8.21 (dd, 2H, H-55), 8.37 (d, 1H, 4J = 2.43 Hz, H-48), 8.63 (t, 1H, 4J = 2.08 Hz, H-17), 9.21 (s, 1H, H-39). 13C-NMR (75 MHz, DMSO-d6, δ ppm) 30.32 (tBu-C), 32.87 (C-25), 92.77 (C-9), 118.23 (C-42), 118.25 (C-16), 120.96 (C-40), 121.44 (C-19), 125.21 (C-47), 128.24 (C-44), 129.84 (C-54), 129.94 (C-50), 130.89 (C-52), 130.95 (C-23), 131.41 (C-21), 139.76 (C-15), 145.08 (C-46), 147.97 (C-18), 149.66 (C-12), 151.93 (C-49), 160.14 (C-41), 162.20 (C-38), 162.79 (C-8). The atoms were numbered according to Figure 4. UV–Vis MeCN, λ max nm, (log ε): λ1 196 (4.38), λ2 234 (4.71), λ3 275 (4.49), λ4 335 (4.83), λ5 362 (4.67).
2-((E)-((3-(tert-butyl)-1-(4-nitrophenyl)-1H-pyrazol-5-yl)imino)methyl)-4-((E)-phenyldiazenyl)phenol (Azo4). Yellow. Yield 89%. Anal. Calc. for C26H24N6O3: %C 66.65, %H 5.16, %N 17.90, %O 10.24, found: %C 66.62, %H 5.11, %N 17.88, %O 10.17, m.p: 182–184 °C. MS (70 eV) m/z (%) 468 [M+] (100), 469 [M+ +1] (30.26), 470 [M+ +2] (5.27), 453 [(M+ −15] (4.49), 411 [M+ −57] (0.82), 391 [M+ −77] (1.87). FT-IR ATR (cm−1) ν(C-H) 3120 (pyrazole), ν(C-H) 3063 (aromatic), ν(C-H) 3011 (aromatic), νas(C-H) 2959 (t-butyl), νs(C-H) 2863 (t-butyl), ν(C=N) 1605 (imine), ν(C=C) 1592, νas(N-O) 1514 (-NO2), ν(N=N) 1500 (azo), δas(C-H) 1461 (t-butyl), δs(C-H) 1367 (t-butyl), νs(N-O) 1333 (-NO2), ν(C-O) 1279. 1H-NMR (300 MHz, DMSO-d6, δ ppm) 1.35 (s, 9H, tBu-H), 6.77 (s, 1H, H-24), 7.15 (d, 1H, H-17), 7.85 (d, 2H, 3J = 6.99 Hz, H-51), 7.53 (m, 3H, H-55), 7.56 (m, 3H, H-53), 7.99 (dd, 3H, 4J = 2.45 Hz, H-15), 8.03 (dd, 3H, 3J = 9.16 Hz, H-28), 8.36 (d, 3H, 4J = 2.45 Hz, H-12), 8.37 (d, 3H, 3J = 9.14 Hz, H-30), 9.23 (s, 1H, H-19), 11.87 (s, 1H, OH). 13C-NMR (75 MHz, DMSO-d6, δ ppm) 30.43 (tBu-C), 32.87 (C-36), 93.54 (C-23), 118.21 (C-16), 121.41 (C-10), 122.82 (C-50), 124.10 (C-27), 125.07 (C-29), 125.62 (C-11), 128.35 (C-14), 129.90 (C-52), 131.55 (C-54), 144.44 (C-26), 145.49 (C-31), 145.64 (C-13), 150.35 (C-25), 152.35 (C-49), 161.25 (C-18), 162.56 (C-9), 163.67 (C-22). The atoms were numbered according to Figure 4. UV–Vis MeCN, λ max nm, (log ε): λ1 196 (5.27), λ2 234 (5.05), λ3 275 (4.90), λ4 335 (5.36), λ5 362 (5.19).

3.2. Analytical and Physicochemical Measurements

All chemicals and solvents used (analytical grade) were purchased from Sigma-Aldrich and Across without further purification. The melting points were determined on a Büchi melting point apparatus. The excitation and emission spectra were obtained in a JASCO 8600 fluorescence spectrophotometer with a FMP-825 microplate reader. Infrared spectra were measured in a Perkin Elmer FT 2000 series spectrophotometer using KBr disks. The NMR spectra were recorded on a Bruker Avance 400 spectrophotometer operating at 400 MHz for 1H and at 100 MHz for 13C, using tetramethylsilane as the internal standard. The mass spectra were obtained on a SHIMADZU-GCMS 2010-DI-2010 spectrometer equipped with a direct input probe operating at 70 eV. The UV–Vis absorption spectra were obtained in a range of 200–600 nm using a Shimadzu UV–Vis 160 spectrophotometer. Microanalyses were performed on an Agilent CHNS elemental analyzer.

3.3. X-ray Diffraction Analysis

Single-crystals suitable for X-ray diffraction of compounds Azo1, Azo2, Azo3, and Azo4 were obtained by slowly evaporating the solutions in toluene at room temperature. Data for the compounds were collected at room temperature (298 K) on a Bruker Apex-II CCD diffractometer using monochromatic graphite MoKα (0.71073Å) radiation. The determination of the cell and the final cell parameters were obtained on all the reflections using the Bruker SAINT software included in the APEX 2 software package. The integration and scaling of the data were carried out using the Bruker SAINT software.
The crystalline structures were solved by direct methods by using the Olex2 program [38] and the models obtained were refined by full–matrix least squares on F2 (SHELXTL–97) [39]. All the hydrogen atoms were placed in calculated positions and refined with fixed individual displacement parameters [Uiso(H) = 1.2Ueq or 1.5Ueq] according to the riding model (C–H bond lengths of 0.93Ǻ and 0.96Ǻ, for methyl and aromatic hydrogen, respectively). There was an exception made for the hydrogen atom from the hydroxyl group which was located farther away from the electronic density. Molecular representations were generated by Diamond [40] and MERCURY 3.9 [41]. Crystallographic data for Azo1, Azo2, Azo3 and Azo4 were deposited at the Cambridge Crystallographic Data Centre with deposition numbers CCDC 2115770 for Azo1, CCDC 2115791 for Azo2, 2115792 for Azo3 and 2115793 for Azo4.

3.4. Computational Studies

3.4.1. DFT Calculations

Molecular optimizations and harmonic vibration frequencies were calculated in gas phase in the Gaussian09 suite [42] using the B3LYP hybrid functional in combination with the basis set 6-311++G**. The calculated frequencies were corrected with the scale factor 0.960461 [43] and then interpreted by means of potential energy distributions (PEDs) using the VEDA 4 program [27].
1H and 13C nuclear magnetic shielding tensors (in ppm) relative to the TMS standard were calculated using the gauge-independent atomic orbital (GIAO) method and the implicit continuum model (PCM) and utilizing the same theoretical optimization levels. Vertical electronic transitions were calculated by the time-dependent density functional theory (TD-DFT) at the same level of theory. For the percentage contribution of the boundary orbitals for each vertical transition the GaussView software was used [44].
Using Koopman’s theorem [45,46,47], the calculated energy of the HOMO and LUMO orbitals was used to determine the molecular descriptors of ionization potential (I), electron affinity (A), hardness (η), smoothness (σ), electronegativity (χ), potential chemistry (µ) and the global electrophilicity index (ω). The mathematical expression for these descriptors together with the corresponding values calculated for the Azo1–Azo4 series are presented in Table S7 (in Supplementary Materials).

3.4.2. Topological Analysis

The study of the topology of the electron density (ρ) in the isolated molecules extracted from the crystals of the compounds Azo1 to Azo4 was carried out in the AIM2000 program [48] using wavefunctions calculated in the Gaussian09 program [42] at the theoretical level B3LYP/6-311++g(2df.2pd). This was performed according to the Quantum Theory of Atoms in Molecules and Crystals (QTAIM-C) developed by Richard Bader and his coworkers [29]. The calculation of critical points (CPs) on the electron density surface was performed using Newton’s method with a maximum number of 120 iterations and a step-size factor of 0.5. The molecular graphs of the isolated molecules were obtained from the calculation of uphill paths from (3,−1) CPs, downhill paths from (3,+1) CPs, and paths connecting (3,−1) and (3,+1) CPs. For each molecule, the completeness of the characteristic set of CPs was verified by means of the Poincaré–Hopf relationship (nNCPnBCP + nRCPnCCP = 1).

3.4.3. Molecular Docking Calculations

For the in silico antifungal evaluation of azoimine-pyrazole derivatives (Azo1–Azo4) against strains of C. albicans and C. neoformans, molecular docking studies were carried out on six different target receptors extracted from these fungal species. For C. albicans we used the sterol 14-alpha demethylase (CaCYP51) protein with PDB code 5FSA [31], the thymidylate kinase protein (CaTMPK) with PDB code 5UIV [49], and the N-myristoyltransferase protein (CaNmt) with PDB code 1IYL [50]. For C. neoformans we used the farnesyltransferase protein (CnFTase) with PDB code 3SFX [51], the Hsp90 nucleotide binding domain (CnHsp90) with PDB code 7K9S [52], and the adenylosuccinate synthetase protein (CnAdSS) with PDB code 5I34 [53].
Ligand and receptor preparations were made using Autodock Tools v1.5.6 software [54]. For receptors, the preparation consisted of the elimination of ligands and ions co-crystallized, the addition of polar hydrogens, and the assignment of Kollman charges. In some receptors its main cofactors were conserved in their binding sites, i.e., the P450 heme in CYP51 and the Guanosine-5’-diphosphate (GDP) in Adenylosuccinate synthetase. For ligands, the three-dimensional structure from DFT calculations were used for addition of polar hydrogens and the assignment of Gasteiger charges and torsions.
Molecular docking calculations were performed in triplicate and carried out using the Autodock Vina [55] and Smina [56] software. All the search boxes used had a dimension of 26Å × 26Å × 26Å and were centered on the co-crystallized ligands. A value of 15 for the exhaustiveness parameter was used. To validate our calculations, we did a re-docking of the co-crystallized ligands in each receptor (Figure S26 in Supplementary Materials).

3.4.4. Molecular Dynamics Simulations

To study the behavior of protein-ligand complexes, we performed molecular dynamics (MD) simulations using the Gromacs 2019 package [57]. For this, we use the ligands with the best binding score from the molecular docking calculations. For the protein, the amber99sb-ildn force field was used [58] and the ligands were parameterized using the General Amber Force Field [59] and the ACPYPE tool [60]. All the complexes were solvated in a dodecahedron box using the water model TIP3P [61]. Na+ and Cl ions were added to neutralize the charges of the system and an excess of ions was added to reach a NaCl concentration of 0.15M. Energy minimization and a series of equilibration stages under NVT and NPT conditions (number of particles, volume, and constant temperature) using a temperature of 310 K was carried out by 250 ps applying position restrictions of 1000 kJ mol nm2. Then, 4 equilibration stages under NPT conditions (number of particles, pressure, and constant temperature) using a pressure of 1 bar by 250 ps each one, applying gradually decreased position restrictions (1000, 100, 10, 1 kJ mol nm2, respectively) were carried out. A total time of 1.25 ns was implemented in our equilibration stage. Finally, a production stage of 200 ns without restrictions and using a time step of 2 fs was carried out. The temperature was controlled using the V-rescale thermostat [62] and a time constant of 0.1 ps. The pressure was controlled using the Parrinello–Rahman barostat [63] and a time constant of 2.0 ps. The non-bonded list was updated every 10 steps. Long-range electrostatic interactions were calculated using the particle mesh Ewald (PME) method and a cutoff radius of 10 Å. Van der Waals interactions were calculated using a Lennard–Jones potential (6–12) using a cut-off radius of 10 Å.
To perform the analysis, the root mean square deviation (RMSD) of the backbone of each protein was calculated using the gmx_rms tool. The root mean square fluctuation (RMSF) of the Cα atoms of each protein was also calculated using the gmx_rmsf tool. Additionally, we calculated the main contacts/interactions between the proteins and each ligand. To do this, we measured the distances between the ligand and all protein residues as a function of time using the gmx_mindist tool. A contact/interaction was considered if the distance was at least 2.5 Å. Then each contact was tracked over time and its frequency was calculated. If the frequency was 100%, it meant that the contact was fully conserved over time. For this analysis, the last 100 ns was used. Finally, to obtain a thermodynamic insight of the protein–ligand interactions, we calculated the binding free-energy (ΔGbind) using the molecular mechanics/Poisson–Boltzmann surface area (MM/PBSA) method, available in the gmx_MMPBSA tool [64] which is based on AMBER’s MMPBSA.py [65]. The ΔGbind between a protein and ligand to form a complex can be calculated as seen in the following equations (Equations (1)–(3)) [66]:
ΔGbind = ΔH − TΔS ≈ ΔEMM + ΔGsolvation − TΔS
ΔEMM = ΔEinternal + ΔEelectrostatic + ΔEvan der Waals
ΔGsolvation = ΔGPB/GB + ΔGSA
where ΔEMM represents the contribution of molecular mechanics energy given by the system in the gas phase, and it can be obtained from the force field implemented in the MD simulations. ΔGsolvation represents the solvation energy given by the sum of the polar contribution (ΔGPB/GB) and nonpolar contribution (ΔGSA). ΔGPB/GB can be obtained using the Poisson–Boltzmann or generalized-Born models, while ΔGSA can be calculated by solvent accessible surface area (SASA). Thus, the sum of ΔEMM and ΔGsolvation represents the enthalpic contribution (ΔH) to ΔGbind [66,67]. TΔS represents the conformational entropy upon binding and can be added to refine the obtained values. For ΔGbind calculations, frames from the 100 ns to the end were taken each 100 ps, for a total of 1000 frames per trajectory.

3.5. Antifungal Assays

The antifungal activity was determined using the microdilution methods in broth M27-A3 for yeasts and M38-A2 for filamentous fungi following the guidelines of CLSI [30]. The antifungal drug Amphotericin B (Sigma Chemical Co., St Louis, MO, USA) was included as positive control. Azo1-Azo4 compounds and the reference drug were tested against the microorganisms Candida albicans ATCC 10231 and Cryptococcus neoformans ATCC 32264 from the American Type Culture Collection, (ATCC, Rockville, MD, USA). The inocula of cells were adjusted to 1–5 × 10³ cells with colony forming units (CFU)/mL according to CLSI [30].
For minimum inhibitory concentration (MIC) determination, Broth microdilution techniques were performed in 96-well microplates according to the guidelines of the Clinical and Laboratory Standards Institute for yeasts (M27-A3) [30]. For the assay, compound test wells (CTWs) were prepared with stock solutions of each compound in DMSO (maximum concentration ≤ 1%), diluted with RPMI-1640 to final concentrations of 250–3.9 μg/mL. An inoculum suspension (100 μL) was then added to each well (final volume in the well = 200 μL). A growth control well (GCW) (containing medium, inoculum, and the same amount of DMSO used in a CTW, but compound-free) and a sterility control well (SCW) (sample, medium, and sterile water instead of inoculum) were included for each fungus tested. Microtiter trays were incubated in a moist, dark chamber at 30°C for 48 h for both yeasts. The microplates were read in a VERSA Max microplate reader (Molecular Devices, Sunnyvale, CA, USA). Amphotericin B was used as positive control and tests were performed in triplicate. The reduction of growth for each compound concentration was calculated as follows: % of inhibition = 100 − (OD 405 CTW − OD 405 SCW)/(OD 405 GCW − OD 405 SCW). The means ± SEM were used for constructing the dose-response curves representing % inhibition vs. concentration of each compound. Dose-response curves were constructed with SigmaPlot 11.0 software.
MIC50 was defined as the lowest concentration of a compound that showed 50% reduction of the fungal growth control.

4. Conclusions

The first four members of a new family of azo-azomethine imines (Schiff bases) with the general formula R1-N=N-R2-CH=N-R3 (R1 = Ph, R2 = phenol, and R3 = pyrazole derivative) were obtained with a high yield (75–89%) by a straightforward and environmentally friendly synthesis method. They were further characterized by means of GC-MS, DRX, UV–Vis, FTIR, and NMR (one- and two-dimensional) physicochemical techniques, as well as by both gas phase and periodical quantum-mechanical electronic DFT methods. These four derivatives, labeled as Azo1 (R3 = -((C3HN2)(tert-butyl)(Ph)), Azo2 (R3 = -((C3HN2)(tert-butyl)(Ph-NO2(ortho))), Azo3 (R3 = -((C3HN2)(tert-butyl)(Ph-NO2(meta))), and Azo4 (R3 = -((C3HN2)(tert-butyl)(Ph-NO2(para))), were biologically evaluated as antifungal agents against certified strains of Candida albicans (ATCC 10231) and Cryptococcus neoformans (ATCC 32264) and demonstrated a moderate-to-high fungicidal activity that was observed to be dependent on the molecular electrophilic character related to the presence and position of the nitro group. In both bioassays, the nitro compound Azo2 (ortho-NO2 derivative), showed an antifungal activity of less than 50% inhibition, while the compounds Azo3 (meta-NO2 derivative) and Azo4 (para-NO2 derivative), in the case of C. albicans, and Azo1 (derivative without NO2) and Azo4, in the case of C. neoformans, showed inhibitions in ranges of 60–90% and 50–100%, respectively. Antifungal in vitro results were computationally complemented by means of molecular docking and molecular dynamics simulations. In silico studies revealed a high affinity of these azo ligands with two proteins extracted from C. albicans (CaTMPK and CaNmt) and two proteins extracted from C. neoformans (CnFTase and CnAdSS). For both CaTMPK and CaNmt proteins, the best affinity for the azo-azomethine compounds follows the trend of the position of the nitro group as para > meta > ortho > not-substituted, which is close to the results observed in the in vitro assays using the C. albicans strain. The higher affinity for compounds Azo4 and Azo3 was associated to the fact that the nitro group was more exposed to interact through hydrogen bonds with protein residues located inside the active site. In consensus, modifications of the nitro group on the ortho and meta positions in azo-pyrazole-azomethines derivatives appear to be a promising strategy in the search for Schiff base compounds with potential antifungal activity.

Supplementary Materials

The following are available online. Figure S1: Fragmentation patterns of compound Azo1, Figure S2: Fragmentation patterns of compound Azo2, Figure S3: Fragmentation patterns of compound Azo3, Figure S4: Fragmentation patterns of compound Azo4, Figure S5: Correlation plots of calculated versus experimental frequencies (cm−1) for the compounds Azo1 to Azo4, Figure S6: The 1D-NMR spectra of compound Azo1 in acetone-d6: 1H and 13C, Figure S7: 1D-NMR spectra of compound Azo2 in DMSO-d6: 1H and 13C, Figure S8: The 1D-NMR spectra of compound Azo3 in DMSO-d6: 1H and 13C, Figure S9: The 1D-NMR spectra of compound Azo4 in DMSO-d6: 1H and 13C, Figure S10: DEP-135-NMR spectra of compound Azo1 in acetone-d6, Figure S12: DEP-135-NMR spectra of compound Azo4 in DMSO-d6, Figure S13: HSQC-NMR spectra of compound Azo1 acetone-d6, Figure S14: HMBC-NMR spectra of compound Azo1 in acetone-d6, Figure S15: HSQC-NMR spectra of compound Azo2 in DMSO-d6, Figure S16: HMBC-NMR spectra of compound Azo2 in DMSO-d6, Figure S17: HSQC-NMR spectra of compound Azo3 in DMSO-d6, Figure S18: HMBC-NMR spectra of compound Azo3 in DMSO-d6, Figure S19: HSQC-NMR spectra of compound Azo4 in DMSO-d6, Figure S20: HMBC-NMR spectra of compound Azo4 in DMSO-d6, Figure S21: Correlation plots of calculated versus experimental 1H-NMR chemical displacements (in ppm) for the compounds Azo1 to Azo4, Figure S22: Correlation plots of calculated versus experimental 13C-NMR chemical displacements (in ppm) for the compounds Azo1 to Azo4, Figure S23: Re-docking results, Table S1: Experimental and theoretical electronic absorption wavelengths and main orbital contributions for compounds Azo1 to Azo4, Table S2: Main crystallographic data and refinement parameters for the compounds Azo1, Azo2, Azo3 and Azo4, Table S3: Main BCPs topological properties in Azo1 molecule, Table S4: Main BCP topological properties in Azo2 molecule, Table S5: Main BCP topological properties in Azo3 molecule, Table S6: Main BCP topological properties in Azo4 molecule.

Author Contributions

Conceptualization, F.C.-C. and D.F.; methodology, F.C.-C., A.R.-A., C.R.-R., R.L.L., R.A., S.A.Z. and J.A.G.C.; software, F.C.-C., A.R.-A., C.R.-R., R.L.L., R.A., S.A.Z. and J.A.G.C.; validation, F.C.-C., A.R.-A., C.R.-R., R.L.L., R.A., and S.A.Z.; formal analysis, F.C.-C., A.R.-A., C.R.-R., R.L.L., R.A., S.A.Z. and J.A.G.C.; investigation, F.C.-C., A.R.-A., C.R.-R., R.L.L., R.A., S.A.Z. and J.A.G.C.; resources, F.C.-C.; data curation, F.C.-C., A.R.-A., C.R.-R., R.L.L., R.A., S.A.Z. and J.A.G.C.; writing—original draft preparation, F.C.-C., A.R.-A., C.R.-R., R.L.L., R.A., S.A.Z. and J.A.G.C.; writing—review and editing, F.C.-C., A.R.-A., C.R.-R., R.L.L., R.A., S.A.Z. and J.A.G.C.; visualization, F.C.-C., A.R.-A., C.R.-R., R.L.L., R.A. and S.A.Z.; supervision, F.C.-C.; project administration, F.C.-C.; funding acquisition, F.C.-C. All authors have read and agreed to the published version of the manuscript.

Funding

This research was funded by the Universidad del Quindío (Colombia) through the project 920.

Acknowledgments

The authors are grateful to Universidad del Quindío for financial support, as well as the contribution of the Institute of Chemistry at UNAM (Mexico) and the International and Inter-Institutional Relations Unit (URII) of the Universidad del Quindío. JAGC is especially grateful to the Universidad Pedagógica y Tecnológica de Colombia (UPTC) for the financial support provided through the Dirección de Investigaciones (DIN) of the Vicerrectoría de Investigación y Extensión (VIE).

Conflicts of Interest

The authors declare no conflict of interest. The funders had no role in the design of the study; in the collection, analyses, or interpretation of data; in the writing of the manuscript, or in the decision to publish the results.

Sample Availability

Samples of the compounds Azo1, Azo2, Azo3 and Azo4, as well as samples of their synthetic precursors (Pyr1 to Pyr4, and hpdb) are available from the authors.

References

  1. Serbest, K.; Dural, T.; Emirik, M.; Zengin, A.; Faiz, Ö. Heteroligand bivalent transition metal complexes with an azo-oxime ligand and 1,10-phenanthroline: Synthesis, spectroscopy, thermal analysis, DFT calculations and SOD-mimetic activities. J. Mol. Struct. 2021, 1229, 129579–129585. [Google Scholar] [CrossRef]
  2. Khojasteh, V.; Kakanejadifard, A.; Zabardasti, A.; Azarbani, F. Spectral, structural, solvatochromism, biological and computational investigation of some new azo-azomethines containing N-alkylpyridinium salts. J. Mol. Struct. 2019, 1175, 261–268. [Google Scholar] [CrossRef]
  3. Karthikeyan, M.S.; Prasad, D.J.; Poojary, B.; Bhat, K.S.; Holla, B.S.; Kumari, N.S. Synthesis and biological activity of Schiff and Mannich bases bearing 2,4-dichloro-5-fluorophenyl moiety. Bioorg. Med. Chem. 2006, 14, 7482–7489. [Google Scholar] [CrossRef]
  4. Mladenova, R.; Ignatova, M.; Manolova, N.; Petrova, T.; Rashkov, I. Synthesis, structural features and evaluation of antibacterial activities of two Schiff bases derived from 3, 4-Dihydroxybenzhydrazide. Eur. Polym. J. 2002, 38, 989–999. [Google Scholar] [CrossRef]
  5. Zhang, Z.; Cao, P.; Fang, M.; Zou, T.; Han, J.; Duan, Y.; Xu, H.; Yang, X.; Li, Q.-S. Design, synthesis, and SAR study of novel 4,5-dihydropyrazole-Thiazole derivatives with antiinflammatory activities for the treatment of sepsis. Eur. J. Med. Chem. 2021, in press. [Google Scholar]
  6. Zhang, D.; Xu, G.; Zhao, J.; Wang, Y.; Wu, X.; He, X.; Li, W.; Zhang, S.; Yang, S.; Ma, C. Structure-activity relationship investigation for imidazopyrazole-3-carboxamide derivatives as novel selective inhibitors of Bruton’s tyrosine kinase. Eur. J. Med. Chem. 2021, in press. [Google Scholar] [CrossRef] [PubMed]
  7. Nayak, S.; Gaonkar, S.L.; Musad, E.A.; AL Dawsar, A.M. 1,3,4-Oxadiazole-containing hybrids as potential anticancer agents: Recent developments, mechanism of action and structure-activity relationships. J. Saudi. Chem. Soc. 2021, 25, 101284. [Google Scholar] [CrossRef]
  8. Viji, A.; Revathi, B.; Balachandrana, V.; Babiyana, S.; Narayana, B.; Salian, V.V. Analysis of spectroscopic, quantum chemical calculations, molecular docking, RDG, ELF, anticancer and antimicrobial activity studies on bioactive molecule 2-[3-(4-Chlorophenyl)-5-(4-(propane-2-yl) phenyl-4,5-dihydro-1H-pyrazol-1-yl]-4-(4-methoxyphenyl)-1,3-thiazol. Chem. Data Collect. 2021, 30, 100585. [Google Scholar]
  9. Zhu, Y.; Zhao, J.; Luo, L.; Gao, Y.; Bao, H.; Li, P.; Zhang, H. Research progress of indole compounds with potential antidiabetic activity. Eur. J. Med. Chem. 2021, 223, 113665. [Google Scholar] [CrossRef]
  10. da Silva, M.J.V.; Jacomini, A.P.; Gonçalves, D.S.; Pianoski, K.E.; Poletto, J.; Lazarin-Bidoia, D.; Volpato, H.; Nakamura, C.V.; Rosa, F.A. Discovery of 1,3,4,5-tetrasubstituted pyrazoles as anti-trypanosomatid agents: Identification of alterations in flagellar structure of L. amazonensis. Bioorg. Chem. 2021, 114, 105082. [Google Scholar] [CrossRef] [PubMed]
  11. Erkina, A.V.; Yurieva, A.V.; Yuzikhinb, O.S.; Gurzhiy, V.V.; Krutikov, V.I. 2-(2-Amino-6-methylpyrimidin-4-yl)-4-arylmethylidene5-methyl-2,4-dihydro-3H-pyrazol-3-ones: Design, synthesis, structure, in vitro anti-tubercular activity, and molecular docking study. J. Mol. Struct. 2021, 1243, 130863. [Google Scholar] [CrossRef]
  12. Gumus, A.; Bozdag, M.; Angeli, A.; Peat, T.S.; Carta, F.; Supuran, C.T.; Selleri, S. Privileged Scaffolds in Medicinal Chemistry: Studies on Pyrazolo[1,5-a]pyrimidines on Sulfonamide Containing Carbonic Anhydrase Inhibitor. Bioorg. Med. Chem. Lett. 2021, in press. [Google Scholar] [CrossRef]
  13. Xu, Y.; Zhang, Z.; Shi, J.; Liu, X.; Tang, W. Recent developments of synthesis and biological activity of sultone scaffolds in medicinal chemistry. Arab. J. Chem. 2021, 14, 103037. [Google Scholar] [CrossRef]
  14. National Center for Biotechnology Information. PubChem Compound Summary for CID 135464676. PubChem. Available online: https://pubchem.ncbi.nlm.nih.gov/compound/135464676 (accessed on 4 September 2021).
  15. National Center for Biotechnology Information. PubChem Compound Summary for CID 135464675. PubChem. Available online: https://pubchem.ncbi.nlm.nih.gov/compound/135464675 (accessed on 4 September 2021).
  16. National Center for Biotechnology Information. PubChem Compound Summary for CID 135473183, 2-[(E)-(2-Phenylpyrazol-3-yl)iminomethyl]phenol. PubChem. Available online: https://pubchem.ncbi.nlm.nih.gov/compound/135473183 (accessed on 4 September 2021).
  17. National Center for Biotechnology Information. PubChem Compound Summary for CID 54123178. PubChem. Available online: https://pubchem.ncbi.nlm.nih.gov/compound/54123178 (accessed on 4 September 2021).
  18. National Center for Biotechnology Information. PubChem Compound Summary for CID 54032820. PubChem. Available online: https://pubchem.ncbi.nlm.nih.gov/compound/54032820 (accessed on 4 September 2021).
  19. Shetty, P.R.; Shivaraja, G.; Krishnaswamy, G.; Pruthviraj, K.; Mohan, V.C.; Sreenivasa, S. Pyrazole Schiff Bases: Synthesis, Characterization, Biological Screening, In Silico ADME and Molecular Docking Studies. Indian J. Het. Chem. 2020, 30, 123–130. [Google Scholar]
  20. Al-Azmi, A.; Mahmoud, H. Facile Synthesis and Antimicrobial Activities of Novel 1,4-Bis(3,5-dialkyl-4H-1,2,4-triazol-4-yl)benzene and 5-Aryltriaz-1-en-1-yl-1-phenyl-1H-pyrazole-4-carbonitrile Derivatives. ACS Omega 2020, 5, 10160–10166. [Google Scholar] [CrossRef] [Green Version]
  21. Karci, F.; Şener, N.; Yamaç, M.; Şener, I.; Demirçal, A. The synthesis, antimicrobial activity and absorption characteristics of some novel heterocyclic disazo dyes. Dyes Pigm. 2009, 80, 47–52. [Google Scholar] [CrossRef]
  22. Mukhtar, S.S.; Hassan, A.S.; Morsy, N.M.; Hafez, T.S.; Saleh, F.M.; Hassaneen, H.M. Design, synthesis, molecular prediction and biological evaluation of pyrazole-azomethine conjugates as antimicrobial agents. Synth. Commun. 2021, 51, 1564–1580. [Google Scholar] [CrossRef]
  23. Cuenú, F.; Londoño-Salazar, J.; Torres, J.E.; Abonia, R.; D’Vries, R.F. Synthesis, structural characterization and theoretical studies of a new Schiff base 4-(((3-(tert-Butyl)-(1-phenyl)pyrazol-5-yl) imino)methyl)phenol. J. Mol. Struct. 2018, 1152, 163–176. [Google Scholar] [CrossRef]
  24. Moreno-Fuquen, R.; Cuenú, F.; Torres, J.E.; De la Vega, G.; Galarza, E.; Abonia, R.; Kennedy, A.R. Presence of π…π and C H…π interactions in the new Schiff base 2-{(E)-[(3-tert-butyl-1-phenyl-1H-pyrazol-5-yl)imino]methyl}phenol: Experimental and DFT computational studies. J. Mol. Struct. 2017, 1150, 366–373. [Google Scholar] [CrossRef] [Green Version]
  25. Cuenú, F.; Restrepo-Acevedo, A.; Murillo, M.I.; Torres, J.E.; Moreno-Fuquen, R.; Abonia, R.; Kennedy, A.R.; Tenorio, J.C.; Lehmann, C.W. Synthesis, structural characterization, and theoretical studies of new pyrazole (E)-2-{[(5-(tert-butyl)-1H-pyrazol-3-yl)imino]methyl}phenol and (E)-2-{[(1-(4-bromophenyl)-3-(tert-butyl)-1H-pyrazol-5-yl] imino]methyl}phenol. J. Mol. Struct. 2019, 1184, 59–71. [Google Scholar] [CrossRef]
  26. Ozkınali, S.; Gür, M.; Şener, N.; Alkın, S.; Çavus, M.S. Synthesis of new azo schiff bases of pyrazole derivatives and their spectroscopic and theoretical investigations. J. Mol. Struct. 2018, 1174, 74–83. [Google Scholar] [CrossRef]
  27. Jamroz, M. Vibrational energy distribution analysis VEDA 4: Scopes and limitations. Spectrochim. Acta 2013, 114, 220–230. [Google Scholar] [CrossRef] [PubMed]
  28. Cuenú, F.; Patiño, N.; Torres, J.; Abonia, R.; Toscano, R.; Cobo, J. The new 3-(tert- butyl)-1-(2-nitrophenyl)-1H-pyrazol-5-amine: Experimental and computational studies. J. Mol. Struct. 2017, 1148, 557–567. [Google Scholar] [CrossRef]
  29. Bader, R.F. Atom in Molecules: A Quantum Theory; Oxford University Press: Oxford, UK, 1990. [Google Scholar]
  30. CLSI, Clinical and Laboratory Standards Institute. Method M27-A3, 3rd ed.; CLSI: Wayne, PA, USA, 2008; Volume 28, pp. 1–25. [Google Scholar]
  31. Hargrove, T.Y.; Friggeri, L.; Wawrzak, Z.; Qi, A.; Hoekstra, W.J.; Schotzinger, R.J.; Lepesheva, G.I. Structural analyses of Candida albicans sterol 14α-demethylase complexed with azole drugs address the molecular basis of azole-mediated inhibition of fungal sterol biosynthesis. J. Biol. Chem. 2017, 292, 6728–6743. [Google Scholar] [CrossRef] [PubMed] [Green Version]
  32. Kandeel, M.; Kitade, Y.; Al-Taher, A.; Al-Nazawi, M. The structural basis of unique substrate recognition by Plasmodium thymidylate kinase: Molecular dynamics simulation and inhibitory studies. PLoS ONE 2019, 14, e0212065. [Google Scholar] [CrossRef] [PubMed]
  33. Hou, Z.; Wang, W.; Fromm, H.; Honzatko, R.B. IMP Alone Organizes the Active Site of Adenylosuccinate Synthetase from Escherichia coli. J. Biol. Chem. 2001, 277, 5970–5976. [Google Scholar] [CrossRef] [PubMed] [Green Version]
  34. Hernandez, S.; Cuenú, F.; Abonia, R.; Cabrera, A. 3-tert-Butyl-1-(3-nitro phen yl)-1H-pyrazol-5-amine. Acta Cryst. E 2012, 68, o3171. [Google Scholar] [CrossRef] [PubMed]
  35. Quiroga, J.; Portilla, J.; Abonía, R.; Insuasty, B.; Nogueras, M.; Cobo, J. Synthesis of novel 5-amino-1-aroylpyrazoles. Tetrahedron Lett. 2008, 49, 5943–5945. [Google Scholar] [CrossRef]
  36. Choudhury, T.D.; Shen, Y.; Rao, N.V.; Clark, N.A. Dinuclear ortho-metallated palladium (II) azobenzene complexes with acetato and chloro bridges: Influence of polar substituents on the mesomorphic properties. J. Organomet. Chem. 2012, 712, 20–28. [Google Scholar] [CrossRef]
  37. Mahmoodi, N.; Ghavidast, A.; Mirkhaef, S.; Ali, M. Phorochromism of azobenzene-thiol-1,3-diazabicyclo-[3.1.0]hez-3-ene on silver nanoparticles. Dyes Pigm. 2015, 118, 110–117. [Google Scholar] [CrossRef]
  38. Dolomanov, O.V.; Bourhis, L.J.; Gildea, R.J.; Howard, J.A.K.; Puschmann, H. OLEX2: A complete structure solution, refinement and analysis program. J. Appl. Crystallogr. 2009, 42, 339–341. [Google Scholar] [CrossRef]
  39. Sheldrick, G.M. A short history of SHELX. Acta Crystallogr. Sect. A 2008, 64, 112–122. [Google Scholar] [CrossRef] [PubMed] [Green Version]
  40. Brandenburg, K.; Putz, H. In diamond, impact, C. In Crystal Impact; Kreuzherrenstr. Bonn, Germany, 2006; Volume 102, p. 53227. [Google Scholar]
  41. Macrae, C.F.; Bruno, I.J.; Chisholm, J.A.; Edgington, P.R.; McCabe, P.; Pidcock, E.; Rodriguez-Monge, L.; Taylor, R.; Van De Streek, J.; Wood, P.A. Mercury CSD 2.0 e new features for the visualization and investigation of crystal structures. J. Appl. Crystallogr. 2008, 41, 466–470. [Google Scholar] [CrossRef]
  42. Frisch, M.; Trucks, G.; Schlegel, H.; Scuseria, G.; Robb, M.; Cheeseman, J.; Scalmani, G.; Barone, V.; Mennucci, B.; Petersson, G.A.; et al. Gaussian 09, Revision, D.01; Gaussian, Inc.: Wallingford, CT, USA, 2013. [Google Scholar]
  43. Parr, R.G.; Weitao, Y. Density-Functional Theory of Atoms and Molecules; Oxford University Press: Oxford, UK, 1994; pp. 47–66. [Google Scholar]
  44. Dennington, R.; Keith, T.; Millam, J. GaussView 6.0.16; Semichem, Inc.: Shawnee Mission, KS, USA, 2016. [Google Scholar]
  45. Koopmans, T. About the assignment of wave functions and equities to the individual electronics of an atomic. Physica 1934, 1, 104–113. [Google Scholar] [CrossRef]
  46. Mulliken, R.S. A new electroaffinity scale; together with data on valence states and on valence ionization potentials and electron affinities. J. Chem. Phys. 1934, 2, 782–793. [Google Scholar] [CrossRef]
  47. Pearson, R.G. Absolute electronegativity and absolute hardness of Lewis acids and bases. J. Am. Chem. Soc. 1985, 107, 6801–6806. [Google Scholar] [CrossRef]
  48. Biegler-König, F.; Schönbohm, J. Update of the AIM2000-Program for atoms in molecules. J. Comput. Chem. 2002, 23, 1489–1494. [Google Scholar] [CrossRef] [PubMed]
  49. Sinha, K.; Rule, G.S. The structure of thymidylate kinase from Candida albicans reveals a unique structural element. Biochemistry 2017, 56, 4360–4370. [Google Scholar] [CrossRef] [PubMed]
  50. Sogabe, S.; Masubuchi, M.; Sakata, K.; Fukami, T.A.; Morikami, K.; Shiratori, Y.; Ohtsuka, Y.T. Crystal structures of Candida albicans N-Myristoyltransferase with two distinct inhibitors. Chem. Biol. 2002, 9, 1119–1128. [Google Scholar] [CrossRef] [Green Version]
  51. Hast, M.A.; Nichols, C.B.; Armstrong, S.M.; Kelly, S.M.; Hellinga, H.W.; Alspaugh, J.A.; Beese, L.S. Structures of Cryptococcus neoformans protein farnesyltransferase reveal strategies for developing inhibitors that target fungal pathogens. J. Biol. Chem. 2011, 286, 35149–35162. [Google Scholar] [CrossRef] [PubMed] [Green Version]
  52. Marcyk, P.T.; LeBlanc, E.V.; Kuntz, D.A.; Xue, A.; Ortiz, F.; Trilles, R.; Bengtson, S.; Kenney, T.M.G.; Huang, D.S.; Robbins, N.; et al. Fungal-selective resorcylate aminopyrazole Hsp90 inhibitors: Optimization of whole-cell anticryptococcal activity and insights into the structural origins of cryptococcal selectivity. J. Med. Chem. 2021, 64, 1139–1169. [Google Scholar] [CrossRef] [PubMed]
  53. Blundell, R.D.; Williams, S.J.; Arras, S.D.M.; Chitty, J.L.; Blake, K.L.; Ericsson, D.J.; Fraser, J.A. Disruption of de novo adenosine triphosphate (ATP) biosynthesis abolishes virulence in Cryptococcus neoformans. ACS Infectious Diseases. 2016, 2, 651–663. [Google Scholar] [CrossRef] [PubMed]
  54. Morris, G.M.; Huey, R.; Lindstrom, W.; Sanner, M.F.; Belew, R.K.; Goodsell, D.S.; Olson, A.J. AutoDock4 and AutoDockTools4: Automated docking with selective receptor flexibility. J. Comput. Chem. 2009, 30, 2785–2791. [Google Scholar] [CrossRef] [Green Version]
  55. Trott, O.; Olson, A.J. AutoDock Vina: Improving the speed and accuracy of docking with a new scoring function, efficient optimization, and multithreading. J. Comput. Chem. 2010, 31, 455–461. [Google Scholar] [CrossRef] [PubMed] [Green Version]
  56. Koes, D.R.; Baumgartner, M.P.; Camacho, C.J. Lessons Learned in Empirical Scoring with Smina from the CSAR 2011 Benchmarking Exercise. J. Chem. Inf. Model. 2013, 53, 1893–1904. [Google Scholar] [CrossRef] [PubMed]
  57. Abraham, M.J.; Murtola, T.; Schulz, R.; Páll, S.; Smith, J.C.; Hess, B.; Lindahl, E. GROMACS: High performance molecular simulations through multi-level parallelism from laptops to supercomputers. SoftwareX 2015, 1–2, 19–25. [Google Scholar] [CrossRef] [Green Version]
  58. Lindorff-Larsen, K.; Piana, S.; Palmo, K.; Maragakis, P.; Klepeis, J.L.; Dror, R.O.; Shaw, D.E. Improved side-chain torsion potentials for the Amber ff99SB protein force field. Proteins: Structure, Function, and Bioinformatics. Proteins 2010, 78, 1950–1958. [Google Scholar] [CrossRef] [Green Version]
  59. Wang, J.; Wolf, R.M.; Caldwell, J.W.; Kollman, P.A.; Case, D.A. Development and testing of a general amber force field. J. Comput. Chem. 2004, 25, 1157–1174. [Google Scholar] [CrossRef] [PubMed]
  60. Sousa da Silva, A.W.; Vranken, W.F. ACPYPE - AnteChamber PYthon Parser interfacE. BMC Res. Notes 2012, 5, 367–374. [Google Scholar] [CrossRef] [PubMed] [Green Version]
  61. Jorgensen, W.L.; Chandrasekhar, J.; Madura, J.D.; Impey, P.W.; Klein, M.L. Comparison of simple potential functions for simulating liquid water. J. Chem. Phys. 1983, 79, 926–935. [Google Scholar] [CrossRef]
  62. Bussi, G.; Donadio, D.; Parrinello, M. Canonical sampling through velocity rescaling. J. Chem. Phys. 2007, 126, 014101. [Google Scholar] [CrossRef] [Green Version]
  63. Parrinello, M.; Rahman, A. Polymorphic transitions in single crystals: A new molecular dynamics method. J. Appl. Phys. 1981, 52, 7182–7190. [Google Scholar] [CrossRef]
  64. Alba-Ruiz, R. COVID-19, CORONAVIRUS PANDEMIC: Aproximación Bibliométrica y Revisión de los Resultados; Zenodo: Genève, Switzerland, 2020. [Google Scholar]
  65. Miller, B.R.; McGee, T.D.; Swails, J.M., Jr.; Homeyer, N.; Gohlke, H.; Roitberg, A.E. MMPBSA.py: An Efficient Program for End-State Free Energy Calculations. J. Chem. Theory Comput. 2012, 8, 3314–3321. [Google Scholar] [CrossRef] [PubMed]
  66. Hou, T.; Wang, J.; Li, Y.; Wang, W. Assessing the Performance of the MM/PBSA and MM/GBSA Methods. 1. The Accuracy of Binding Free Energy Calculations Based on Molecular Dynamics Simulations. J. Chem. Inf. Model. 2011, 51, 69–82. [Google Scholar] [CrossRef] [PubMed]
  67. Genheden, S.; Ryde, U. The MM/PBSA and MM/GBSA methods to estimate ligand-binding affinities, Expert Opin. Drug Discov. 2015, 10, 449–461. [Google Scholar]
Figure 1. Examples of azomethine derivatives with functionalized pyrazole rings with broad and potent biological activity.
Molecules 26 07435 g001
Figure 2. Representative azomethine derivatives with functionalized pyrazole rings with potent antifungal activity.
Molecules 26 07435 g002
Figure 3. General synthetic scheme for the preparation of novel azoimine-pyrazole derivatives.
Molecules 26 07435 g003
Figure 4. Atomic labeling used for NMR chemical shift assignment in the Azo1 to Azo4 series.
Molecules 26 07435 g004
Figure 5. Experimental (in black) and theoretical (in red) UV–Vis spectra for compounds Azo1 to Azo4.
Molecules 26 07435 g005
Figure 6. Molecular surfaces and energies for the HOMO and LUMO frontier orbitals in the gas phase molecules Azo1 to Azo4, calculated using the B3LYP/6-311++g(d,p) approximation level.
Molecules 26 07435 g006
Figure 7. Molecular packing diagrams in the unit cell of the Azo1 to Azo4 crystals. Hydrogen atoms are not shown.
Molecules 26 07435 g007
Figure 8. Molecular graphs for the Azo1 to Azo4 molecules as they appear in crystalline structures. Bond paths (pink lines), BCPs (red dots), RCPs (yellow dots), and CCPs (green dots).
Molecules 26 07435 g008
Figure 9. Percentages of inhibition of the compounds Azo1 to Azo2 as a function of the concentration against strains of fungi C. albicans (a) and C. neoformans (b).
Molecules 26 07435 g009
Figure 10. Docking score values obtained for azo1–azo4 ligand series evaluated against the molecular targets CaCYP51, CaTMPK, and CaNmt (top row), and CnFTase, CnHsp90, and CnAdSS (bottom row), using the Autodock Vina (left) and Smina (right) programs.
Molecules 26 07435 g010
Figure 11. MD results for CaTMPK complexes. (A) Protein backbone RMSD as a function of the time for each CaTMPK-ligand complex. (B) RMSF for each simulated CaTMPK-ligand complex. Contact frequencies are shown for Azo1 in green (C), for Azo2 in blue (D), for Azo3 in orange (E), and for Azo4 in yellow (F).
Molecules 26 07435 g011
Figure 12. MD results for CnAdSS complexes. (A) Protein backbone RMSD as a function of the time for each CnAdSS-ligand complex. (B) RMSF for each simulated CnAdSS-ligand complex. Contact frequencies are shown for Azo1 in green (C), for Azo2 in blue (D), for Azo3 in orange (E), and for Azo4 in yellow (F).
Molecules 26 07435 g012
Table 1. Selected experimental and calculated (B3LYP/6-311++g(d,p)) vibrational frequencies in the infrared spectra of new azoimine-pyrazole derivatives Azo1 to Azo4.
Vibrational ModeAzo1Azo2Azo3Azo4
ExpTheo%PED 1ExpTheo%PED 1ExpTheo%PED 1ExpTheo%PED 1
ν(OH)3440315299315999315799316999
ν(CH)pyrazole3127312499312231249931233125993120312699
ν(CH)aromatic3063306898306430679830653068983063306898
ν asym(CH3)2960296898296429749729652965992959296693
νsym(CH3)2862290397286129149628612903982863290099
ν(C=N)imine1598158359160415834516041580571605158041
νasym(NO2)152815235715291525751514151555
ν(N=N)azo1478147752147814835714781483651481148333
ρasym(CH3)1454144179145914408414601445811461146183
ν(CC)aromatic1435141434143214212614331436121435143530
ρsym(CH3)1358134559136213674413631340581367137424
νsym(NO2)135213206713521315561333130746
ν(CO)1281126442128512637712861259571279126260
1 Potential energy distribution percentages (%PDE) calculated using the VEDA 4 program [27].
Table 2. Experimental and theoretical (B3LYP/6-311++g(d,p)-SCRF) chemical shifts (in ppm) assignments for the 1H-NMR spectra of azoimine-pyrazole derivatives in acetone-d6 (Azo1) or DMSO-d6 (Azo2–Azo4) measured at room temperature.
Atom IDAzo1Azo2Azo3Azo4
ExpTheo 1ExpTheo 2ExpTheo 2ExpTheo 2
H-212.5812.4712.1012.5611.8712.47
H-106.756.656.706.616.756.716.776.57
H-tert-butyl1.391.721.251.611.321.641.351.60
H-tert-butyl1.391.111.251.591.321.621.351.55
H-tert-butyl1.391.461.251.581.321.601.351.55
H-tert-butyl1.391.441.251.541.321.551.351.53
H-tert-butyl1.391.311.251.311.321.391.351.36
H-tert-butyl1.391.271.251.271.321.371.351.32
H-tert-butyl1.391.161.251.251.321.191.351.16
H-tert-butyl1.391.141.251.221.321.191.351.16
H-tert-butyl1.391,121.251.071.321.161.351.14
H-277.697.72NANA8.638.198.037.85
H-297.567.658.088.297.557.798.378.65
H-317.457.697.777.918.188.49NANA
H-337.567.877.688.16NANA8.378.69
H-357.697.887.868.057.788.898.038.36
H-379.269.209.169.079.219.259.239.20
H-418.258.438.198.288.378.358.368.35
H-448.068.347.938.347.968.417.998.37
H-467.097.207.057.107.157.147.157.19
H-497.918.287.808.437.578.337.858.34
H-517.597.847.557.697.807.747.567.73
H-537.547.787.527.688.217.797.537.75
H-557.597.777.557.837.807.927.567.87
H-577.918.307.808.297.578.277.858.33
1 Values calculated using the PCM implicit solvent model in acetone-d6. 2 Values calculated using the PCM implicit solvent model in DMSO-d6. NA: not applicable.
Table 3. Experimental and theoretical (B3LYP/6-311++g(d,p)-SCRF) chemical shifts (in ppm) for the 13C-NMR spectra of azoimine-pyrazole derivatives in acetone-d6 (Azo1) or DMSO-d6 (Azo2–Azo4) measured at room temperature.
Atom IDAzo1Azo2Azo3Azo4
ExpTheo 1ExpTheo 2ExpTheo 2ExpTheo 2
C-8162.09169.08163.17172.14162.79170.24163.67171.60
C-991.1295.5291.5897.9192.7796.9493.5499.21
C-11147.35123.63151.92156.13149.66155.75150.35158.97
C-1234.6838.8032.4039.2432.8739.3832.8739.18
C-1329.7827.9130.2627,2830.3221.7730.4327.29
C-1729.7830.3930.2631.3230.3231.0130.4331.10
C-2129.7832.8230.2631.9430.3232.2330.4331.38
C-25139.33146.53145.38139.78139.76147.23144.44152.68
C-26124.95129.85149.27153.7130.95137.24124.1127.14
C-28129.21132.82125.39131.70131.41134.17125.07130.11
C-30127.62132.08129.48133.15121.44126.65145.49152.17
C-32129.21134.15125.68141.07147.97155.75125.07131.04
C-34124.95129.68134.06134.19118.25124.88124.1128.04
C-36164.03167.11161.18170.19162.2167.77161.25169.36
C-38163.12171.70162.29172.04160.14172.24162.56172.60
C-39119.17124.62120.59123.07120.96123.90121.41123.46
C-40128.42122.93125.92145.62125.21145.37125.62145.85
C-42145.69151.65145.12152.22145.08152.04145.64152.17
C-43127.49145.25128.00125.64128.24125.43128.35125.86
C-45117.76121.24118.09122.05118.23122.33118.21122.56
C-47152.87158.53153.51159.13151.93158.73152.35158.97
C-48122.44139.40122.68117.85129.94117.32122.82117.48
C-50129.02134.21129.89134.27130.89133.73129.9134.09
C-52130.54137.40131.53137.18129.84137.48131.55137.42
C-54129.02133.53129.89134.55130.89134.24129.9134.09
C-56122.44117.47122.68139.78129.94139.21122.82117.48
1 Values calculated using the PCM implicit solvent model in acetone-d6.2 Values calculated using the PCM implicit solvent model in DMSO-d6.
Table 4. Amount and type (ω,σ) of critical points detected on the ρ topology of the Azo1 to Azo4 molecules as they appear in the crystalline package and their corresponding Poincaré–Hopf relationship (PHR).
Molecule(3,−3)(3,−1)(3,+1)(3,+3)TotalPHR
Azo15761501231
Azo25966911351
Azo35964601291
Azo45964601291
Table 5. ΔGbind (kcal/mol) for the best couplings ligand–protein using Azo1 to Azo4 derivatives and molecular targets obtained from C. albicans and C. neoformans fungus species.
MoleculeC. albicansC. neoformans
CaTMPKCaNmTCnFTaseCnAdSS
Azo1−35.882−33.111−15.183−31.599
Azo2−37.317−33.627−15.484−33.300
Azo3−48.055−43.832−19.861−41.357
Azo4−37.658−32.734−12.993−42.273
Publisher’s Note: MDPI stays neutral with regard to jurisdictional claims in published maps and institutional affiliations.

