
Characterization of Key Odorants in Scallion Pancake and Investigation on Their Changes during Storage


Abstract
:
1. Introduction
2. Results and Discussion
2.1. Potent Odor Compounds of SP
2.2. Quantitative Analysis and Determination of Key Odorants by OAVs
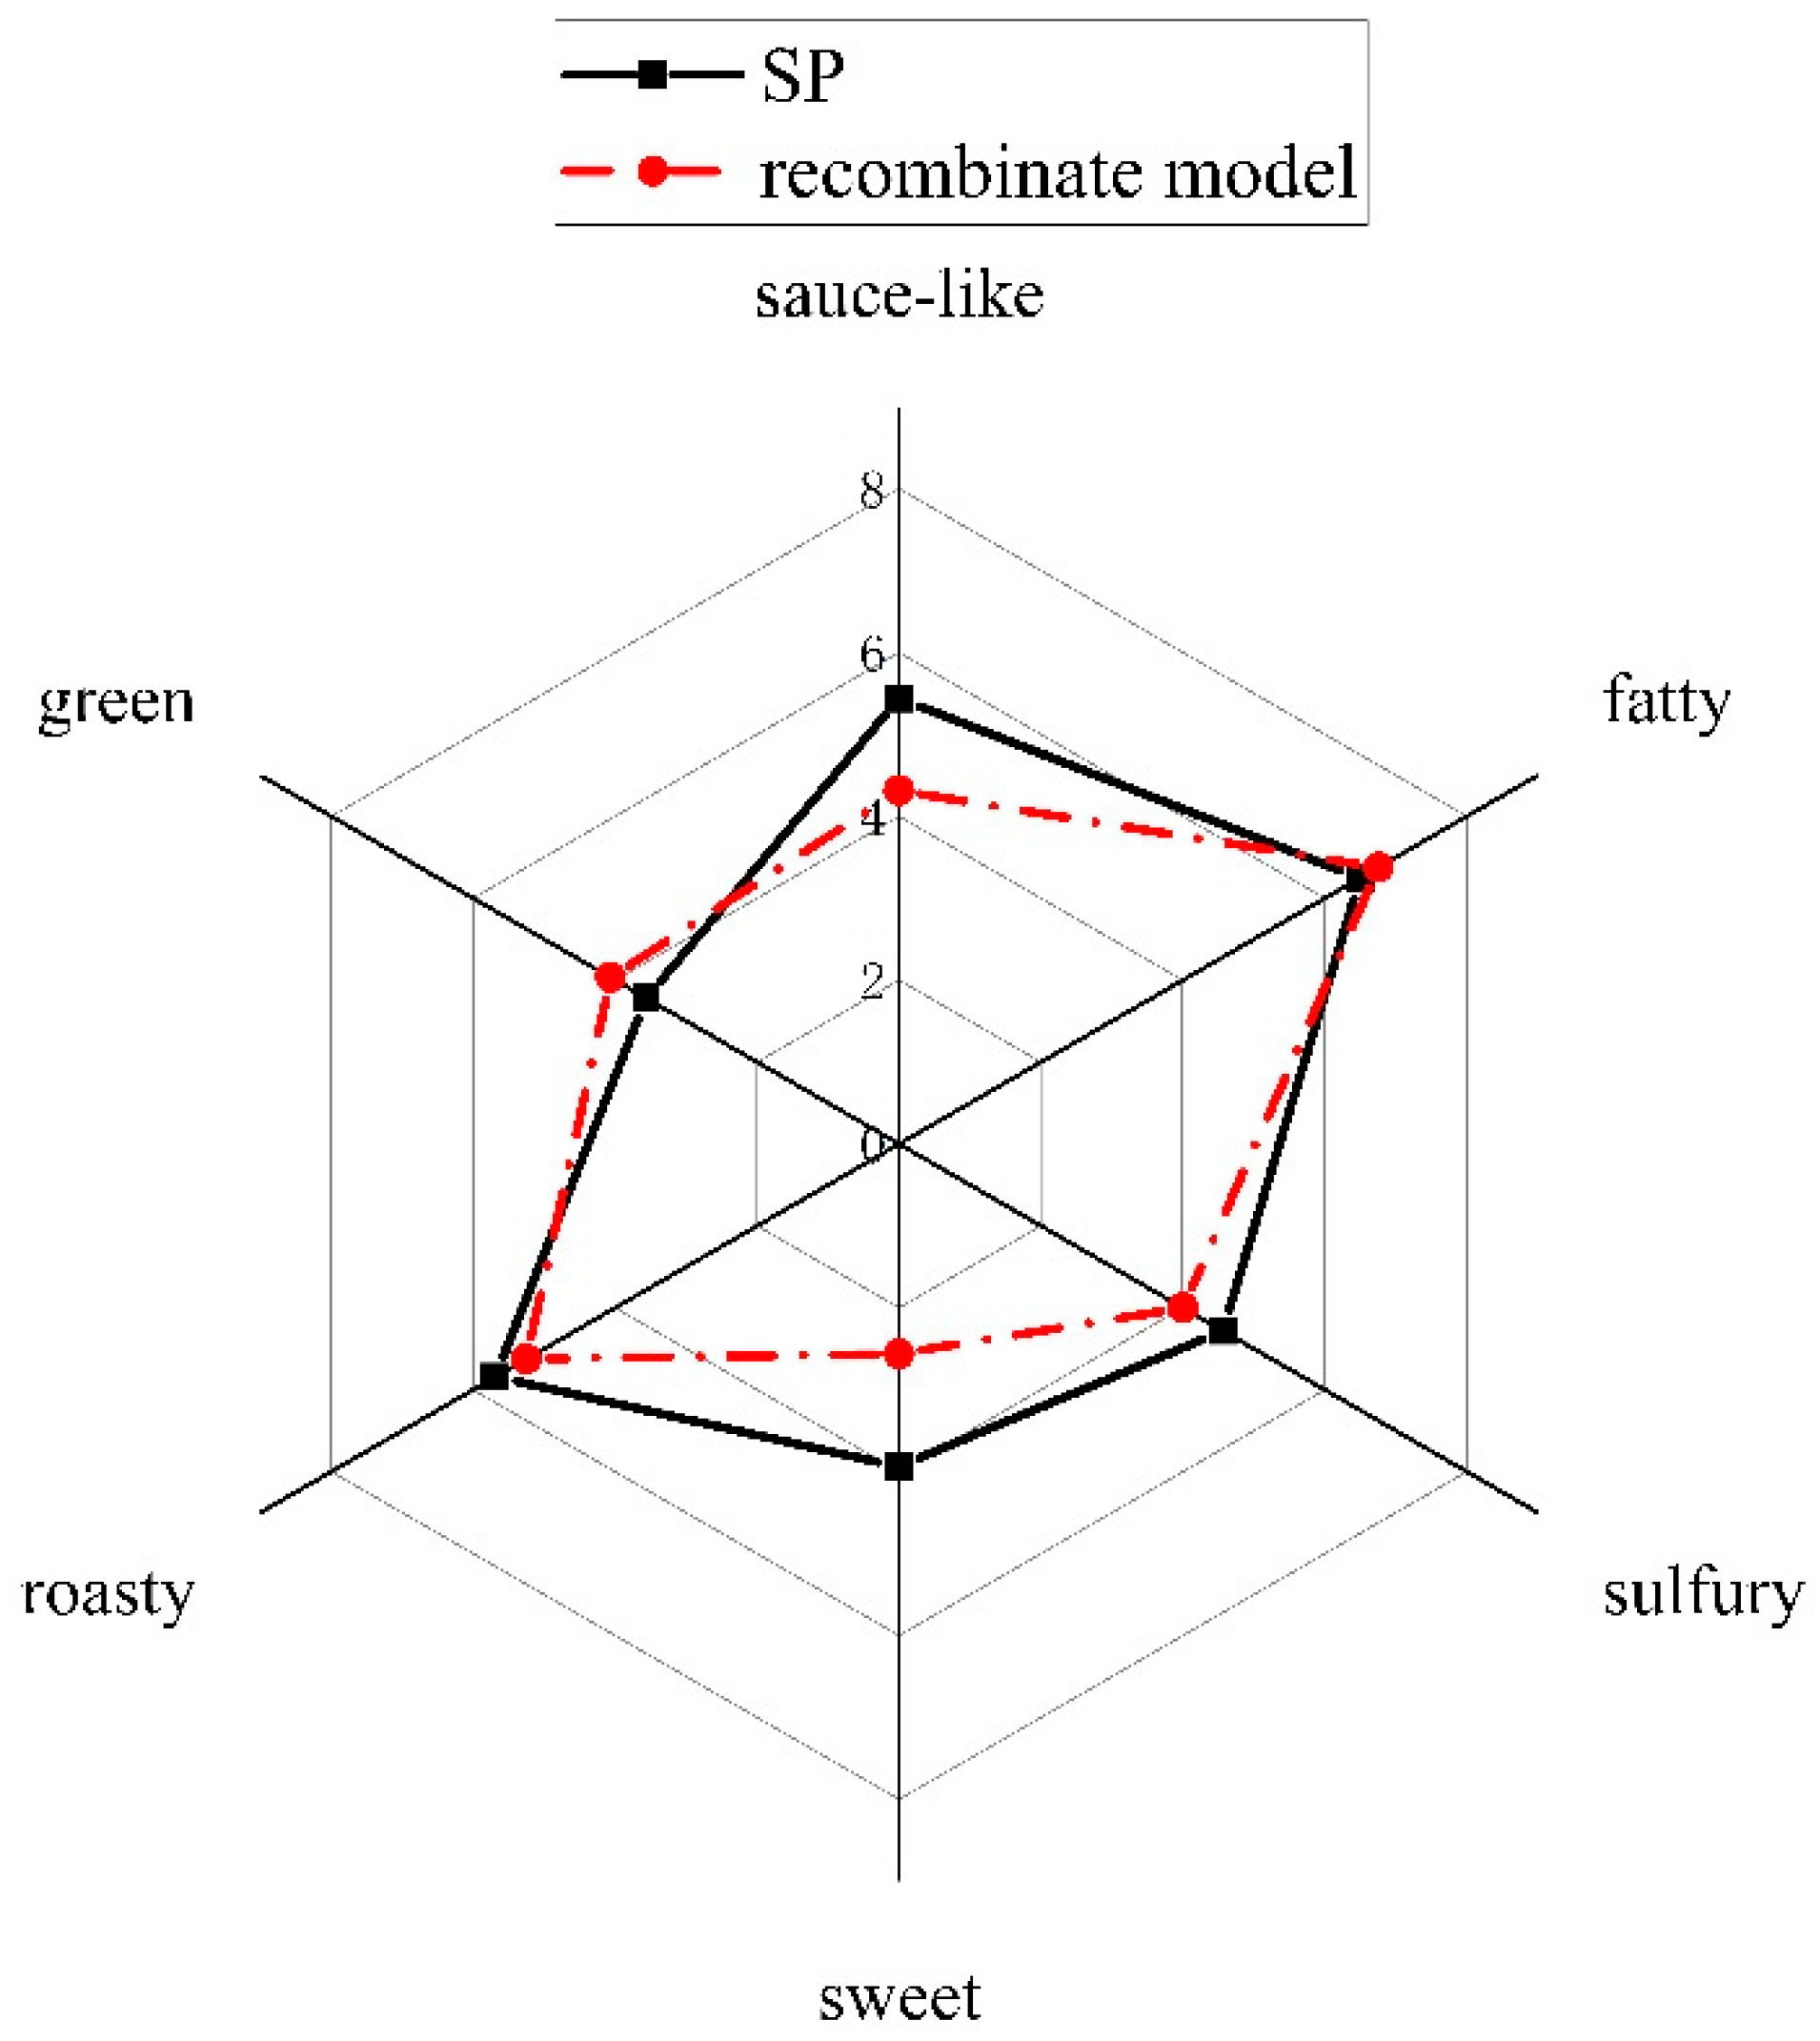
2.3. Recombination
2.4. Changes of Aroma Compounds during Storage
3. Materials and Methods
3.1. Materials
3.2. Chemicals
3.3. Isolation of Volatiles from SP by Direct Solvent Extraction−Solvent Assisted Flavor Evaporation (DSE-SAFE)
3.4. Analysis of Aroma-Active Compounds in SP
3.4.1. GC-MS Analysis
3.4.2. GC-FID-O Analysis
3.4.3. Identification of Aroma-Active Compound
3.4.4. Aroma Extract Dilution Analysis (AEDA)
3.4.5. Quantitation of Odor-Active Compounds
3.5. Quantitative Descriptive Analysis (QDA)
3.6. Measurement of Odor Detection Threshold in Water and Calculation of Odor Active Value (OAV)
3.7. Aroma Recombination
3.8. Determination of Changes of Odorant Concentrations and OAVs during Storage
3.9. Statistical Analysis
4. Conclusions
Supplementary Materials
Author Contributions
Funding
Institutional Review Board Statement
Informed Consent Statement
Data Availability Statement
Conflicts of Interest
Sample Availability
References
- Shiferaw, B.; Smale, M.; Braun, H.-J.; Duveiller, E.; Reynolds, M.; Muricho, G. Crops that feed the world 10. Past successes and future challenges to the role played by wheat in global food security. Food Secur. 2013, 5, 291–317. [Google Scholar] [CrossRef] [Green Version]
- El Gataa, Z.; El Hanafi, S.; El Messoadi, K.; Samir, K.; Kehel, Z.; Tadesse, W. Genome wide association and prediction studies of agronomic and quality traits in spring beard wheat (Triticum aestivum L.) under rain-fed environment with terminal moisture stress. J. Cereal Sci. 2021, 101, 103278. [Google Scholar] [CrossRef]
- Yuan-Hui, W.; Yue-Ying, Y.; Hao-Qi, L.; Qi-Dong, Z.; Fei, X.; Zhi-Jian, L. Characterization of aroma-active compounds in steamed breads fermented with Chinese traditional sourdough. LWT Food Sci. Technol. 2021, 152, 112347. [Google Scholar]
- Chaokun, W.; Yuhui, Z.; Dunhua, L.; Weiyi, Z.; Yuan, W.; Yue, D.; Shiyao, L. Effect of chicken fat shortening on sensory quality, flavor and staling of bread. Food Sci. 2017, 38, 101–106. [Google Scholar]
- Rui, L.; Solah, V.A.; Yimin, W.; Guiling, W.; Xulin, W.; Crosbie, G.; Fenton, H. Sensory evaluation of Chinese white salted noodles and steamed bread made with Australian and Chinese wheat flour. Cereal Chem. 2019, 96, 66–75. [Google Scholar]
- Bi, S.; Wang, A.; Lao, F.; Shen, Q.; Liao, X.; Zhang, P.; Wu, J. Effects of frying, roasting and boiling on aroma profiles of adzuki beans (Vigna angularis) and potential of adzuki bean and millet flours to improve flavor and sensory characteristics of biscuits. Food Chem. 2021, 339, 127878. [Google Scholar] [CrossRef]
- Boeswetter, A.R.; Scherf, K.A.; Schieberle, P.; Koehler, P. Identification of the Key Aroma Compounds in Gluten-Free Rice Bread. J. Agric. Food Chem. 2019, 67, 2963–2972. [Google Scholar] [CrossRef]
- Yuanhui, W.; Jingwen, Z.; Fei, X.; Xiaoyun, W.; Wenxuan, H.; Yongfeng, C.; Lanlan, Z.; Jie, C.; Changhong, L. GC-MS, GC-O and OAV analyses of key aroma compounds in Jiaozi Steamed Bread. Grain Oil Sci. Technol. 2020, 3, 9–17. [Google Scholar]
- Pico, J.; Bernal, J.; Gomez, M. Wheat bread aroma compounds in crumb and crust: A review. Food Res. Int. 2015, 75, 200–215. [Google Scholar] [CrossRef]
- Rohleder, A.R.; Scherf, K.A.; Schieberle, P.; Koehler, P. Quantitative Analyses of Key Odorants and Their Precursors Reveal Differences in the Aroma of Gluten-Free Rice Bread and Wheat Bread. J. Agric. Food Chem. 2019, 67, 11179–11186. [Google Scholar] [CrossRef]
- Kuo, M.C.; Ho, C.T. Volatile constituents of the distilled oils of Welsh onions (Allium fistulosum L. variety Maichuon) and scallions (Allium fistulosum L. variety Caespitosum). J. Agric. Food Chem. 1992, 40, 111–117. [Google Scholar] [CrossRef]
- Kuo, M.C.; Chien, M.J.; Ho, C.T. Novel polysulfides identified in the volatile components from Welsh onions (Allium fistulosum L. var. maichuon) and scallions (Allium fistulosum L. var. caespitosum). J. Agric. Food Chem. 1990, 38, 1378–1381. [Google Scholar] [CrossRef]
- Ghoshal, G.; Shivhare, U.S.; Banerjee, U.C. Effect of Xylanase on Quality Attributes of Whole-wheat bread. J. Food Quality 2013, 36, 172–180. [Google Scholar] [CrossRef]
- Su, D.-M.; He, M.; Qian, P.; Li, L.-T. Effects of glycerol on quality and storing characteristics of wheat bread. J. Henan Univ. Technol. (Nat. Sci. Ed.) 2007, 28, 1–4. [Google Scholar]
- Rinaldi, M.; Paciulli, M.; Dall’Asta, C.; Cirlini, M.; Chiavaro, E. Short-term storage evaluation of quality and antioxidant capacity in chestnut-wheat bread. J. Sci. Food Agr. 2015, 95, 59–65. [Google Scholar] [CrossRef]
- Jensen, S.; Oestdal, H.; Clausen, M.R.; Andersen, M.L.; Skibsted, L.H. Oxidative stability of whole wheat bread during storage. LWT Food Sci. Technol. 2011, 44, 637–642. [Google Scholar] [CrossRef]
- Mengmei, M.; Taihua, M.; Liang, Z. Identification of saprophytic microorganisms and analysis of changes in sensory, physicochemical, and nutritional characteristics of potato and wheat steamed bread during different storage periods. Food Chem. 2021, 348, 128927. [Google Scholar]
- Pico, J.; Martinez, M.M.; Bernal, J.; Gomez, M. Impact of frozen storage time on the volatile profile of wheat bread crumb. Food Chem. 2017, 232, 185–190. [Google Scholar] [CrossRef] [PubMed]
- Steinhaus, P.; Schieberle, P. Characterization of the key aroma compounds in soy sauce using approaches of molecular sensory science. J. Agric. Food Chem. 2007, 55, 6262–6269. [Google Scholar] [CrossRef]
- Schoenauer, S.; Schieberle, P. Characterization of the Key Aroma Compounds in the Crust of Soft Pretzels by Application of the Sensomics Concept. J. Agric. Food Chem. 2019, 67, 7110–7119. [Google Scholar] [CrossRef]
- Liu, X.; Wang, S.; Tamogami, S.; Chen, J.; Zhang, H. Volatile Profile and Flavor Characteristics of Ten Edible Oils. Anal. Lett. 2021, 54, 1423–1438. [Google Scholar] [CrossRef]
- Liu, Y.; Li, J.; Cheng, Y.; Liu, Y. Volatile components of deep-fried soybean oil as indicator indices of lipid oxidation and quality degradation. Eur. Food Res. Technol. 2020, 246, 1183–1192. [Google Scholar] [CrossRef]
- Krafft, C.; Brennecke, S.; Ott, F.; Backes, M.; Salzer, R.; Grunenberg, J.; Ley, J.P.; Krammer, G.E.; Weber, B. High-impact sulfur compounds: Constitutional and configurational assignment of sulfur-containing heterocycles. Chem. Biodivers. 2008, 5, 1204–1212. [Google Scholar] [CrossRef] [PubMed]
- Pu, D.; Zhang, H.; Zhang, Y.; Sun, B.; Ren, F.; Chen, H. Characterization of the key aroma compounds in white bread by aroma extract dilution analysis, quantitation, and sensory evaluation experiments. J. Food Process. Pres. 2019, 43, 13933. [Google Scholar] [CrossRef]
- Izzreen, M.; Hansen, A.S.; Petersen, M.A. Volatile compounds in whole meal bread crust: The effects of yeast level and fermentation temperature. Food Chem. 2016, 210, 566–576. [Google Scholar] [CrossRef]
- Tian, P.; Zhan, P.; Tian, H.; Wang, P.; Lu, C.; Zhao, Y. Effects of different vegetable oils on the aroma characteristics of deep-fried shallot flavoring evaluated by HS-SPME/GC-MS coupled with PLSR. J. Food Process. Pres. 2020, 44, 14698. [Google Scholar] [CrossRef]
- Ning, Z.; Baoguo, S.; Xueying, M.; Haitao, C.; Yuyu, Z. Flavor formation in frying process of green onion (Allium fistulosum L.) deep-fried oil. Food Res. Int. 2019, 121, 296–306. [Google Scholar]
- Pfannhauser, W. Volatiles formed during extrusion cooking of cereals. Flavour Fragrance J. 1993, 8, 109–113. [Google Scholar] [CrossRef]
- Sevindik, O.; Amanpour, A.; Sarhir, S.T.; Kelebek, H.; Selli, S. Characterization of Key Odorants in Moroccan Argan Oil by Aroma Extract Dilution Analysis. Eur. J. Lipid Sci. Technol. 2019, 121, 1800437. [Google Scholar] [CrossRef]
- Hye Min, S.; Kwang Jee, J. Volatile flavour compounds of freeze dried garlic and garlic roasted with oils. J. Korean Soc. Food Sci. Nutr. 2007, 36, 332–341. [Google Scholar]
- Pare, P.W.; Tumlinson, J.H. Plant volatiles as a defense against insect herbivores. Plant. Physiol. 1999, 121, 325–331. [Google Scholar] [CrossRef] [Green Version]
- Holse, M.; Petersen, M.A.; Maruatona, G.N.; Hansen, A. Headspace volatile composition and oxidative storage stability of pressed marama bean (Tylosema esculentum) oil. Food Chem. 2012, 132, 1749–1758. [Google Scholar] [CrossRef]
- Lee, J.; Bousquieres, J.; Descharles, N.; Roux, S.; Michon, C.; Rega, B.; Bonazzi, C. Potential of model cakes to study reaction kinetics through the dynamic online extraction of volatile markers and TD-GC-MS analysis. Food Res. Int. 2020, 132, 109087. [Google Scholar] [CrossRef] [PubMed]
- Czerny, M.; Schieberle, P. Important aroma compounds in freshly ground wholemeal and white wheat flour—Identifidation and quantitative changes during sourdough fermentation. J. Agric. Food Chem. 2002, 50, 6835–6840. [Google Scholar] [CrossRef] [PubMed]
- Poinot, P.; Arvisenet, G.; Grua-Priol, J.; Fillonneau, C.; Le-Bail, A.; Prost, C. Influence of inulin on bread: Kinetics and physico-chemical indicators of the formation of volatile compounds during baking. Food Chem. 2010, 119, 1474–1484. [Google Scholar] [CrossRef]
- Kaczmarska, K.T.; Chandra-Hioe, M.V.; Frank, D.; Arcot, J. Enhancing wheat muffin aroma through addition of germinated and fermented Australian sweet lupin (Lupinus angustifolius L.) and soybean (Glycine max L.) flour. LWT Food Sci. Technol. 2018, 96, 205–214. [Google Scholar] [CrossRef]
- Kawakami, M.; Himizu, K. Volatile components and antioxidative activity of tempeh. Koryo 2006, 230, 109–118. [Google Scholar]
- Kubec, R.; Drhova, V.; Velisek, J. Volatile compounds thermally generated from S-propylcysteine and S-propylcysteine sulfoxide aroma precursors of Allium vegetables. J. Agric. Food Chem. 1999, 47, 1132–1138. [Google Scholar] [CrossRef]
- Andriamaharavo, N.R. Retention Data; NIST Mass Spectrometry Data Center: Gaithersburg, MD, USA. Available online: Webbook.nist.gov/cgi/cbook.cgi?Source=2014AND%2319410M&Units=SI&Mask=2000 (accessed on 10 December 2021).
- Flaig, M.; Granvogl, M. Evaluation of chiral heterocyclic key aroma compounds in cooked Allium-varieties—A case study regarding organoleptic and quantitative characteristics. Abstr. Pap. Am. Chem. Soc. 2016, 252, 282. [Google Scholar]
- Zhou, Q.; Jia, X.; Yao, Y.-Z.; Wang, B.; Wei, C.-Q.; Zhang, M.; Huang, F. Characterization of the Aroma-Active Compounds in Commercial Fragrant Rapeseed Oils via Monolithic Material Sorptive Extraction. J. Agric. Food Chem. 2019, 67, 11454–11463. [Google Scholar] [CrossRef]
- Block, E.; Naganathan, S.; Putman, D.; Zhao, S.H. Allium Chemistry—HPLC Analysis of Thiosulfinates from Onion, Garlic, Wild Garlic (Ramsoms), Leek, Scallion, Shallot, Elephant (Great-Headed) Garlic, Chive, and Chinese Chive—Uniquely High Allyl to Methyl Ratios in Some Garlic Samples. J. Agric. Food Chem. 1992, 40, 2418–2430. [Google Scholar] [CrossRef]
- Chyau, C.C.; Mau, J.L. Effects of various oils on volatile compounds of deep-fried shallot flavouring. Food Chem. 2001, 74, 41–46. [Google Scholar] [CrossRef]
- Czerny, M.; Christlbauer, M.; Christlbauer, M.; Fischer, A.; Granvogl, M.; Hammer, M.; Hartl, C.; Hernandez, N.M.; Schieberle, P. Re-investigation on odour thresholds of key food aroma compounds and development of an aroma language based on odour qualities of defined aqueous odorant solutions. Eur. Food Res. Technol. 2008, 228, 265–273. [Google Scholar] [CrossRef]
- Van Gemert, L.J. Compilations of Odour Threshold Values in Air, Water and Other Media; Oliemans Punter & Partners BV: Amsterdam, The Netherlands, 2011. [Google Scholar]
- Vandendool, H.; Kratz, P.D. A generalization of the retention index system including linear temperature programmed gas-liquid partition chromatography. J. Chromatogr. 1963, 11, 463–471. [Google Scholar] [CrossRef]


| No. | Compounds | LRI | Odor Descriptions c | FD d | Identification e | |
|---|---|---|---|---|---|---|
| DB-WAX a | HP-5MS b | |||||
| Alcohols | ||||||
| 1 | 2-methyl-2-butanol | 1008 | - f | pungent | 256 | MS, RI, O, S |
| 2 | 3-penten-2-ol | 1179 | 782 | green | 2 | MS, RI, O |
| 3 | pentanol | 1259 | 771 | fusel, sweet | 2 | MS, RI, O, S |
| 4 | (E)-2-hexenol | 1294 | 859 | green, fresh | ˂2 g | MS, RI, O |
| 5 | hexanol | 1362 | 868 | green, fruity | ˂2 | MS, RI, O, S |
| 6 | 1-octen-3-ol | 1459 | 983 | mushroom, green | 4 | MS, RI, O, S |
| 7 | (E)-2-octenol | 1626 | 1062 | green, citrus | 2 | MS, RI, O, S |
| 8 | 2-furanmethanol | 1670 | 863 | sweet, caramellic | 128 | MS, RI, O, S |
| 9 | benzyl alcohol | 1892 | 1041 | floral, rose | ˂2 | MS, RI, O, S |
| 10 | phenethyl alcohol | 1932 | 1122 | floral, rose | 4 | MS, RI, O, S |
| Aldehydes | ||||||
| 11 | hexanal | 1093 | 805 | green, aldehyde-like | 64 | MS, RI, O, S |
| 12 | 3-methyl-2-butenal | 1202 | 787 | fruity, sweet | 128 | MS, RI, O, S |
| 13 | nonanal | 1401 | 1105 | aldehyde, soapy | ˂2 | MS, RI, O, S |
| 14 | (E)-2-octenal | 1439 | 1057 | fresh, cucumber-like | 4 | MS, RI, O, S |
| 15 | furfural | 1470 | 838 | sweet, roasted | 8 | MS, RI, O, S |
| 16 | benzaldehyde | 1538 | 962 | nutty, almond | 2048 | MS, RI, O, S |
| 17 | (E,E)-2,4-decadienal | 1827 | 1316 | fatty | 2048 | MS, RI, O, S |
| 18 | 2-formylpyrrole | 2044 | - | musty, beefy | ˂2 | MS, RI, O, S |
| 19 | 5-hydroxymethylfurfural | 2519 | 1231 | fatty, buttery | 4 | MS, RI, O, S |
| 20 | vanillin | 2588 | 1399 | sweet, vanilla | 64 | MS, RI, O, S |
| Ketones | ||||||
| 21 | acetoin | 1289 | 716 | sweet, creamy | 64 | MS, RI, O, S |
| 22 | acetol | 1302 | - | sweet, caramellic | ˂2 | MS, RI, O, S |
| 23 | cyclopentenone | 1364 | 805 | roasted | 512 | MS, RI, O, S |
| 24 | 2(5H)-furanone | 1771 | 921 | buttery | 32 | MS, RI, O, S |
| 25 | maltol | 1988 | 1116 | sweet, buttery | 4096 | MS, RI, O, S |
| 26 | 1-(2-furanyl)-2-hydroxyethanone | 2027 | 1082 | sweet | ˂2 | MS, RI, O |
| 27 | 2-pyrrolidinone | 2064 | - | pungent | ˂2 | MS, RI, O, S |
| Lactones | ||||||
| 28 | γ-butyrolactone | 1643 | 913 | creamy, caramellic | 1024 | MS, RI, O, S |
| 29 | (±)-pantolactone | 2048 | 1038 | cotton | ˂2 | MS, RI, O, S |
| 30 | dihydro-4-hydroxy-2(3H)-furanone | 2619 | 1173 | sweet, creamy | 32 | MS, RI, O, S |
| Acids | ||||||
| 31 | acetic acid | 1454 | - | sour | ˂2 | MS, RI, O, S |
| 32 | pentanoic acid | 1755 | 890 | sour, sweaty | 2 | MS, RI, O, S |
| 33 | hexanoic acid | 1858 | 1022 | sour, fatty | 2 | MS, RI, O, S |
| 34 | heptanoic acid | 1976 | 1086 | rancid, cheese | ˂2 | MS, RI, O |
| 35 | octanoic acid | 2088 | 1172 | fatty, waxy | 2 | MS, RI, O, S |
| 36 | nonanoic acid | 2197 | 1287 | waxy, cheese | 2 | MS, RI, O, S |
| Sulfides | ||||||
| 37 | methyl propyl disulfide | 1240 | 933 | sulfury, onion-like | 4096 | MS, RI, O, S |
| 38 | dipropyl disulfide | 1389 | 1107 | sulfury, alliaceous | 4096 | MS, RI, O, S |
| 39 | dimethyl trisulfide | 1390 | 968 | sulfury, sauce-like | 256 | MS, RI, O, S |
| 40 | methyl propyl trisulfide | 1544 | 1151 | sulfury, garlic-like | 128 | MS, RI, O |
| 41 | dimethyl sulfoxide | 1590 | 852 | oily | 256 | MS, RI, O, S |
| 42 | dipropyl trisulfide | 1689 | 1329 | sulfury, garlic-like | 512 | MS, RI, O, S |
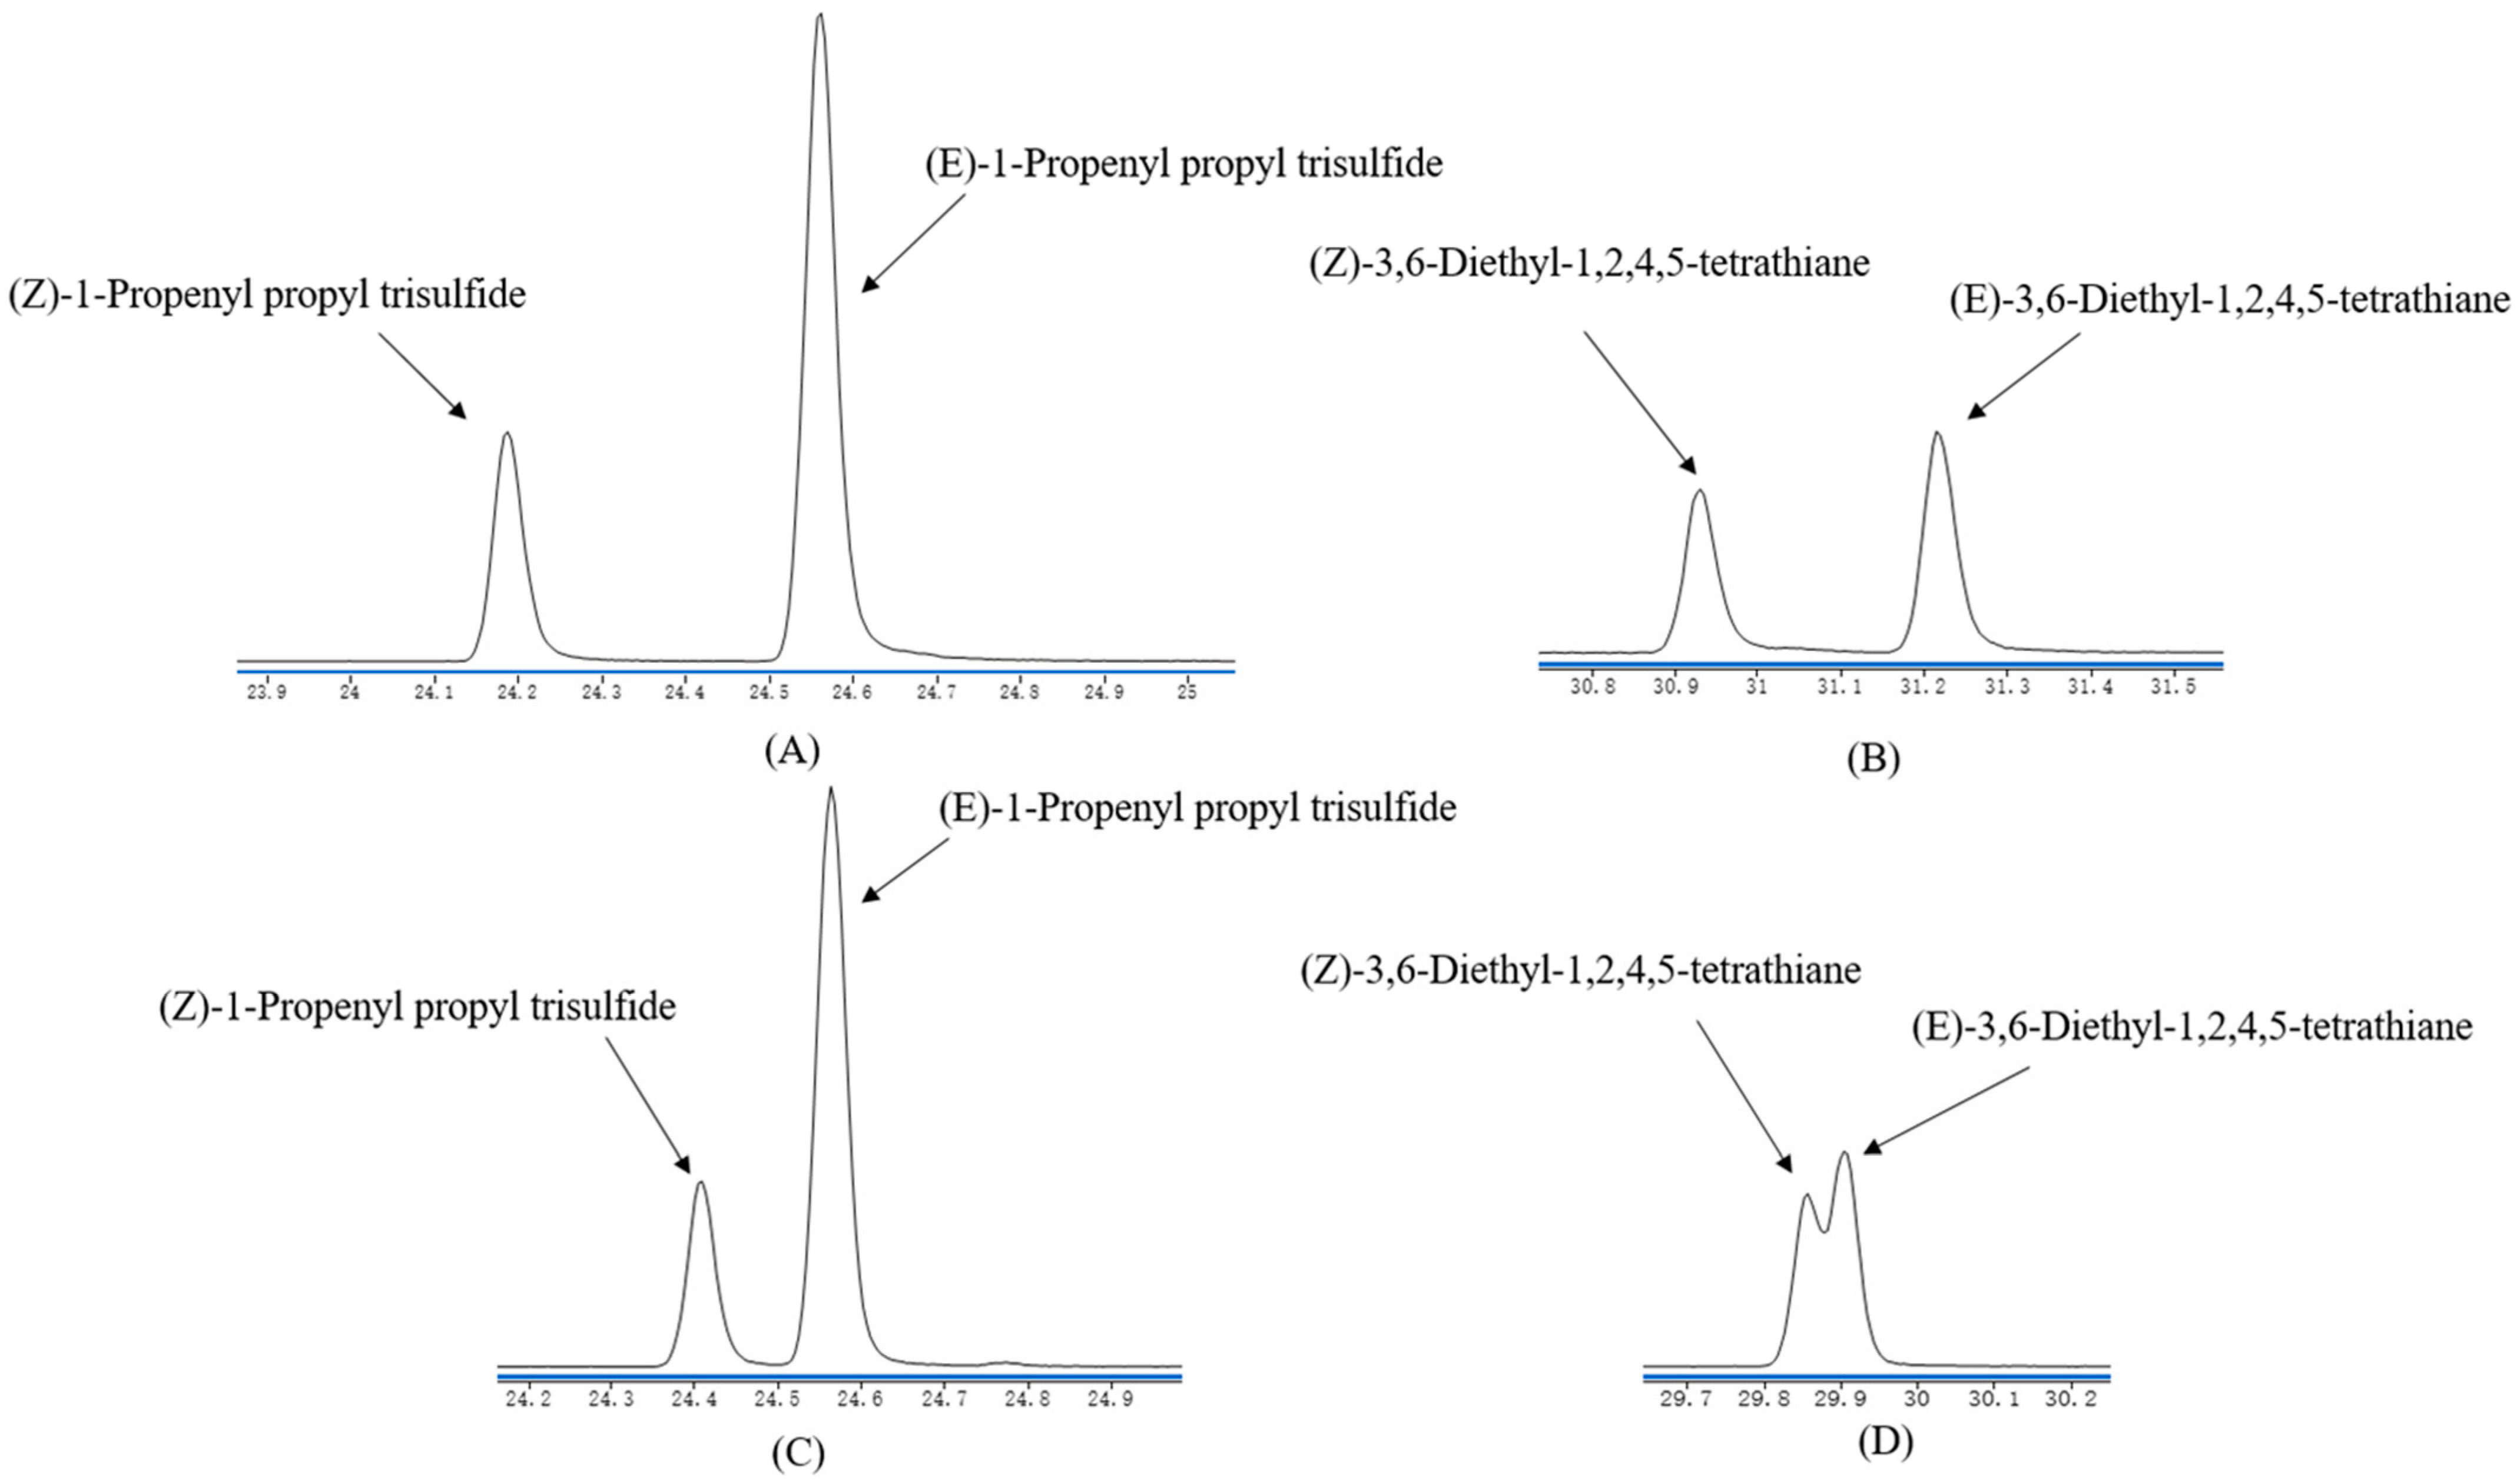
| 43 | (Z)-1-propenyl propyl trisulfide | 1797 | 1336 | sulfury, onion-like | 64 | MS, RI, O, S |
| 44 | (E)-1-propenyl propyl trisulfide | 1818 | 1344 | sulfury, onion-like | 128 | MS, RI, O, S |
| 45 | dimethyl sulfone | 1914 | 926 | sulfury, burnt | 512 | MS, RI, O, S |
| 46 | (Z)-3,6-diethyl-1,2,4,5-tetrathiane | 2217 | 1587 | sulfury, onion-like, sweet, salty | 32 | MS, RI, O, S |
| 47 | (E)-3,6-diethyl-1,2,4,5-tetrathiane | 2235 | 1592 | sulfury, onion-like, sweet, salty | 64 | MS, RI, O, S |
| Others | ||||||
| 48 | pyrazine | 1215 | 731 | sweet, roasted | 128 | MS, RI, O, S |
| 49 | 2-pentylfuran | 1240 | 996 | green, earthy | 4096 | MS, RI, O, S |
| 50 | unknown | 1424 | - | sulfury, onion-like | 128 | - |
| 51 | unknown | 1456 | - | sulfury | 256 | - |
| 52 | naphthalene | 1760 | 1178 | pungent, tarry | 4 | MS, RI, O |
| 53 | 2-methylnaphthalene | 1874 | 1311 | floral, woody | 64 | MS, RI, O, S |
| No. | Compounds | Quantitative ions (m/z) | Slope a | R2 | Concentration (μg/kg) b |
|---|---|---|---|---|---|
| 1 | 2-methyl-2-butanol | 73 | 0.6120 | 0.997 | 12.41 ± 0.07 |
| 8 | 2-furanmethanol | 98 | 0.3591 | 0.995 | 1119 ± 8.09 |
| 11 | hexanal | 72 | 0.0592 | 0.992 | 553.03 ± 39.16 |
| 12 | 3-methyl-2-butenal | 83 | 0.2151 | 0.998 | 13.37 ± 1.04 |
| 15 | furfural | 96 | 0.7631 | 0.994 | 144.13 ± 0.05 |
| 16 | benzaldehyde | 106 | 0.9063 | 0.999 | 131.79 ± 0.29 |
| 17 | (E,E)-2,4-decadienal | 152 | 0.0911 | 1.000 | 164.46 ± 0.37 |
| 20 | vanillin | 152 | 1.3559 | 0.998 | 34.72 ± 0.32 |
| 21 | acetoin | 88 | 0.1120 | 1.000 | 177.9 ± 1.76 |
| 23 | cyclopentenone | 82 | 0.7047 | 0.998 | 67.68 ± 0.7 |
| 24 | 2(5H)-furanone | 84 | 0.2358 | 0.997 | 1642.24 ± 62.49 |
| 25 | maltol | 126 | 0.5552 | 0.995 | 5073.26 ± 20.19 |
| 28 | γ-butyrolactone | 86 | 0.1726 | 0.998 | 217.78 ± 2.77 |
| 30 | dihydro-4-hydroxy-2(3H)-furanone | 102 | 0.0623 | 0.997 | 1244.31 ± 20.75 |
| 37 | methyl propyl disulfide | 122 | 0.2886 | 0.995 | 28.9 ± 0.14 |
| 38 | dipropyl disulfide | 150 | 0.8402 | 0.996 | 35.56 ± 0.19 |
| 39 | dimethyl trisulfide | 126 | 1.1960 | 0.991 | 29.77 ± 0.26 |
| 41 | dimethyl sulfoxide | 78 | 0.5521 | 0.996 | 264.31 ± 2.5 |
| 42 | dipropyl trisulfide | 182 | 1.1046 | 0.990 | 9.92 ± 0.14 |
| 45 | dimethyl sulfone | 94 | 0.5662 | 0.994 | 120.34 ± 0.71 |
| 48 | pyrazine | 80 | 1.2723 | 0.995 | 41.12 ± 0.1 |
| 49 | 2-pentylfuran | 138 | 0.4601 | 0.998 | 19.65 ± 0.06 |
| 53 | 2-methylnaphthalene | 142 | 1.4490 | 0.992 | 16.93 ± 0.02 |
| No. | Compound | Concentration (μg/kg) | DOT a | OAV |
|---|---|---|---|---|
| 17 | (E,E)-2,4-decadienal | 164.46 | 0.027 b | 6091 |
| 39 | dimethyl trisulfide | 29.77 | 0.0099 b | 3007 |
| 37 | methyl propyl disulfide | 28.90 | 0.107 c | 270 |
| 11 | hexanal | 553.03 | 2.4 b | 230 |
| 42 | dipropyl trisulfide | 9.92 | 0.19 c | 52 |
| 25 | maltol | 5073.26 | 210 d | 24 |
| 21 | acetoin | 177.90 | 14 d | 13 |
| 53 | 2-methylnaphthalene | 16.93 | 3 d | 6 |
| 49 | 2-pentylfuran | 19.65 | 5.8 d | 3 |
| 24 | 2(5H)-furanone | 1642.24 | 714 c | 2 |
| 20 | vanillin | 34.72 | 53 d | ˂1 |
| 41 | dimethyl sulfoxide | 264.31 | 552.6 c | ˂1 |
| 30 | dihydro-4-hydroxy-2(3H)-furanone | 1266.84 | 3741 c | ˂1 |
| 38 | dipropyl disulfide | 35.56 | 130 d | ˂1 |
| 8 | 2-furanmethanol | 1119.00 | 4500 d | ˂1 |
| 16 | benzaldehyde | 131.79 | 750 d | ˂1 |
| 45 | dimethyl sulfone | 120.34 | 2158 c | ˂1 |
| 15 | furfural | 144.13 | 9562 d | ˂1 |
| 1 | 2-methyl-2-butanol | 12.41 | 20,000 d | ˂1 |
| 48 | pyrazine | 41.12 | 300,000 d | ˂1 |
| 28 | γ-butyrolactone | 217.78 | ˃1000 d | ˂1 |
| No. | Compound | Concentration (μg/kg) at Different Storage Time a | ||||
|---|---|---|---|---|---|---|
| 1 Month | 3 Months | 10 Months | 12 Months | 14 Months | ||
| 1 | 2-methyl-2-butanol | 12.41 ± 0.07a b | 11.76 ± 0.13b | 7.39 ± 0.08c | 9.69 ± 0.1d | 4.24 ± 0.04e |
| 8 | 2-furanmethanol | 1119 ± 8.09b | 1501.91 ± 15.73a | 237.55 ± 2.93d | 128.12 ± 3.39e | 1049.3 ± 13.85c |
| 11 | hexanal | 553.03 ± 39.16e *c | 1693.5 ± 16.6d * | 4668.21 ± 62.38c * | 18,618.34 ± 141.94b * | 24,307.34 ± 52.02a * |
| 12 | 3-methyl-2-butenal | 13.37 ± 1.04c | 8.63 ± 0.11cd | 8.5 ± 0.25d | 20.32 ± 4.47b | 37.46 ± 0.16a |
| 15 | furfural | 144.13 ± 0.05c | 171.9 ± 0.68a | 62.44 ± 0.44e | 97.37 ± 0.63d | 157.2 ± 2.91b |
| 16 | benzaldehyde | 131.79 ± 0.29d | 225.13 ± 0.42c | 133.42 ± 2.47d | 233.06 ± 1.62b | 322.99 ± 0.48a |
| 17 | (E,E)-2,4-decadienal | 164.46 ± 0.37b * | 175.19 ± 1.11a * | 55.54 ± 0.93e * | 97.83 ± 0.89d * | 160.07 ± 0.86c * |
| 20 | vanillin | 34.72 ± 0.32e | 95.86 ± 1.27c * | 46.17 ± 0.49d | 137.47 ± 2.85a * | 132.16 ± 0.71b * |
| 21 | acetoin | 177.9 ± 1.76d * | 292.22 ± 16.33c * | 114.4 ± 1.2e * | 353.62 ± 2.93a * | 337.72 ± 0.66b * |
| 23 | cyclopentenone | 67.68 ± 0.7e | 297.5 ± 0.53d | 347.1 ± 12.21c | 948.02 ± 5.22a | 403.15 ± 14.95b |
| 24 | 2(5H)-furanone | 1642.24 ± 62.49b * | 1996.08 ± 73.88a * | 663.38 ± 10.61d | 1262.45 ± 25.04c * | 1902.13 ± 7.01a * |
| 25 | maltol | 5073.26 ± 20.19d * | 7433.15 ± 17.67c * | 5072.21 ± 38.55d * | 8839.38 ± 484.83b * | 18,963.44 ± 119.53a * |
| 28 | γ-butyrolactone | 217.78 ± 2.77d | 387.77 ± 0.91b | 216.32 ± 2.04d | 329.89 ± 1.37c | 443.5 ± 2.01a |
| 30 | dihydro-4-hydroxy-2(3H)-furanone | 1244.31 ± 20.75b | 2223.08 ± 77.41a | 1043.69 ± 7.9c | 686.75 ± 9.46d | 1306.51 ± 11.56b |
| 37 | methyl propyl disulfide | 28.9 ± 0.14d * | 54.41 ± 0.25b * | 24.16 ± 0.18e * | 40.98 ± 0.01c * | 102.15 ± 0.89a * |
| 38 | dipropyl disulfide | 35.56 ± 0.19d | 109.25 ± 1.51c | 14.02 ± 0.2e | 146.3 ± 0.28b * | 282.7 ± 1.73a * |
| 39 | dimethyl trisulfide | 29.77 ± 0.26c * | 45.91 ± 0.46b * | 17.45 ± 0.16e * | 22.83 ± 0.08d * | 69.42 ± 0.71a * |
| 41 | dimethyl sulfoxide | 264.31 ± 2.5c | 479.97 ± 0.92b | 264.99 ± 2.58c | 688.51 ± 7.7a * | 686.37 ± 3.39a * |
| 42 | dipropyl trisulfide | 9.92 ± 0.14d * | 21.59 ± 0.41c * | 4.5 ± 0.13e * | 28.46 ± 0.44b * | 99.08 ± 1.6a * |
| 45 | dimethyl sulfone | 120.34 ± 0.71c | 173.55 ± 3.55b | 101.55 ± 4.38d | 172.68 ± 11.89b | 198.12 ± 1.14a |
| 48 | pyrazine | 41.12 ± 0.1d | 62.42 ± 1.86c | 36.8 ± 0.25e | 67.34 ± 0.38b | 85.24 ± 0.41a |
| 49 | 2-pentylfuran | 19.65 ± 0.06d * | 37.45 ± 0.35a * | 8.69 ± 0.08e * | 25.15 ± 1.12b * | 23.39 ± 0.82c * |
| 53 | 2-methylnaphthalene | 16.93 ± 0.02b * | 12.36 ± 0.14b * | 13.5 ± 0.3c * | 25.22 ± 0.02a * | 11.03 ± 0.08e * |
| No. | Compound | OAV at Different Storage Time | ||||
|---|---|---|---|---|---|---|
| 1 Month | 3 Months | 10 Months | 12 Months | 14 Months | ||
| 11 | hexanal | 230 | 706 | 1945 | 7758 | 10,128 |
| 17 | (E,E)-2,4-decadienal | 6091 | 6488 | 2057 | 3623 | 5929 |
| 20 | vanillin | ˂1 | 2 | ˂1 | 3 | 2 |
| 21 | acetoin | 13 | 21 | 8 | 25 | 24 |
| 24 | 2(5H)-furanone | 2 | 3 | ˂1 | 2 | 3 |
| 25 | maltol | 24 | 35 | 24 | 42 | 90 |
| 37 | methyl propyl disulfide | 270 | 509 | 226 | 383 | 955 |
| 38 | dipropyl disulfide | ˂1 | ˂1 | ˂1 | 1 | 2 |
| 39 | dimethyl trisulfide | 3007 | 4638 | 1763 | 2306 | 7012 |
| 41 | dimethyl sulfoxide | ˂1 | ˂1 | ˂1 | 1 | 1 |
| 42 | dipropyl trisulfide | 52 | 114 | 24 | 150 | 521 |
| 49 | 2-pentylfuran | 3 | 6 | 1 | 4 | 4 |
| 53 | 2-methylnaphthalene | 6 | 4 | 5 | 8 | 4 |
| total | 9699 | 12,515 | 6053 | 14,306 | 24,676 | |
Publisher’s Note: MDPI stays neutral with regard to jurisdictional claims in published maps and institutional affiliations. |
© 2021 by the authors. Licensee MDPI, Basel, Switzerland. This article is an open access article distributed under the terms and conditions of the Creative Commons Attribution (CC BY) license (https://creativecommons.org/licenses/by/4.0/).
Share and Cite
Liu, B.; Xu, S.; Dong, Z.; Liu, Y.; Wei, X.; Shao, D. Characterization of Key Odorants in Scallion Pancake and Investigation on Their Changes during Storage. Molecules 2021, 26, 7647. https://0-doi-org.brum.beds.ac.uk/10.3390/molecules26247647
Liu B, Xu S, Dong Z, Liu Y, Wei X, Shao D. Characterization of Key Odorants in Scallion Pancake and Investigation on Their Changes during Storage. Molecules. 2021; 26(24):7647. https://0-doi-org.brum.beds.ac.uk/10.3390/molecules26247647
Chicago/Turabian StyleLiu, Binshan, Shiqi Xu, Zhizhong Dong, Yuping Liu, Xiaoming Wei, and Danqing Shao. 2021. "Characterization of Key Odorants in Scallion Pancake and Investigation on Their Changes during Storage" Molecules 26, no. 24: 7647. https://0-doi-org.brum.beds.ac.uk/10.3390/molecules26247647