
Behaviour of Extractives in Norway Spruce (Picea abies) Bark during Pile Storage

 and
and
Abstract
:1. Introduction
2. Results and Discussion
2.1. Overview of the Change in the Chemical Composition of Bark during Storage
2.1.1. Change in Total Dissolved Solids
The Effect of Storage Time
The Effect of Sampling Location
The Effect of Snow Cover
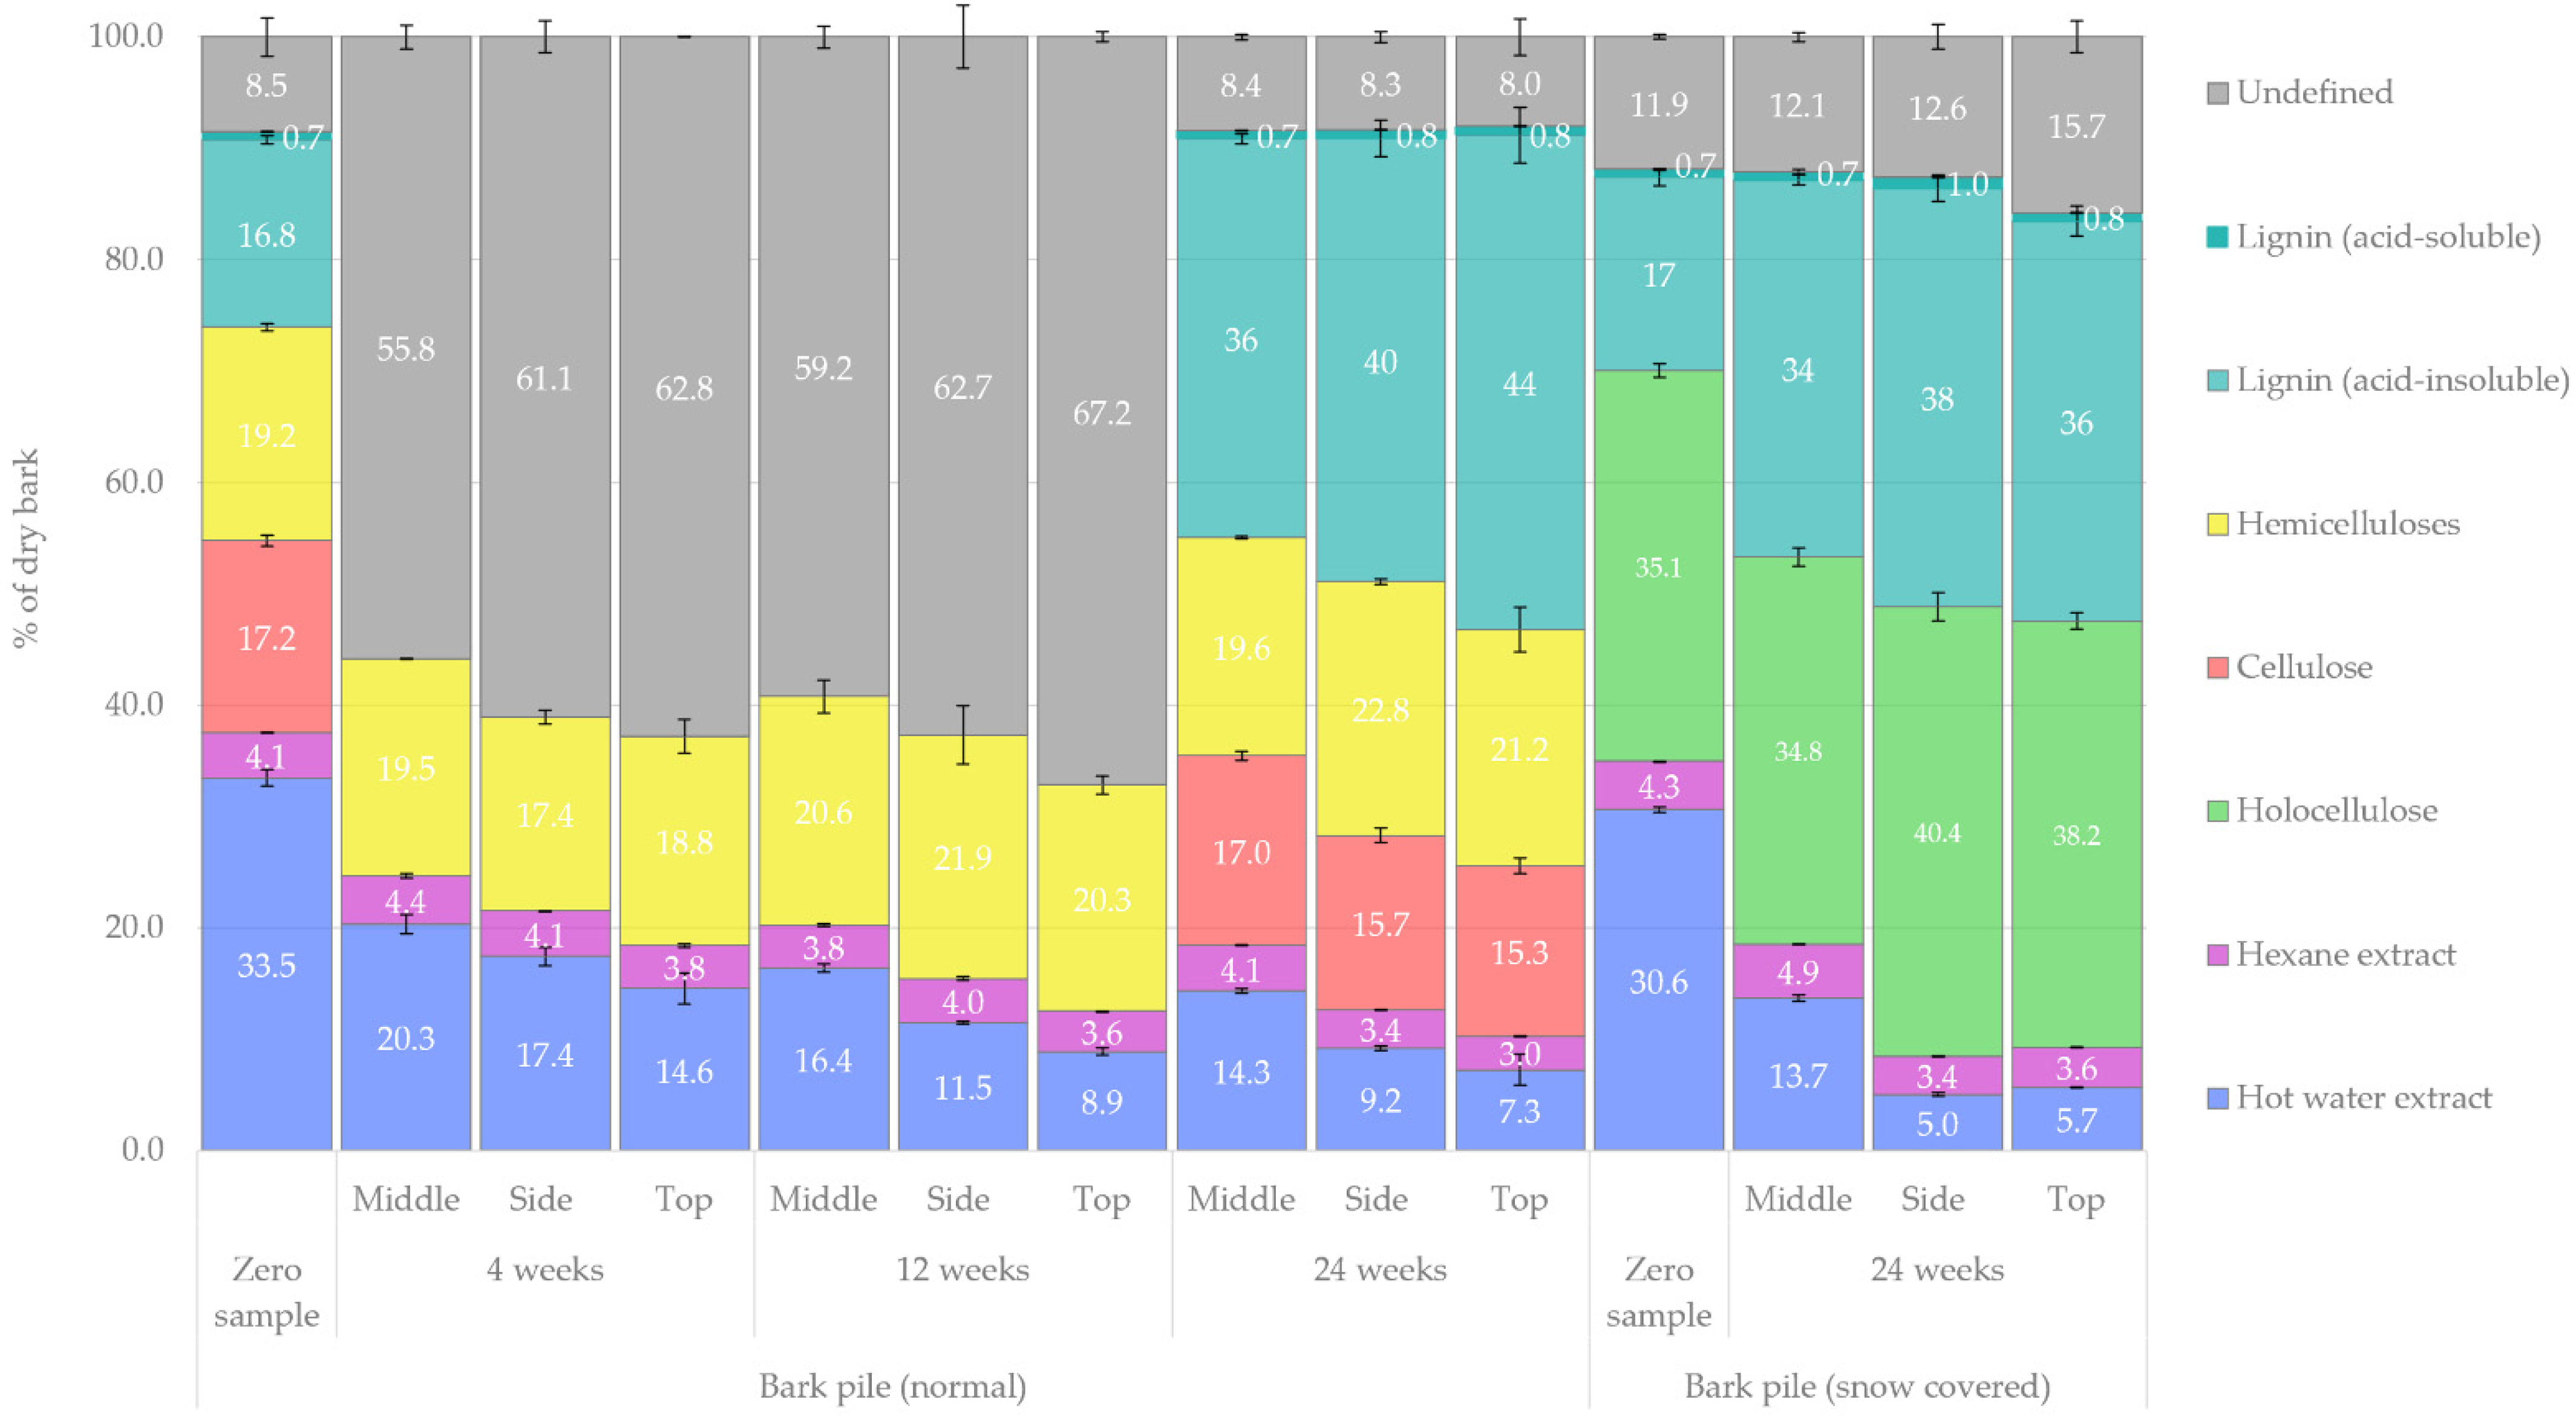
2.1.2. Changes in Carbohydrates and Lignin
2.2. Biofuel Properties of Stored Bark
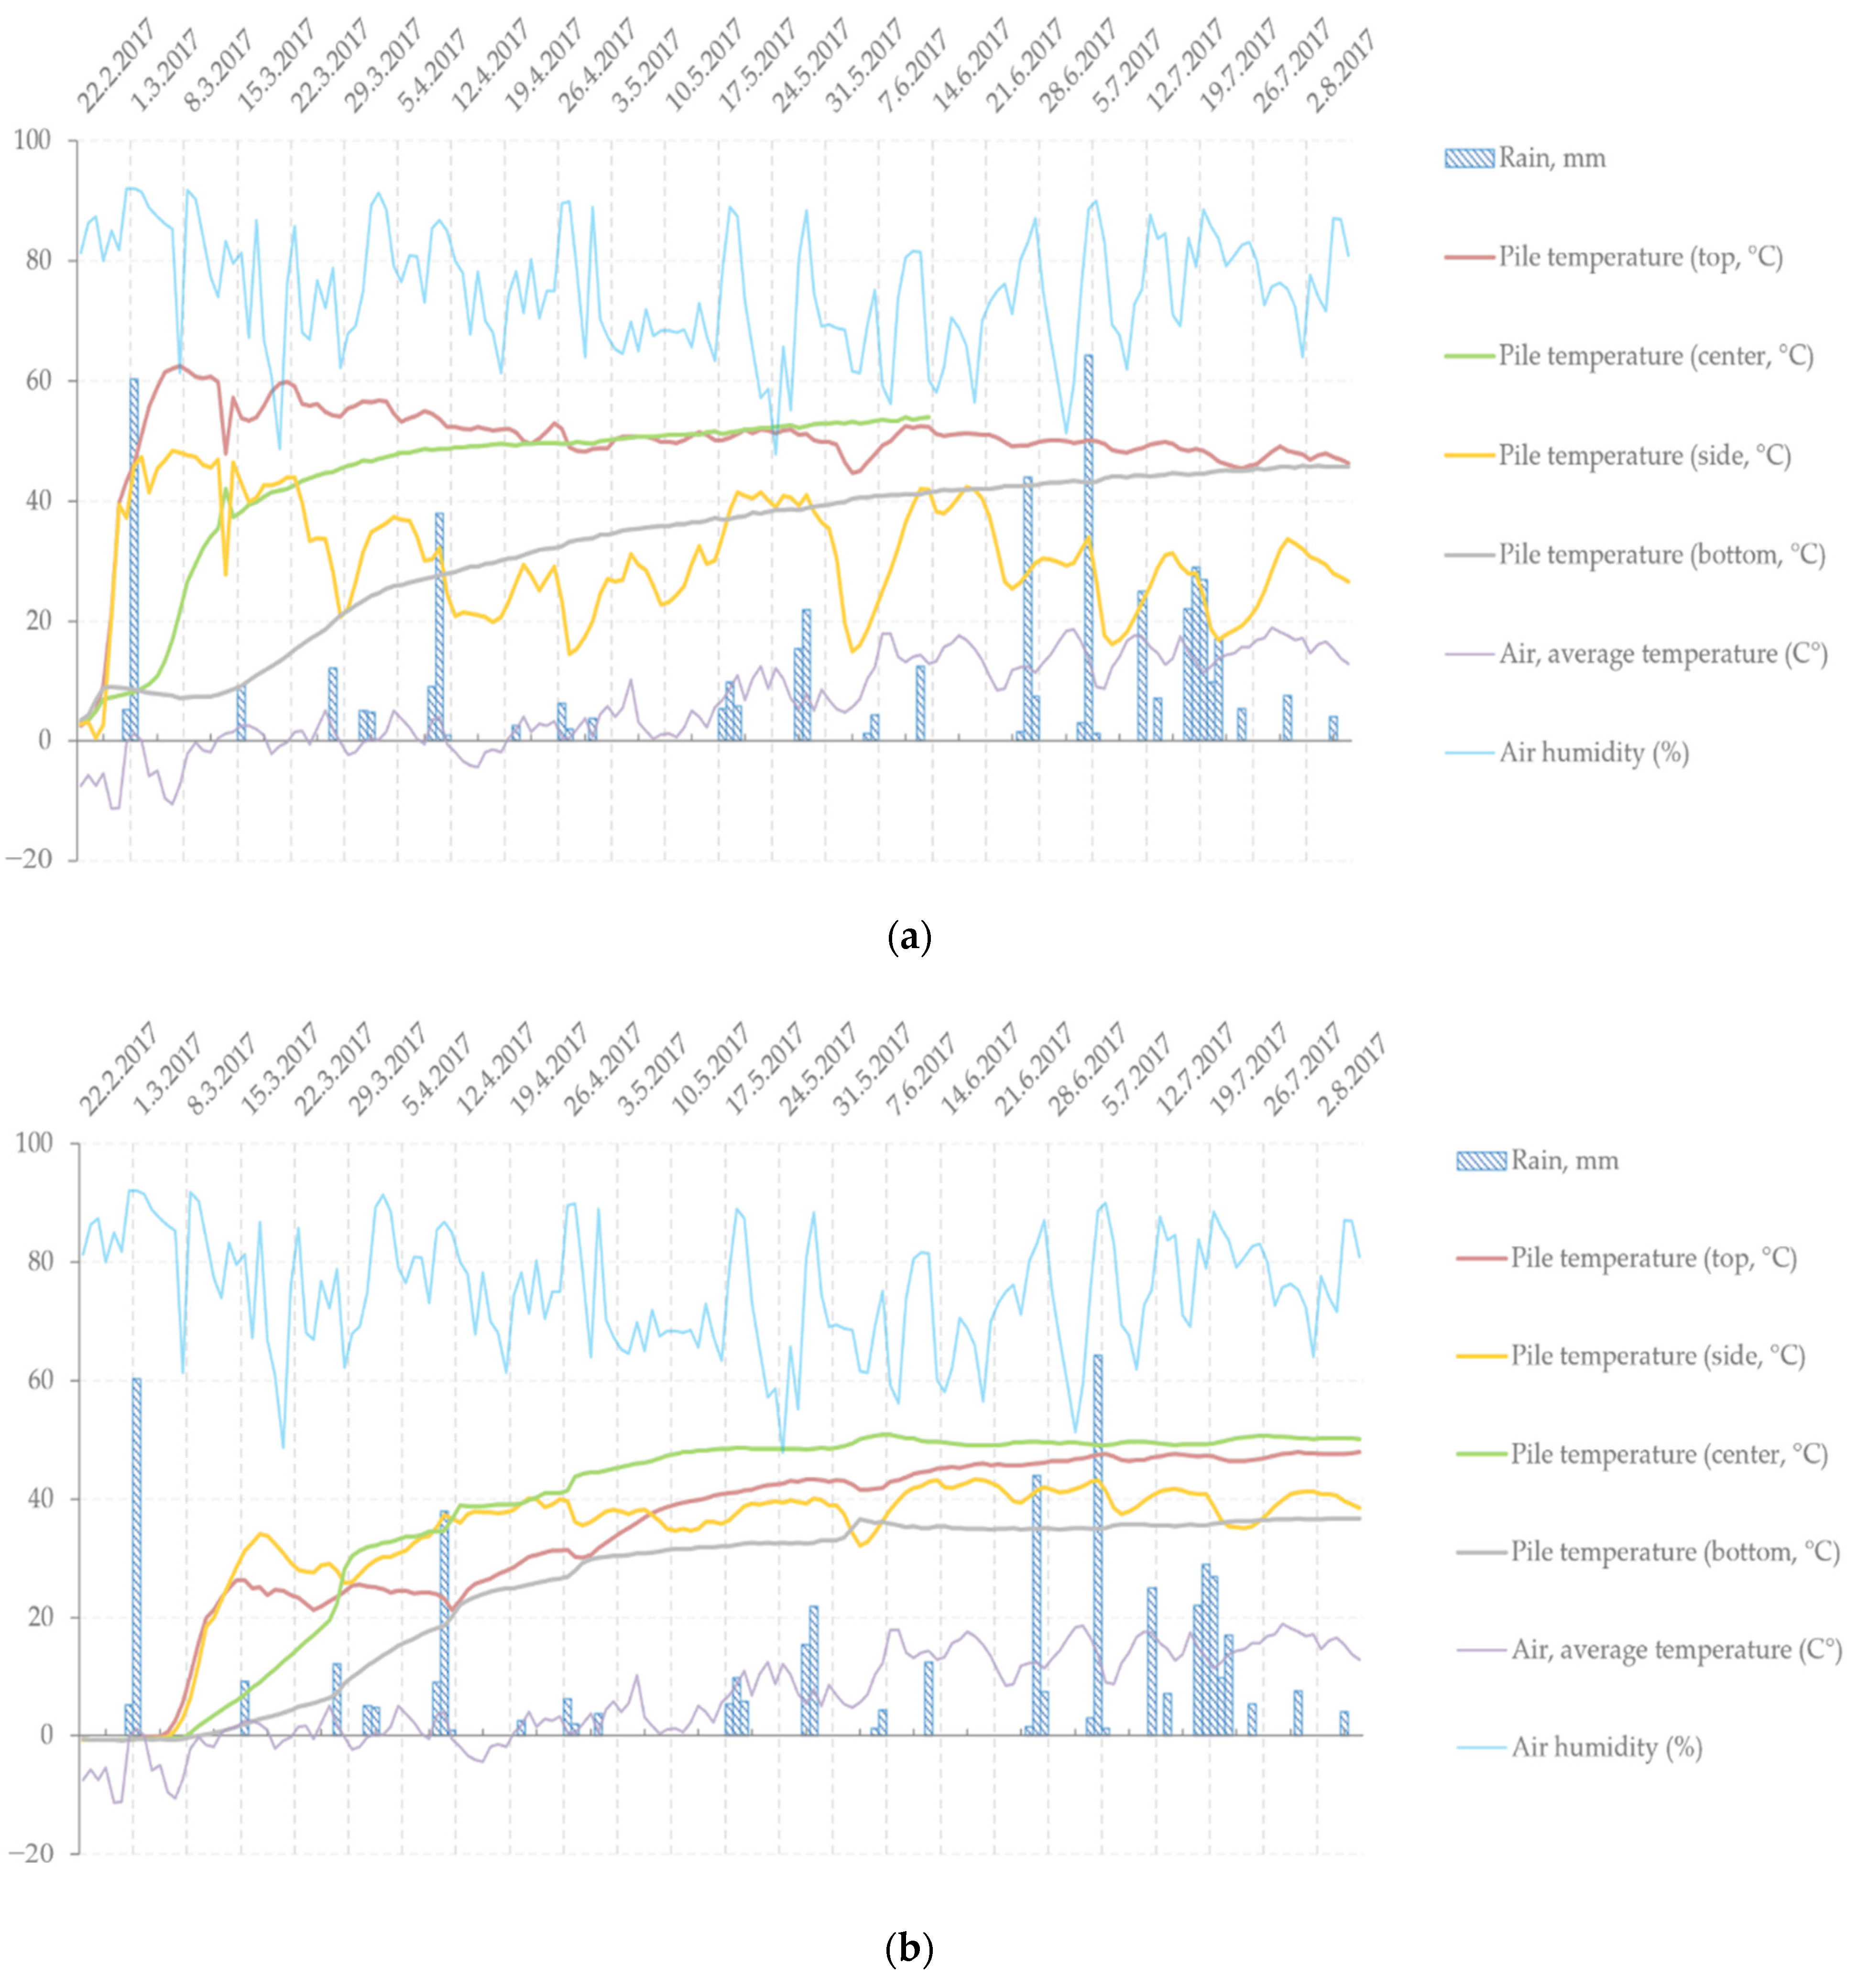
2.2.1. Temperature Development Inside Bark Piles
2.2.2. Heating Values of Stored Bark
2.3. Qualitative and Quantitative Results for Bark Extracts Obtained by Gas Chromatography with a Flame Ionisation Detector/Mass Selective Detector (GC-FID/MS)
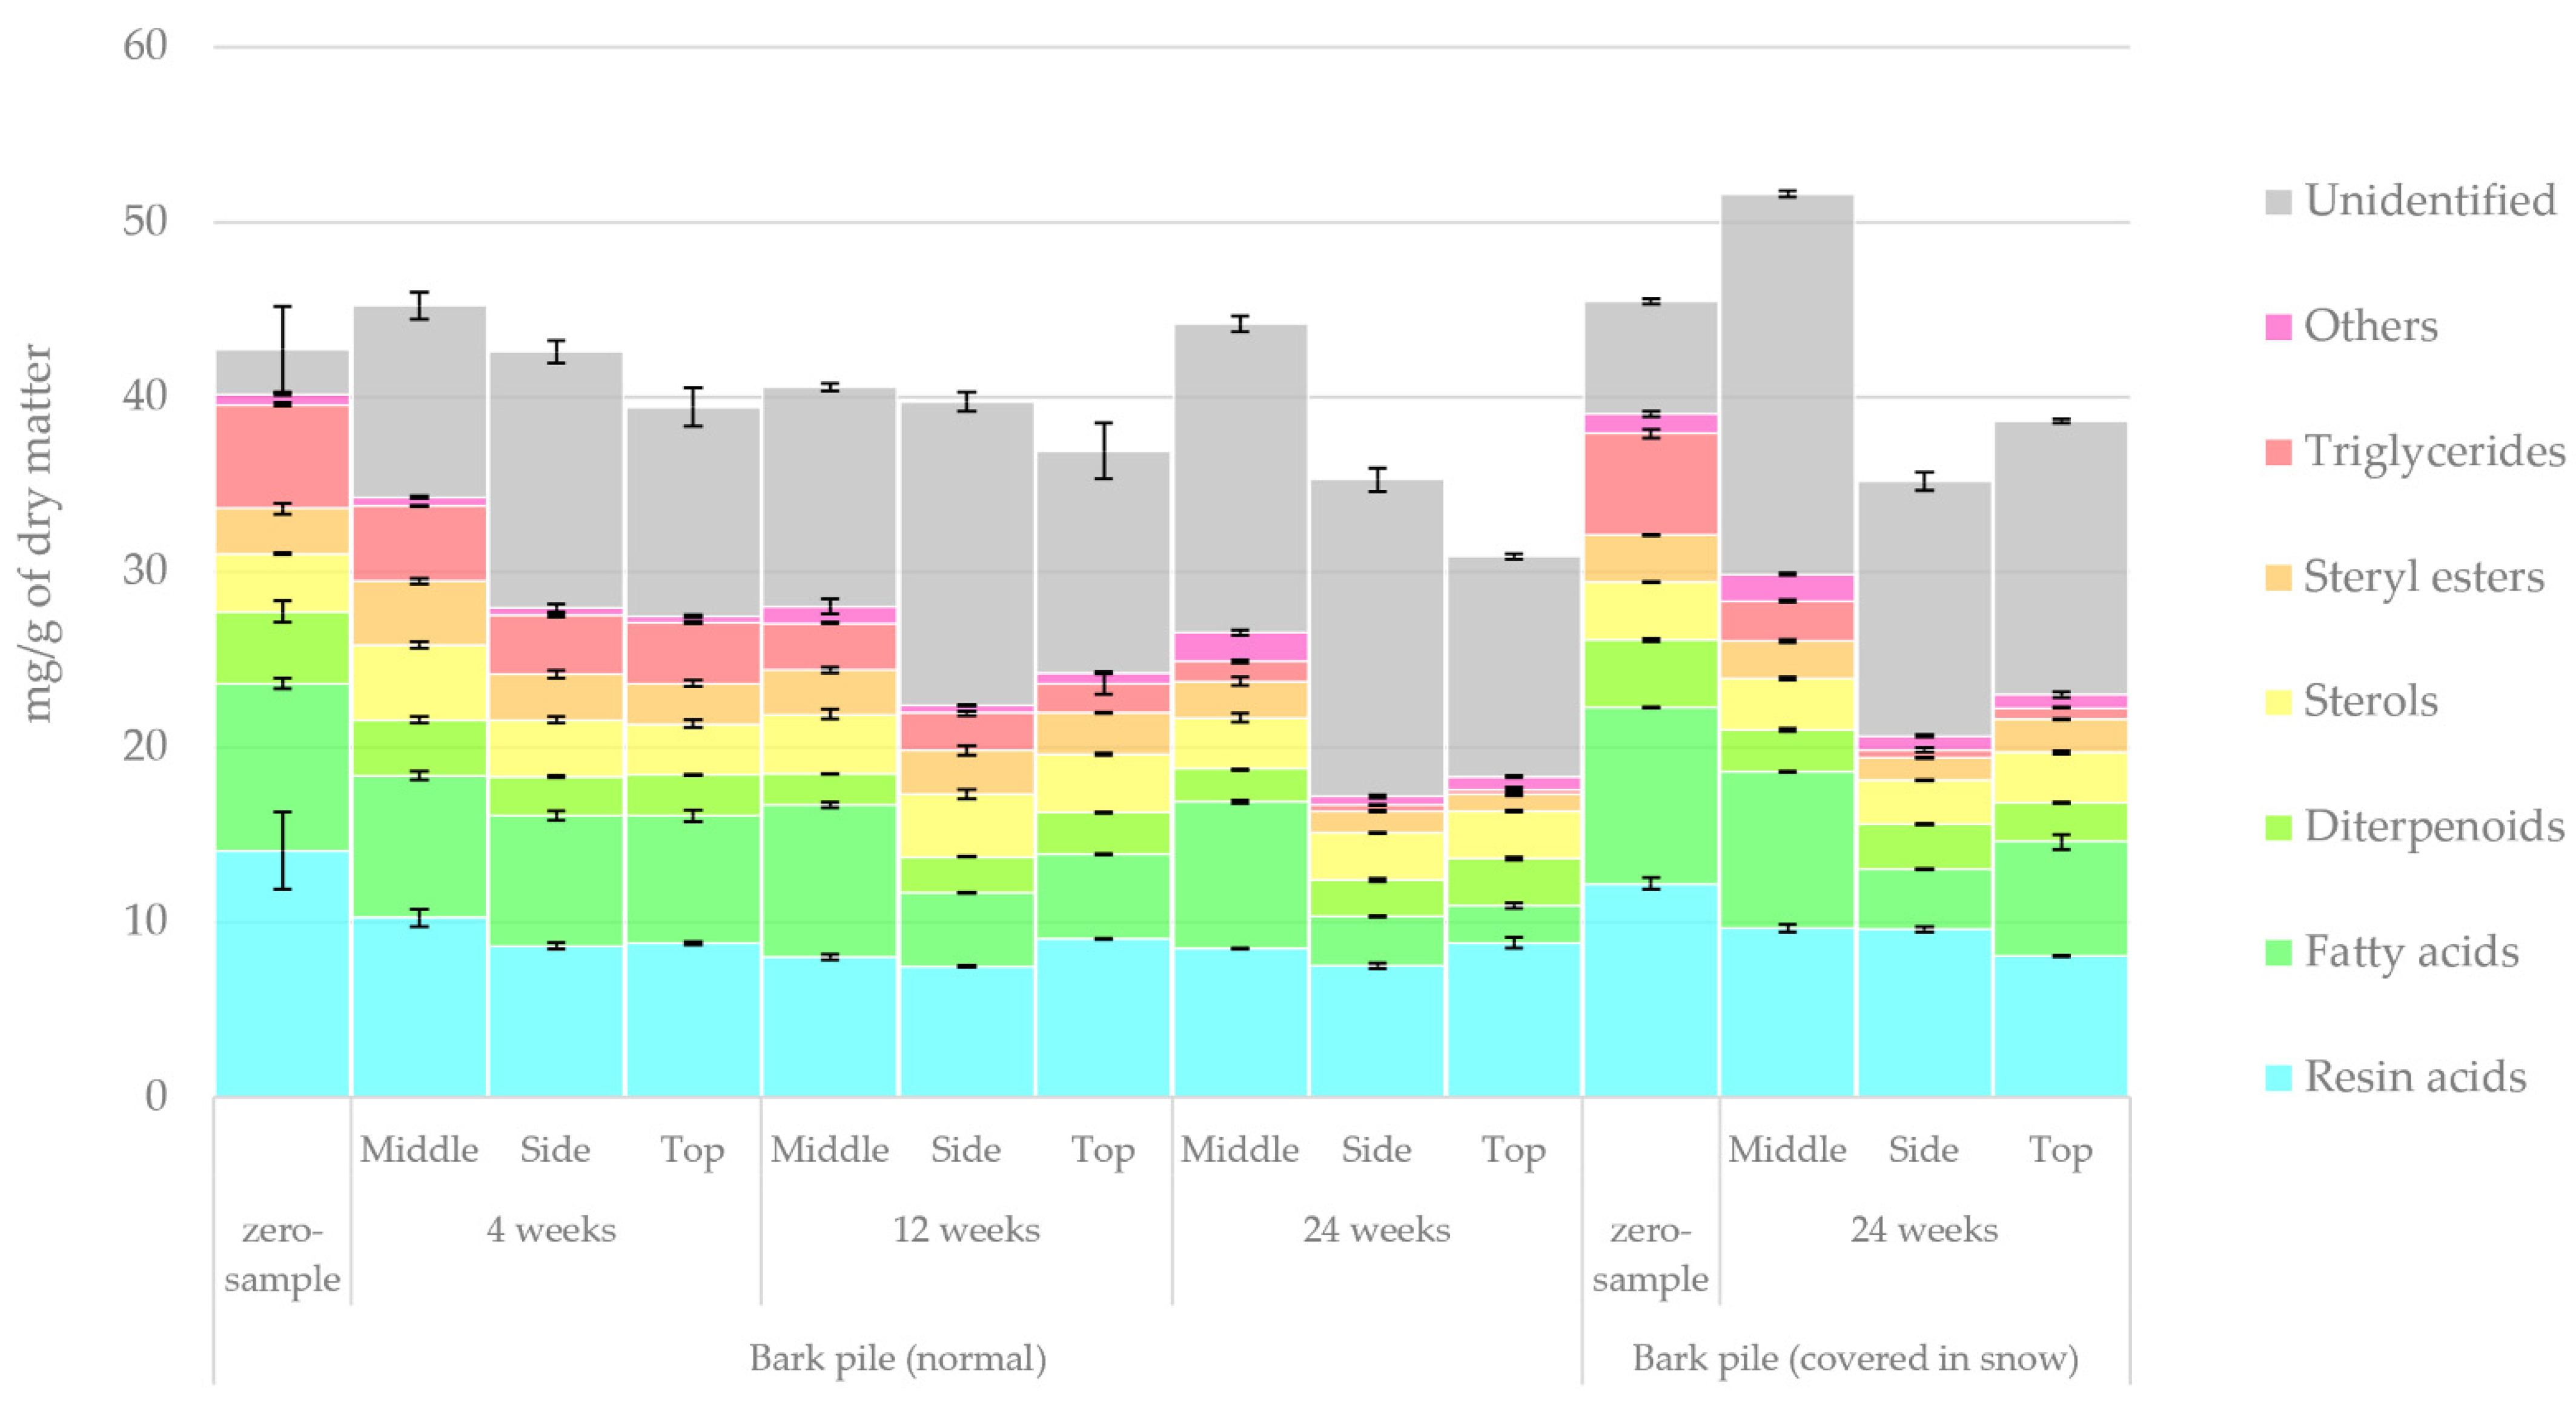
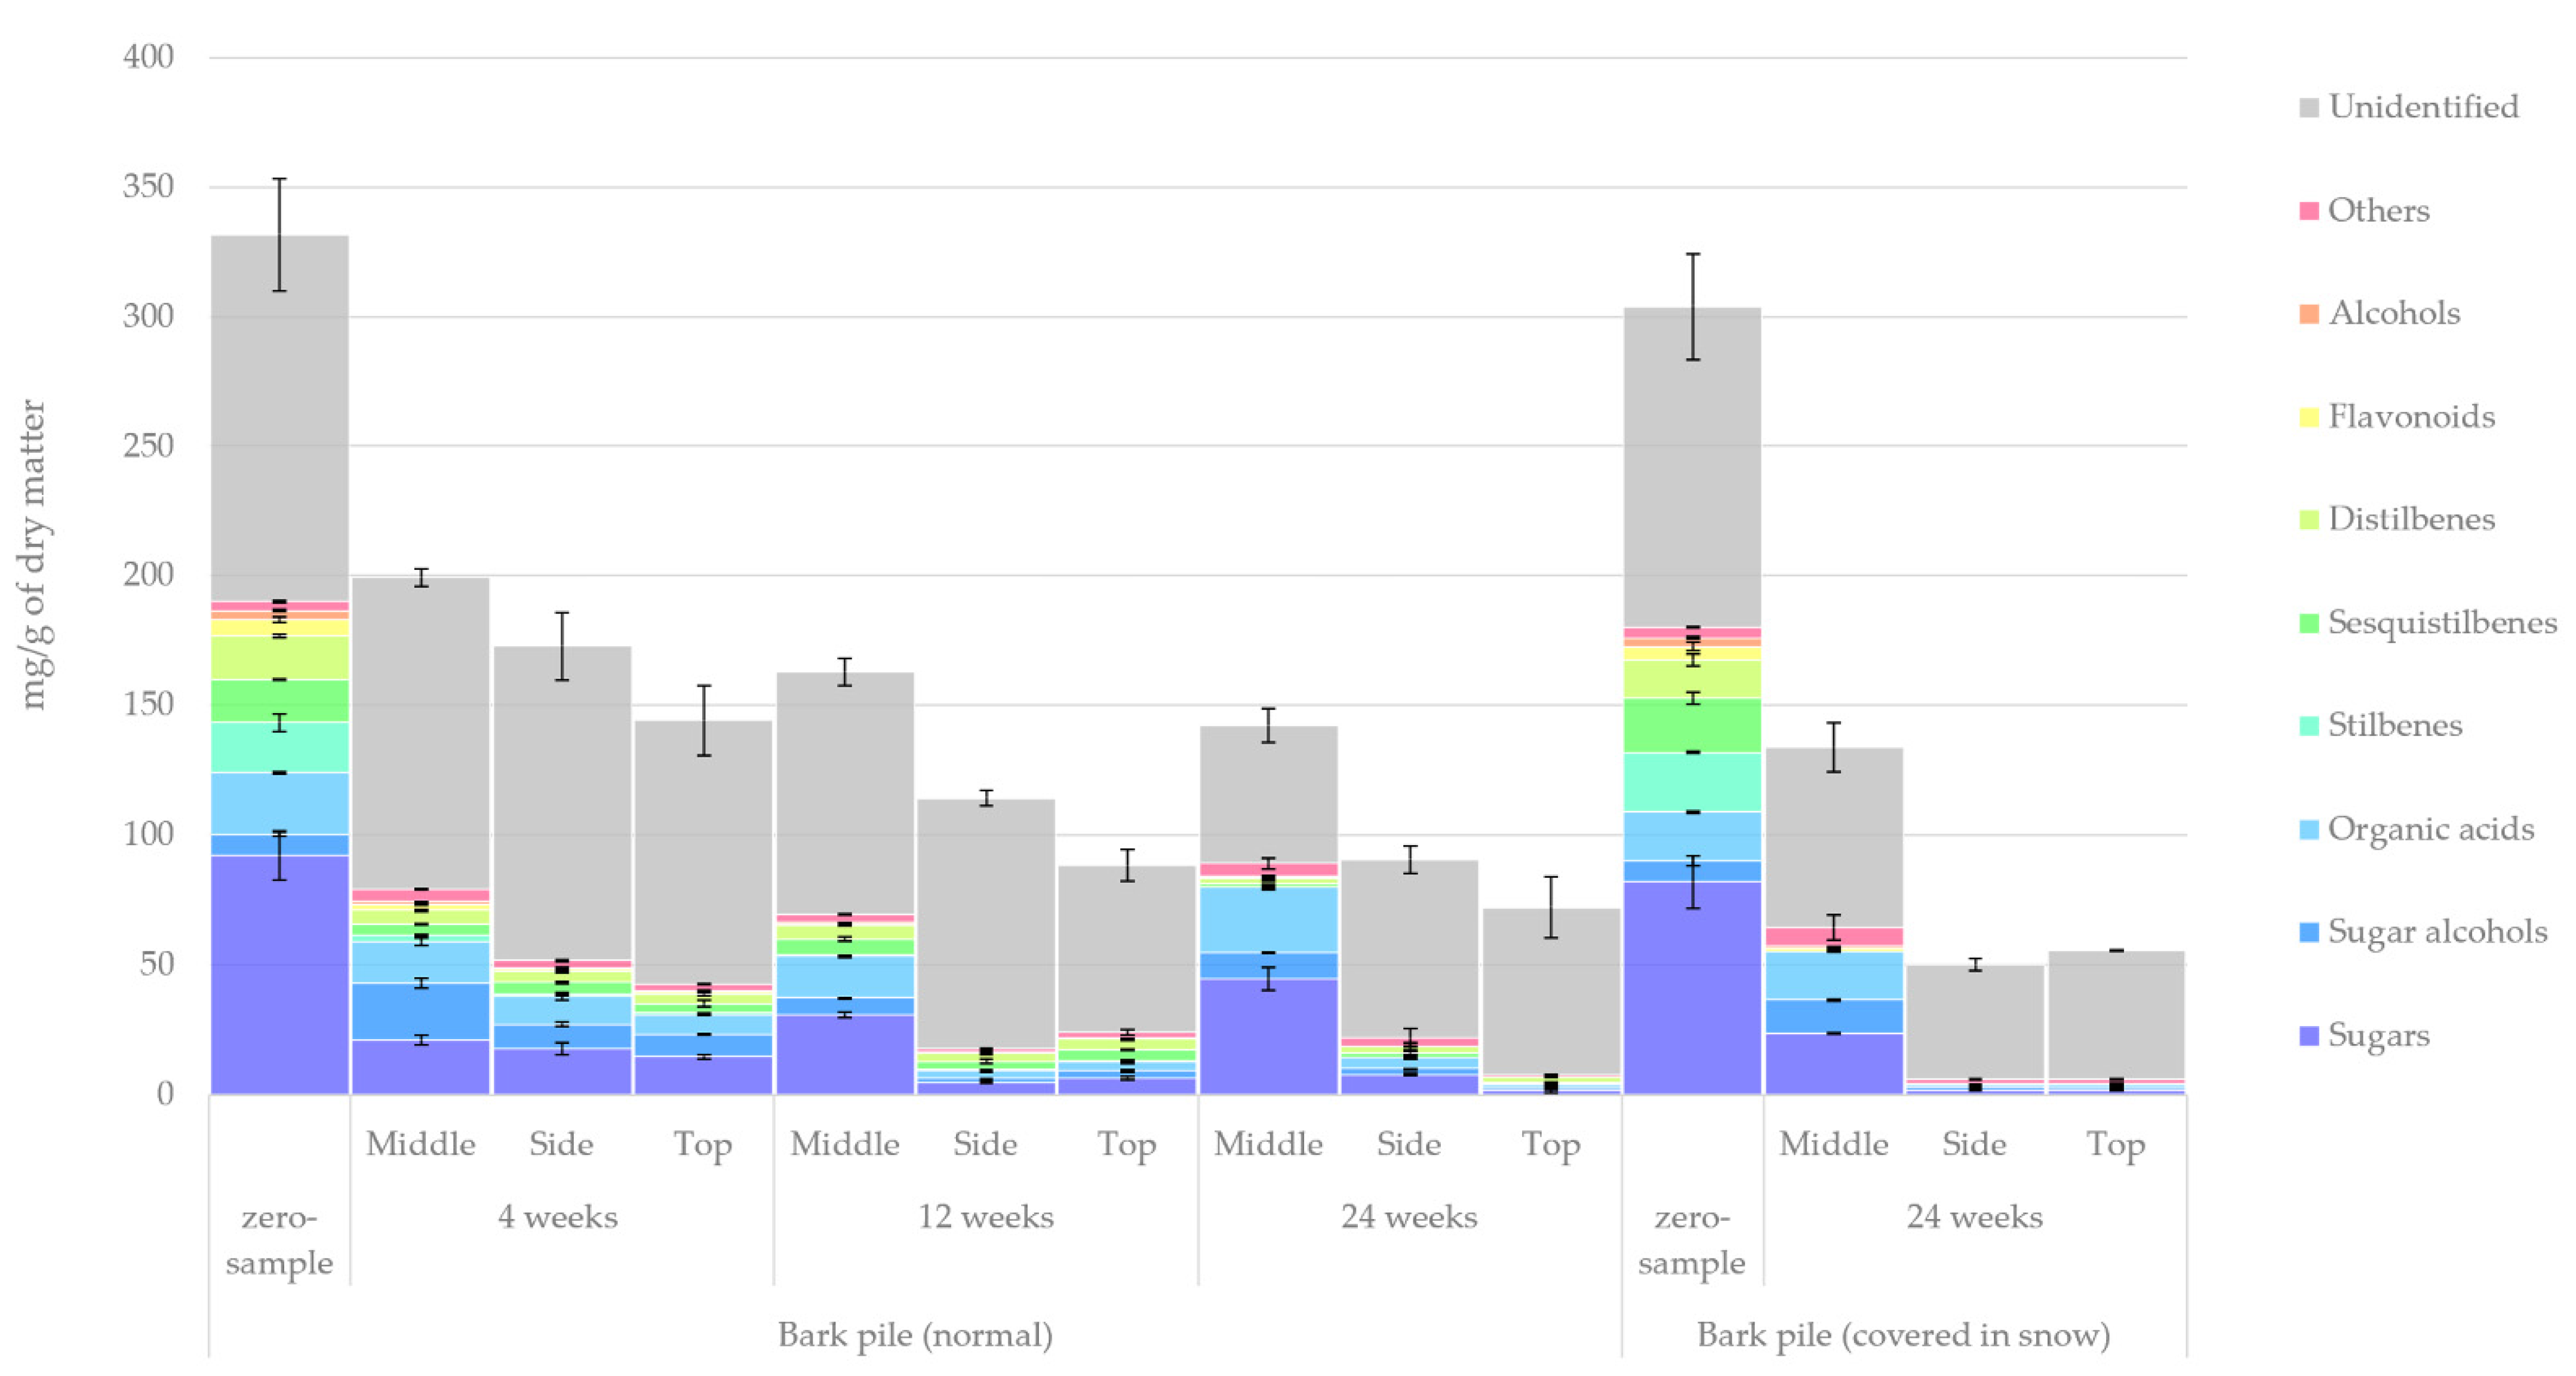
2.3.1. Lipophilic and Hydrophilic Extractive Groups
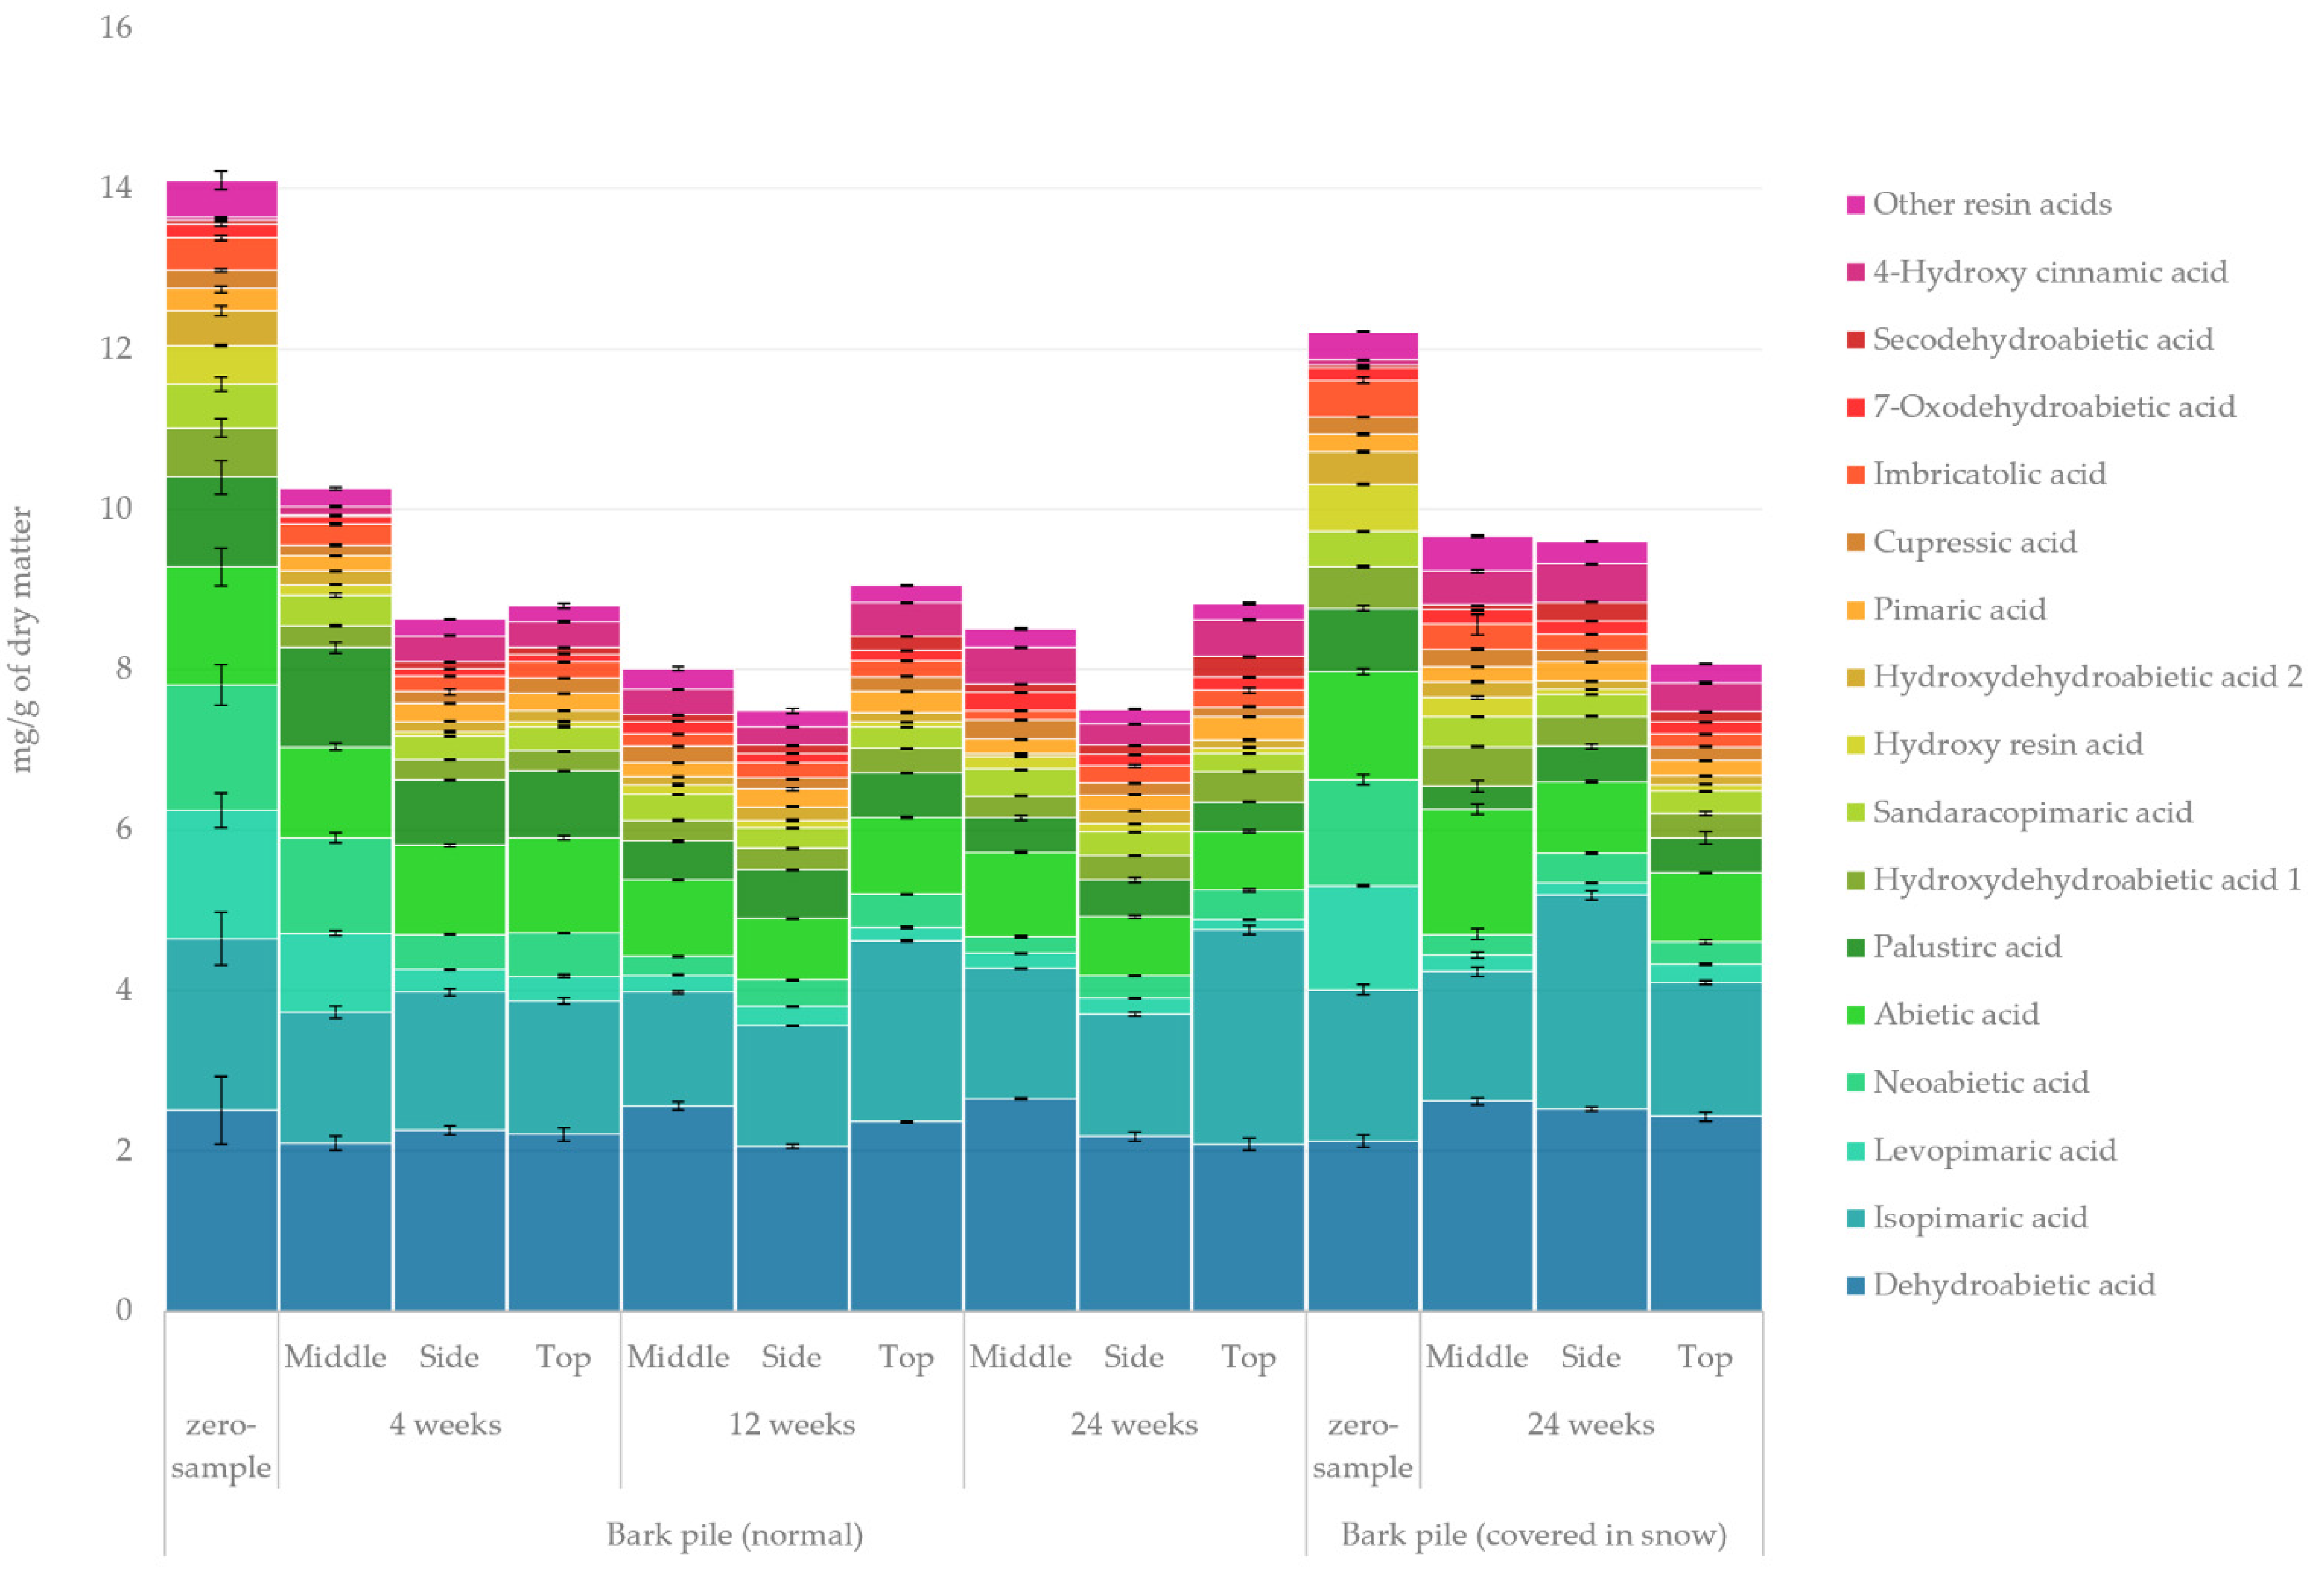
2.3.2. Resin Acids
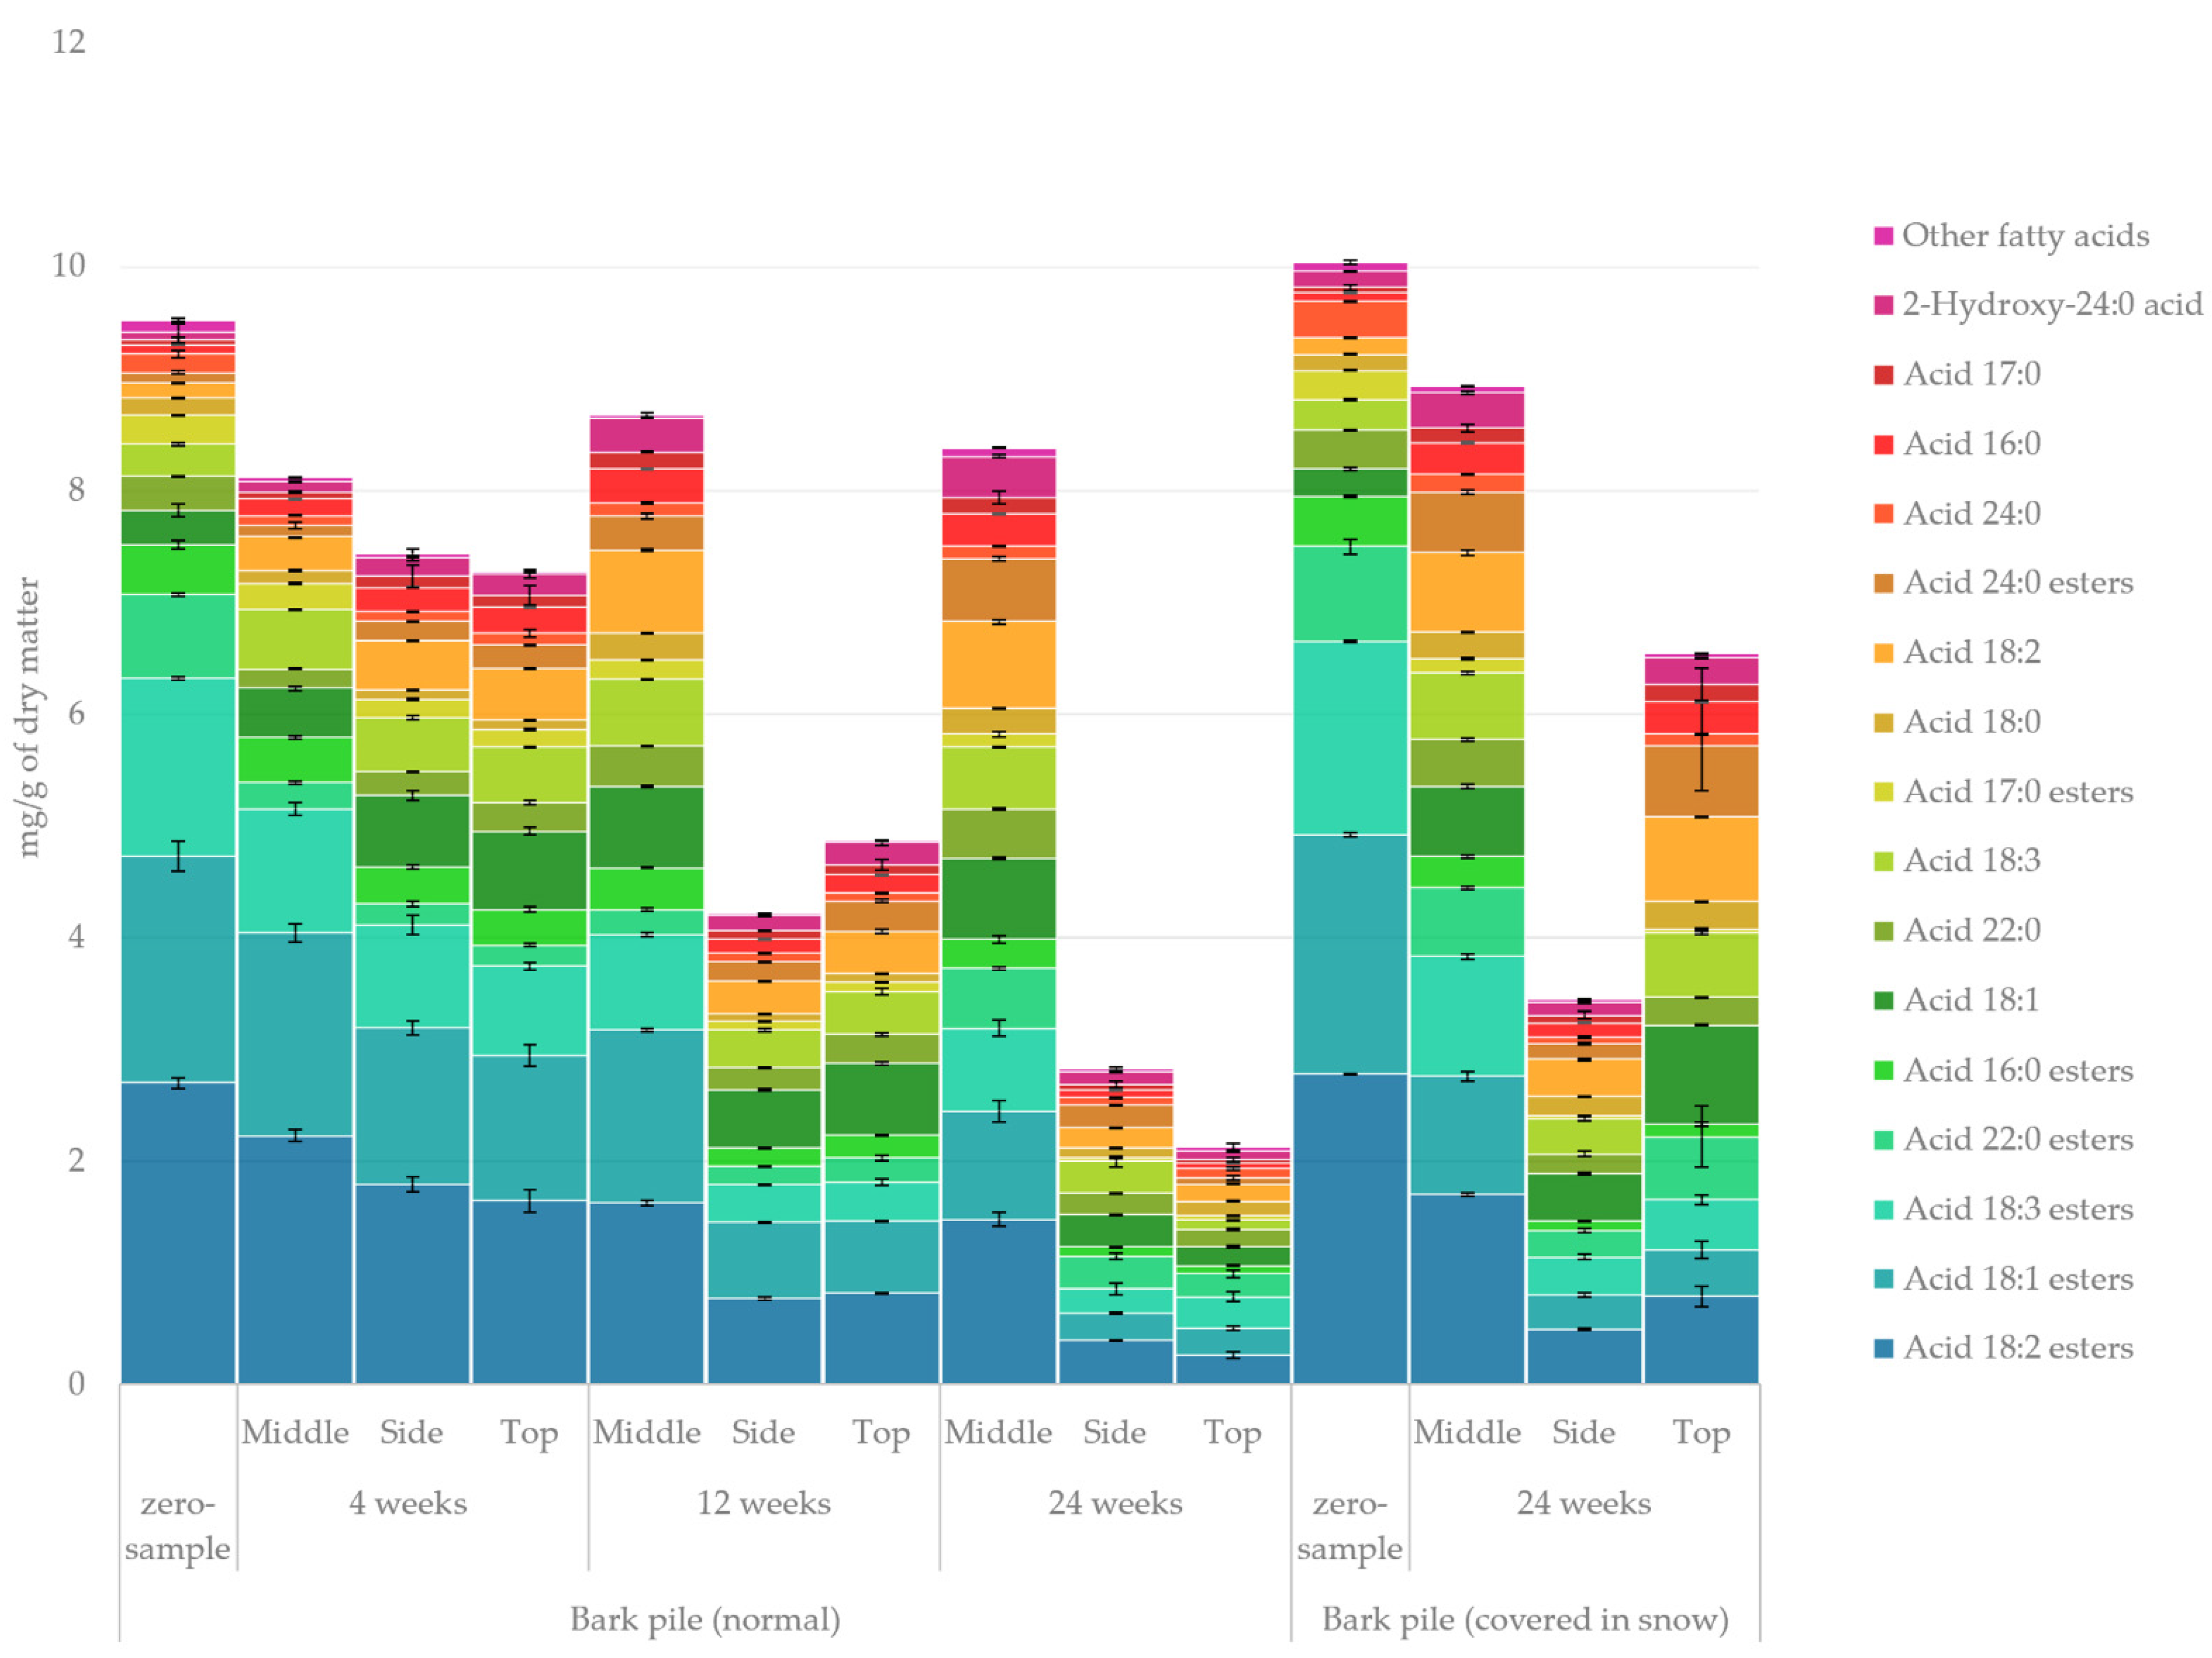
2.3.3. Fatty Acids
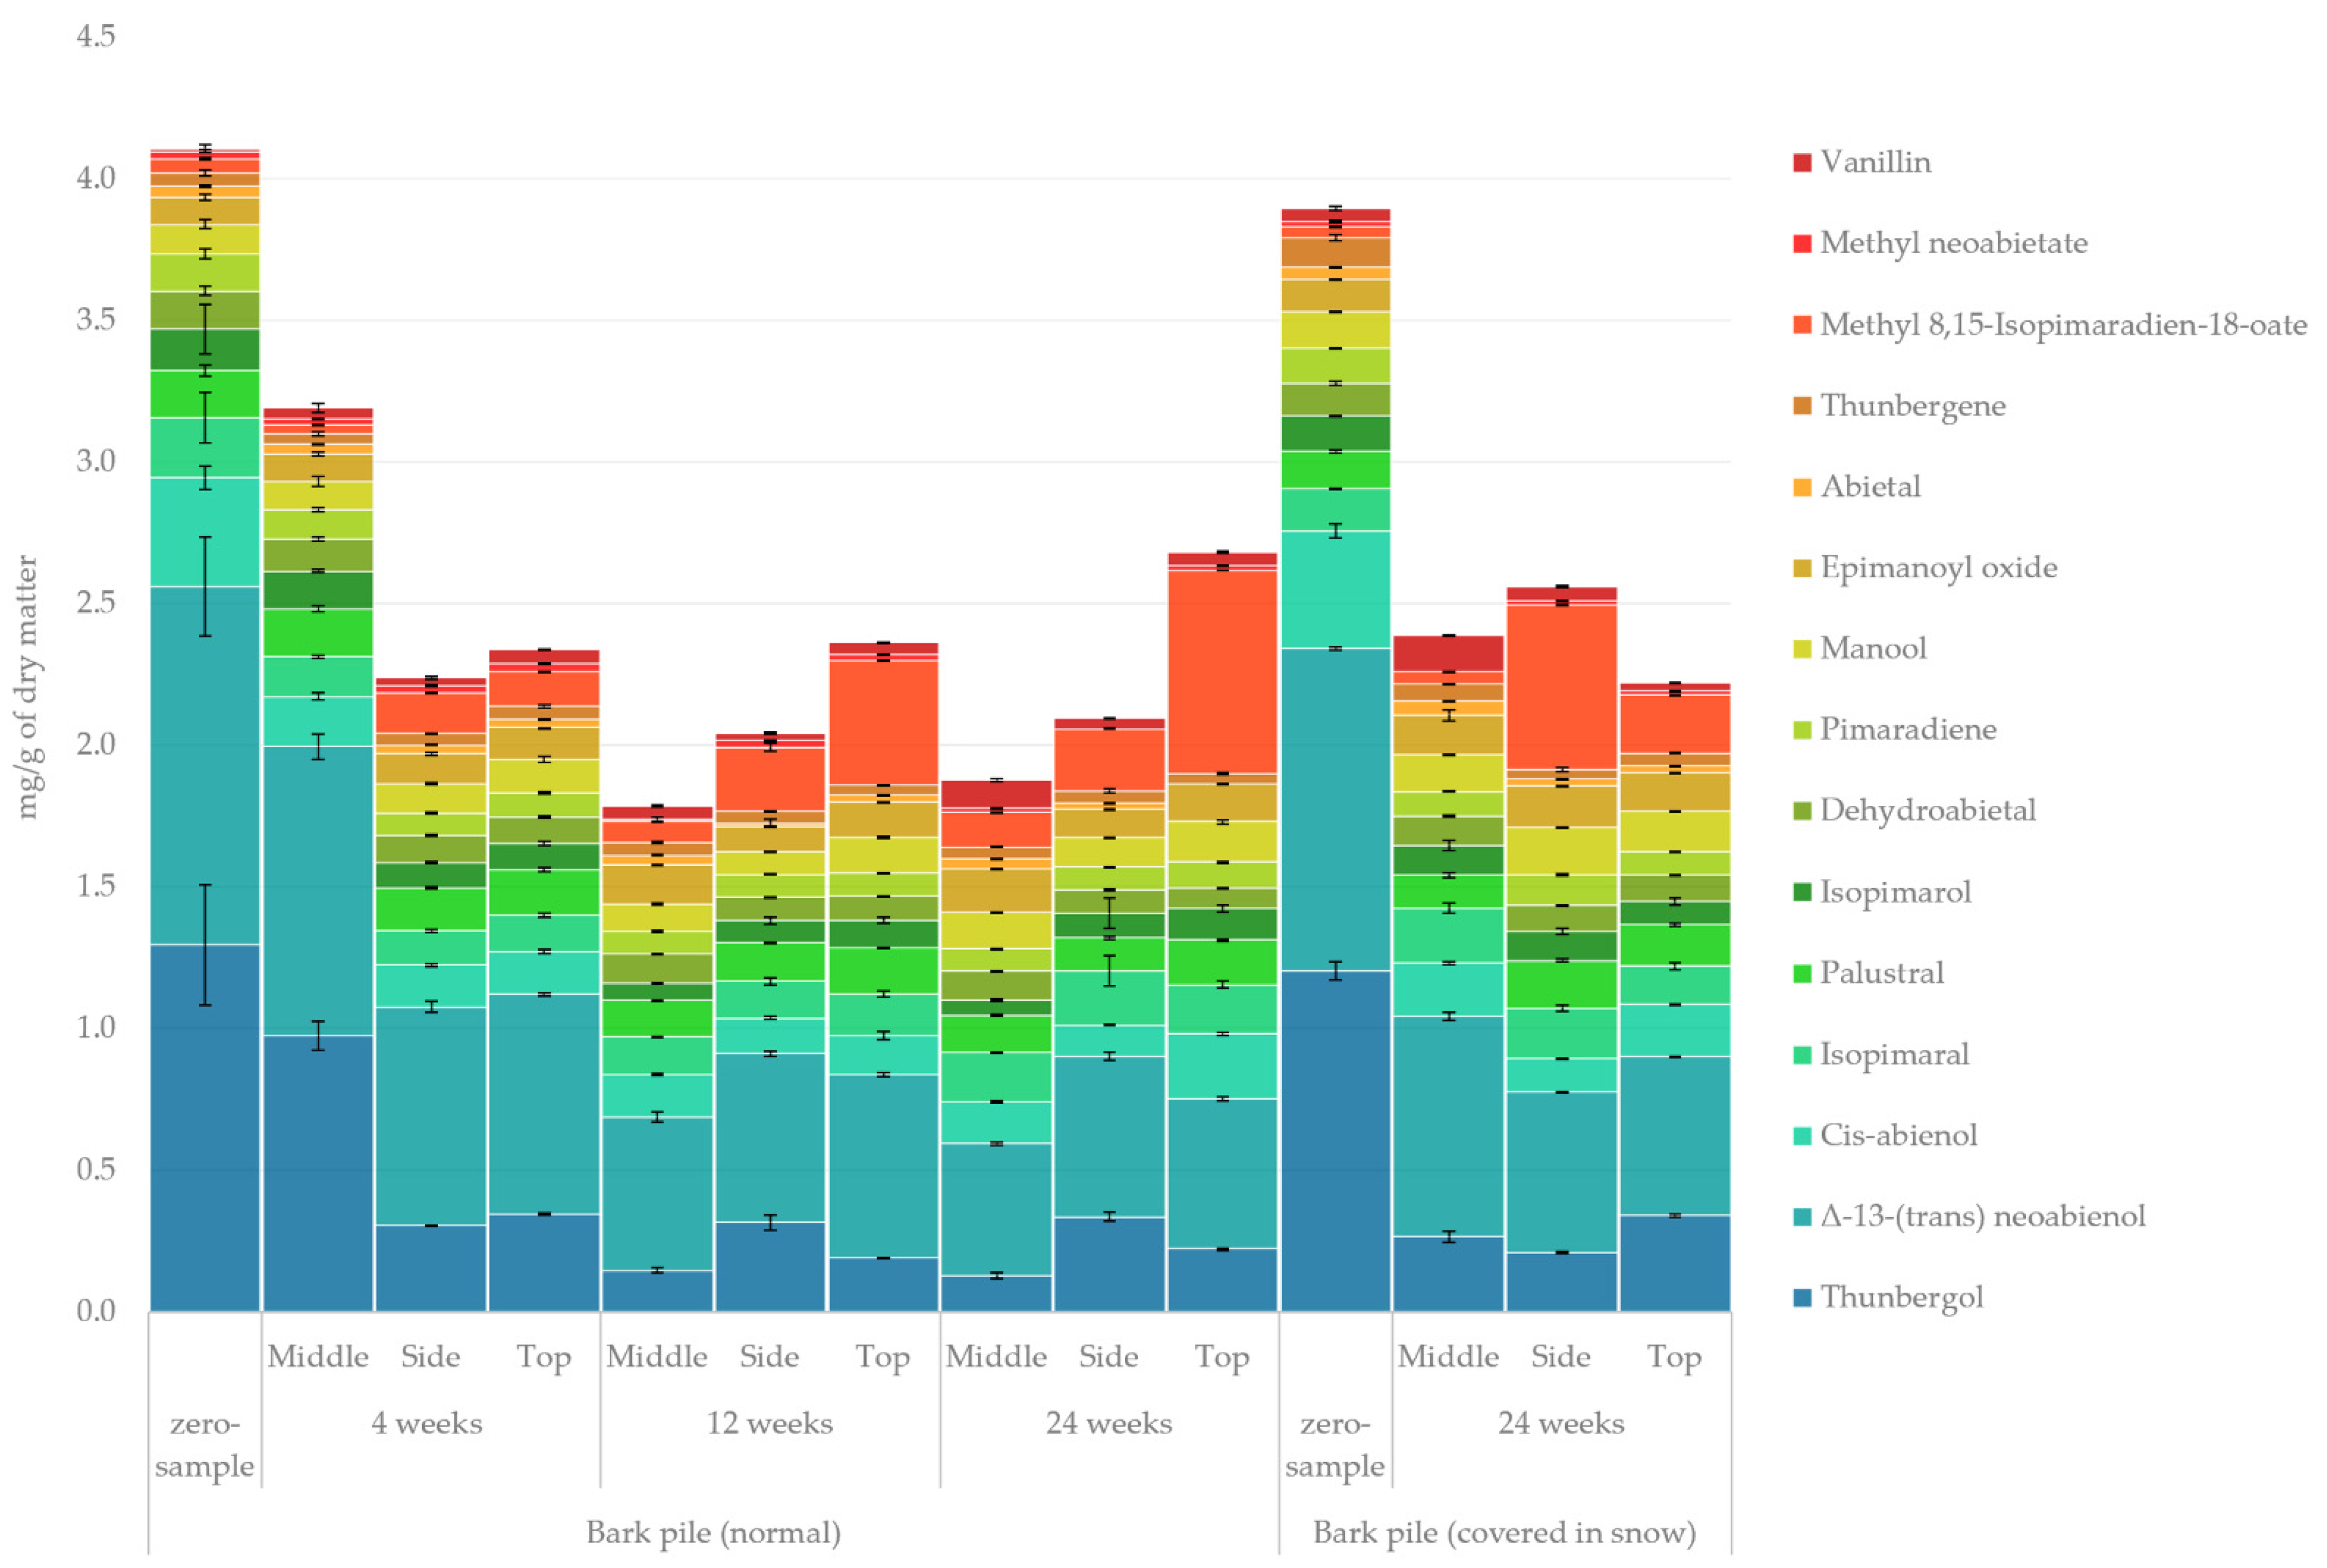
2.3.4. Diterpenoids
2.3.5. Sterols
2.3.6. Sugars
2.3.7. Sugar Alcohols
2.3.8. Organic Acids
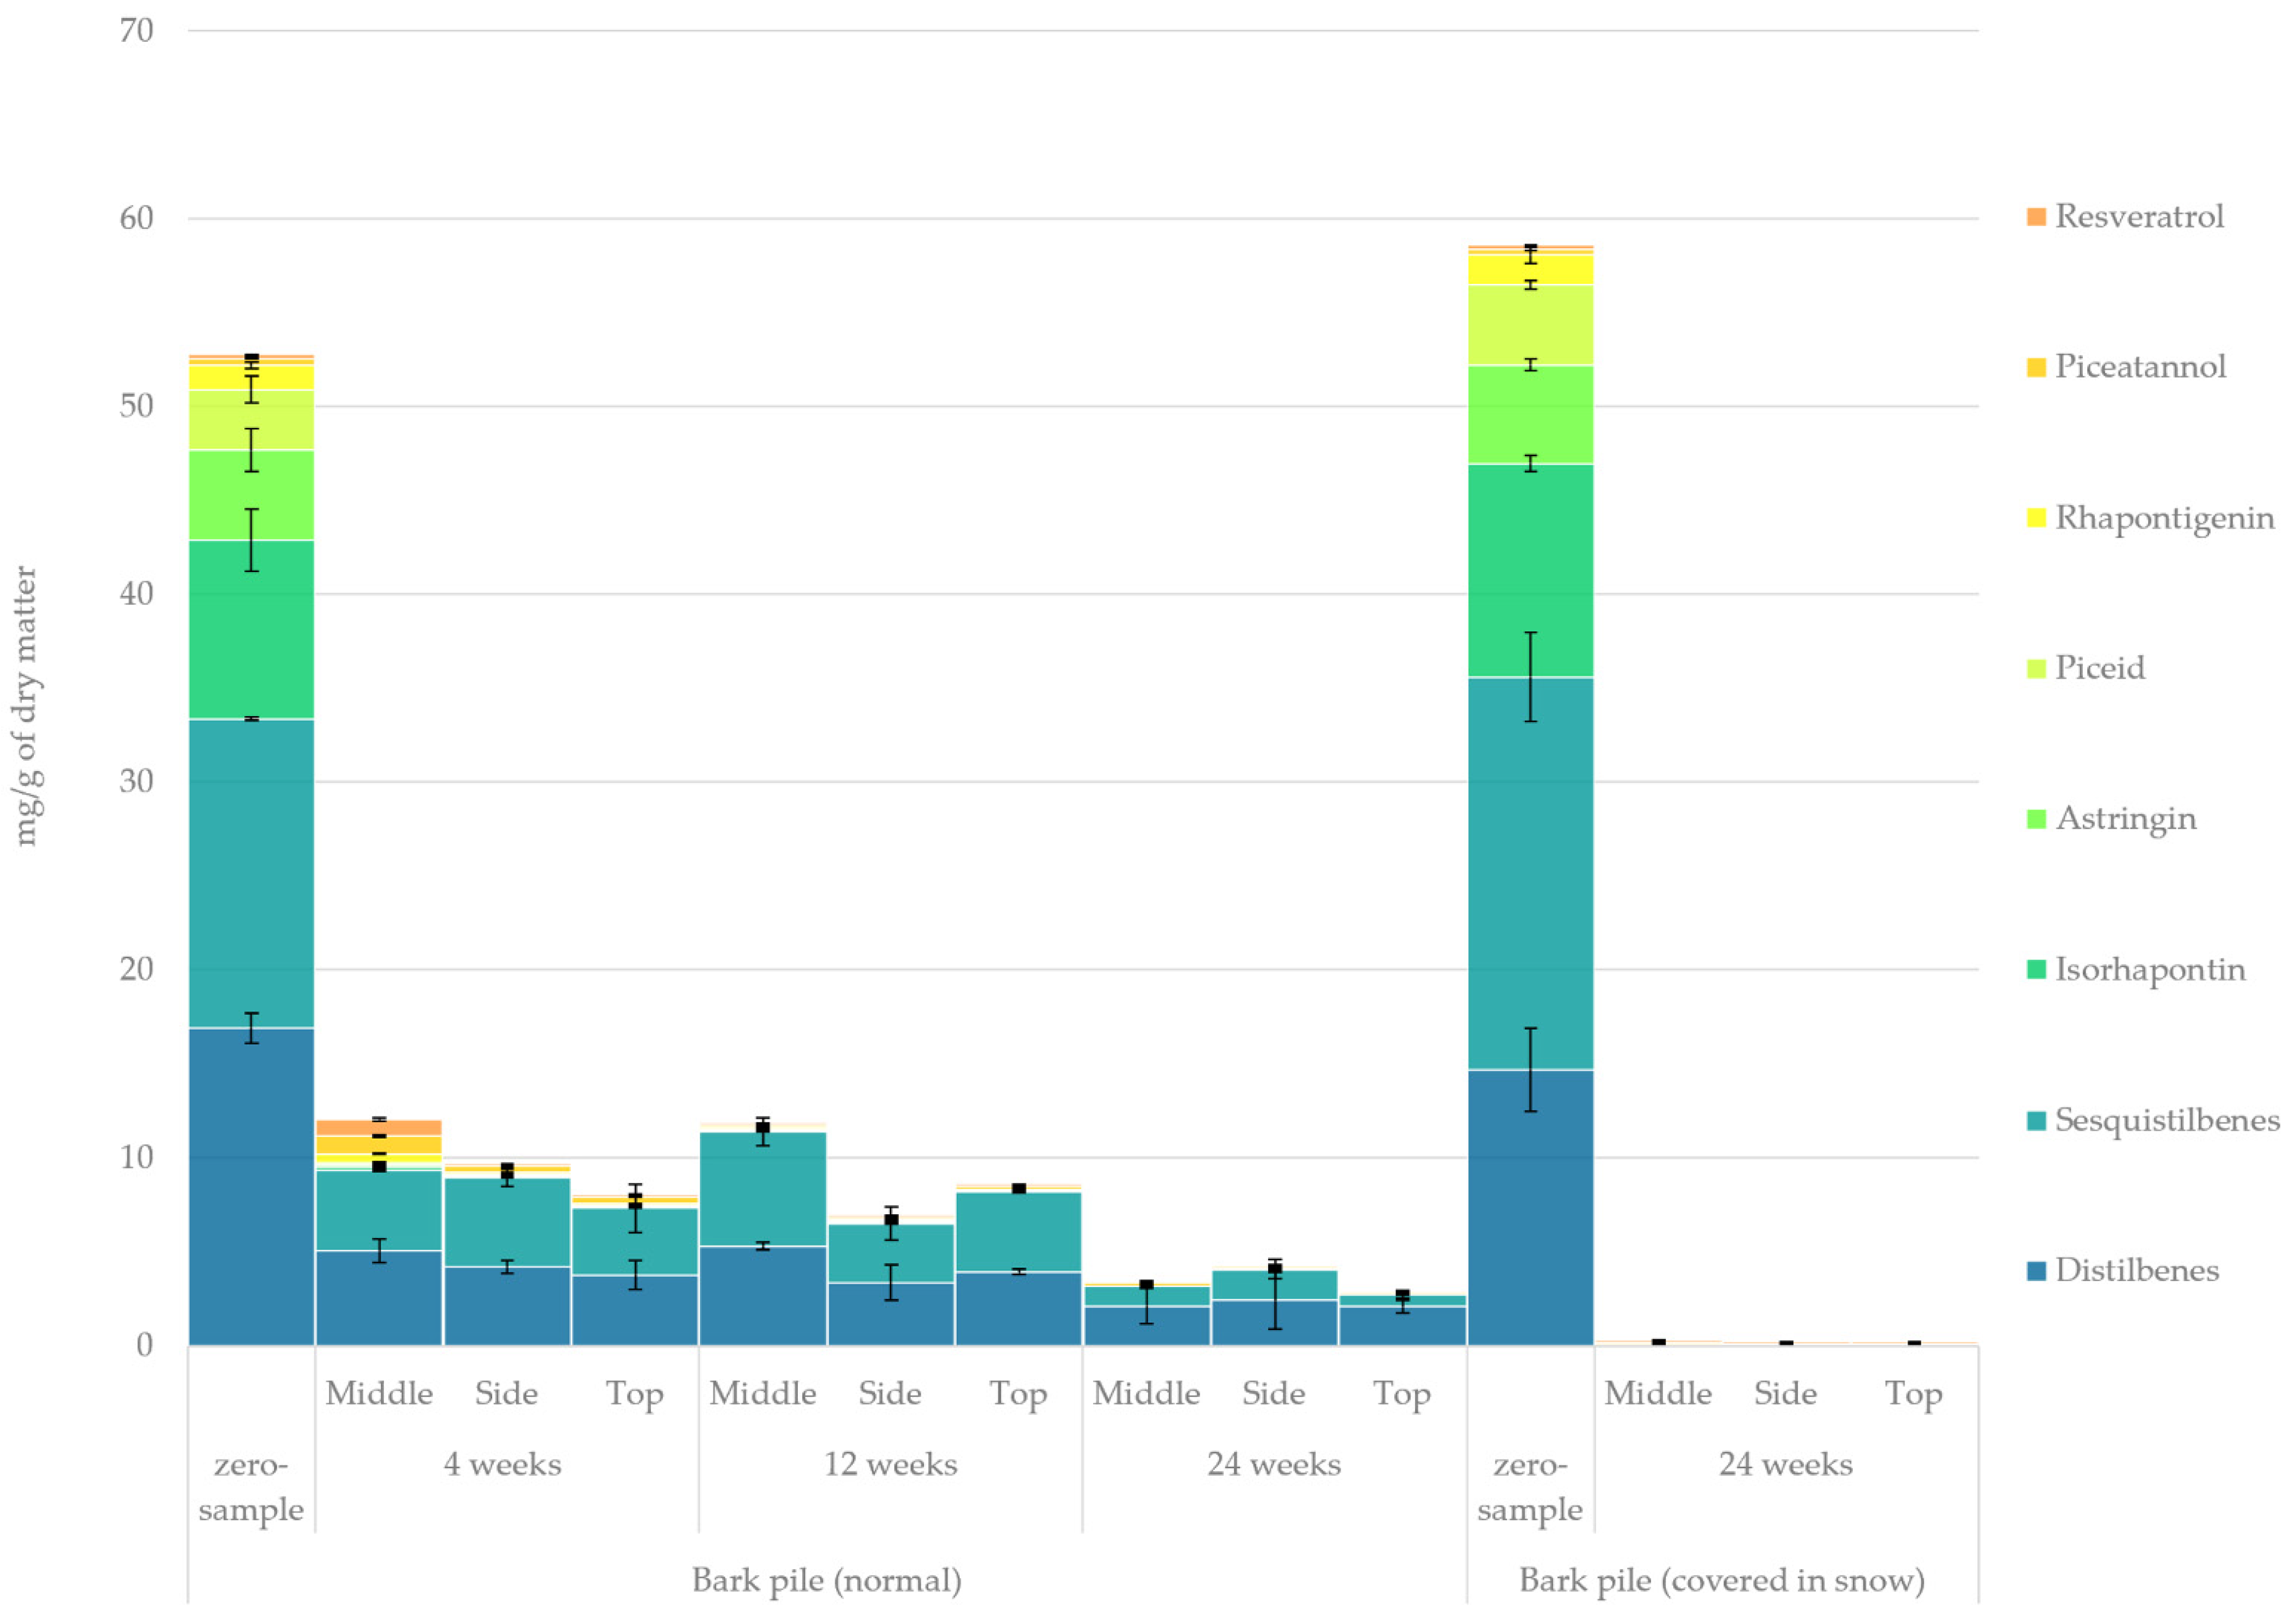
2.3.9. Stilbenes
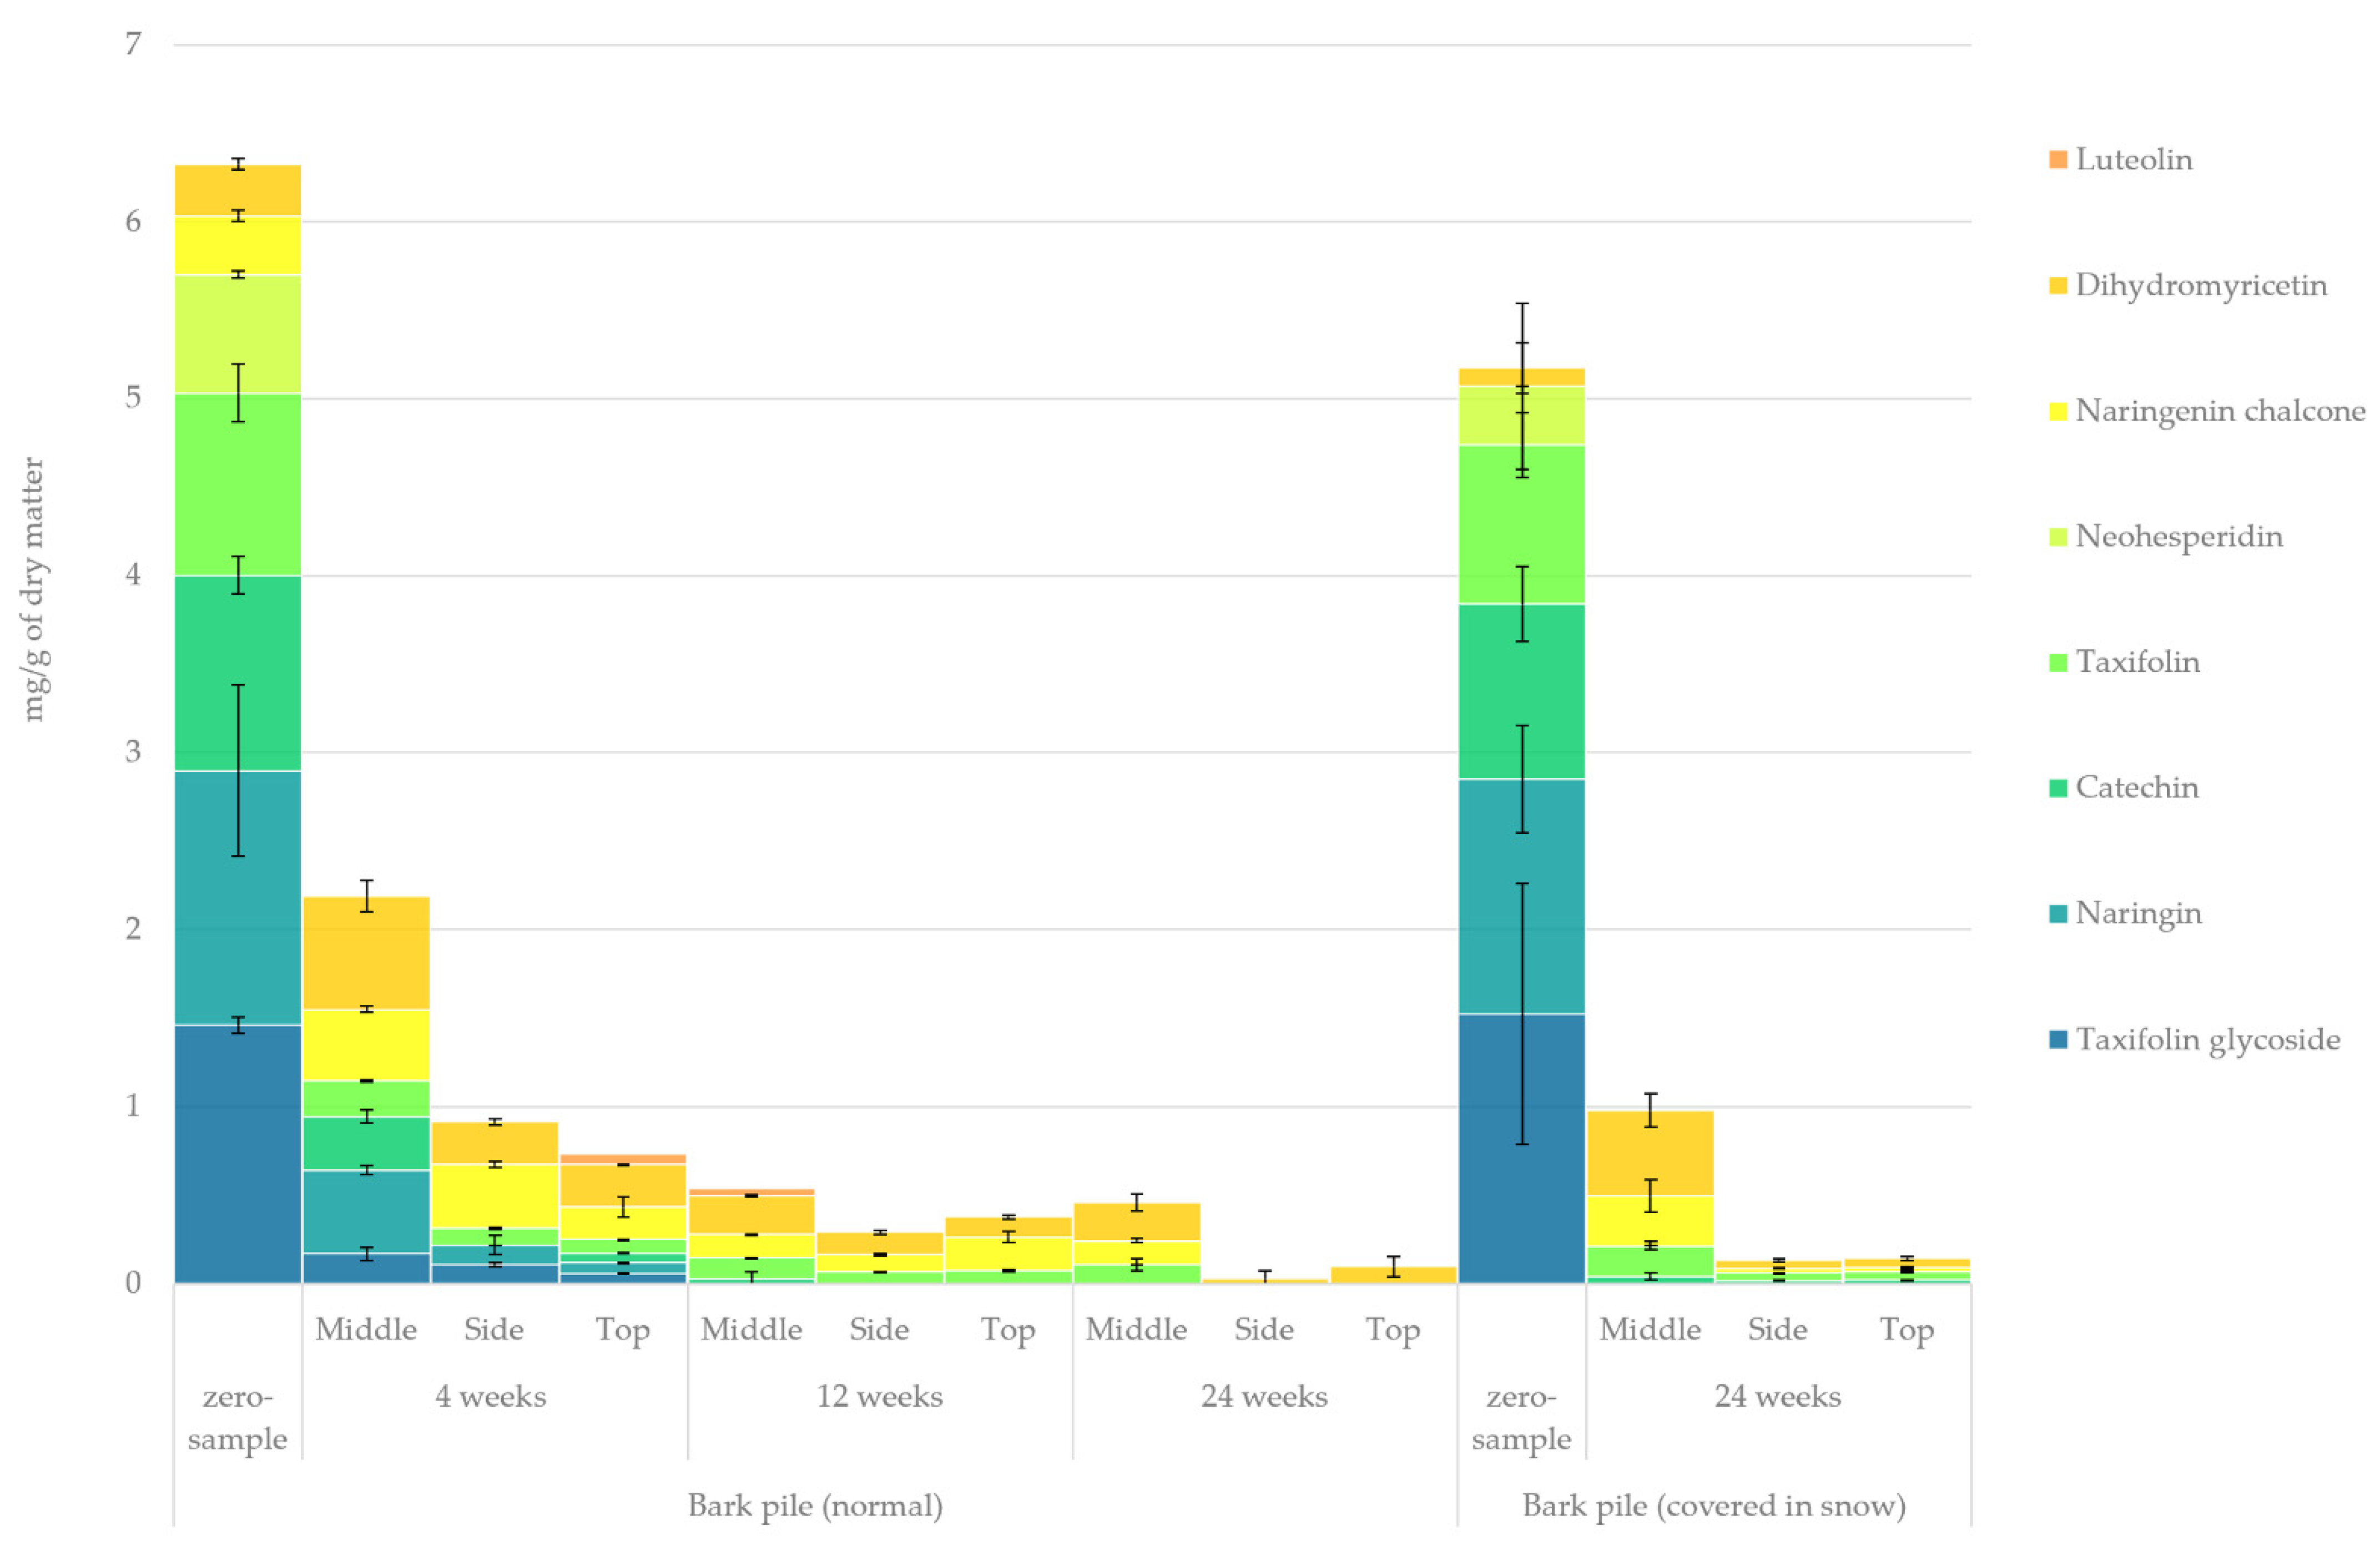
2.3.10. Flavonoids
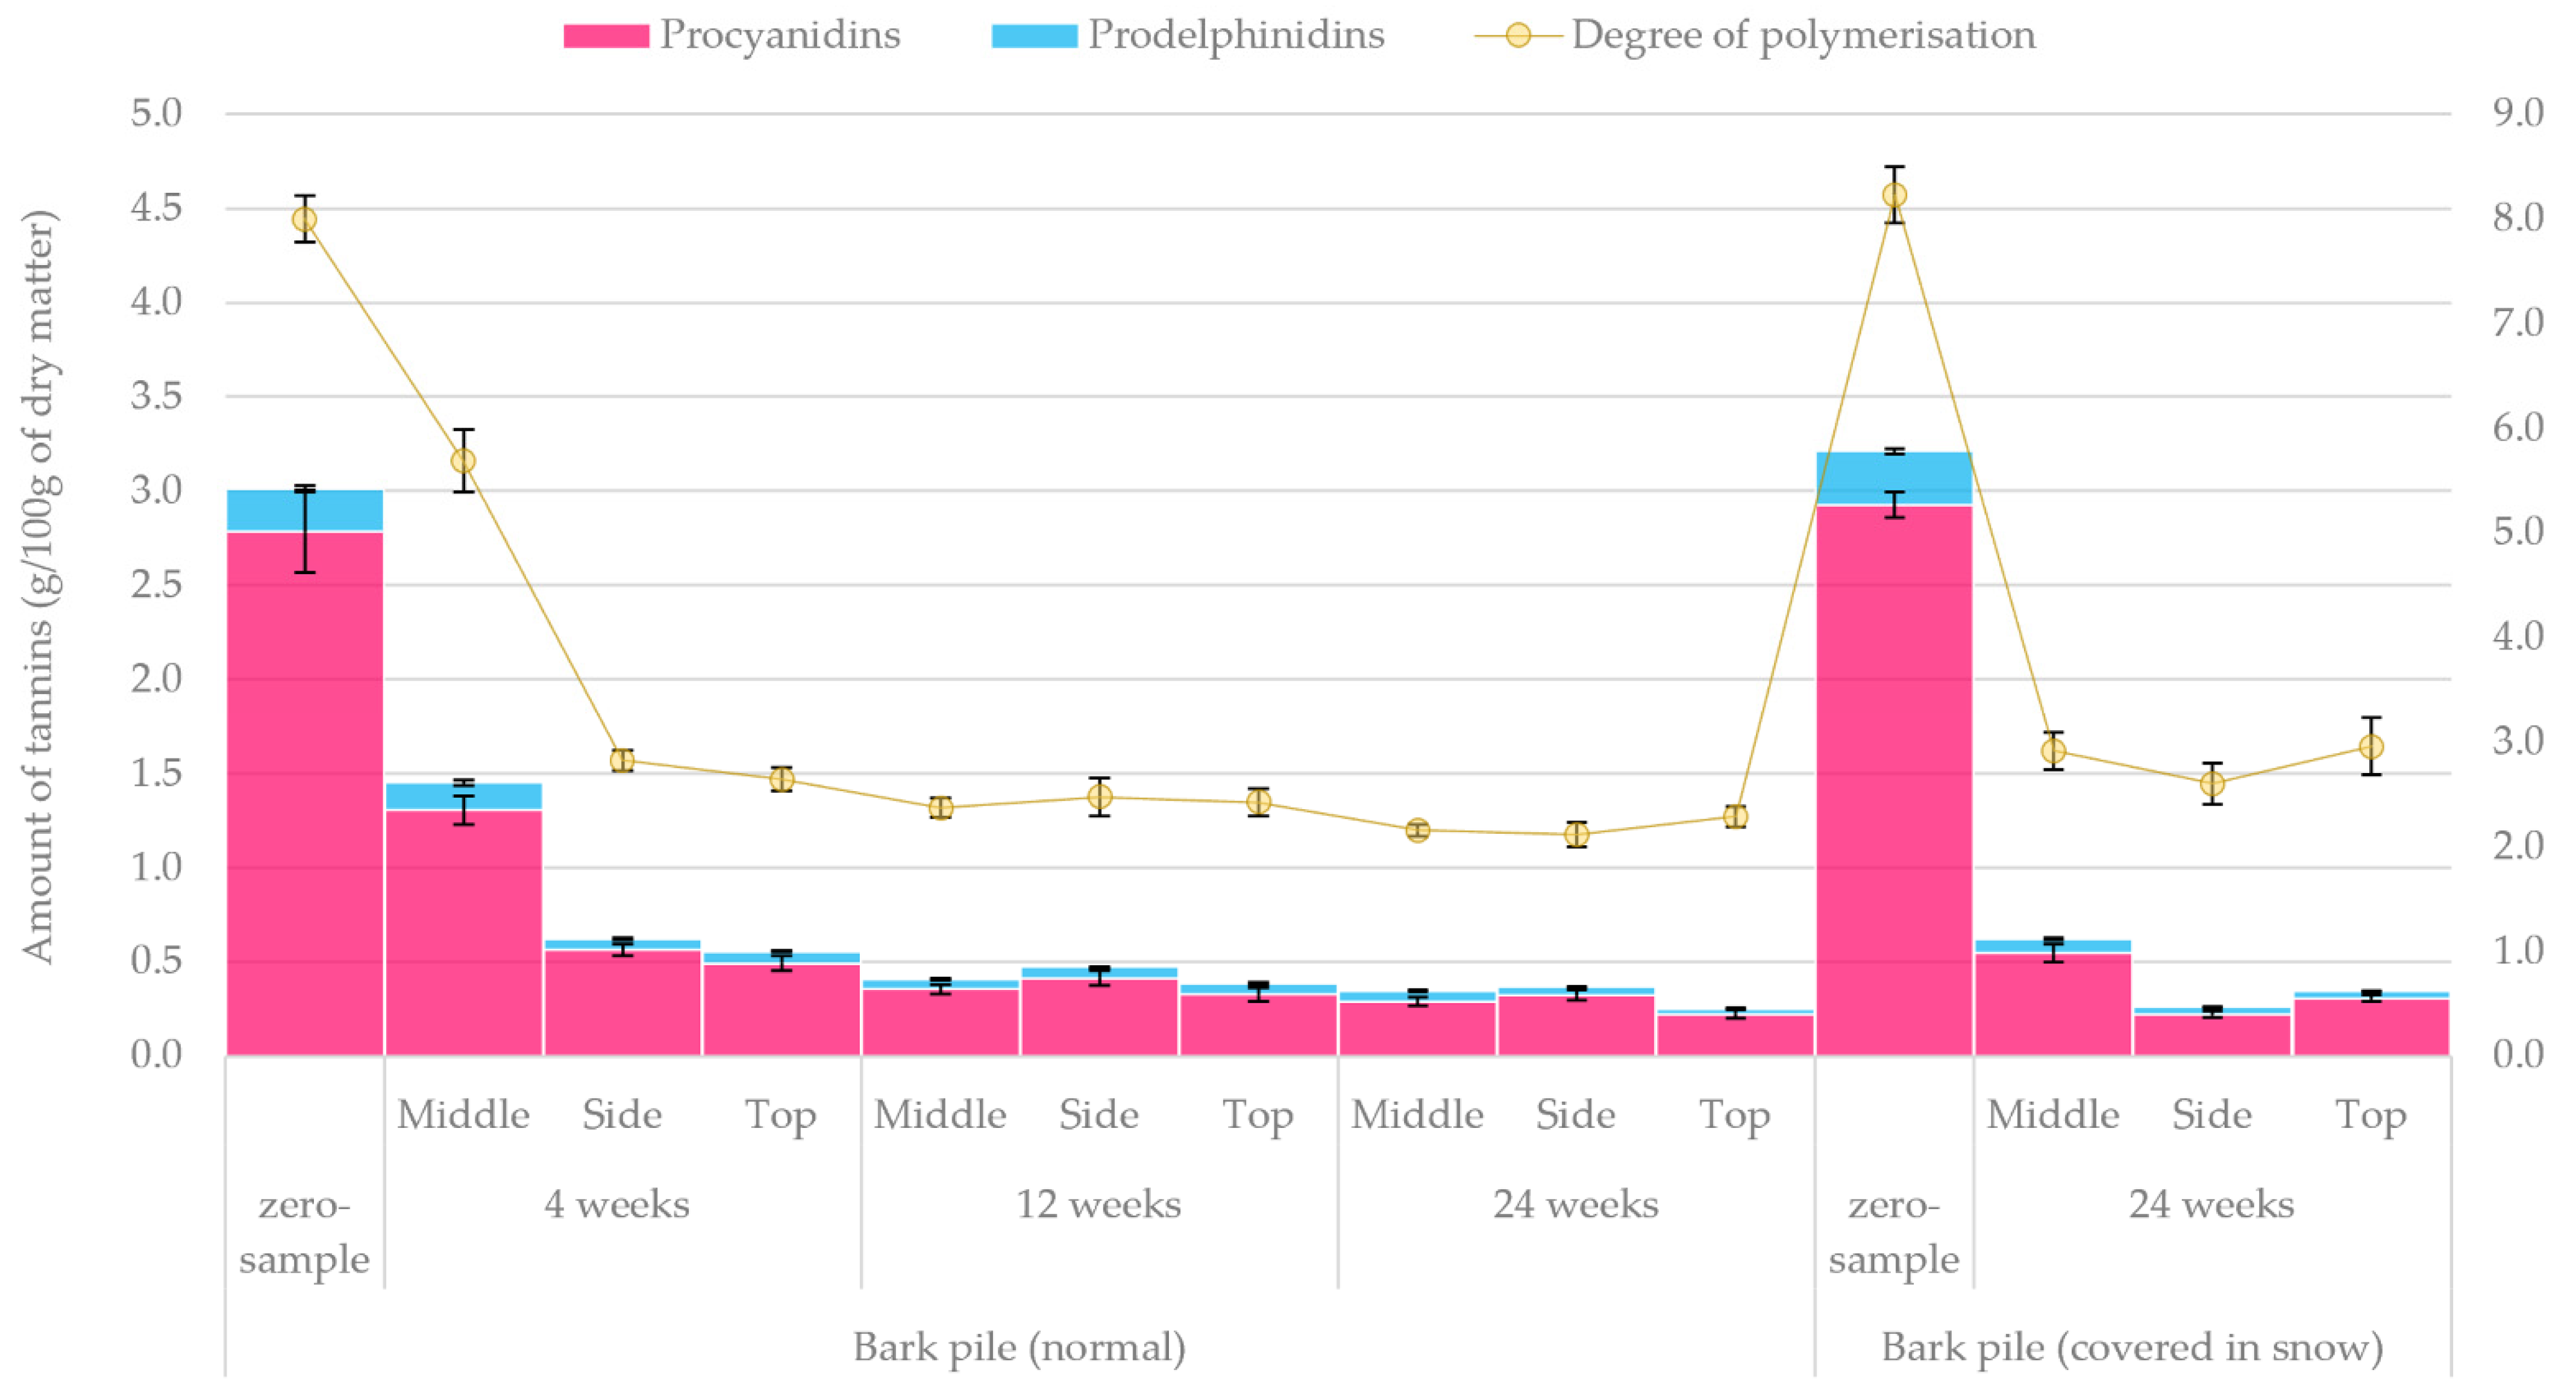
2.4. High-Performance Liquid Chromatography (HPLC) Analysis of Proanthocyanidins
2.5. Carbohydrate Analysis
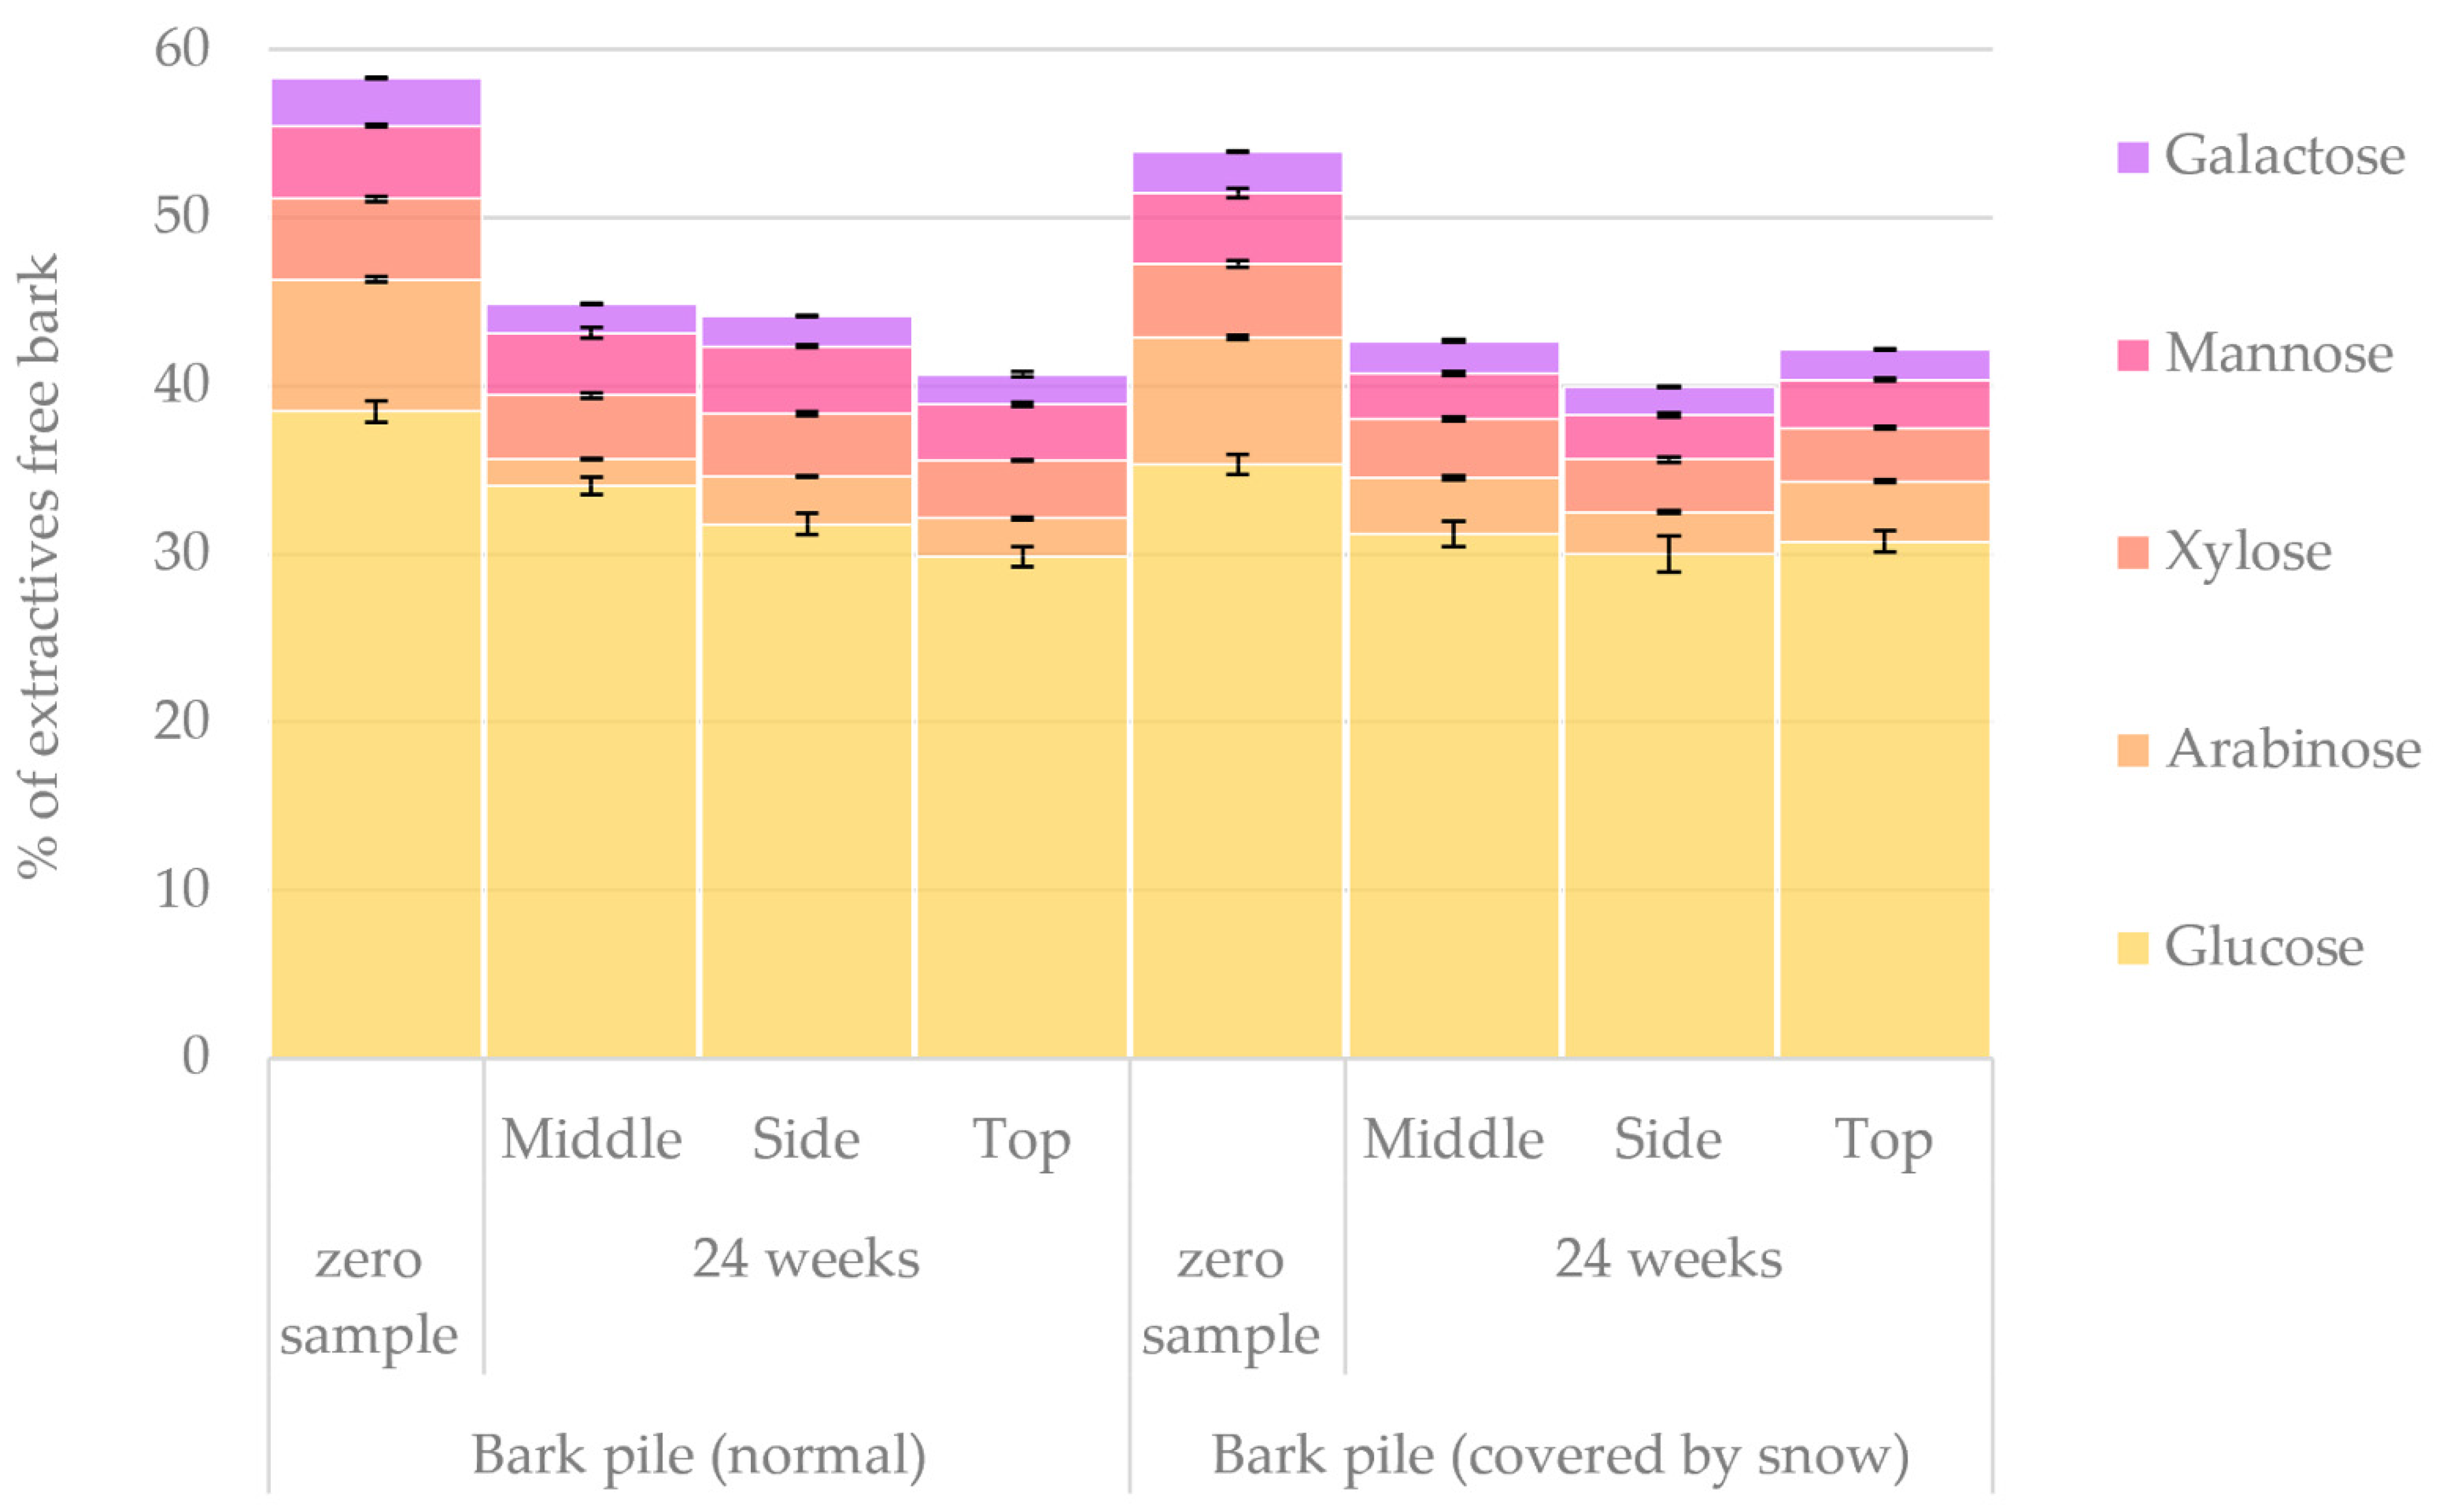
2.5.1. Acid Hydrolysis and High-Performance Anion-Exchange Chromatography (HPAEC) Analysis of Monosaccharides
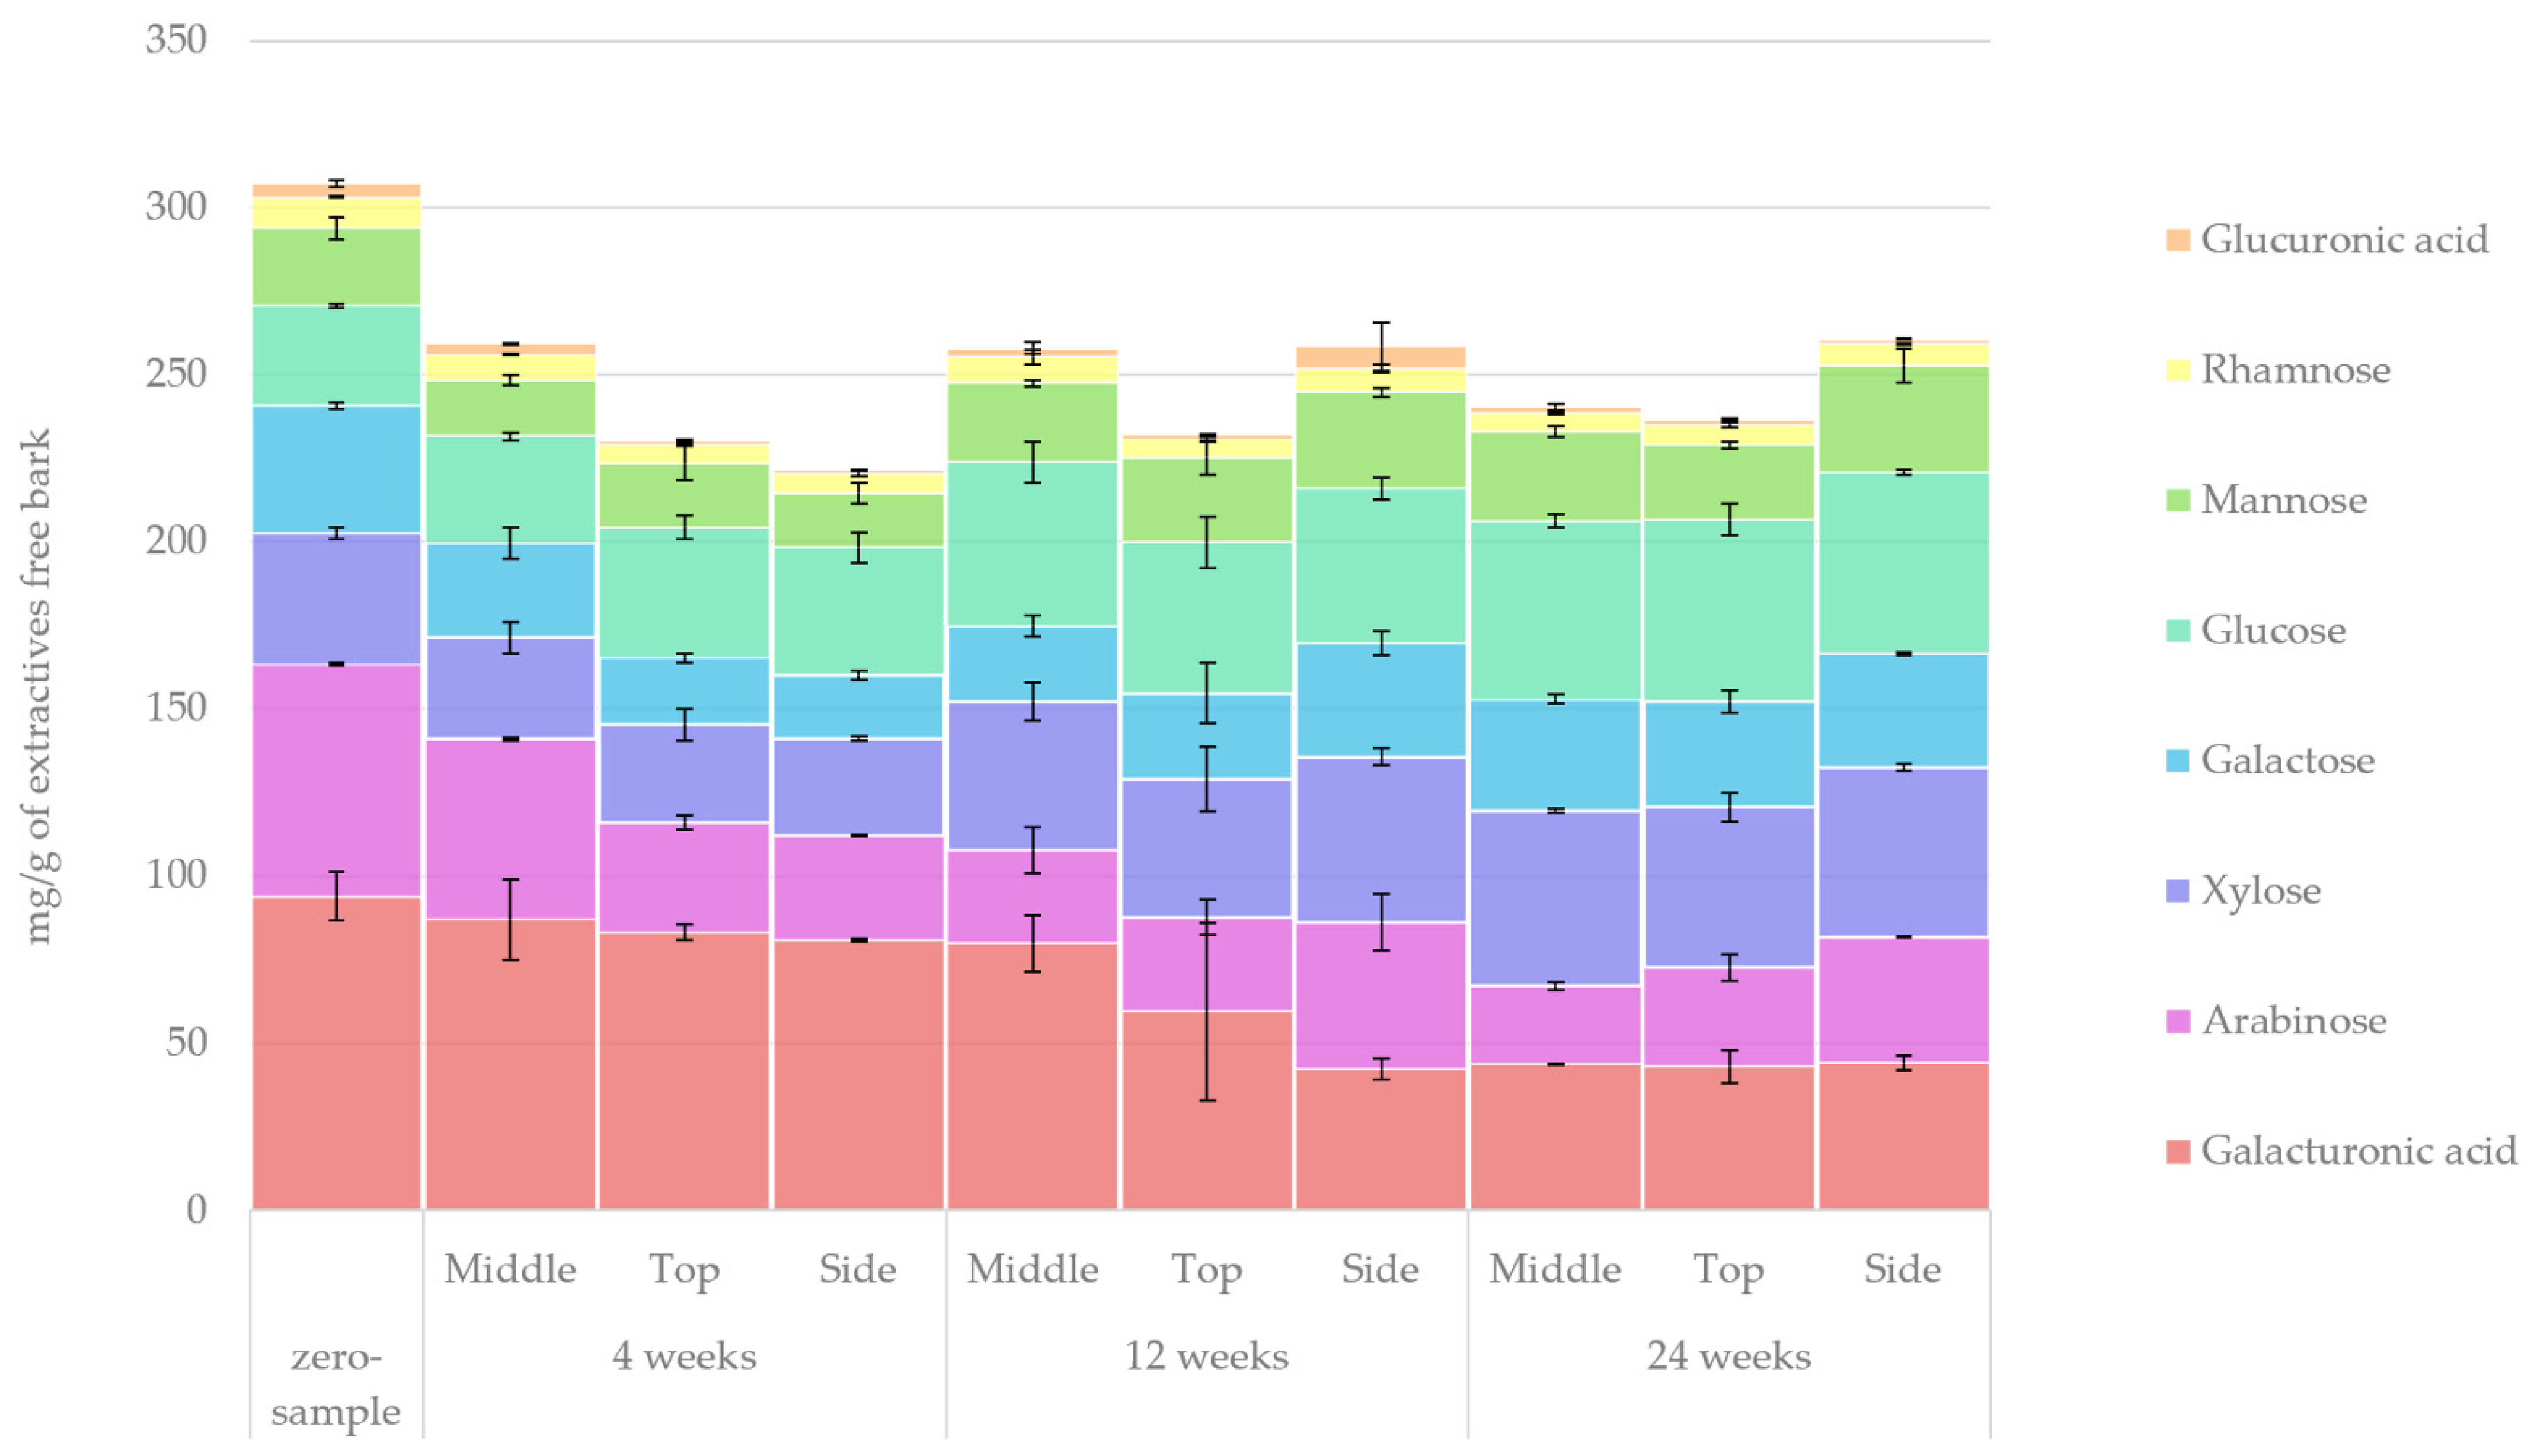
2.5.2. Acidic Methanolysis
3. Materials and Methods
3.1. Experimental Setup of Storage Studies and Sampling
3.2. Sample Pre-Treatment and Basic Characterisation
3.3. Calorific Values and Carbon, Hydrogen and Nitrogen (CHN) Measurements of Bark Samples
3.4. Chemicals
3.5. ASE Extraction
3.6. Gravimetric Analysis of Total Dissolved Solids and Preparation of Stock Solutions
3.7. Analysis of Bark Extractives with Chromatographic Methods
3.7.1. Qualitative Analysis of Bark Extracts by Gas Chromatography with Mass Selective Detection (GC-MS)
3.7.2. Quantitative Analysis of Bark Extracts by GC-FID
3.7.3. Analysis of Proanthocyanidins by High-Performance Liquid Chromatography (HPLC)
3.8. Carbohydrate Analyses
3.8.1. Acid Hydrolysis
3.8.2. High-Performance Anion-Exchange Chromatography (HPAEC) Analysis of Holocellulose-Derived Monosaccharides
3.8.3. UV–Vis Measurement of Acid-Soluble Lignin
3.8.4. Acidic Methanolysis
3.9. Statistical Analysis
4. Conclusions
Supplementary Materials
Author Contributions
Funding
Institutional Review Board Statement
Informed Consent Statement
Data Availability Statement
Acknowledgments
Conflicts of Interest
Sample Availability
References
- Hassan, M.K.; Villa, A.; Kuittinen, S.; Jänis, J.; Pappinen, A. An Assessment of Side-Stream Generation from Finnish Forest Industry. J. Mater. Cycles Waste Manag. 2019, 21, 265–280. [Google Scholar] [CrossRef]
- Berman, A.Y.; Motechin, R.A.; Wiesenfeld, M.Y.; Holz, M.K. The Therapeutic Potential of Resveratrol: A Review of Clinical Trials. NPJ Precis. Oncol. 2017, 1, 1–9. [Google Scholar] [CrossRef] [PubMed] [Green Version]
- Singh, A.P.; Kumar, S. Applications of Tannins in Industry. In Tannins-Structural Properties, Biological Properties and Current Knowledge, 1st ed.; Aires, A., Ed.; Intech Open: London, UK, 2020; pp. 117–136. [Google Scholar]
- Jirjis, R. Storage and Drying of Wood Fuel. Biomass Bioenergy 1995, 9, 181–190. [Google Scholar] [CrossRef]
- Fuller, W.S. Chip Pile Storage—A Review of Practices to Avoid Deterioration and Economic Losses. Tappi J. 1985, 68, 48–52. [Google Scholar]
- Brand, M.A.; de Muñiz, G.I.B.; Quirino, W.F.; Brito, J.O. Storage as a Tool to Improve Wood Fuel Quality. Biomass Bioenergy 2011, 35, 2581–2588. [Google Scholar] [CrossRef]
- Anerud, E.; Routa, J.; Bergström, D.; Eliasson, L. Fuel Quality of Stored Spruce Bark–Influence of Semi-Permeable Covering Material. Fuel 2020, 279, 118467. [Google Scholar] [CrossRef]
- Krigstin, S.; Wetzel, S. A Review of Mechanisms Responsible for Changes to Stored Woody Biomass Fuels. Fuel 2016, 175, 75–86. [Google Scholar] [CrossRef]
- Anerud, E.; Jirjis, R.; Larsson, G.; Eliasson, L. Fuel Quality of Stored Wood chips—Influence of Semi-Permeable Covering Material. Appl. Energy 2018, 231, 628–634. [Google Scholar] [CrossRef]
- Halmemies, E.S.; Brännström, H.E.; Nurmi, J.; Läspä, O.; Alén, R. Effect of Seasonal Storage on Single-Stem Bark Extractives of Norway Spruce (Picea abies). Forests 2021, 12, 736. [Google Scholar] [CrossRef]
- Jyske, T.; Brännström, H.; Sarjala, T.; Hellström, J.; Halmemies, E.; Raitanen, J.; Kaseva, J.; Lagerquist, L.; Eklund, P.; Nurmi, J. Fate of Antioxidative Compounds within Bark during Storage: A Case of Norway Spruce Logs. Molecules 2020, 25, 4228. [Google Scholar] [CrossRef]
- Zahri, S.; Belloncle, C.; Charrier, F.; Pardon, P.; Quideau, S.; Charrier, B. UV Light Impact on Ellagitannins and Wood Surface Colour of European Oak (Quercus petraea and Quercus robur). Appl. Surf. Sci. 2007, 253, 4985–4989. [Google Scholar] [CrossRef]
- George, B.; Suttie, E.; Merlin, A.; Deglise, X. Photodegradation and Photostabilisation of Wood—The State of the Art. Polym. Degrad. Stab. 2005, 88, 268–274. [Google Scholar] [CrossRef]
- Malan, F.S. Some Notes on the Effect of Wet-Storage on Timber. S. Afr. For. J. 2004, 202, 77–82. [Google Scholar] [CrossRef]
- Nozomi, M.; Takashi, F.; Takafumi, M.; Miyao, I.; Kenji, T. Effect of Wood Biomass Components on Self-Heating. Bioresour. Bioprocess 2021, 8, 1. [Google Scholar]
- Bhat, T.K.; Singh, B.; Sharma, O.P. Microbial Degradation of Tannins—A Current Perspective. Biodegradation 1998, 9, 343–357. [Google Scholar] [CrossRef] [PubMed]
- Dorado, J.; Van Beek, T.A.; Claassen, F.W.; Sierra-Alvarez, R. Degradation of Lipophilic Wood Extractive Constituents in Pinus sylvestris by the White-Rot Fungi Bjerkandera sp. and Trametes versicolor. Wood Sci. Technol. 2001, 35, 117–125. [Google Scholar] [CrossRef]
- Mallory, F.B.; Mallory, C.W. Photocyclization of Stilbenes and Related Molecules. Org. React. 2004, 30, 1–456. [Google Scholar]
- Olsson, V. Wet Storage of Timber: Problems and Solutions. Master’s Thesis, KTH Royal Institute of Technology, Stockholm, Sweden, 2005. [Google Scholar]
- Bianchi, S.; Koch, G.; Janzon, R.; Mayer, I.; Saake, B.; Pichelin, F. Hot Water Extraction of Norway Spruce (Picea abies [Karst.]) Bark: Analyses of the Influence of Bark Aging and Process Parameters on the Extract Composition. Holzforschung 2016, 70, 619–631. [Google Scholar] [CrossRef]
- Krogell, J.; Holmbom, B.; Pranovich, A.; Hemming, J.; Willför, S. Extraction and Chemical Characterization of Norway Spruce Inner and Outer Bark. Nord. Pulp Pap. Res. J. 2012, 27, 6–17. [Google Scholar] [CrossRef]
- Lappi, H.; Läspä, O.; Nurmi, J. Decrease in Extractives of Chain-Flail Residue. For. Refine Info Sheet, WP3 2014, 13, 1–3. [Google Scholar]
- Routa, J.; Brännström, H.; Hellström, J.; Laitila, J. Influence of Storage on the Physical and Chemical Properties of Scots Pine Bark. Bioenergy Res. 2021, 14, 575–587. [Google Scholar] [CrossRef]
- Routa, J.; Brännström, H.; Laitila, J. Effects of Storage on Dry Matter, Energy Content and Amount of Extractives in Norway Spruce Bark. Biomass Bioenergy 2020, 143, 105821. [Google Scholar] [CrossRef]
- Čabalová, I.; Bélik, M.; Kučerová, V.; Jurczyková, T. Chemical and Morphological Composition of Norway Spruce Wood (Picea abies, L.) in the Dependence of its Storage. Polymers 2021, 13, 1619. [Google Scholar] [CrossRef] [PubMed]
- Schuller, W.H.; Moore, R.N.; Lawrence, R.V. Air Oxidation of Resin Acids. II. the Structure of Palustric Acid and its Photosensitized Oxidation2. J. Am. Chem. Soc. 1960, 82, 1734–1738. [Google Scholar] [CrossRef]
- Hemingway, R.W.; Nelson, P.J.; Hillis, W.E. Rapid Oxidation of the Fats and Resins in Pinus Radiata Chips for Pitch Control. Tappi 1971, 54, 95–98. [Google Scholar]
- Hedmark, Å.; Scholz, M. Review of Environmental Effects and Treatment of Runoff from Storage and Handling of Wood. Bioresour. Technol. 2008, 99, 5997–6009. [Google Scholar] [CrossRef] [PubMed]
- Nurmi, J. Longterm Storage of Fuel Chips in Large Piles. Folia For. 1990, 767, 1–18. [Google Scholar]
- Jylhä, P.; Halmemies, E.; Hellström, J.; Hujala, M.; Kilpeläinen, P.; Brännström, H. The Effect of Thermal Drying on the Contents of Condensed Tannins and Stilbenes in Norway Spruce (Picea abies [L.] Karst.) Sawmill Bark. Ind. Crops. Prod. 2021, 173, 114090. [Google Scholar] [CrossRef]
- Krigstin, S.; Helmeste, C.; Jia, H.; Johnson, K.E.; Wetzel, S.; Volpe, S.; Faizal, W.; Ferrero, F. Comparative Analysis of Bark and Woodchip Biomass Piles for Enhancing Predictability of Self-Heating. Fuel 2019, 242, 699–709. [Google Scholar] [CrossRef]
- Neiva, D.M.; Araújo, S.; Gominho, J.; Carneiro, A.d.C.; Pereira, H. An Integrated Characterization of Picea abies Industrial Bark regarding Chemical Composition, Thermal Properties and Polar Extracts Activity. PLoS ONE 2018, 13, e0208270. [Google Scholar] [CrossRef]
- Josefsson, P.; Nilsson, F.; Sundström, L.; Norberg, C.; Lie, E.; Jansson, M.B.; Henriksson, G. Controlled Seasoning of Scots Pine Chips using an Albino Strain of Ophiostoma. Ind. Eng. Chem. Res. 2006, 45, 2374–2380. [Google Scholar] [CrossRef]
- DiGuistini, S.; Wang, Y.; Liao, N.Y.; Taylor, G.; Tanguay, P.; Feau, N.; Henrissat, B.; Chan, S.K.; Hesse-Orce, U.; Alamouti, S.M. Genome and Transcriptome Analyses of the Mountain Pine Beetle-Fungal Symbiont Grosmannia Clavigera, a Lodgepole Pine Pathogen. Proc. Natl. Acad. Sci. USA 2011, 108, 2504–2509. [Google Scholar] [CrossRef] [Green Version]
- Gunstone, F.D. Chemical Reactions of Fatty Acids with Special Reference to the Carboxyl Group. Eur. J. Lipid Sci. Technol. 2001, 103, 307–314. [Google Scholar] [CrossRef]
- Ekman, R. Resin during Storage and in Biological Treatment. In Pitch Control, Wood Resin and Deresination; Back, E.L., Allen, L.H., Eds.; TAPPI Press: Atlanta, GA, USA, 2000; pp. 185–195. [Google Scholar]
- Nielsen, N.P.K.; Nørgaard, L.; Strobel, B.W.; Felby, C. Effect of Storage on Extractives from Particle Surfaces of Softwood and Hardwood Raw Materials for Wood Pellets. Eur. J. Wood Wood Prod. 2009, 67, 19. [Google Scholar] [CrossRef]
- de Lima, E.J.; Alves, R.G.; Anunciação, T.A.D.; Silva, V.R.; Santos, L.D.S.; Soares, M.B.; Cardozo, N.; Costa, E.V.; Silva, F.; Koolen, H.H. Antitumor Effect of the Essential Oil from the Leaves of Croton matourensis aubl. (Euphorbiaceae). Molecules 2018, 23, 2974. [Google Scholar] [CrossRef] [Green Version]
- Axelsson, K.; Zendegi-Shiraz, A.; Swedjemark, G.; Borg-Karlson, A.; Zhao, T. Chemical Defence Responses of Norway Spruce to Two Fungal Pathogens. For. Pathol. 2020, 50, 12640. [Google Scholar] [CrossRef]
- Holmbom, B.; Avela, E. Studies on Tall Oil from Pine and Birch; Åbo Akademi: Åbo, Finland, 1971. [Google Scholar]
- Burčová, Z.; Kreps, F.; Greifová, M.; Jablonský, M.; Ház, A.; Schmidt, Š.; Šurina, I. Antibacterial and Antifungal Activity of Phytosterols and Methyl Dehydroabietate of Norway Spruce Bark Extracts. J. Biotechnol. 2018, 282, 18–24. [Google Scholar] [CrossRef]
- Assarsson, A.; Croon, I. Studies on Wood Resin, especially the Change in Chemical Composition during Seasoning of the Wood, Part 1. Changes in the Composition of the Ethyl Ether Soluble Part of the Extractives from Birch Wood during Log Seasoning. Sven. Papp. 1963, 21, 876–883. [Google Scholar]
- Xu, G.; Guan, L.; Sun, J.; Chen, Z. Oxidation of Cholesterol and Β-Sitosterol and Prevention by Natural Antioxidants. J. Agric. Food Chem. 2009, 57, 9284–9292. [Google Scholar] [CrossRef]
- Anerud, E.; Krigstin, S.; Routa, J.; Brännström, H.; Arshadi, M.; Helmeste, C.; Bergström, D.; Egnell, G. Dry Matter Losses during Biomass Storage-Measures to Minimize Feedstock Degradation. IEA Bioenergy: Task 43. 2019, pp. 1–45. Available online: https://task43.ieabioenergy.com/wp-content/uploads/sites/11/2020/01/EIA-Dry-Matter-Loss_Final.pdf (accessed on 6 January 2022).
- Schwarze, F.W. Wood Decay Under the Microscope. Fungal Biol. Rev. 2007, 21, 133–170. [Google Scholar] [CrossRef]
- Bianchi, S. Extraction and Characterization of Bark Tannins from Domestic Softwood Species. Ph.D. Thesis, Faculty of Mathematics, Informatics and Natural Sciences, Department of Biology, University of Hamburg, Hamburg, Germany, 2016. [Google Scholar]
- Timell, T.E. Isolation of Polysaccharides from the Bark of Gymnosperms. Sven. Papp. 1961, 64, 651–660. [Google Scholar]
- Herrera, V.A.S.; Mendoza, D.E.R.; Leino, A.; Mikkola, J.; Zolotukhin, A.; Eränen, K.; Salmi, T. Sugar Hydrogenation in Continuous Reactors: From Catalyst Particles Towards Structured Catalysts. Chem. Eng. Process Process Intensif. 2016, 109, 1–10. [Google Scholar] [CrossRef]
- Guo, Z.; Long, L.; Ding, S. Characterization of an L-Arabinose Isomerase from Bacillus Velezensis and its Application for L-Ribulose and L-Ribose Biosynthesis. Appl. Biochem. Biotechnol. 2020, 192, 935–951. [Google Scholar] [CrossRef] [PubMed]
- Eisenberg Jr, F.; Parthasarathy, R. Measurement of biosynthesis of myo-inositol from glucose 6-phosphate. In Methods in Enzymology; Elsevier: Amsterdam, The Netherlands, 1987; Volume 141, pp. 127–143. [Google Scholar]
- Alakoski, E.; Jämsén, M.; Agar, D.; Tampio, E.; Wihersaari, M. From Wood Pellets to Wood Chips, Risks of Degradation and Emissions from the Storage of Woody biomass–A Short Review. Renew. Sust. Energ. Rev. 2016, 54, 376–383. [Google Scholar] [CrossRef]
- Li, T. The Production of Glutamic Acid by Fermentation. Master’s Thesis, Univerity of Missouri, Columbia, SC, USA, 1965. [Google Scholar]
- Danilewicz, J.C. Role of Tartaric and Malic Acids in Wine Oxidation. J. Agric. Food Chem. 2014, 62, 5149–5155. [Google Scholar] [CrossRef]
- Jyske, T.; Laakso, T.; Latva-Mäenpää, H.; Tapanila, T.; Saranpää, P. Yield of Stilbene Glucosides from the Bark of Young and Old Norway Spruce Stems. Biomass Bioenergy 2014, 71, 216–227. [Google Scholar] [CrossRef]
- Mulat, D.G.; Latva-Mäenpää, H.; Koskela, H.; Saranpää, P.; Wähälä, K. Rapid Chemical Characterisation of Stilbenes in the Root Bark of Norway Spruce by Off-line HPLC/DAD–NMR. Phytochem. Anal. 2014, 25, 529–536. [Google Scholar] [CrossRef] [PubMed]
- Zhang, Y.S.; Ning, Z.X.; Yang, S.Z.; Wu, H. Antioxidation Properties and Mechanism of Action of Dihydromyricetin from Ampelopsis Grossedentata. Yao Xue Xue Bao Acta Pharm. Sin. 2003, 38, 241–244. [Google Scholar]
- Bianchi, S.; Gloess, A.N.; Kroslakova, I.; Mayer, I.; Pichelin, F. Analysis of the Structure of Condensed Tannins in Water Extracts from Bark Tissues of Norway Spruce (Picea abies [Karst.]) and Silver Fir (Abies alba [Mill.]) using MALDI-TOF Mass Spectrometry. Ind. Crop. Prod. 2014, 61, 430–437. [Google Scholar] [CrossRef]
- Hammerbacher, A.; Paetz, C.; Wright, L.P.; Fischer, T.C.; Bohlmann, J.; Davis, A.J.; Fenning, T.M.; Gershenzon, J.; Schmidt, A. Flavan-3-ols in Norway Spruce: Biosynthesis, Accumulation, and Function in Response to Attack by the Bark Beetle-Associated Fungus Ceratocystis polonica. Plant Physiol. 2014, 164, 2107–2122. [Google Scholar] [CrossRef] [Green Version]
- Matthews, S.; Mila, I.; Scalbert, A.; Donnelly, D.M. Extractable and Non-Extractable Proanthocyanidins in Barks. Phytochemistry 1997, 45, 405–410. [Google Scholar] [CrossRef]
- Kraus, T.E.; Dahlgren, R.A.; Zasoski, R.J. Tannins in Nutrient Dynamics of Forest Ecosystems-a Review. Plant Soil 2003, 256, 41–66. [Google Scholar] [CrossRef]
- CEN/TS 14774-2: 2004; Solid Biofuels—Methods for the Determination of Moisture Content-Oven Dry Method-Part 2: Total Moisture-Simplified Method. British Standards Institute: London, UK, 2004.
- BS EN 14775: 2009; Solid Biofuels—Determination of Ash Content. British Standards Institution: London, UK, 2009.
- CEN/TS 14918: 2005; Solid Biofuels—Method for the Determination of Calorific Value. British Standards Institution: London, UK, 2006.
- ISO, E.N. 16948: 2015; Solid Biofuels—Determination of Total Content of Carbon, Hydrogen and Nitrogen. European Committee for Standardization (CEN): Brussels, Belgium, 2015.
- Korkalo, P.; Korpinen, R.; Beuker, E.; Sarjala, T.; Hellström, J.; Kaseva, J.; Lassi, U.; Jyske, T. Clonal Variation in the Bark Chemical Properties of Hybrid Aspen: Potential for Added Value Chemicals. Molecules 2020, 25, 4403. [Google Scholar] [CrossRef] [PubMed]
- TAPPI Test Methods 222 om-02. Acid-Insoluble Lignin in Wood and Pulp. In 2002–2003 TAPPI Test Methods; TAPPI: Tokyo, Japan, 2002.
- TAPPI Useful Methods 250. Acid-Soluble Lignin in Wood and Pulp. In 1991 TAPPI Useful Methods; TAPPI: Tokyo, Japan, 1991.


| Storage Time | Sampling Location | Snow Cover | |
|---|---|---|---|
| Lipophilic Extractive Groups | |||
| Resin acids | 0.280 | 0.148 | 0.018 |
| Fatty acids | 0.313 | 0.115 | 0.285 |
| Diterpenoids | 0.058 | 0.651 | 0.157 |
| Sterols | 0.236 | 0.431 | 0.464 |
| Other lipophilic extractives | 0.379 | 0.166 | 0.157 |
| Unidentified | 0.022 | 0.142 | 0.005 |
| Steryl esters | 0.066 | 0.446 | 0.255 |
| Triglycerides | <0.001 | 0.764 | 0.200 |
| Hydrophilic Extractive Groups | |||
| Sugars | 0.355 | 0.078 | 0.344 |
| Organic acids | 0.527 | 0.010 | 0.400 |
| Sugar alcohols | 0.219 | 0.192 | 0.432 |
| Stilbenes | 0.039 | 0.670 | 0.170 |
| Flavonoids | 0.023 | 0.430 | 0.176 |
| Other phenolics | 0.031 | 0.404 | 0.458 |
| Alcohols | 0.076 | 0.233 | 0.319 |
| Lignans | 0.124 | 0.133 | 0.234 |
| Other hydrophilic extractives | 0.795 | 0.068 | 0.472 |
| Sesquistilbenes | 0.002 | 0.862 | n/a |
| Distilbenes | <0.001 | 0.805 | n/a |
| Unidentified | 0.005 | 0.719 | 0.499 |
| Condensed Tannins | |||
| Total concentration | 0.039 | 0.733 | 0.827 |
| Procyanidins | 0.039 | 0.733 | 0.827 |
| Prodelphinidins | 0.025 | 0.424 | 0.436 |
| DP | 0.039 | 1.000 | 0.005 |
| TDSs | |||
| n-Hexane extract | 0.288 | 0.201 | 0.324 |
| Hot-water extract | 0.006 | 0.161 | 0.364 |
| Biofuel Properties of Stored Bark | |||
| Ash content | 0.117 | 0.233 | 0.103 |
| Effective heating value | 0.280 | 0.153 | 0.024 |
| Storage Time, Weeks | Sampling Location | Moisture Content, % | Ash Content, % | Carbon Content 1, % | Hydrogen Content 2, % | Nitrogen Content 3, % | Effective Heating Value, MJ/kg |
|---|---|---|---|---|---|---|---|
| Normal Pile | |||||||
| 0 | 57.38 ± 0.68 | 3.21 ± 0.02 | 51.4 | 5.82 | 0.47 | 19.14 ± 0.02 | |
| 4 | Middle | 59.89 ± 1.05 | 3.30 ± 0.01 | 51.3 | 5.80 | 0.53 | 19.10 ± 0.01 |
| 4 | Side | 52.20 ± 1.22 | 3.53 ± 0.01 | 52.2 | 5.74 | 0.52 | 19.40 ± 0.01 |
| 4 | Top | 56.92 ± 0.64 | 3.46 ± 0.02 | 52.1 | 5.78 | 0.53 | 19.56 ± 0.03 |
| 12 | Middle | 61.40 ± 0.86 | 3.45 ± 0.01 | 51.1 | 5.73 | 0.53 | 18.78 ± 0.00 |
| 12 | Side | 53.09 ± 0.81 | 3.75 ± 0.02 | 51.7 | 5.63 | 0.55 | 19.37 ± 0.01 |
| 12 | Top | 51.65 ± 0.32 | 3.74 ± 0.01 | 52.2 | 5.59 | 0.54 | 19.40 ± 0.02 |
| 24 | Middle | 57.83 ± 0.40 | 3.53 ± 0.05 | 52.5 | 5.71 | 0.52 | 19.48 ± 0.01 |
| 24 | Side | 40.79 ± 0.82 | 3.85 ± 0.00 | 52.5 | 5.50 | 0.56 | 19.47 ± 0.02 |
| 24 | Top | 61.01 ± 0.71 | 4.17 ± 0.04 | 52.8 | 5.45 | 0.60 | 19.52 ± 0.01 |
| Snow-Covered Pile | |||||||
| 0 | 56.01 ± 0.89 | 3.12 ± 0.01 | 51.3 | 5.77 | 0.47 | 19.11 ± 0.01 | |
| 24 | Middle | 62.05 ± 0.73 | 3.77 ± 0.12 | 51.8 | 5.65 | 0.50 | 19.36 ± 0.01 |
| 24 | Side | 64.33 ± 0.44 | 4.92 ± 0.08 | 51.5 | 5.34 | 0.61 | 19.09 ± 0.02 |
| 24 | Top | 69.50 ± 0.45 | 8.47 ± 0.35 | 49.9 | 5.27 | 0.56 | 18.13 ± 0.02 |
Publisher’s Note: MDPI stays neutral with regard to jurisdictional claims in published maps and institutional affiliations. |
© 2022 by the authors. Licensee MDPI, Basel, Switzerland. This article is an open access article distributed under the terms and conditions of the Creative Commons Attribution (CC BY) license (https://creativecommons.org/licenses/by/4.0/).
Share and Cite
Halmemies, E.S.; Alén, R.; Hellström, J.; Läspä, O.; Nurmi, J.; Hujala, M.; Brännström, H.E. Behaviour of Extractives in Norway Spruce (Picea abies) Bark during Pile Storage. Molecules 2022, 27, 1186. https://0-doi-org.brum.beds.ac.uk/10.3390/molecules27041186
Halmemies ES, Alén R, Hellström J, Läspä O, Nurmi J, Hujala M, Brännström HE. Behaviour of Extractives in Norway Spruce (Picea abies) Bark during Pile Storage. Molecules. 2022; 27(4):1186. https://0-doi-org.brum.beds.ac.uk/10.3390/molecules27041186
Chicago/Turabian StyleHalmemies, Eelis S., Raimo Alén, Jarkko Hellström, Otto Läspä, Juha Nurmi, Maija Hujala, and Hanna E. Brännström. 2022. "Behaviour of Extractives in Norway Spruce (Picea abies) Bark during Pile Storage" Molecules 27, no. 4: 1186. https://0-doi-org.brum.beds.ac.uk/10.3390/molecules27041186