
Analysis of Vicinal Water in Soft Contact Lenses Using a Combination of Infrared Absorption Spectroscopy and Multivariate Curve Resolution


Abstract
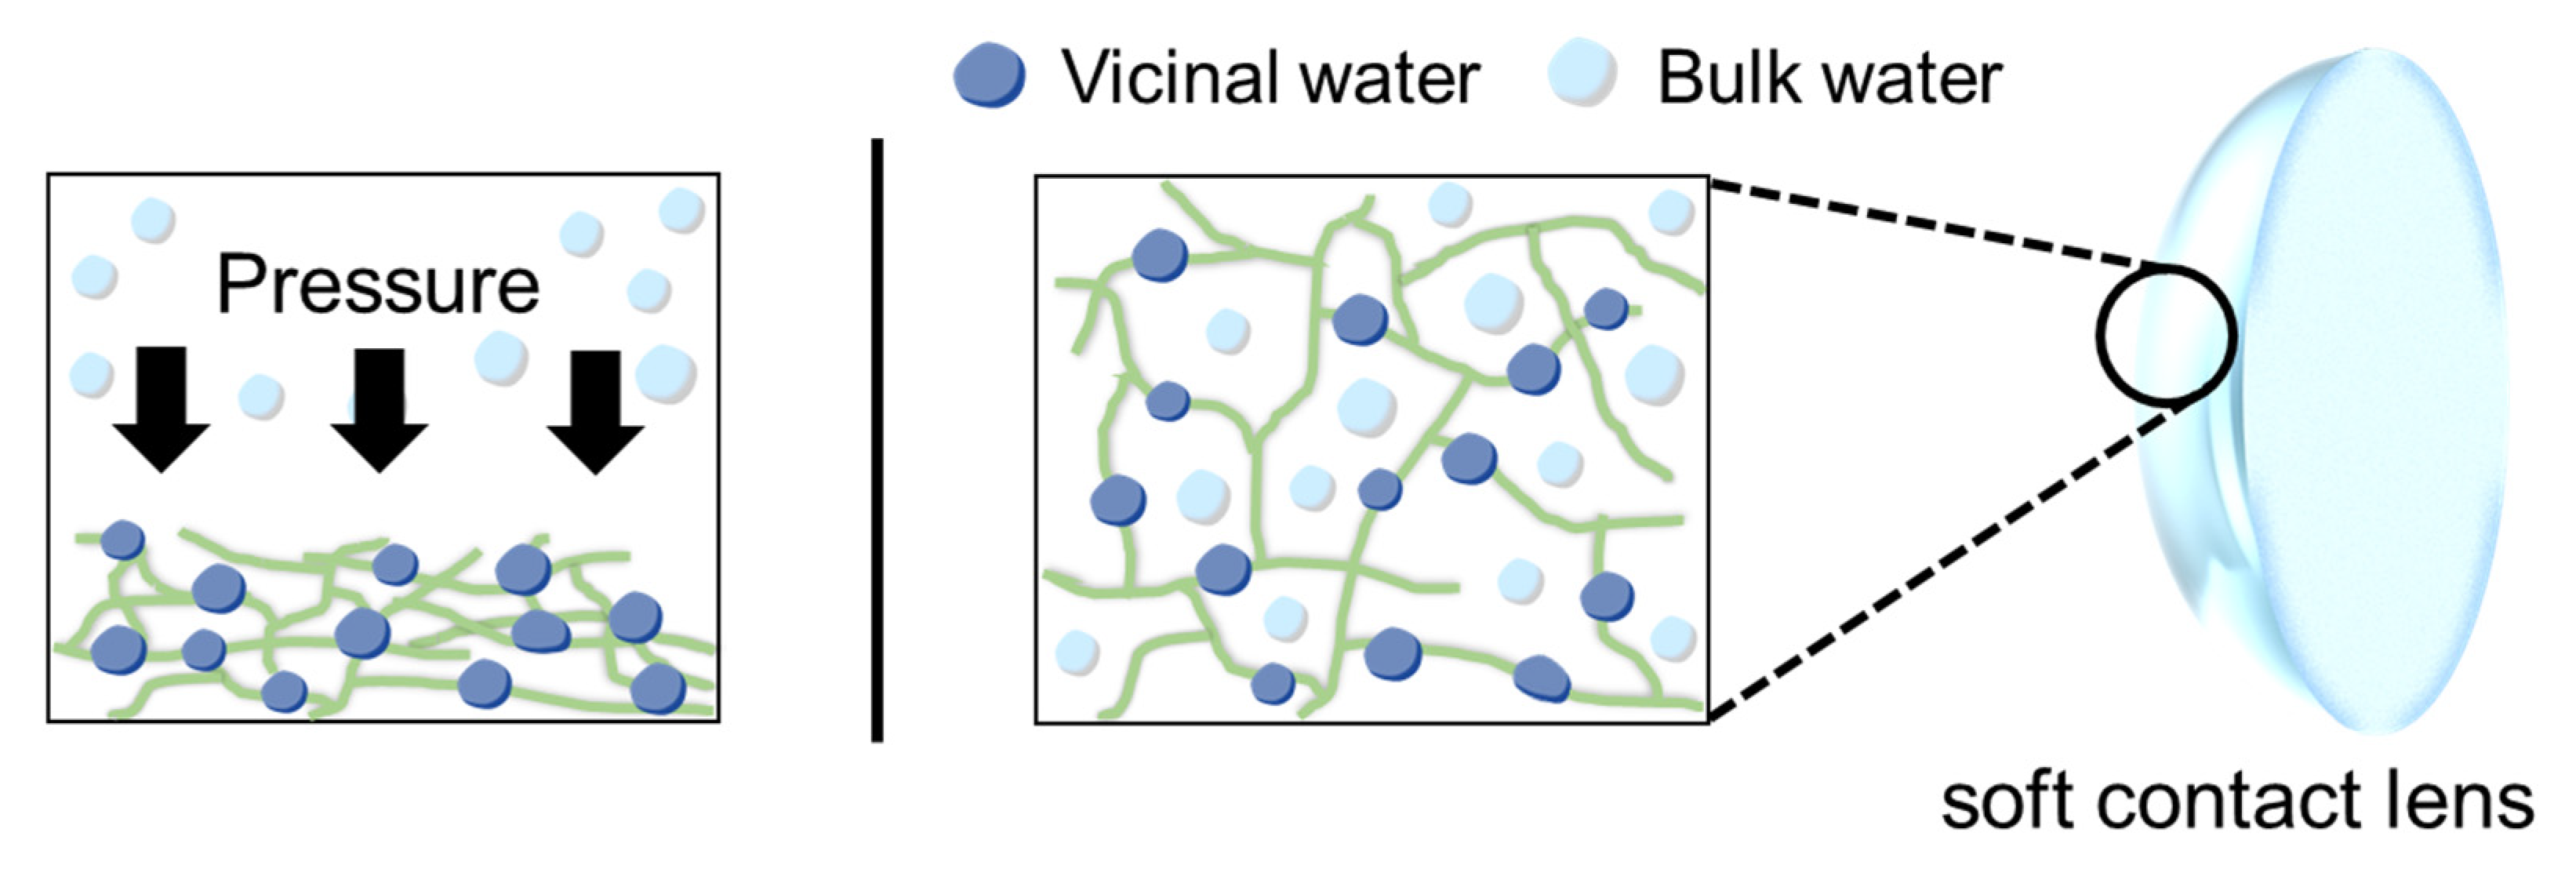
:1. Introduction
2. Materials and Methods
2.1. Soft Contact Lenses (SCLs)
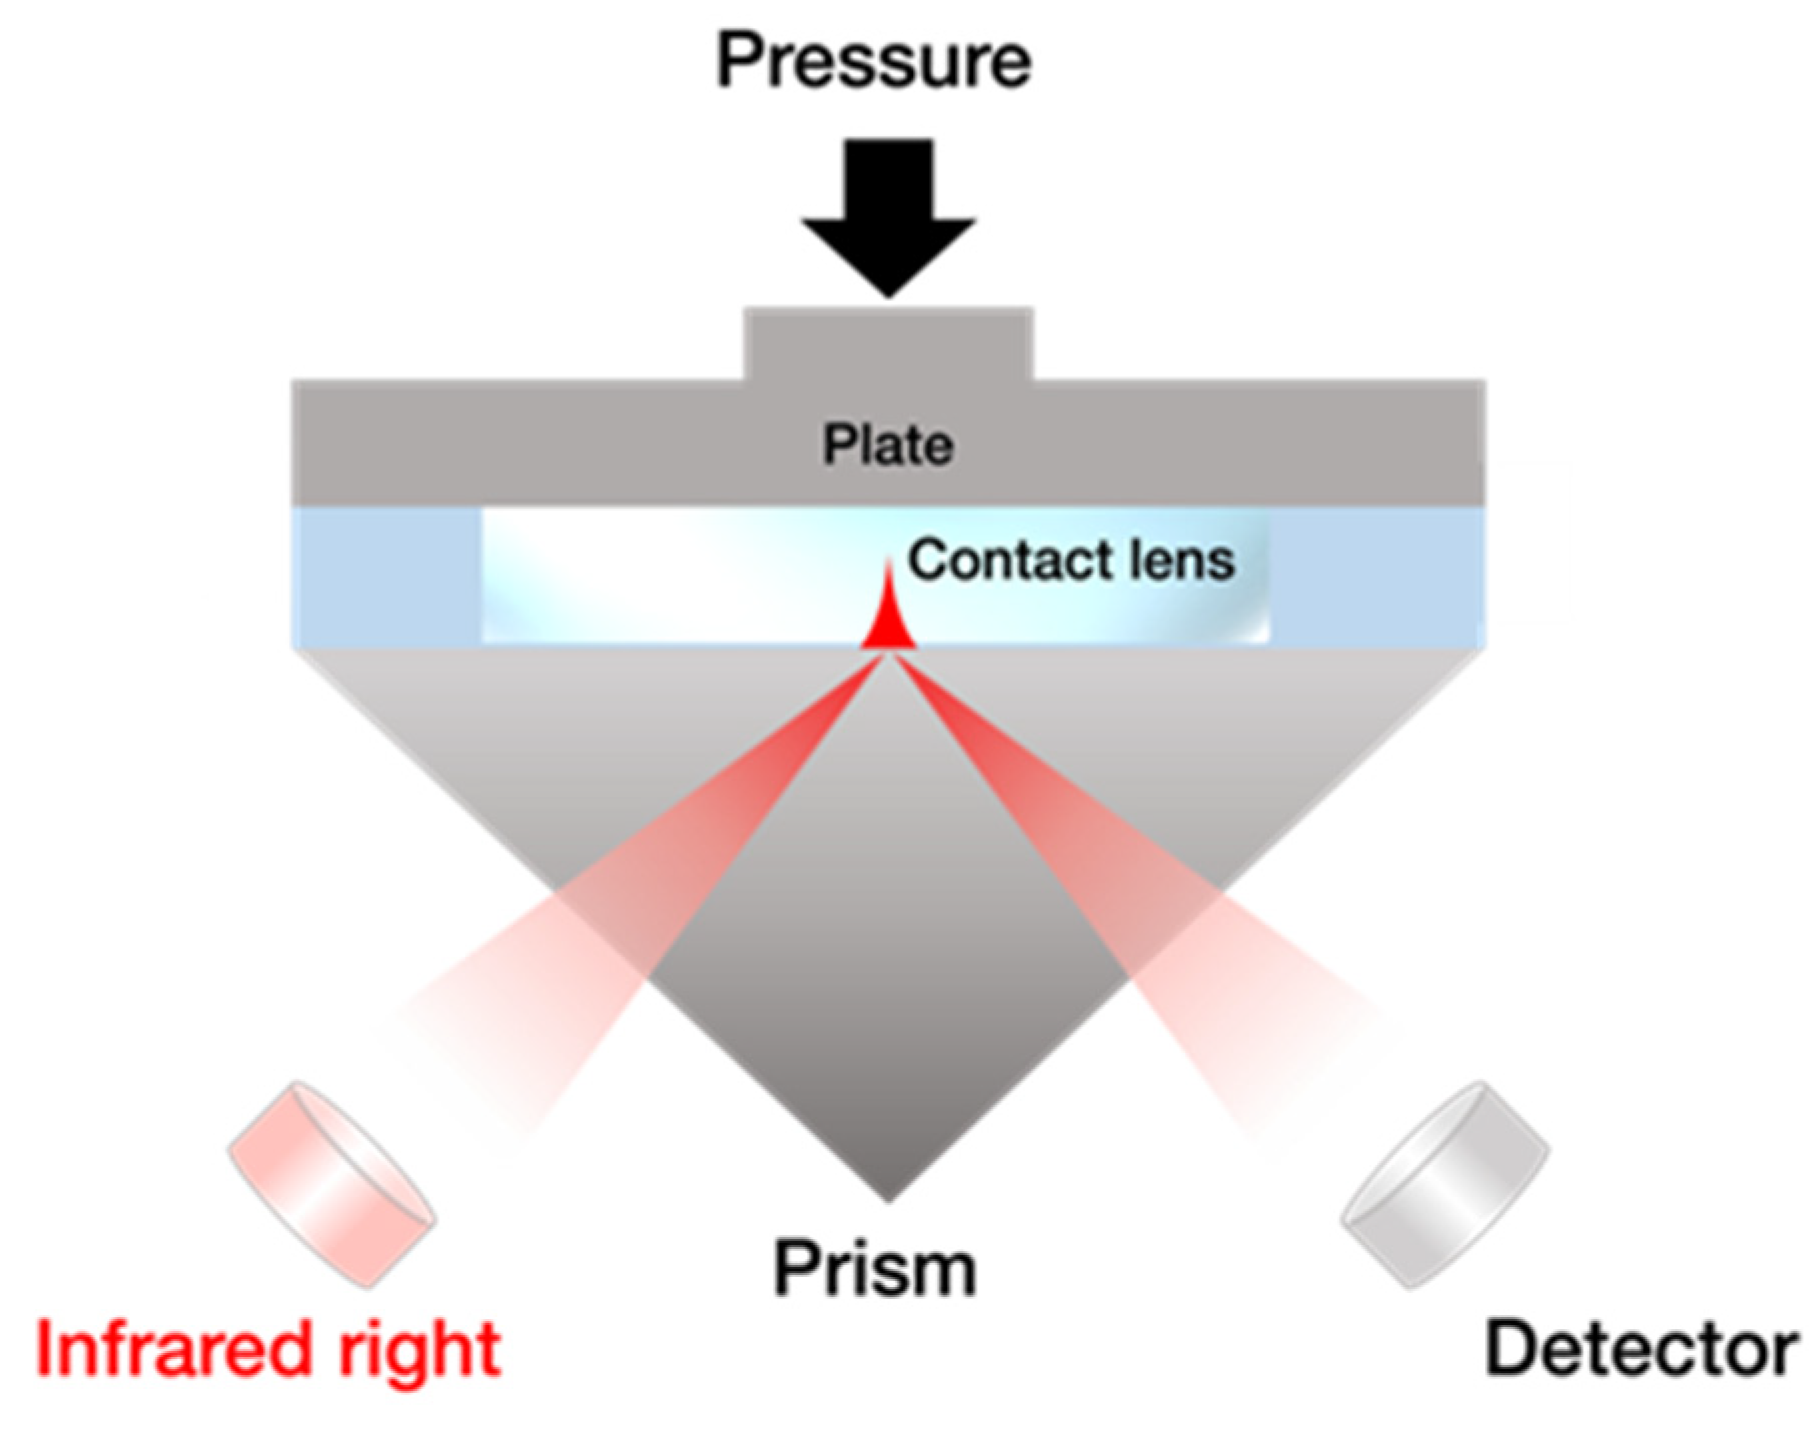
2.2. Attenuated Total Reflection—Infrared Spectroscopy (ATR-IR)
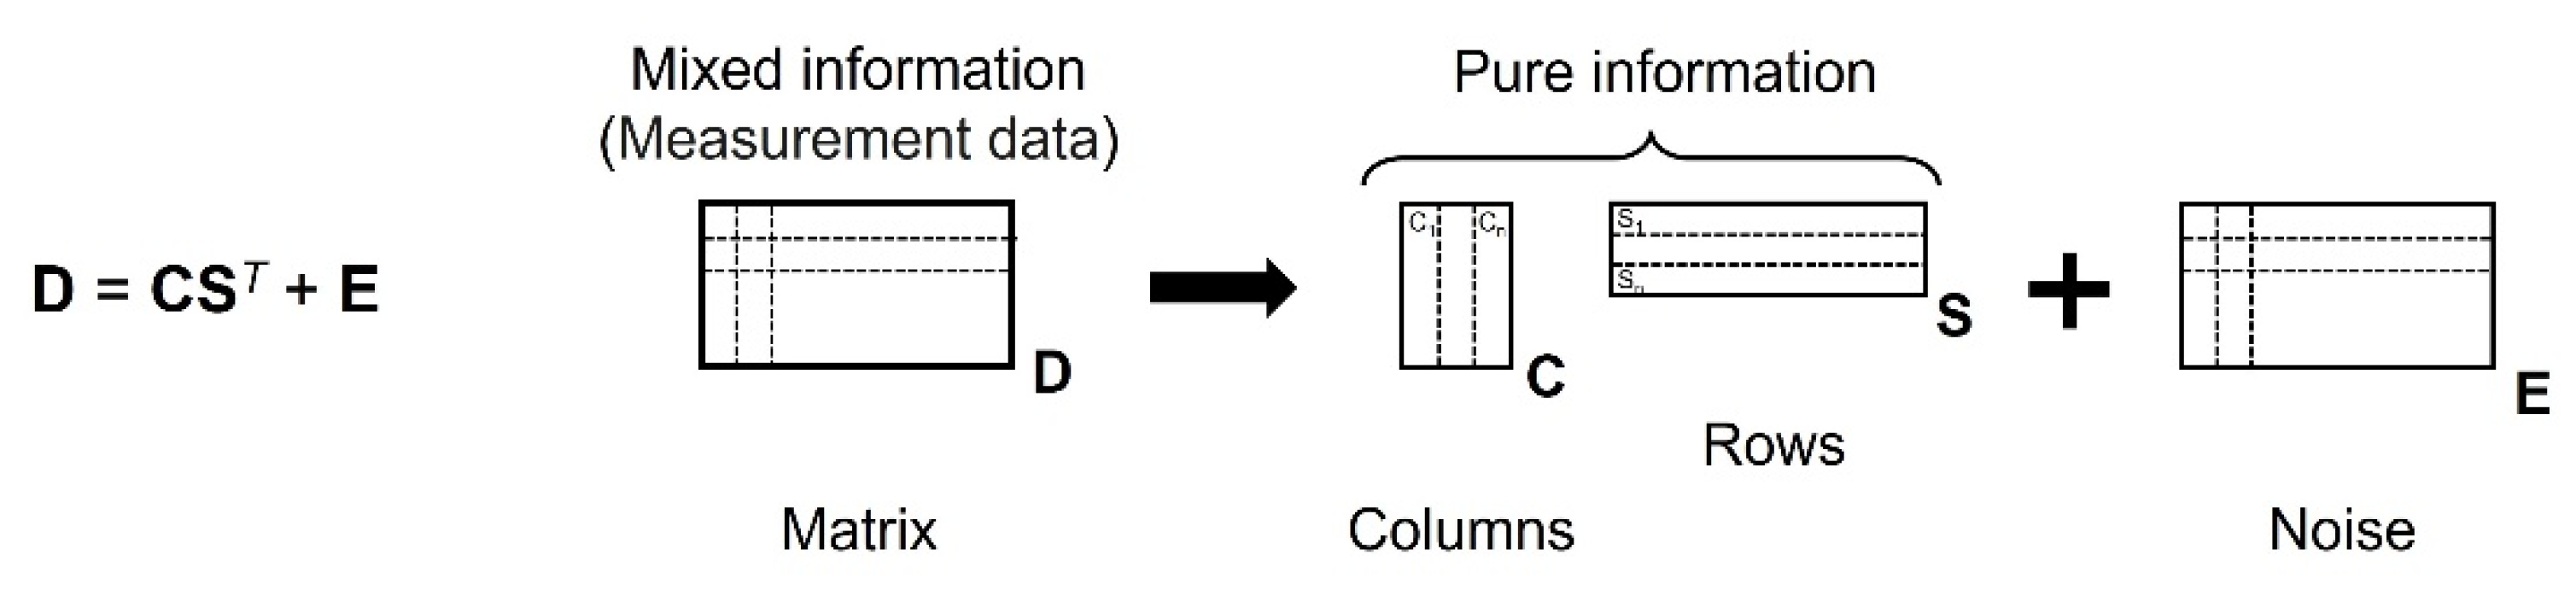
2.3. Multivariate Curve Resolution—Alternating Least Squares (MCR-ALS)
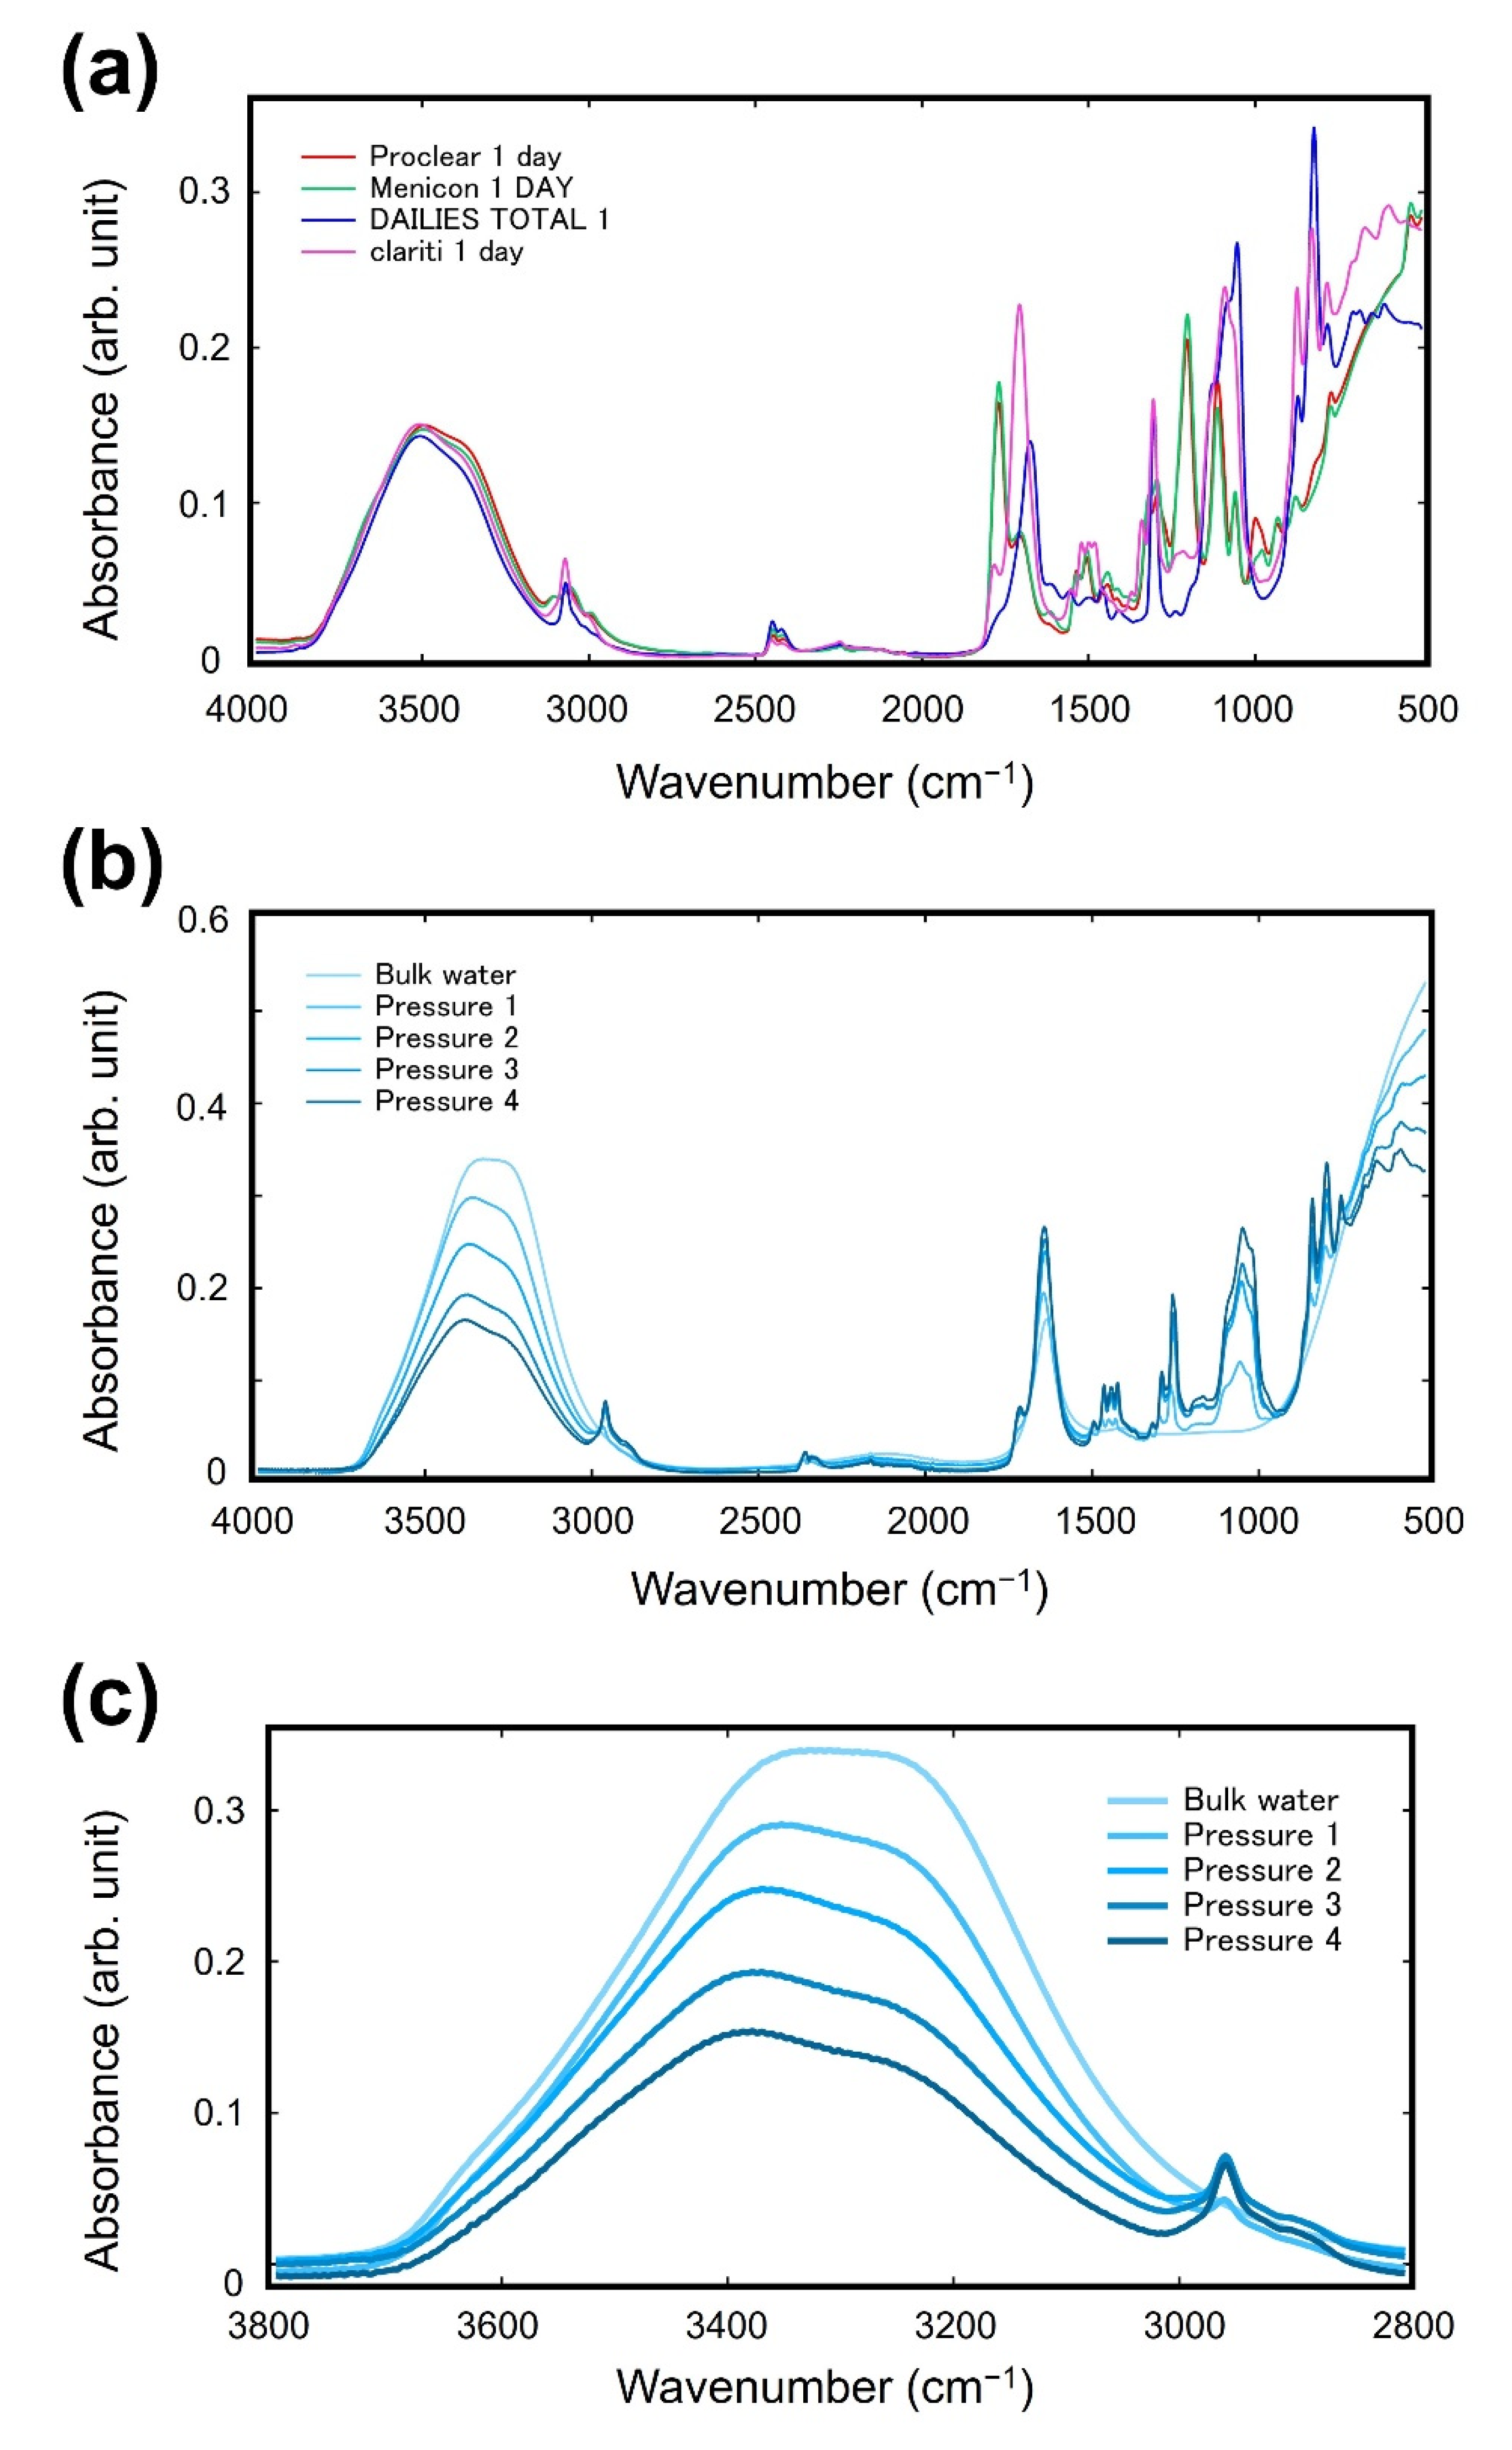
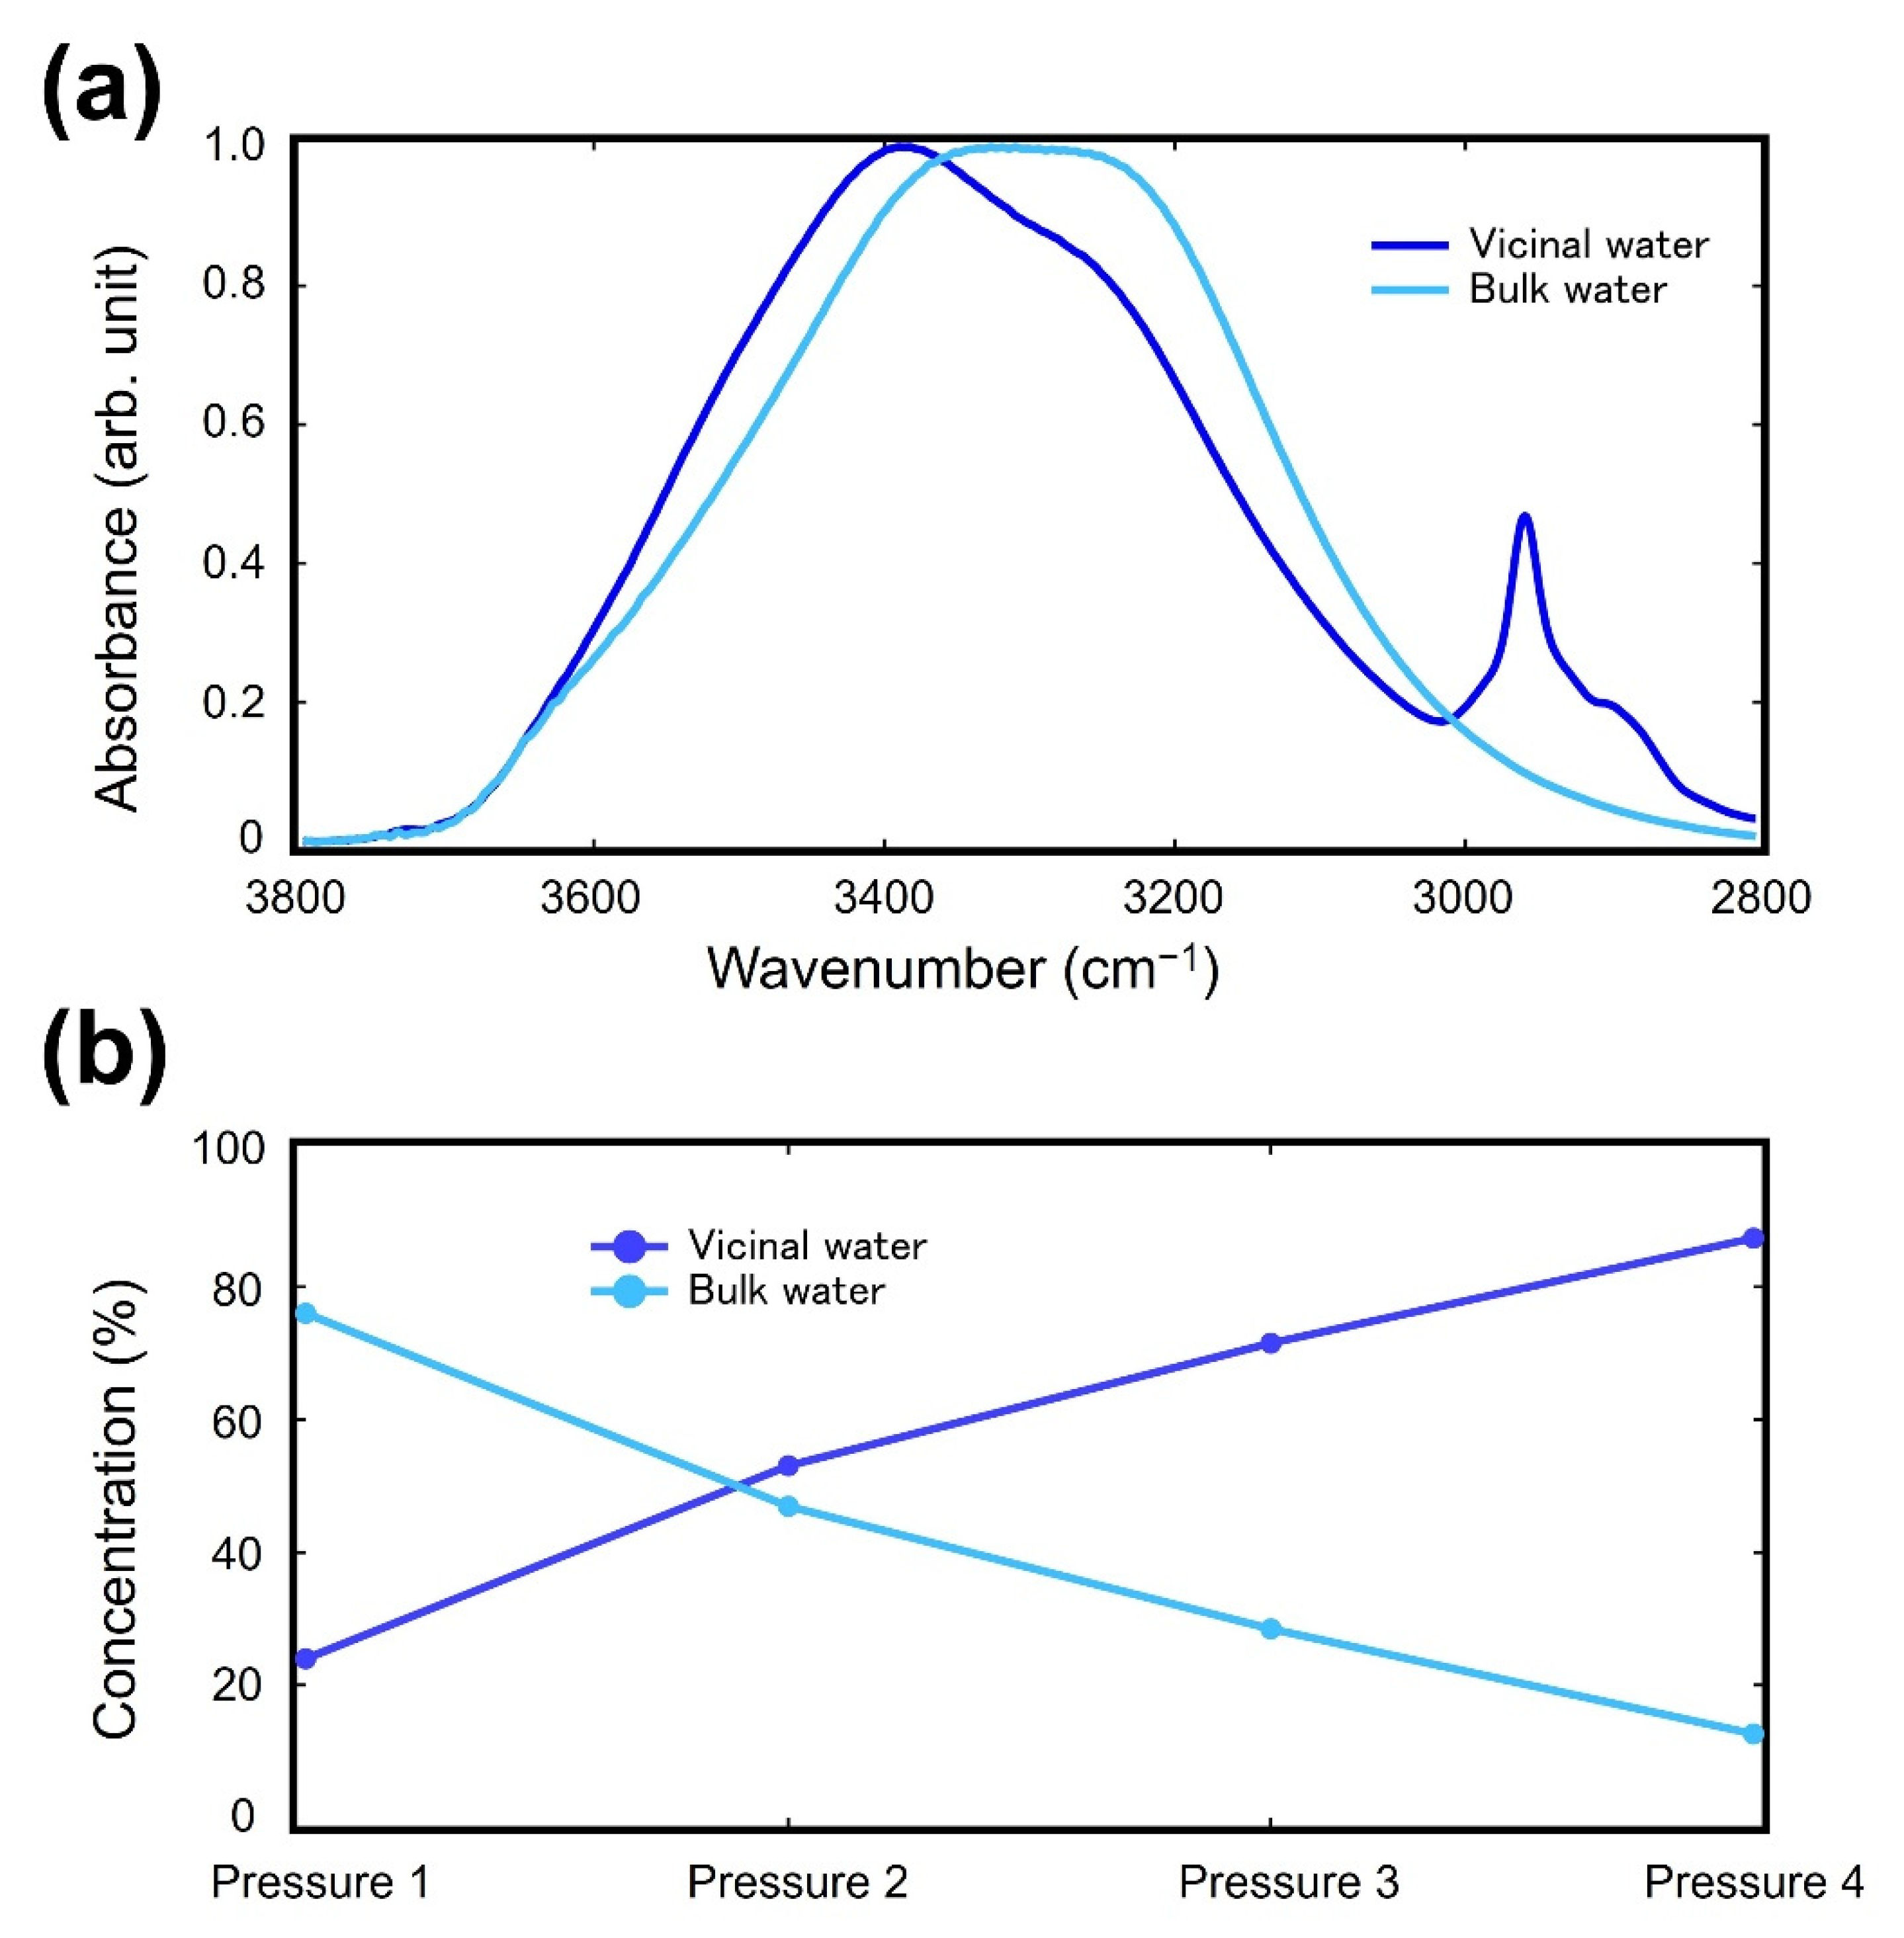
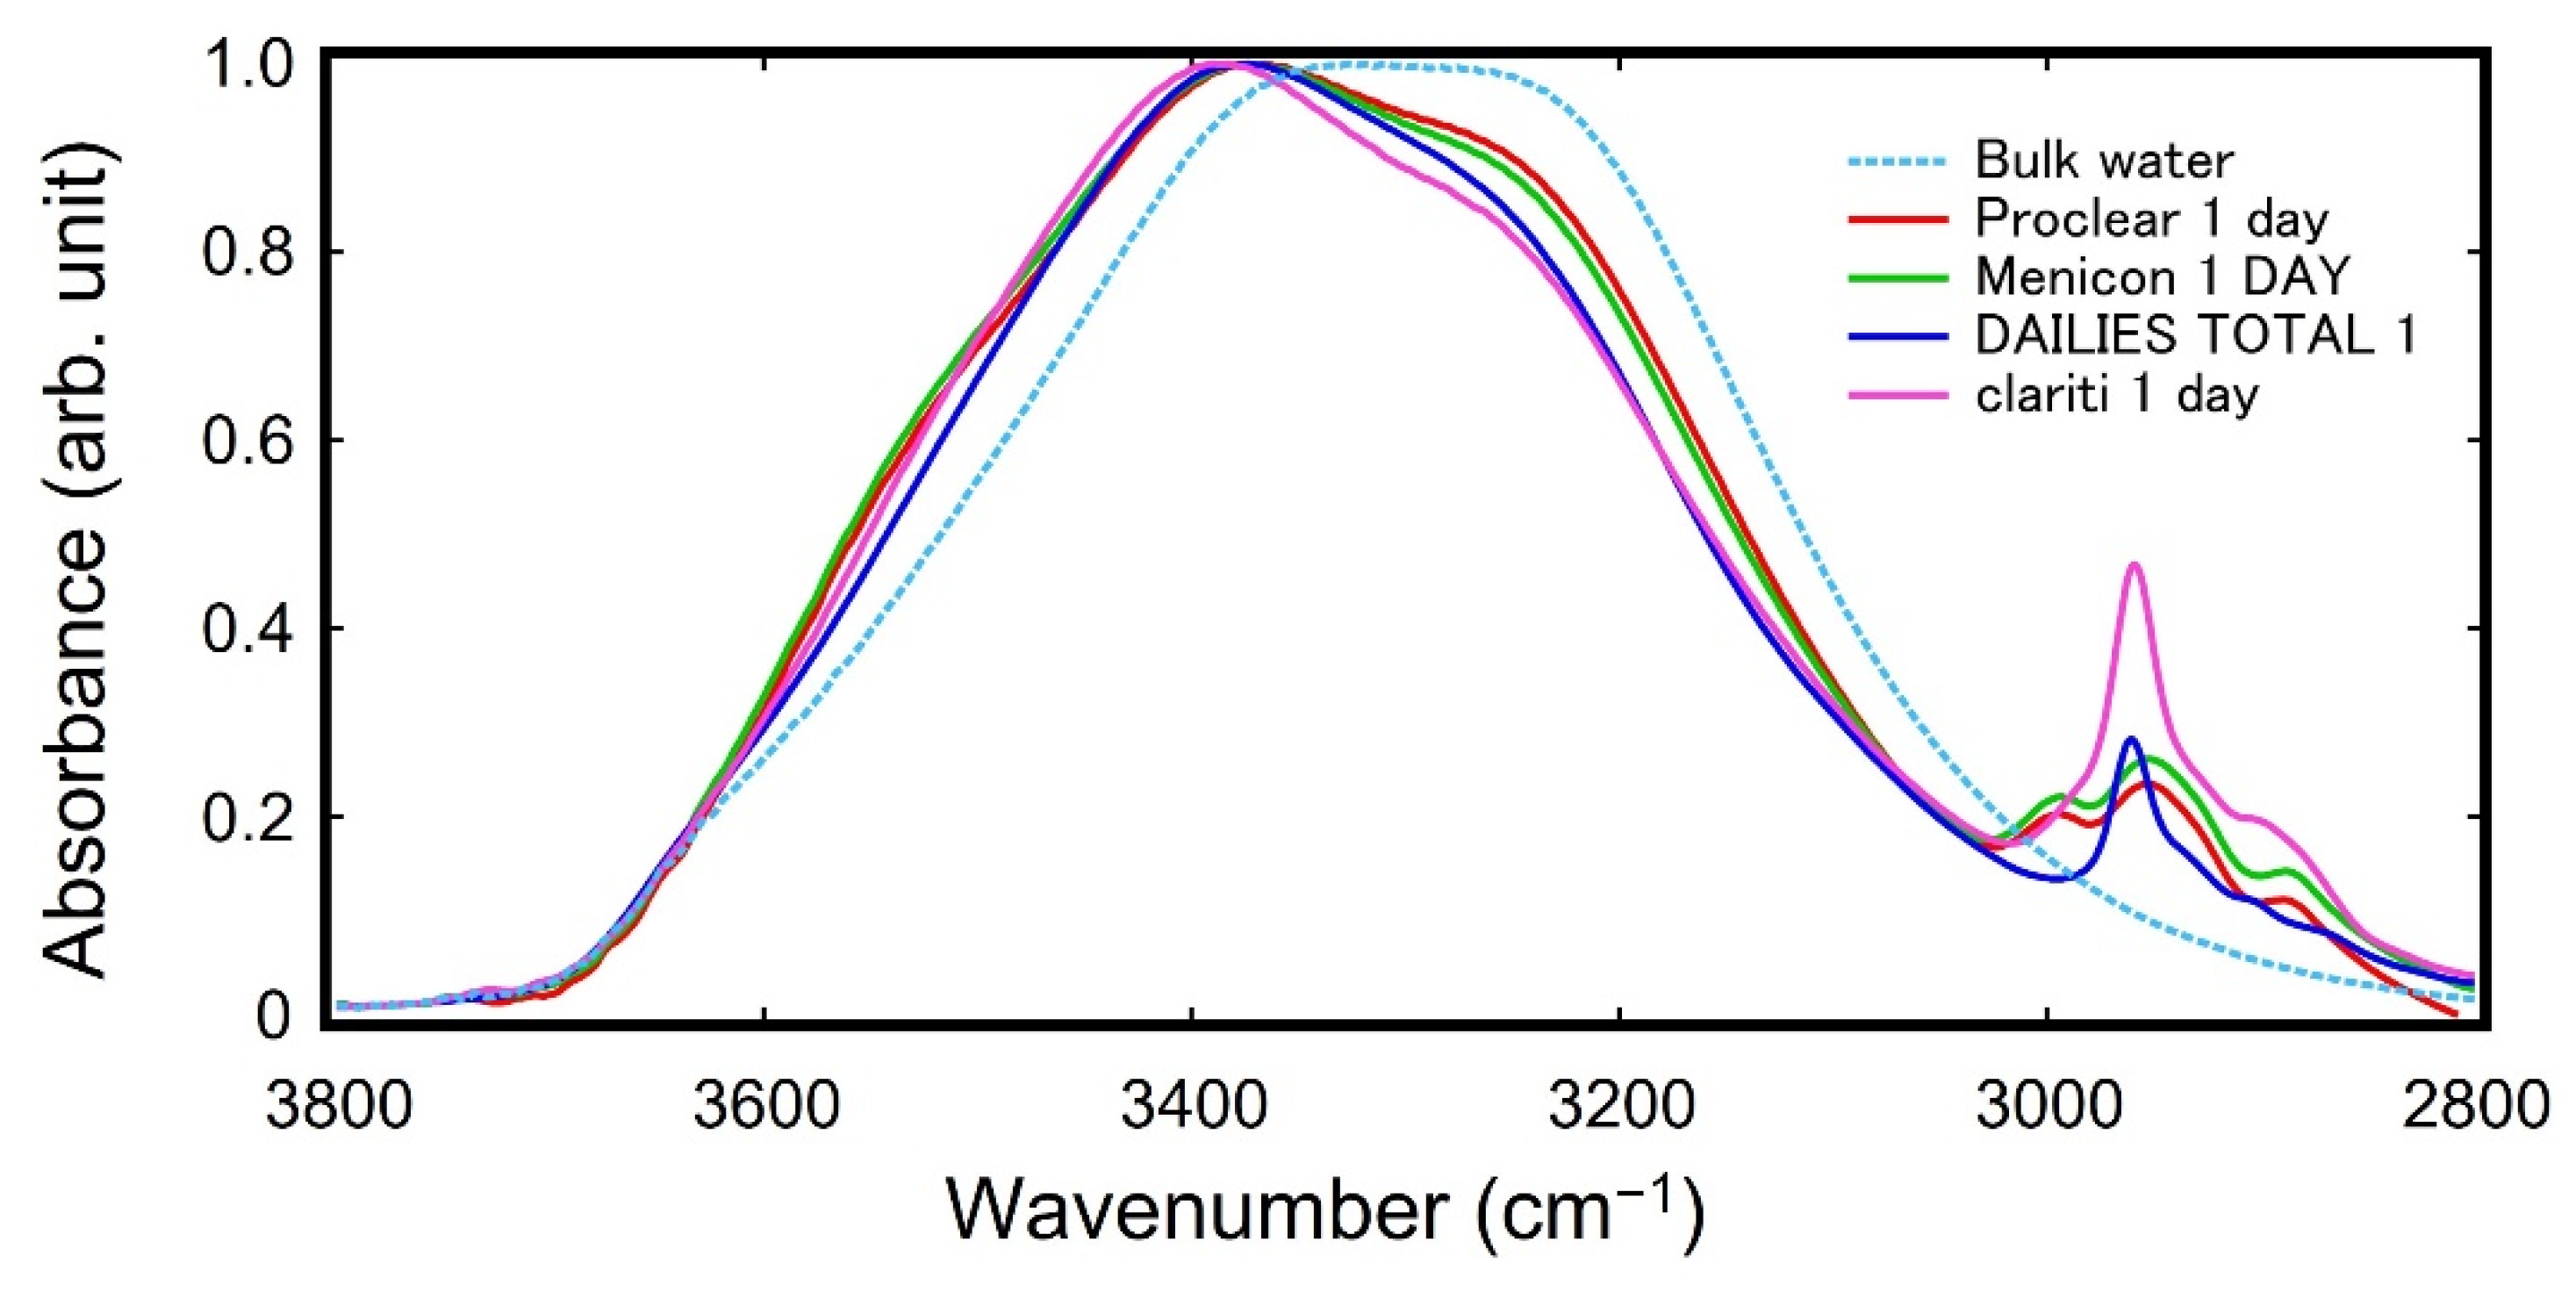
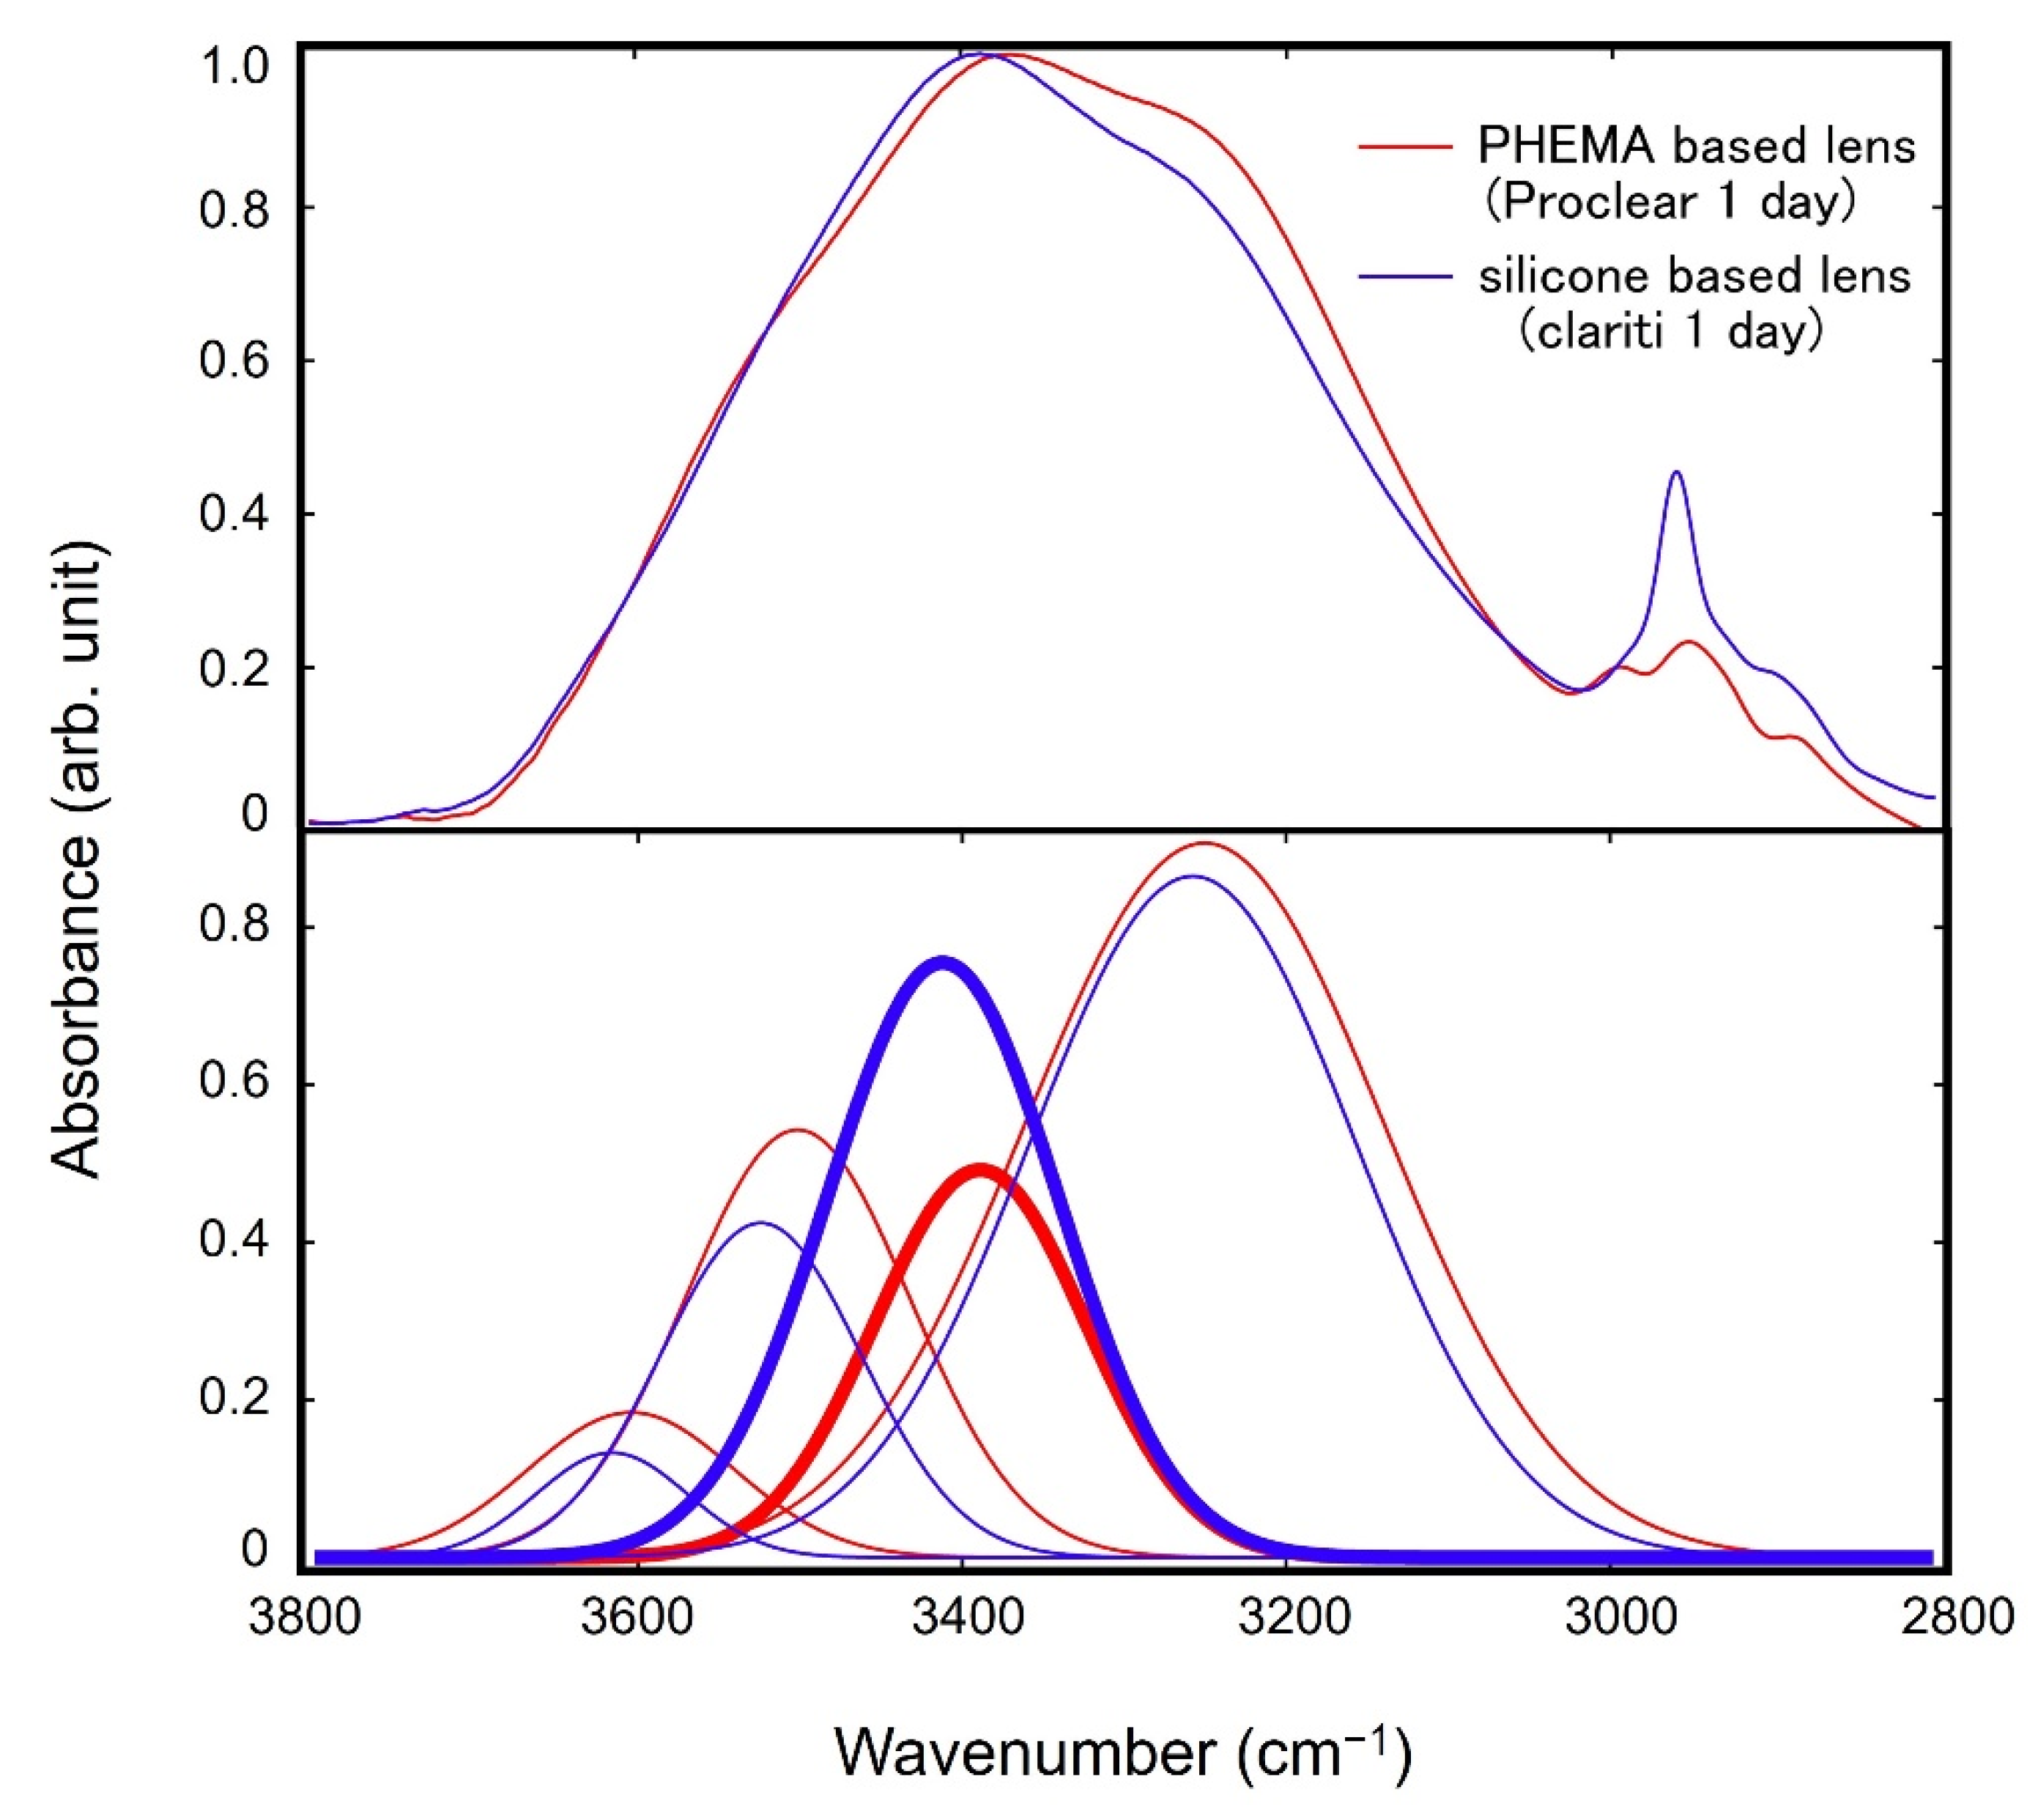
3. Results and Discussion
4. Conclusions
Author Contributions
Funding
Institutional Review Board Statement
Informed Consent Statement
Data Availability Statement
Acknowledgments
Conflicts of Interest
References
- Björneholm, O.; Hansen, M.H.; Hodgson, A.; Liu, L.M.; Limmer, D.T.; Michaelides, A.; Pedevilla, P.; Rossmeisl, J.; Shen, H.; Tocci, G.; et al. Water at interfaces. Chem. Rev. 2016, 116, 7698–7726. [Google Scholar] [CrossRef] [PubMed]
- Hayashi, T. Water at interfaces: Its Behavior and Roles in Interfacial Phenomena. Chem. Lett. 2021, 50, 1173–1180. [Google Scholar] [CrossRef]
- Vogler, E.A. Structure and reactivity of water at biomaterial surfaces. Adv. Colloid Interface Sci. 1998, 74, 69–117. [Google Scholar] [CrossRef]
- Patel, A.; Mequanint, K. Hydrogel biomaterials. In Biomedical Engineering—Frontiers and Challenges; Reza, F.R., Ed.; In Tech: London, UK, 2011; pp. 275–296. [Google Scholar]
- Ratner, B.D.; Latour, R.A. Role of water in biomaterials. In Biomaterials Science; Academic Press: Cambridge, MA, USA, 2020; pp. 77–82. [Google Scholar]
- Garrett, Q.; Laycock, B.; Garrett, R.W. Hydrogel lens monomer constituents modulate protein sorption. Investig. Ophthalmol. Vis. Sci. 2000, 41, 1687–1695. [Google Scholar]
- Garrett, Q.; Garrett, R.W.; Milthorpe, B.K. Lysozyme sorption in hydrogel contact lenses. Investig. Ophthalmol. Vis. Sci. 1999, 40, 897–903. [Google Scholar]
- Luensmann, D.; Jones, L. Protein deposition on contact lenses: The past, the present, and the future. Contact Lens Anterior Eye 2012, 35, 53–64. [Google Scholar] [CrossRef]
- Kim, S.H.; Opdahl, A.; Marmo, C.; Somorjai, G.A. AFM and SFG studies of pHEMA-based hydrogel contact lens surfaces in saline solution: Adhesion, Friction, and the Presence of Non-Crosslinked Polymer Chains at the Surface. Biomaterials 2002, 23, 1657–1666. [Google Scholar] [CrossRef]
- Ahmed, M.; Singh, A.K.; Mondal, J.A. Hydrogen-bonding and vibrational coupling of water in a hydrophobic hydration shell as observed by Raman-MCR and isotopic dilution spectroscopy. Phys. Chem. Chem. Phys. 2016, 18, 2767–2775. [Google Scholar] [CrossRef]
- Nagasawa, D.; Azuma, T.; Noguchi, H.; Uosaki, K.; Takai, M. Role of interfacial water in protein adsorption onto polymer brushes as studied by sfg spectroscopy and QCM. J. Phys. Chem. C 2015, 119, 17193–17201. [Google Scholar] [CrossRef]
- Morita, S.; Tanaka, M.; Ozaki, Y. Time-resolved in situ ATR-IR observations of the process of sorption of water into a poly (2-methoxyethyl acrylate) film. Langmuir 2007, 23, 3750–3761. [Google Scholar] [CrossRef]
- Bai, M.Y.; Ku, F.Y.; Shyu, J.F.; Hayashi, T.; Wu, C.C. Evaluation of polyacrylonitrile nonwoven mats and silver-gold bimetallic nanoparticle-decorated nonwoven mats for potential promotion of wound healing In Vitro and In Vivo and bone growth In Vitro. Polymers 2021, 13, 516. [Google Scholar] [CrossRef] [PubMed]
- Leng, C.; Sun, S.; Zhang, K.; Jiang, S.; Chen, Z. Molecular level studies on interfacial hydration of zwitterionic and other antifouling polymers in situ. Acta Biomater. 2016, 40, 6–15. [Google Scholar] [CrossRef] [PubMed]
- Ardila, J.A.; Funari, C.S.; Andrade, A.M.; Cavalheiro, A.J.; Carneiro, R.L. Cluster analysis of commercial samples of Bauhinia spp. using HPLC-UV/PDA and MCR-ALS/PCA without peak alignment procedure. Phytochem. Anal. 2015, 26, 367–373. [Google Scholar] [CrossRef] [PubMed]
- Pere-Trepat, E.; Lacorte, S.; Tauler, R. Solving liquid chromatography mass spectrometry coelution problems in the analysis of environmental samples by multivariate curve resolution. J. Chromatogr. A 2005, 1096, 111–122. [Google Scholar] [CrossRef]
- Dantas, C.; Tauler, R.; Miguel, M.; Ferreira, C. Exploring In Vivo violacein biosynthesis by application of multivariate curve resolution on fused UV-VIS absorption, fluorescence, and liquid chromatography-mass spectrometry data. Anal. Bioanal. Chem. 2013, 405, 1293–1302. [Google Scholar] [CrossRef]
- Sinanian, M.M.; Cook, D.W.; Rutan, S.C.; Wijesinghe, D.S. Multivariate curve resolution-alternating least squares analysis of high-resolution liquid chromatography-mass spectrometry data. Anal. Chem. 2016, 88, 11092–11099. [Google Scholar] [CrossRef]
- Spegazzini, N.; Ruisanchez, I.; Larrechi, M.S. MCR-ALS for sequential estimation of FTIR-ATR spectra to resolve a curing process using global phase angle convergence criterion. Anal. Chim. Acta 2009, 642, 155–162. [Google Scholar] [CrossRef]
- Bortolato, S.A.; Olivieri, A.C. Chemometric processing of second-order liquid chromatographic data with UV-Vis and fluorescence detection. A comparison of multivariate curve resolution and parallel factor analysis 2. Anal. Chim. Acta 2014, 842, 11–19. [Google Scholar] [CrossRef]
- Johnson, J.A.; Gray, J.H.; Rodeberg, N.T.; Wightman, R.M. Multivariate curve resolution for signal isolation from fast-scan cyclic voltammetric data. Anal. Chem. 2017, 89, 10547–10555. [Google Scholar] [CrossRef] [Green Version]
- Diaz-Cruz, M.S.; Mendieta, J.; Tauler, R.; Esteban, M. Multivariate curve resolution of cyclic voltammetric data: Application to the Study of the Cadmium-Binding Properties of Glutathione. Anal. Chem. 1999, 71, 4629–4636. [Google Scholar] [CrossRef]
- Torres, M.; Diaz-Cruz, J.M.; Arino, C.; Grabaric, B.S.; Tauler, R.; Esteban, M. Multivariate curve resolution analysis of voltammetric data obtained at different time windows: Study of the System Cd2+–Nitrilotriacetic Acid. Anal. Chim. Acta 1998, 371, 23–37. [Google Scholar] [CrossRef]
- Tauler, R. Multivariate curve resolution applied to second order data. Chemom. Intell. Lab. Syst. 1995, 30, 133–146. [Google Scholar] [CrossRef]
- Jaumot, J.; Gargallo, R.; de Juan, A.; Tauler, R. A graphical user-friendly interface for MCR-ALS: A New Tool for Multivariate Curve Resolution in MATLAB. Chemom. Intell. Lab. Syst. 2005, 76, 101–110. [Google Scholar] [CrossRef]
- Tanaka, M.; Hayashi, T.; Morita, S. The roles of water molecules at the biointerface of medical polymers. Polym. J. 2013, 45, 701–710. [Google Scholar] [CrossRef]
- Tanaka, M.; Morita, S.; Hayashi, T. Role of interfacial water in determining the interactions of proteins and cells with hydrated materials. Colloids Surf. B Biointerfaces 2021, 198, 111449. [Google Scholar] [CrossRef]
- Hayashi, T.; Tanaka, M.; Yamamoto, S.; Shimomura, M.; Hara, M. Direct observation of interaction between proteins and blood-compatible polymer surfaces. Biointerphases 2007, 2, 119–125. [Google Scholar] [CrossRef] [PubMed] [Green Version]


| Trade Name | USAN Name | FDA Category (Group) | Constituent Monomers |
|---|---|---|---|
| Proclear® 1 day | omafilcon A | II | HEMA, MPC |
| Menicon® 1 DAY | ocufilcon D | IV | HEMA, MAA |
| DAILIES TOTAL 1® | delefilcon A | V | silane, NNDMAA |
| clariti® 1 day | somofilcon A | V | silane, NVP |
Publisher’s Note: MDPI stays neutral with regard to jurisdictional claims in published maps and institutional affiliations. |
© 2022 by the authors. Licensee MDPI, Basel, Switzerland. This article is an open access article distributed under the terms and conditions of the Creative Commons Attribution (CC BY) license (https://creativecommons.org/licenses/by/4.0/).
Share and Cite
Maeda, S.; Chikami, S.; Latag, G.V.; Song, S.; Iwakiri, N.; Hayashi, T. Analysis of Vicinal Water in Soft Contact Lenses Using a Combination of Infrared Absorption Spectroscopy and Multivariate Curve Resolution. Molecules 2022, 27, 2130. https://0-doi-org.brum.beds.ac.uk/10.3390/molecules27072130
Maeda S, Chikami S, Latag GV, Song S, Iwakiri N, Hayashi T. Analysis of Vicinal Water in Soft Contact Lenses Using a Combination of Infrared Absorption Spectroscopy and Multivariate Curve Resolution. Molecules. 2022; 27(7):2130. https://0-doi-org.brum.beds.ac.uk/10.3390/molecules27072130
Chicago/Turabian StyleMaeda, Shoichi, Shunta Chikami, Glenn Villena Latag, Subin Song, Norio Iwakiri, and Tomohiro Hayashi. 2022. "Analysis of Vicinal Water in Soft Contact Lenses Using a Combination of Infrared Absorption Spectroscopy and Multivariate Curve Resolution" Molecules 27, no. 7: 2130. https://0-doi-org.brum.beds.ac.uk/10.3390/molecules27072130