
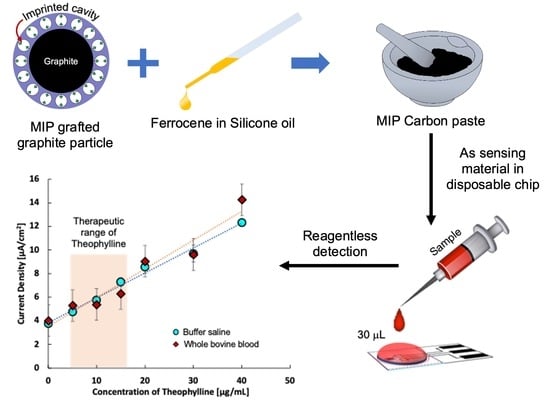
A Disposable Sensor Chip Using a Paste Electrode with Surface-Imprinted Graphite Particles for Rapid and Reagentless Monitoring of Theophylline


Abstract
:
1. Introduction
2. Results
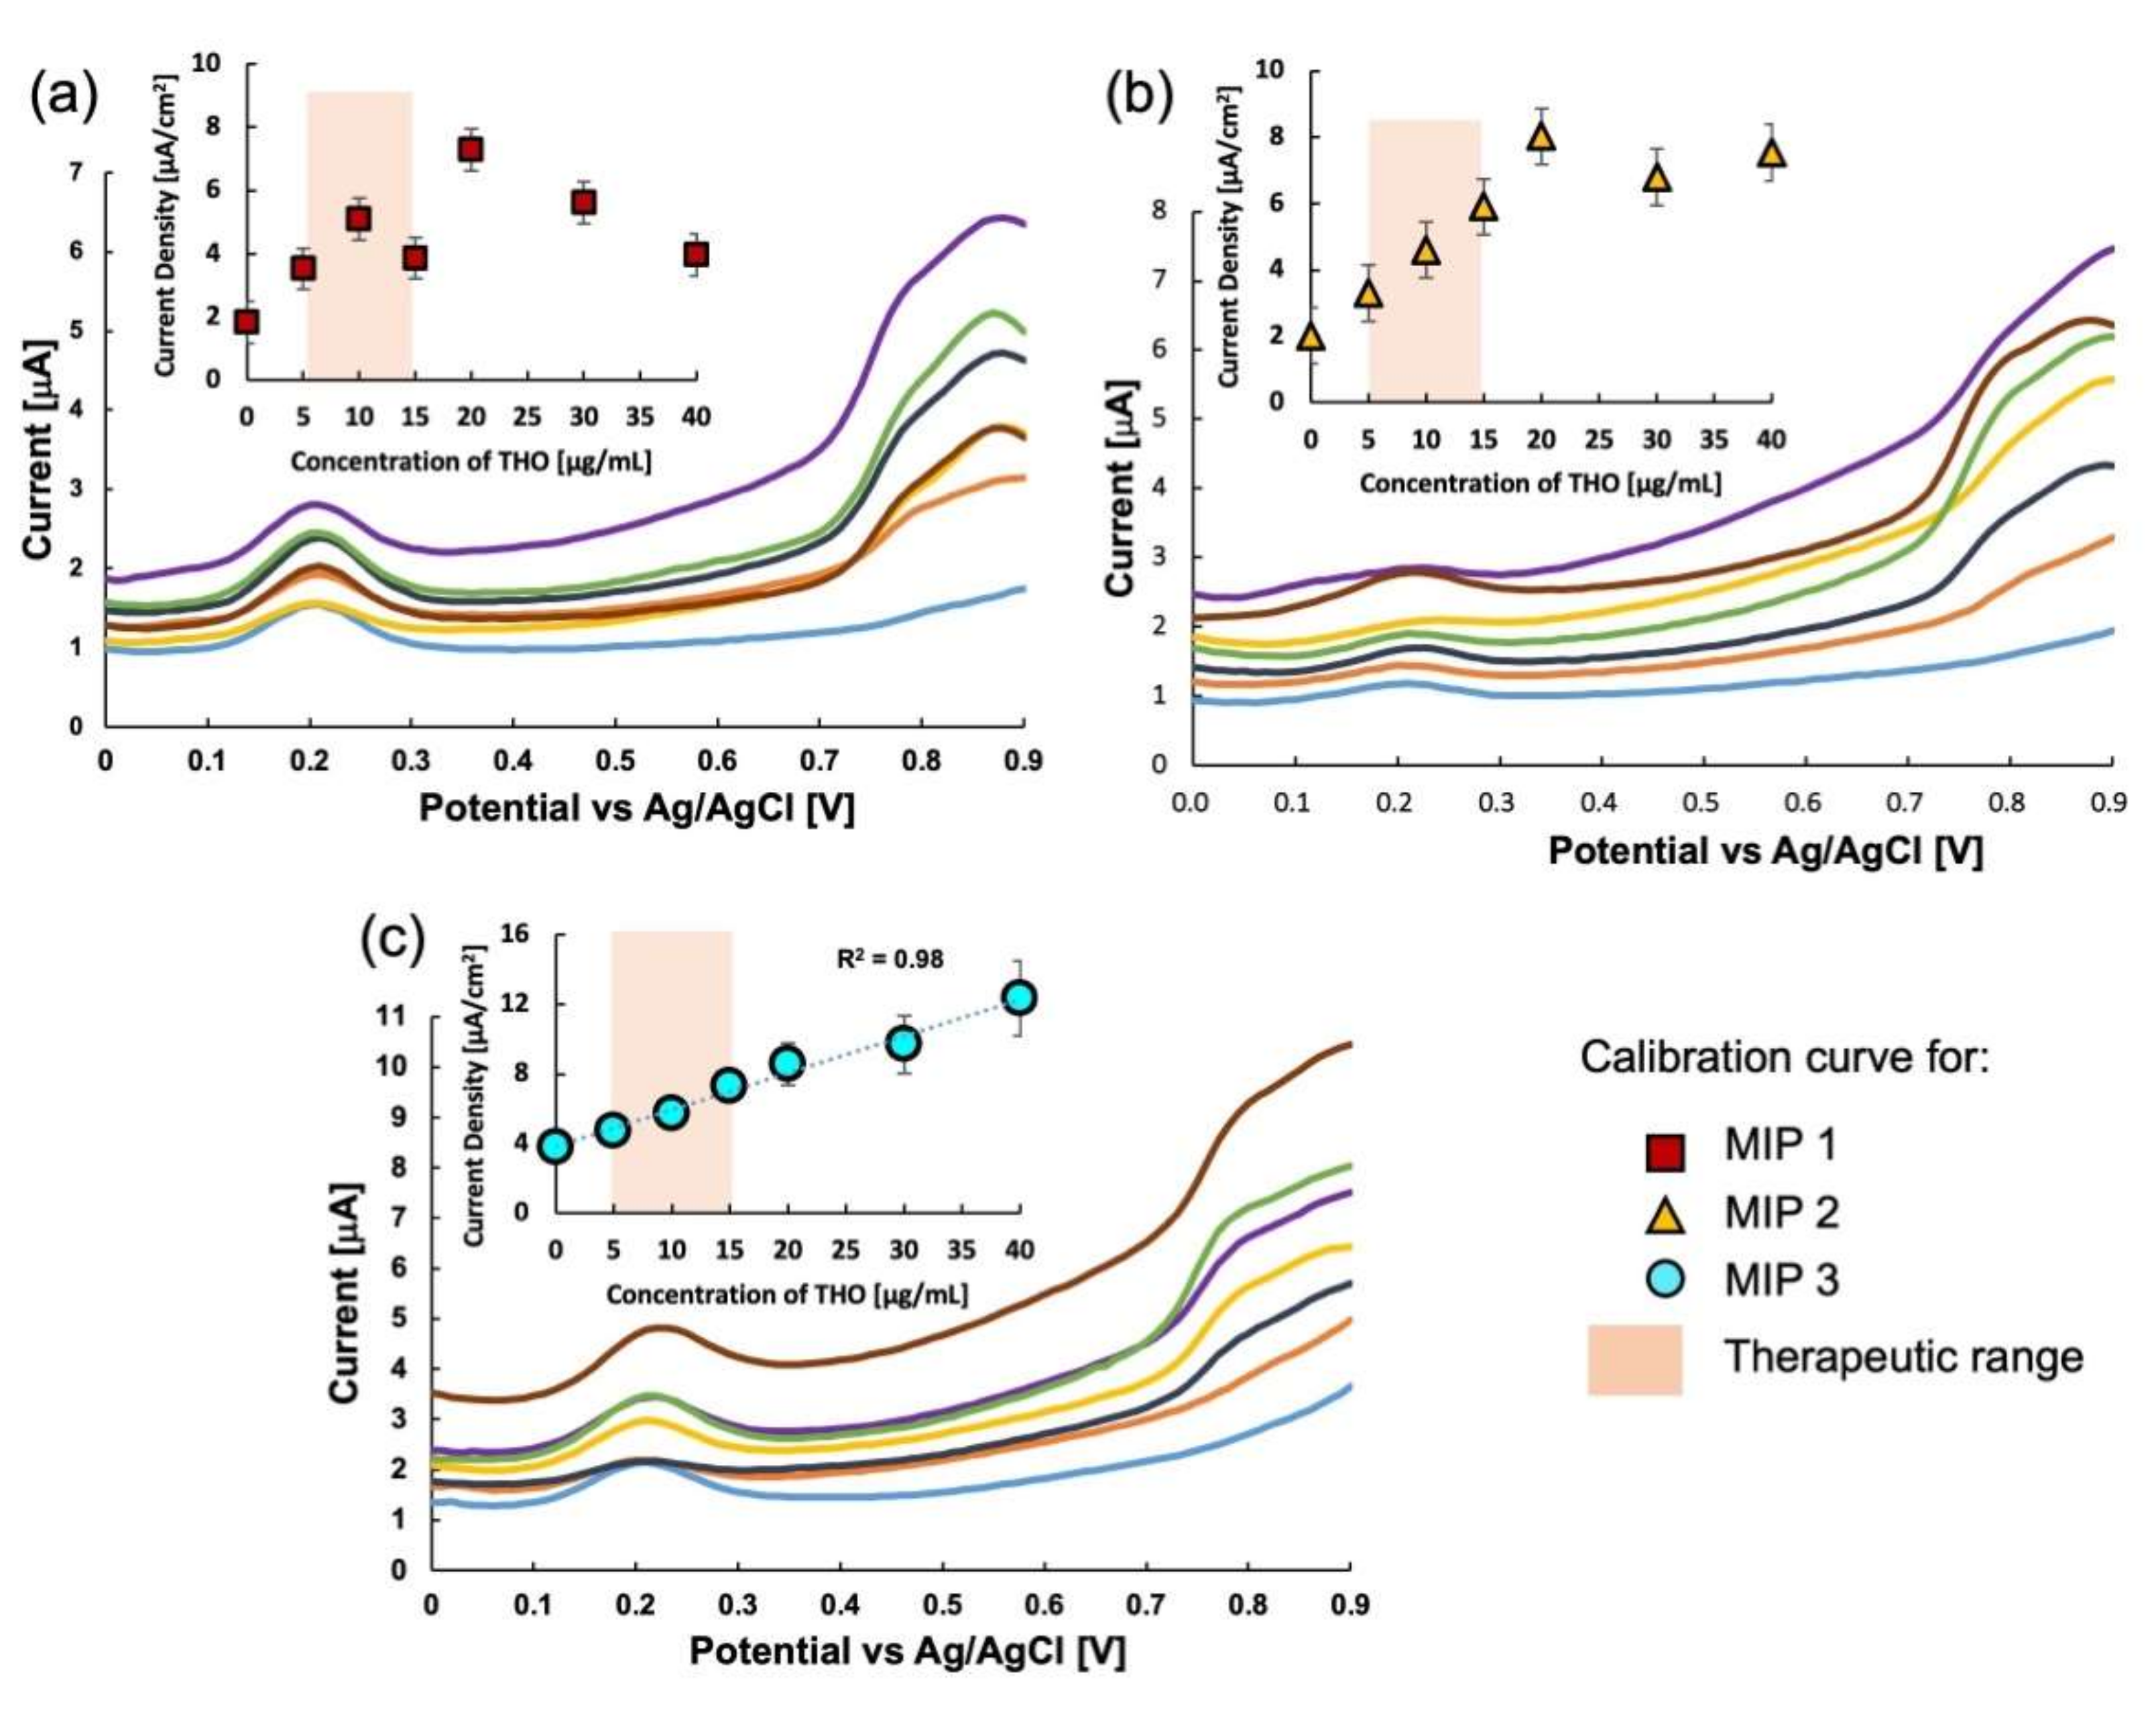
2.1. Sensitivity
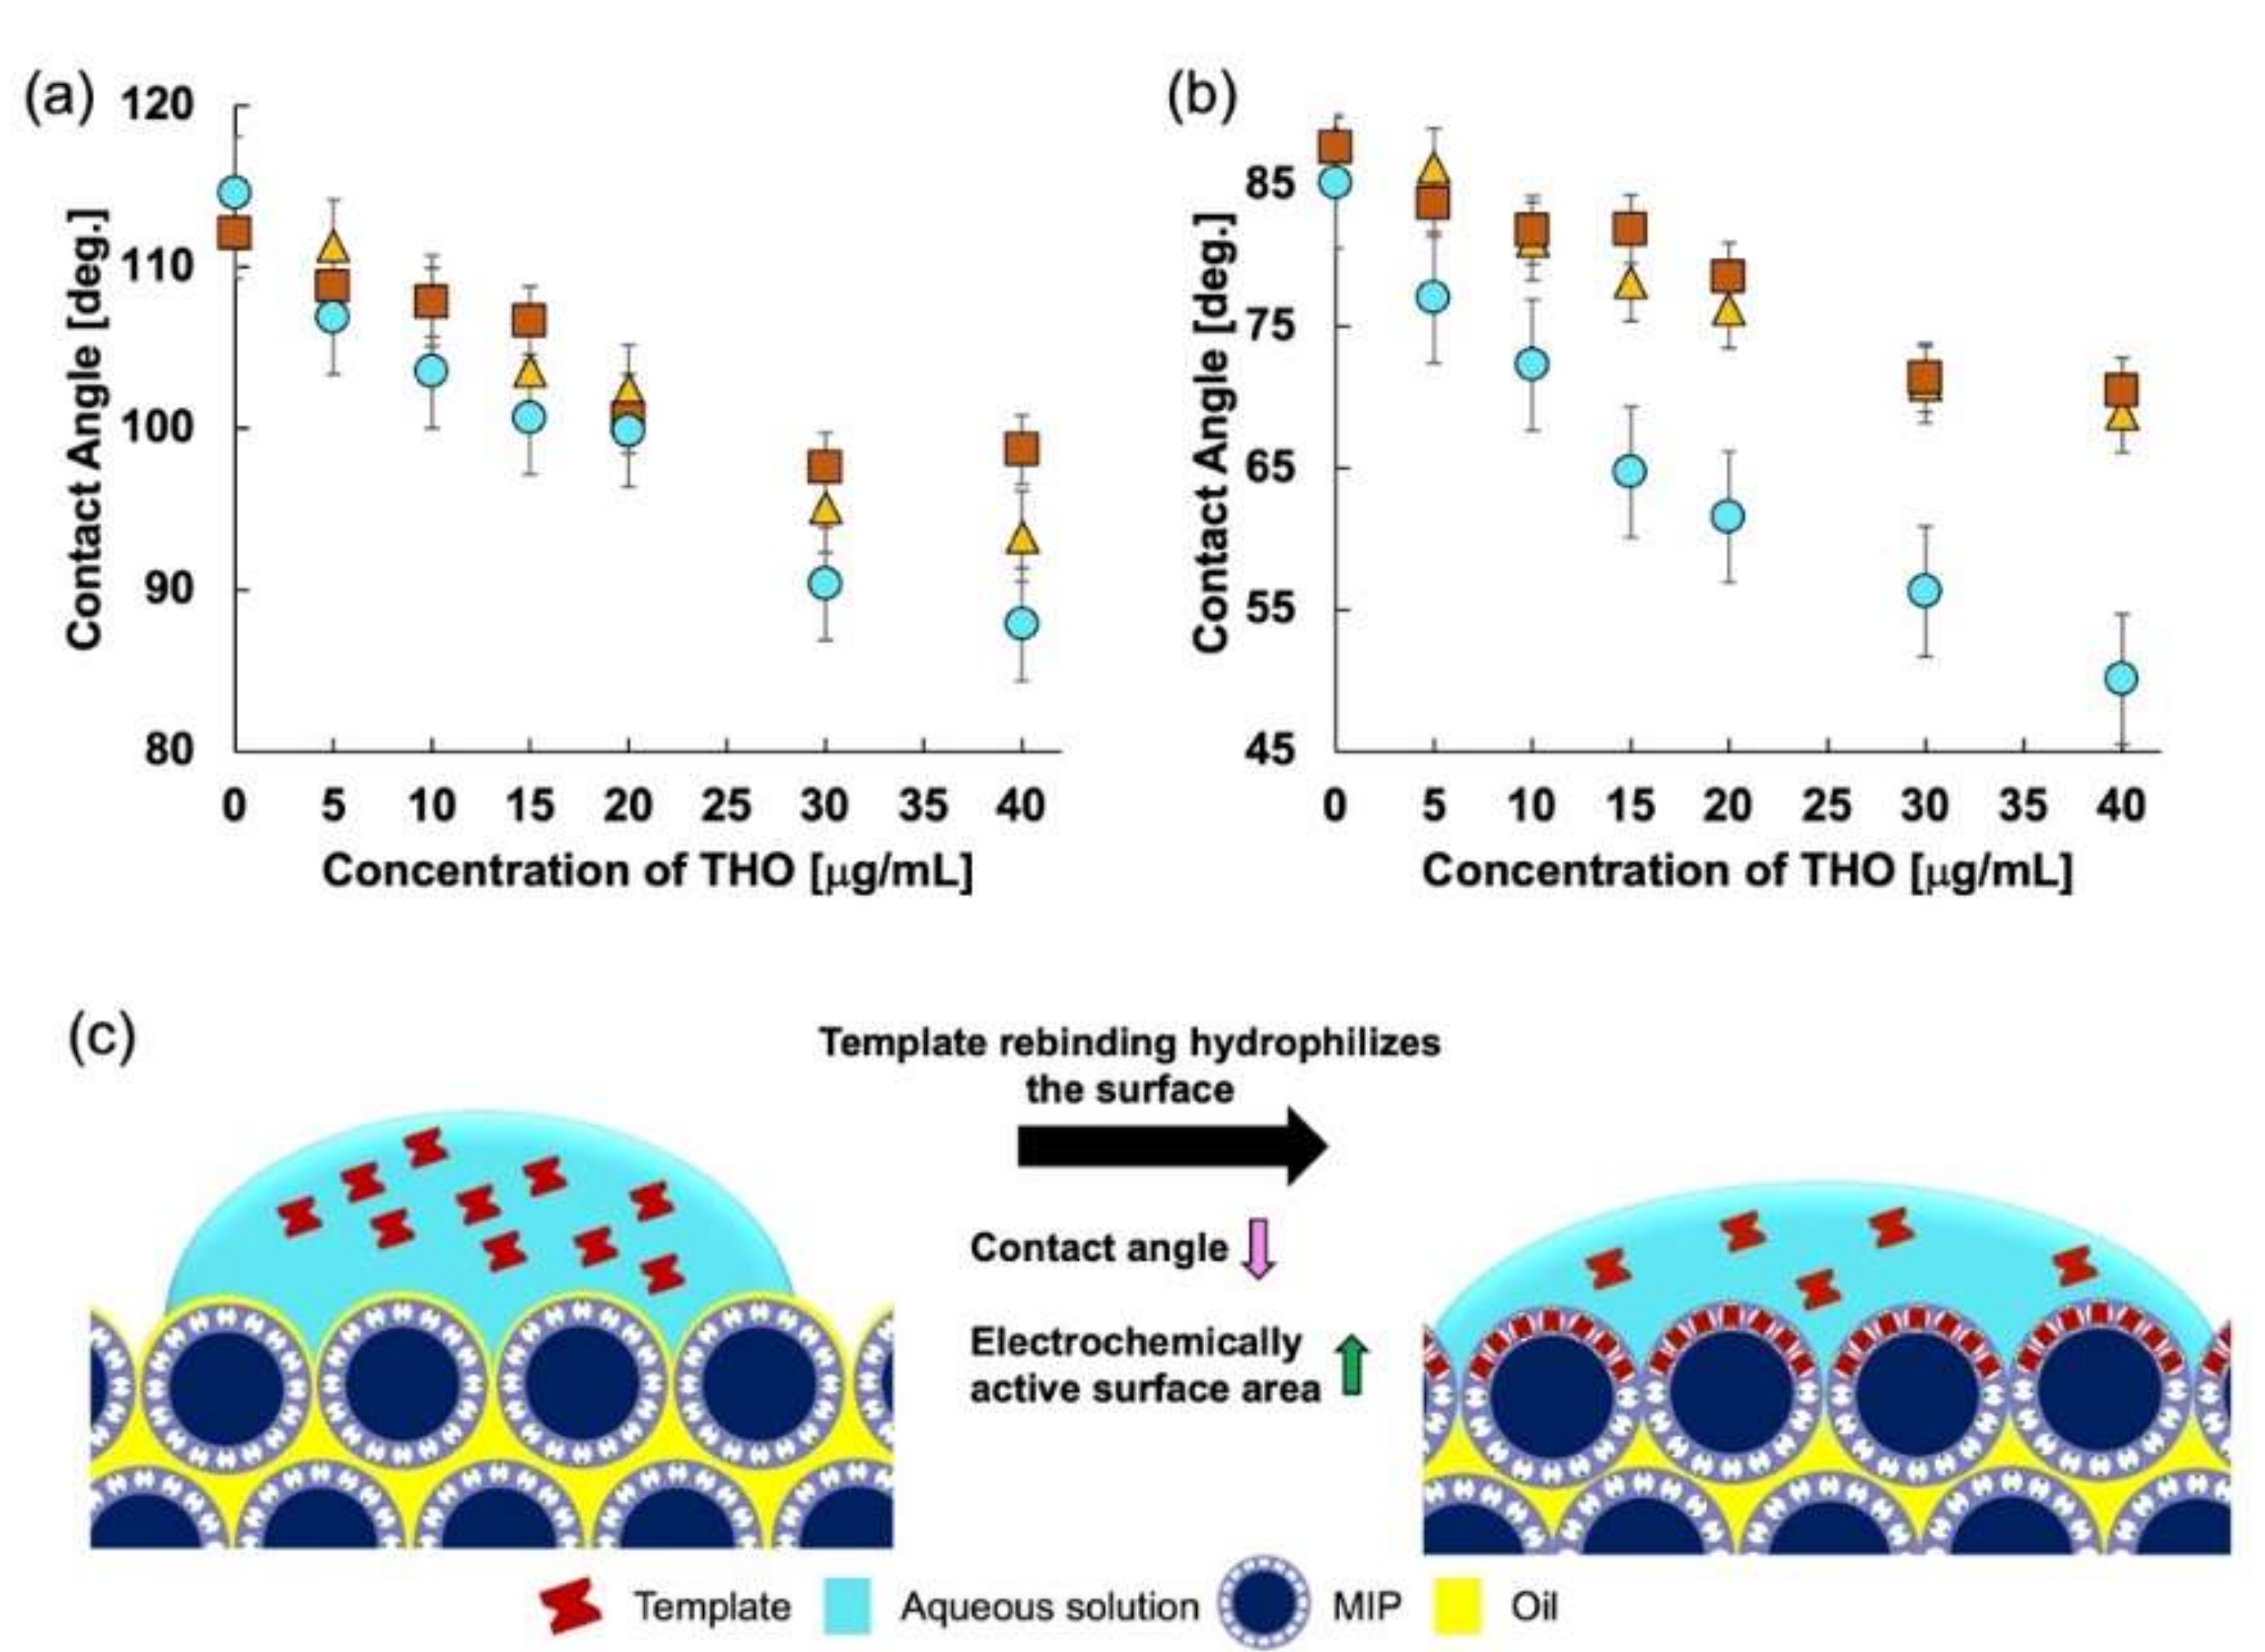
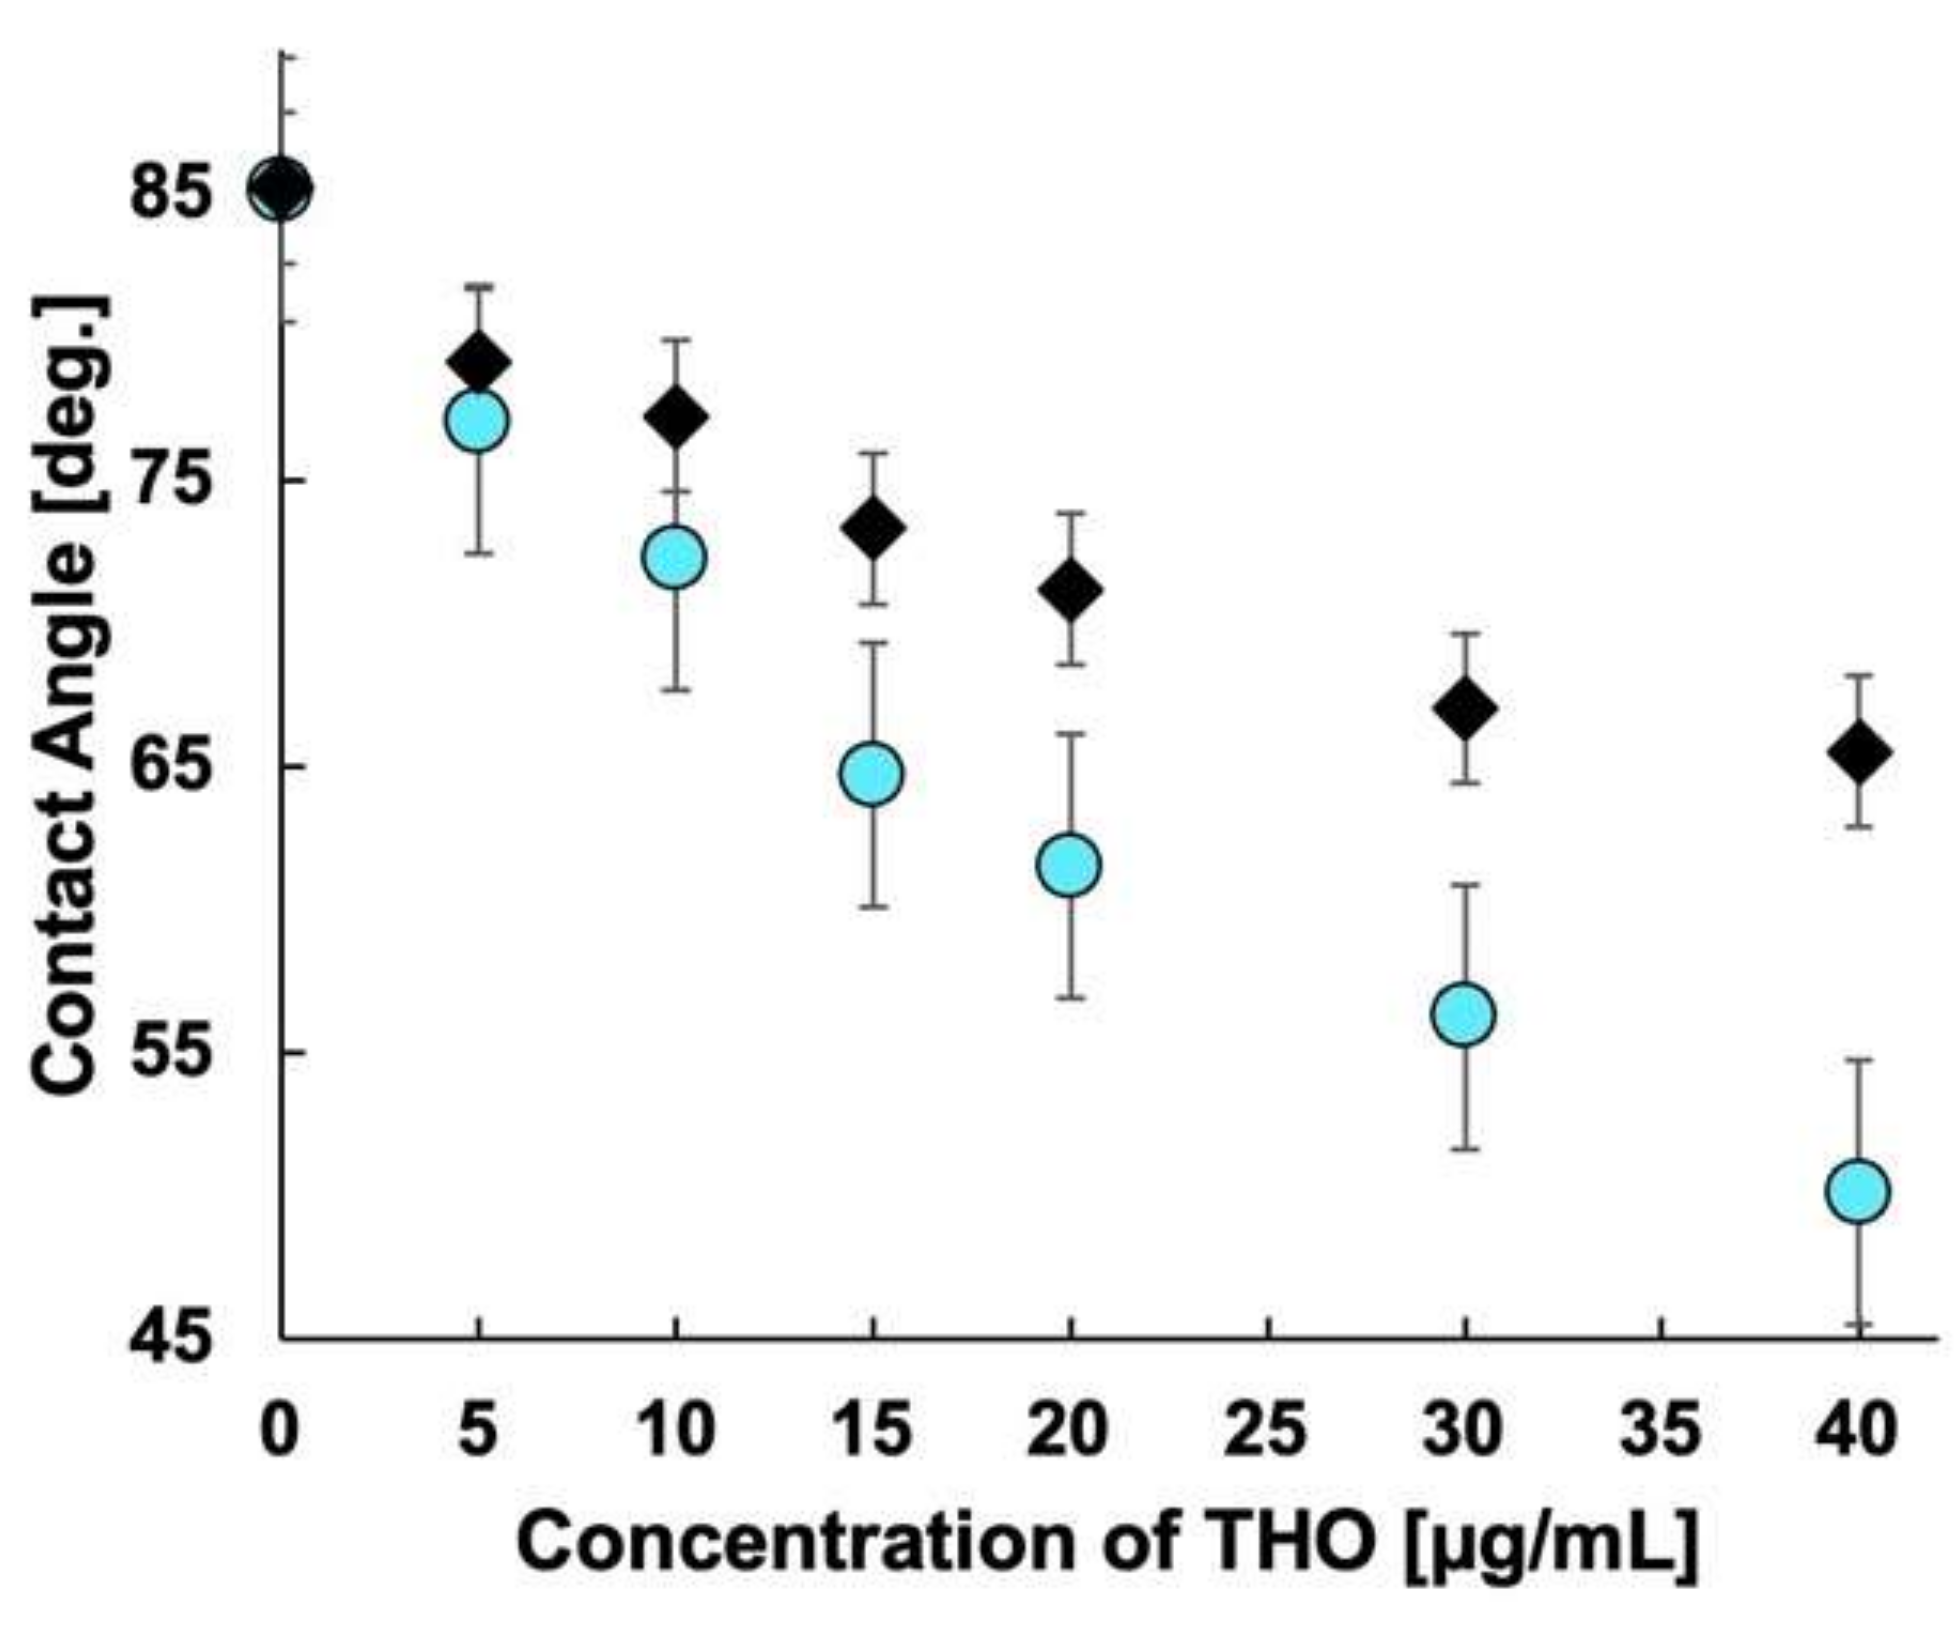
2.2. Contact Angle Measurement
2.3. Optimization of Scan Rate
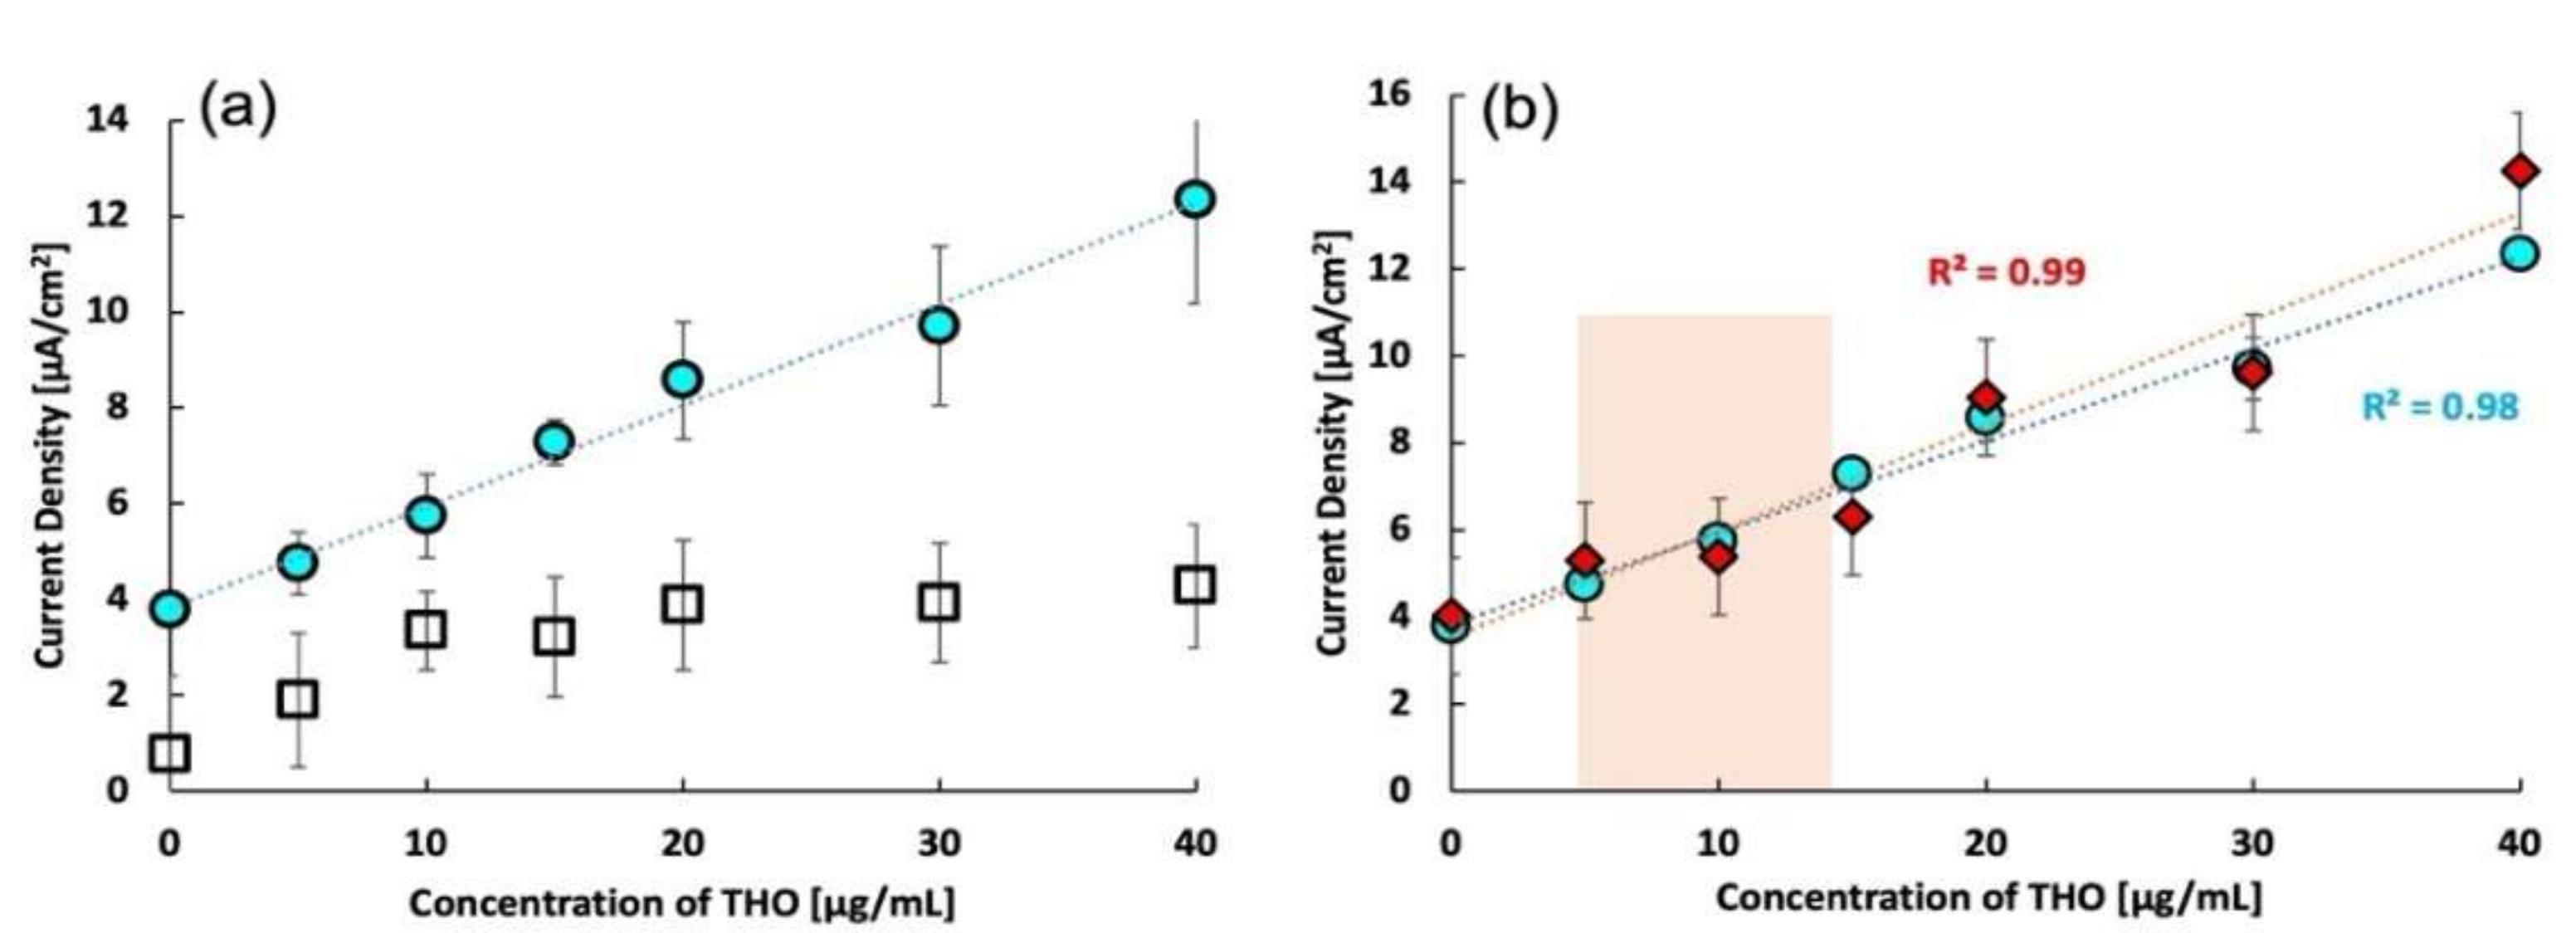
2.4. Confirmation of Enhanced Response after Imprinting
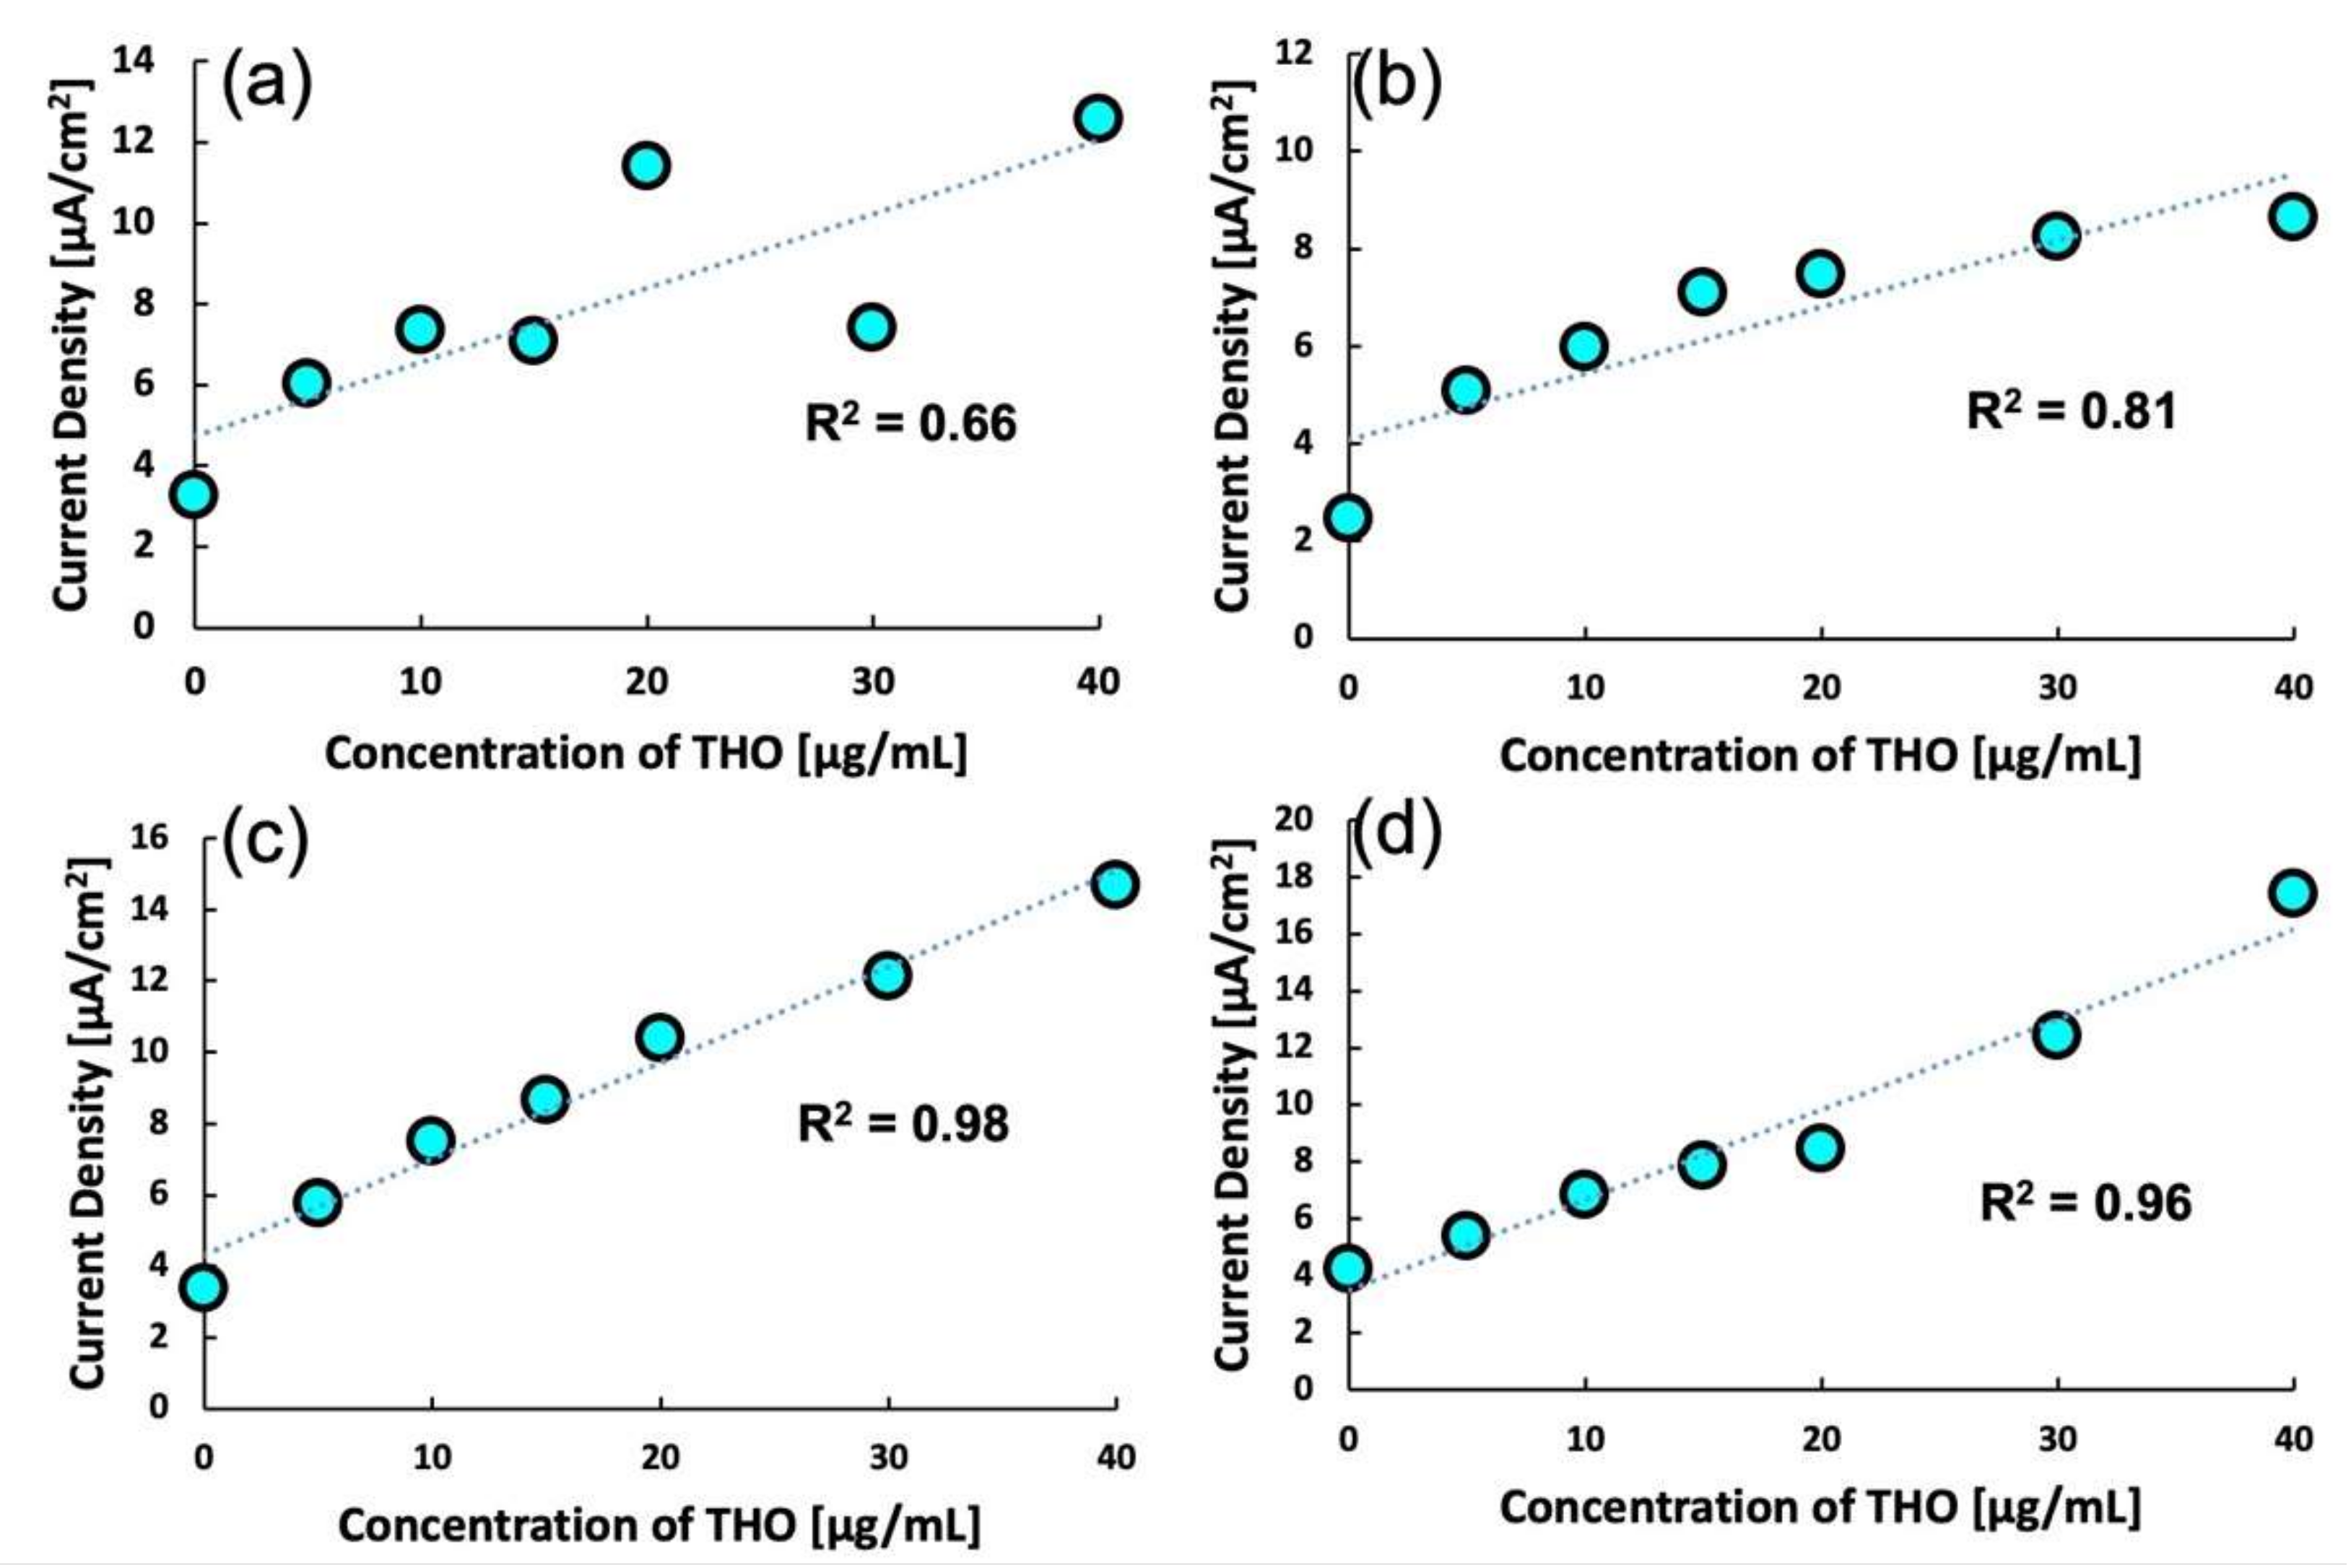
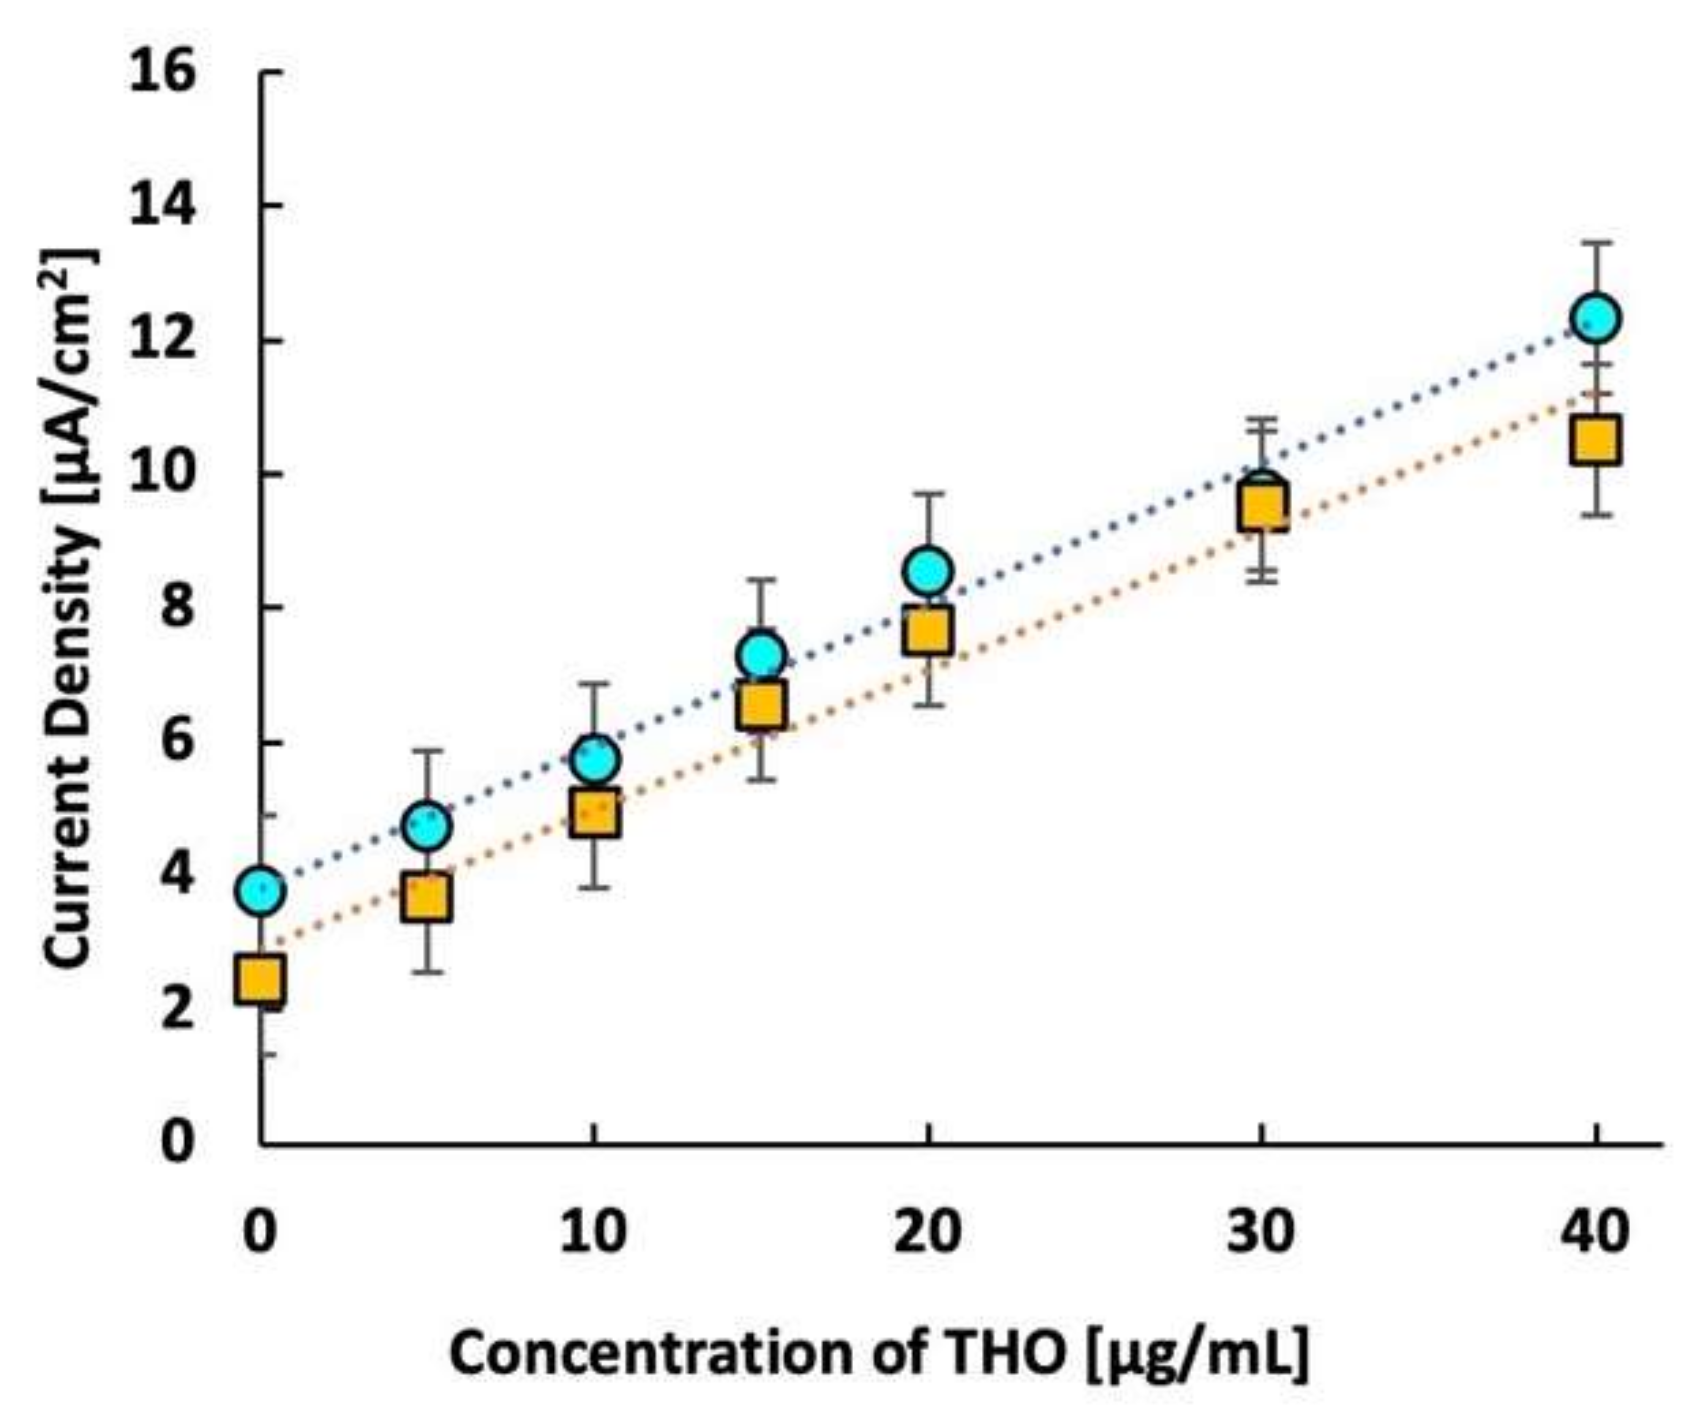
2.5. Calibration Stability
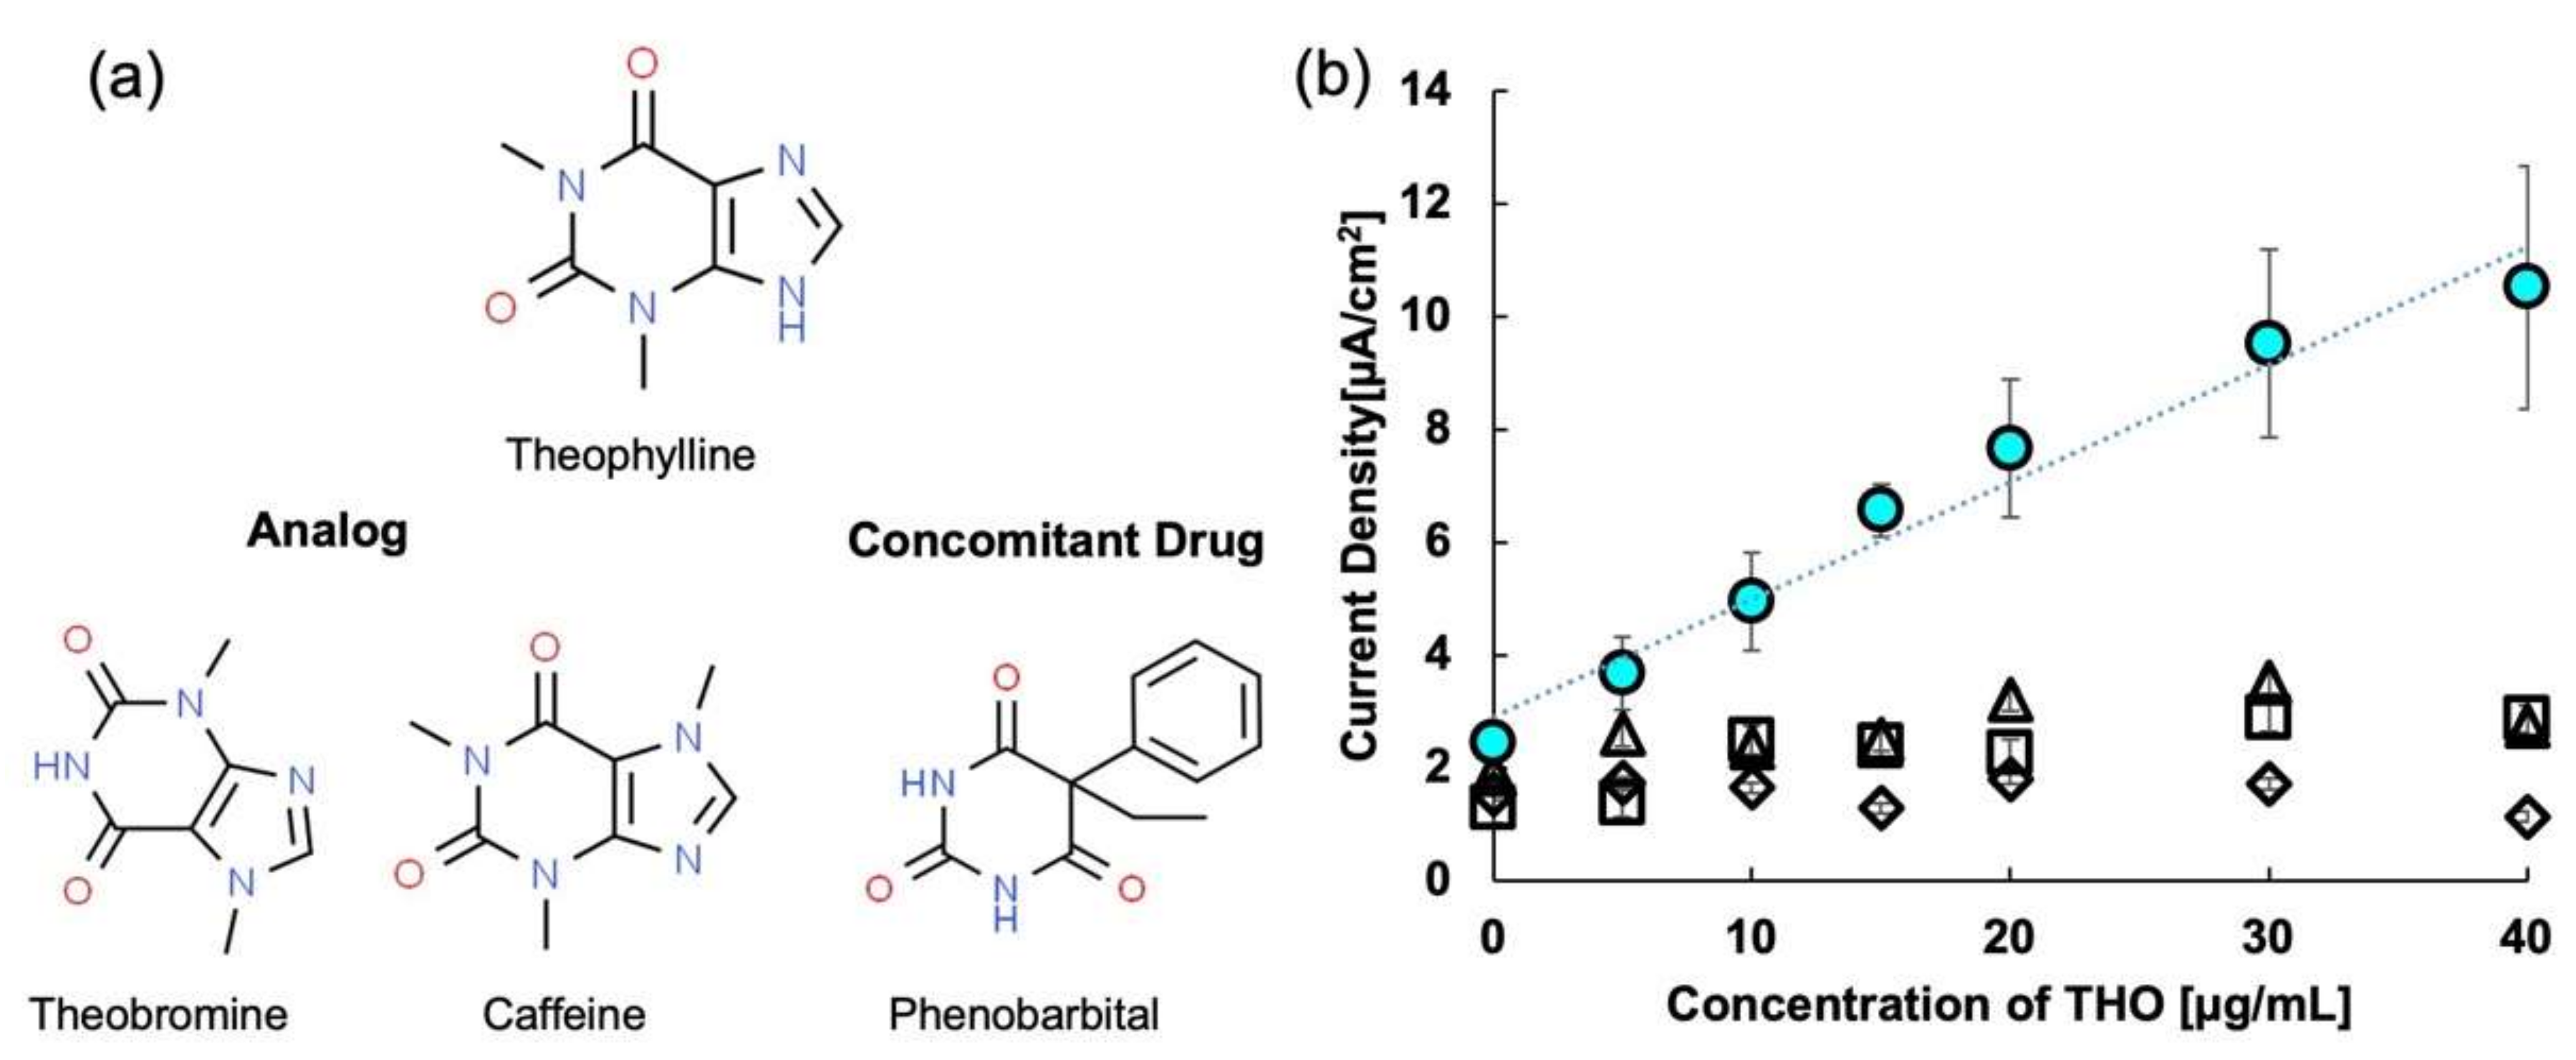
2.6. Selectivity
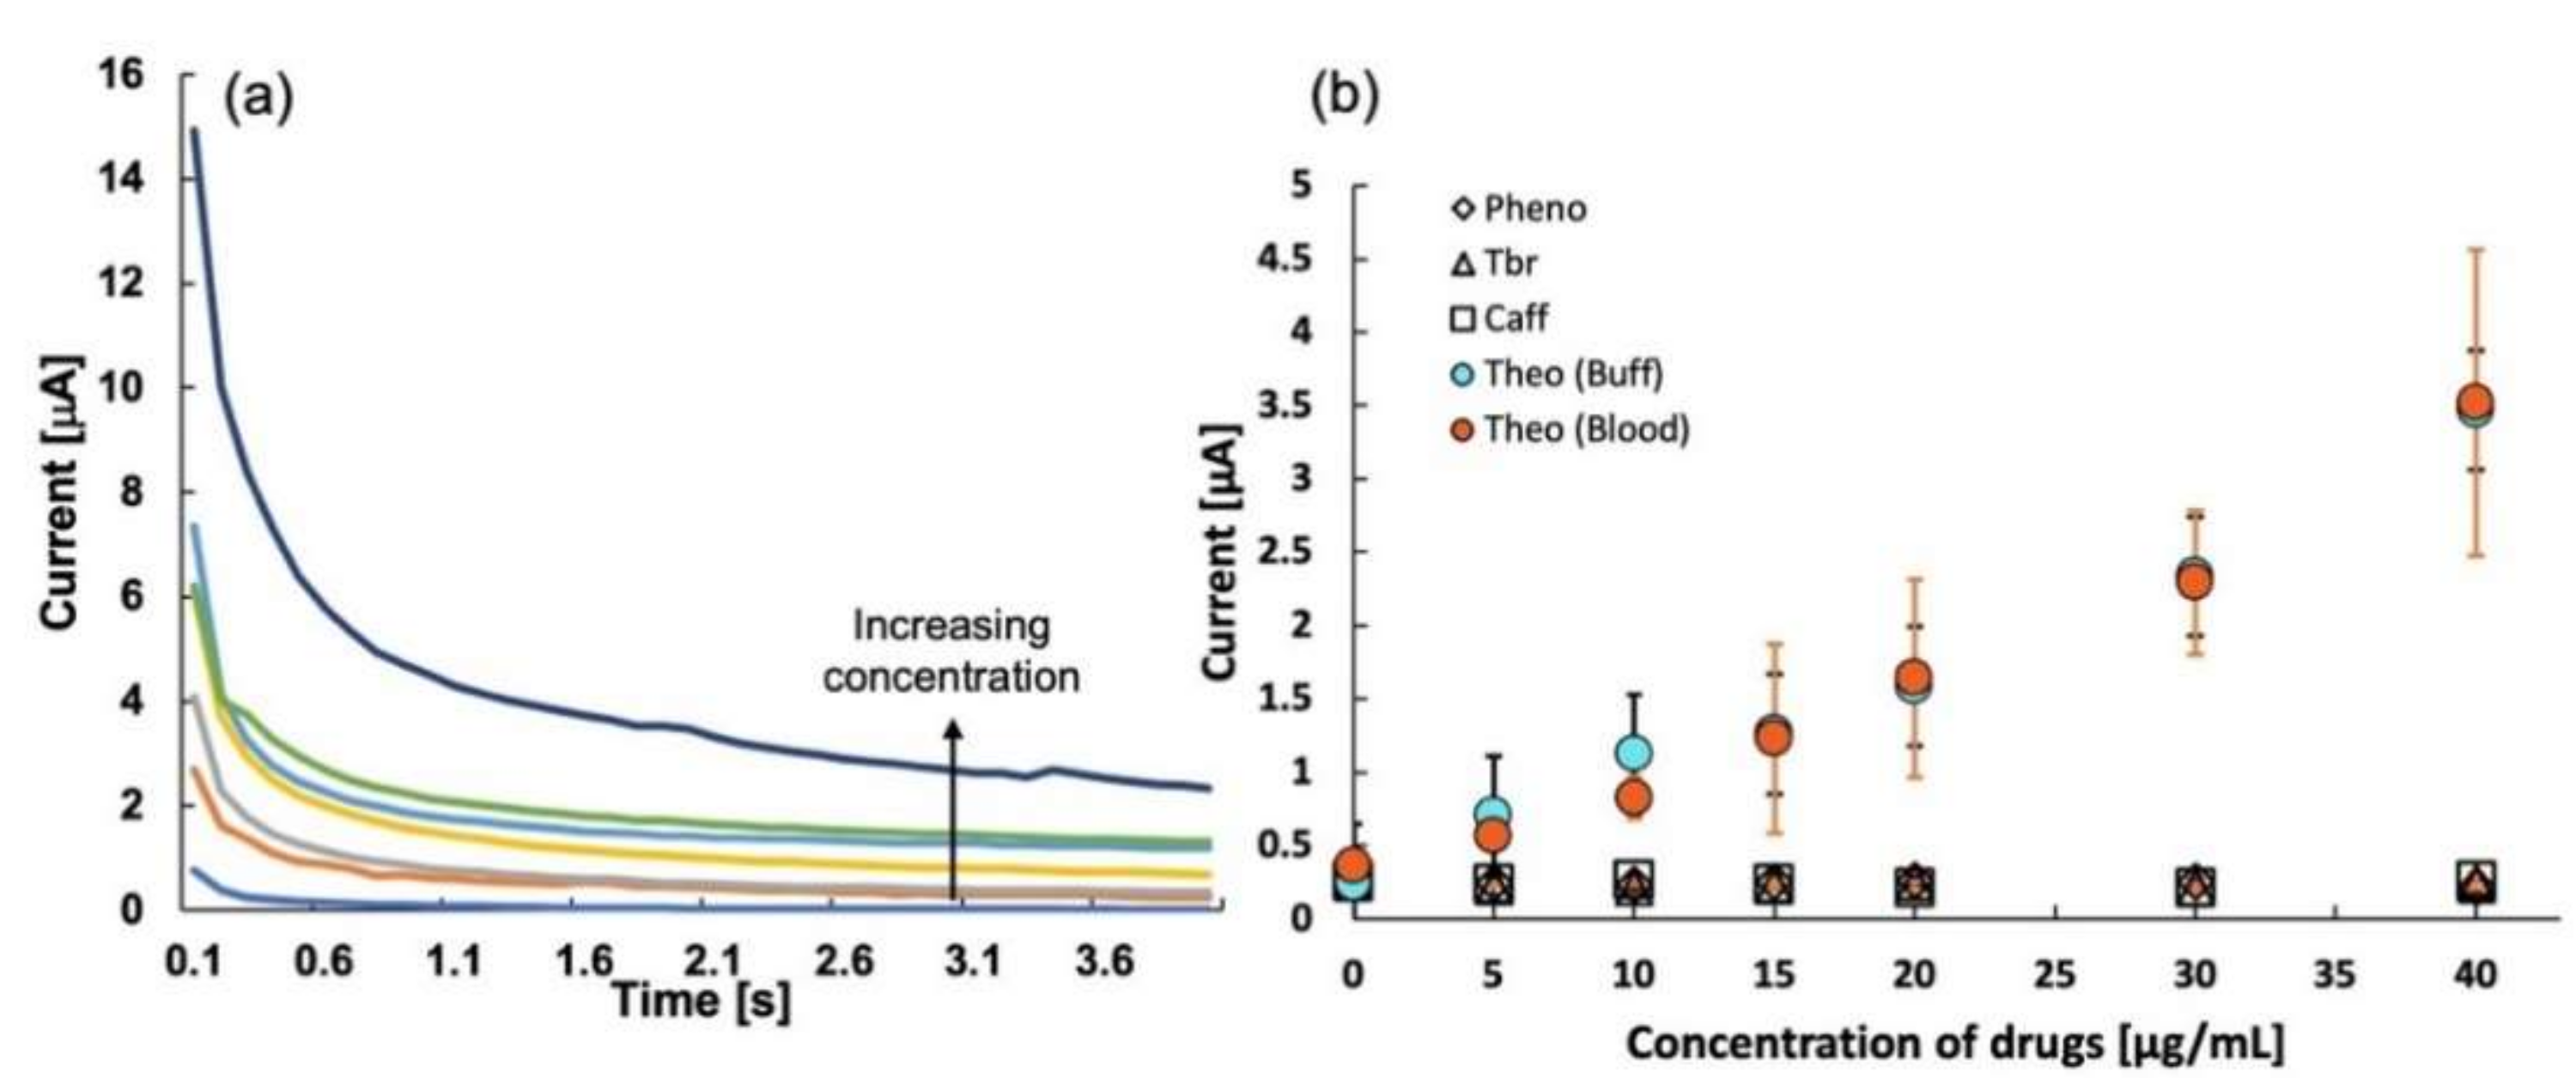
2.7. Chronoamperometry
3. Discussion
4. Materials and Methods
4.1. Chemicals and Other Materials
4.2. Instruments
4.3. Preparation of MIP
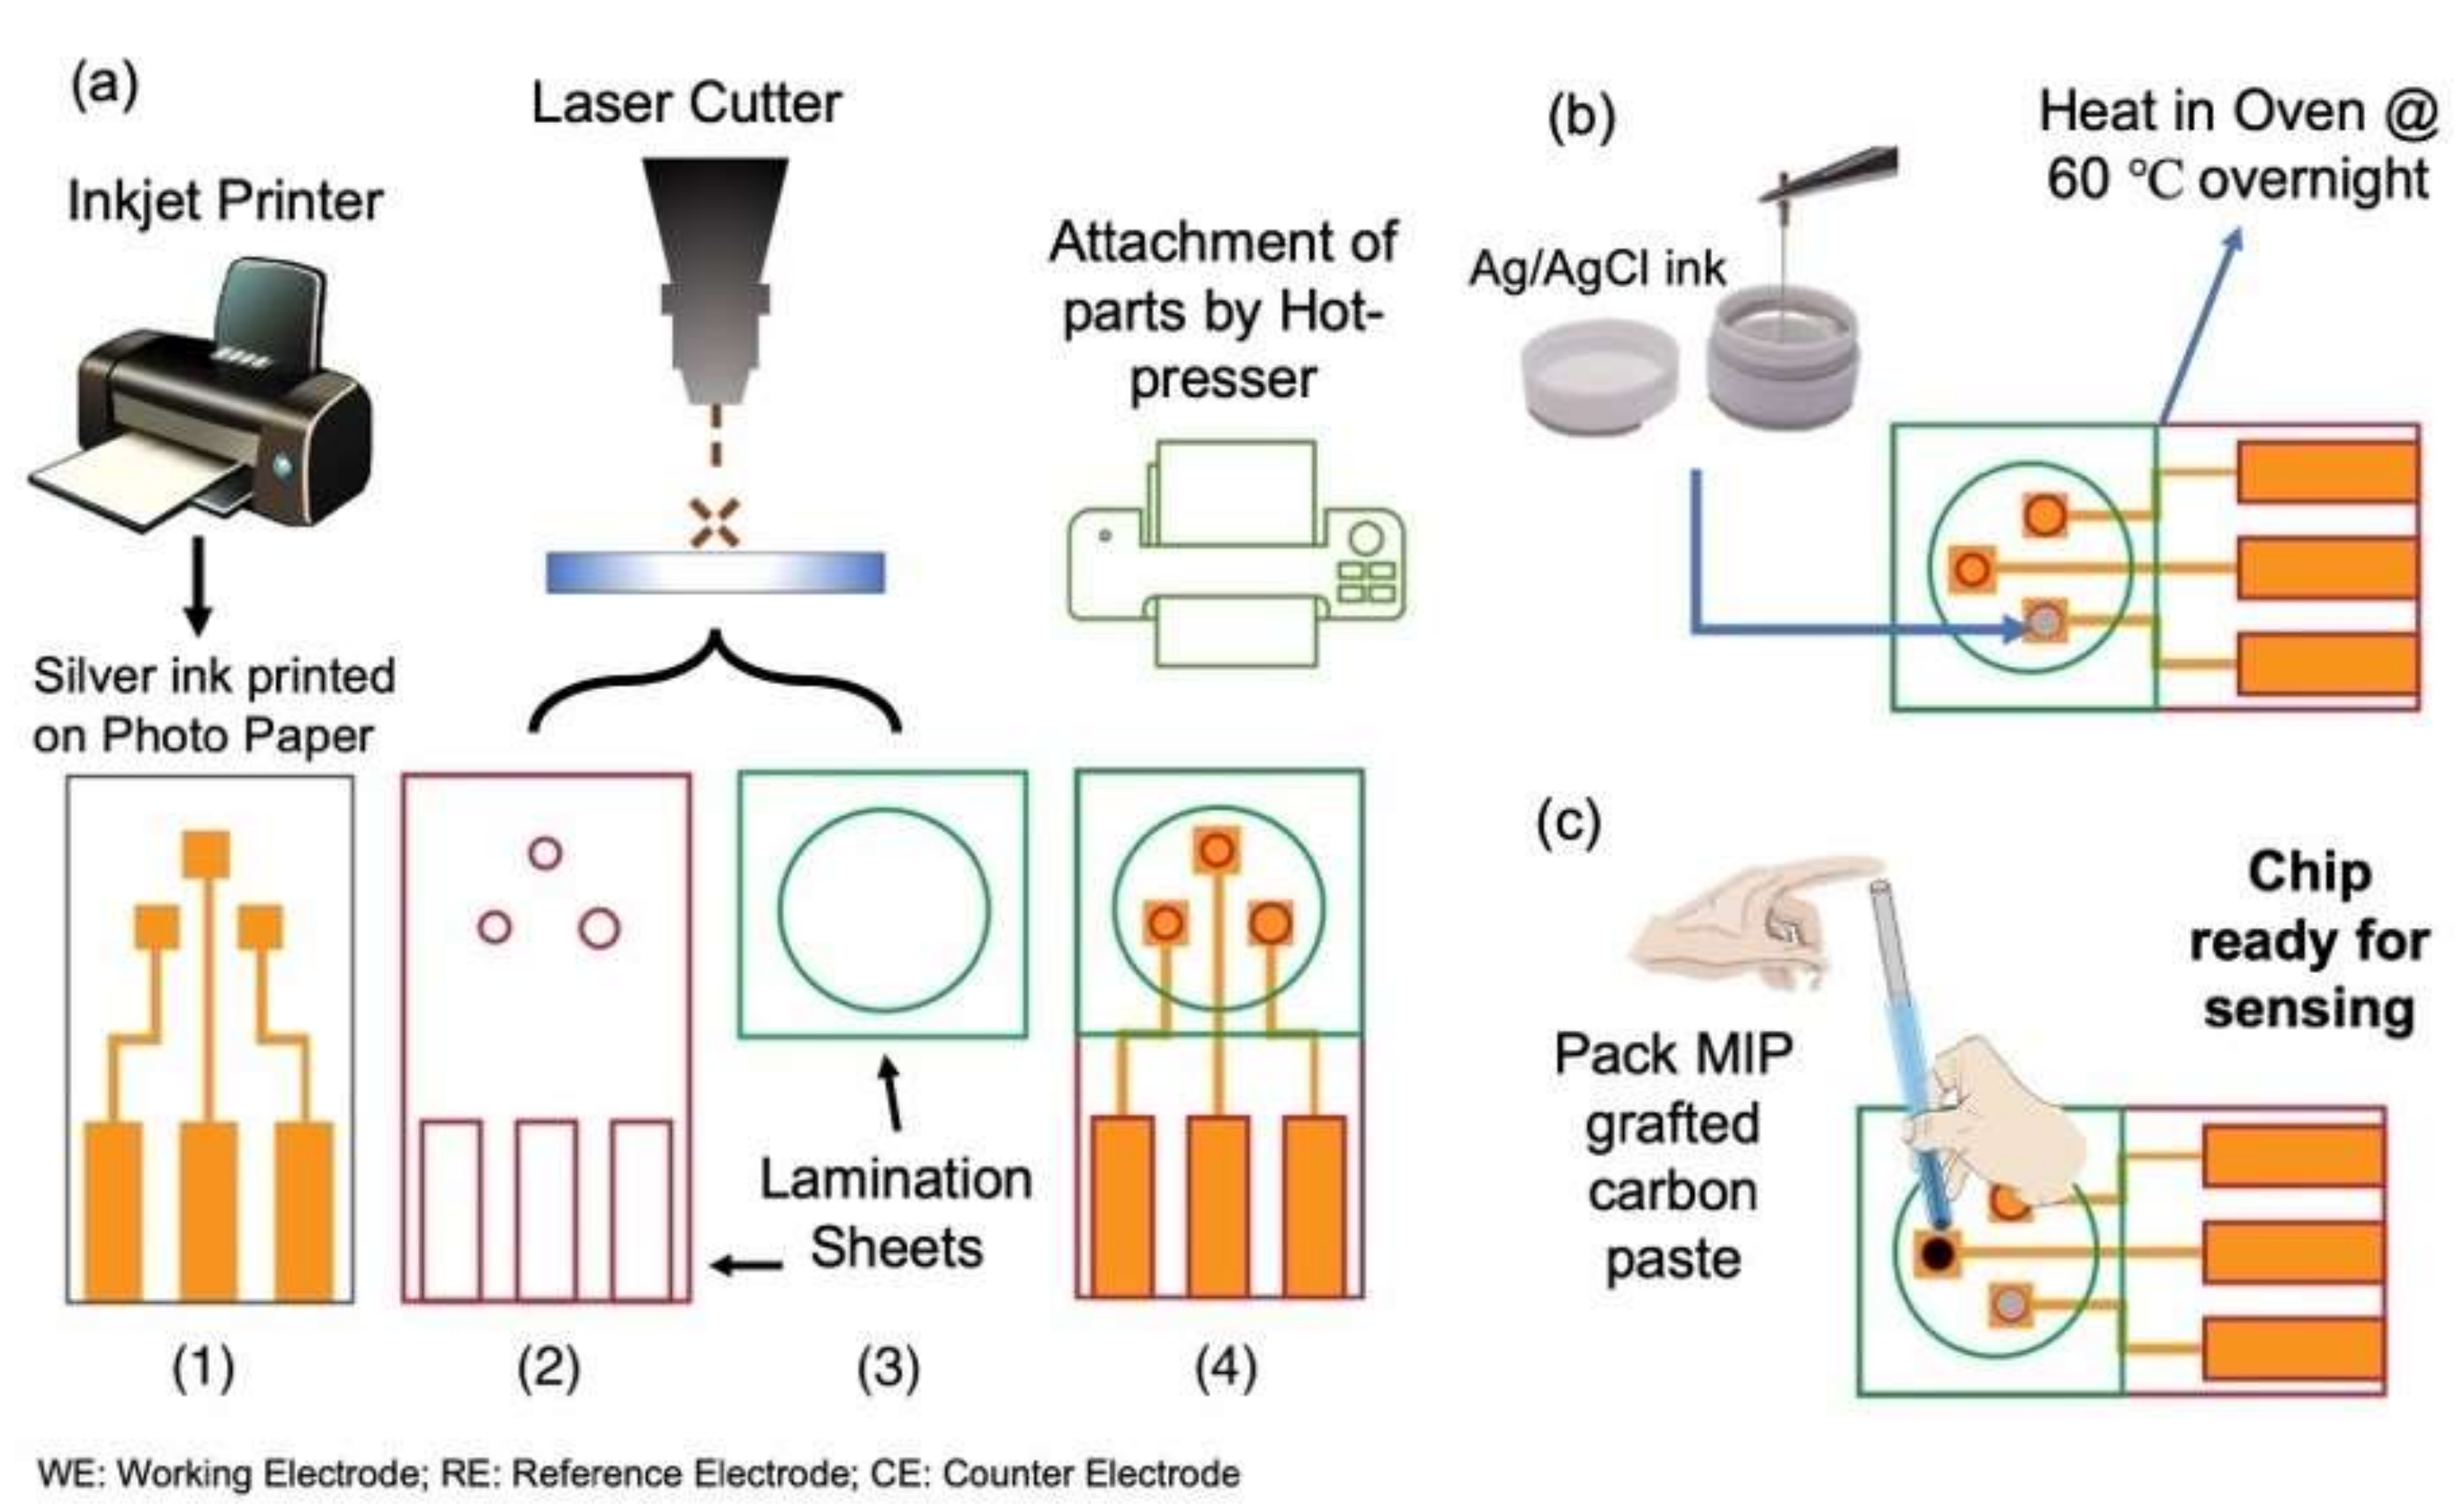
4.4. Making the PET Sensor
4.5. Sample Preparation
4.6. Electrochemical Parameters
5. Conclusions
Author Contributions
Funding
Institutional Review Board Statement
Informed Consent Statement
Data Availability Statement
Conflicts of Interest
Sample Availability
References
- Singh, N.; Shreshtha, A.K.; Thakur, M.S.; Patra, S. Xanthine Scaffold: Scope and Potential in Drug Development. Heliyon 2018, 4, e00829. [Google Scholar] [CrossRef] [PubMed] [Green Version]
- Gan, T.; Zhao, A.; Wang, Z.; Liu, P.; Sun, J.; Liu, Y. An Electrochemical Sensor Based on SiO2@TiO2-Embedded Molecularly Imprinted Polymers for Selective and Sensitive Determination of Theophylline. J. Solid State Electrochem. 2017, 21, 3683–3691. [Google Scholar] [CrossRef]
- Barnes, P.J. Theophylline. Am. J. Respir. Crit. Care Med. 2013, 188, 901–906. [Google Scholar] [CrossRef]
- Rabe, K.F.; Magnussen, H.; Dent, G. Theophylline and Selective PDE Inhibitors as Bronchodilators and Smooth Muscle Relaxants. Eur. Respir. J. 1995, 8, 637–642. [Google Scholar] [PubMed]
- Rao, S.S.C.; Mudipalli, R.S.; Mujica, V.; Utech, C.L.; Zhao, X.; Conklin, J.L. An Open-Label Trial of Theophylline for Functional Chest Pain. Dig. Dis. Sci. 2002, 47, 2763–2768. [Google Scholar] [CrossRef] [PubMed]
- Rieg, T.; Steigele, H.; Schnermann, J.; Richter, K.; Osswald, H.; Vallon, V. Requirement of Intact Adenosine A1 Receptors for the Diuretic and Natriuretic Action of the Methylxanthines Theophylline and Caffeine. J. Pharmacol. Exp. Ther. 2005, 313, 403–409. [Google Scholar] [CrossRef] [Green Version]
- Bell, M.; Jackson, E.; Mi, Z.; McCombs, J.; Carcillo, J. Low-Dose Theophylline Increases Urine Output in Diuretic-Dependent Critically Ill Children. Intensive Care Med. 1998, 24, 1099–1105. [Google Scholar] [CrossRef]
- Barnes, P.J. Theophylline: New Perspectives for an Old Drug. Am. J. Respir. Crit. Care Med. 2003, 167, 813–818. [Google Scholar] [CrossRef]
- Sullivan, P.; Jaffar, Z.; Page, C.; Costello, J.; Bekir, S.; Jeffery, P. Anti-Inflammatory Effects of Low-Dose Oral Theophylline in Atopic Asthma. Lancet 1994, 343, 1006–1008. [Google Scholar] [CrossRef]
- Ream, R.S.; Loftis, L.L.; Albers, G.M.; Becker, B.A.; Lynch, R.E.; Mink, R.B. Efficacy of IV Theophylline in Children with Severe Status Asthmaticus. Chest 2001, 119, 1480–1488. [Google Scholar] [CrossRef]
- Ejuh, G.W.; Ndjaka, J.M.B.; Tchangnwa Nya, F.; Ndukum, P.L.; Fonkem, C.; Tadjouteu Assatse, Y.; Yossa Kamsi, R.A. Determination of the Structural, Electronic, Optoelectronic and Thermodynamic Properties of the Methylxanthine Molecules Theophylline and Theobromine. Opt. Quantum Electron. 2020, 52, 498. [Google Scholar] [CrossRef] [PubMed]
- Kidney, J.; Dominguez, M.; Taylor, P.M.; Rose, M.; Chung, K.F.; Barnes, P.J. Immunomodulation by Theophylline in Asthma: Demonstration by Withdrawal of Therapy. Am. J. Respir. Crit. Care Med. 1995, 151, 1907–1914. [Google Scholar] [CrossRef] [PubMed]
- Saleh, T.S.F.; Calixto, J.B.; Medeiros, Y.S. Anti-Inflammatory Effects of Theophylline, Cromolyn and Salbutamol in a Murine Model of Pleurisy. Br. J. Pharmacol. 1996, 118, 811–819. [Google Scholar] [CrossRef] [PubMed] [Green Version]
- Cosio, B.G.; Iglesias, A.; Rios, A.; Noguera, A.; Sala, E.; Ito, K.; Barnes, P.J.; Agusti, A. Low-Dose Theophylline Enhances the Anti-Inflammatory Effects of Steroids during Exacerbations of COPD. Thorax 2009, 64, 424–429. [Google Scholar] [CrossRef] [Green Version]
- Chang, Y.-L.; Hsu, Y.-J.; Chen, Y.; Wang, Y.-W.; Huang, S.-M. Theophylline Exhibits Anti-Cancer Activity via Suppressing SRSF3 in Cervical and Breast Cancer Cell Lines. Oncotarget 2017, 8, 101461–101474. [Google Scholar] [CrossRef] [Green Version]
- Peng, H.; Su, Q.; Lin, Z.C.; Zhu, X.H.; Peng, M.S.; Lv, Z.B. Potential Suppressive Effects of Theophylline on Human Rectal Cancer SW480 Cells in Vitro by Inhibiting YKL-40 Expression. Oncol. Lett. 2018, 15, 7403–7408. [Google Scholar] [CrossRef]
- Vassallo, R.; Lipsky, J.J. Theophylline: Recent Advances in the Understanding of Its Mode of Action and Uses in Clinical Practice. Mayo Clin. Proc. 1998, 73, 346–354. [Google Scholar] [CrossRef] [Green Version]
- Peng, A. Electrochemical Determination of Theophylline Pharmacokinetic under the Effect of Roxithromycin in Rats by the MWNTs/Au/Poly-L-Lysine Modified Sensor. Int. J. Electrochem. Sci. 2017, 12, 330–346. [Google Scholar] [CrossRef]
- Jacobs, M.H.; Senior, R.M.; Kessler, G. Clinical Experience with Theophylline: Relationships between Dosage, Serum Concentration, and Toxicity. JAMA J. Am. Med. Assoc. 1976, 235, 1983–1986. [Google Scholar] [CrossRef]
- Jenne, J.W.; Wyze, E.; Rood, F.S.; MacDonald, F.M. Pharmacokinetics of Theophylline Application to Adjustment of the Clinical Dose of Aminophylline. Clin. Pharmacol. Ther. 1972, 13, 349–360. [Google Scholar] [CrossRef]
- Mucklow, J.; Kuhn, S. The Rise and Fall of Serum Theophylline Concentration: A Comparison of Sustained-release Formulations in Volunteers with Rapid Theophylline Clearance. Br. J. Clin. Pharmacol. 1985, 20, 589–596. [Google Scholar] [CrossRef] [Green Version]
- Semel, J.D.; Allen, N. Seizures in Patients Simultaneously Receiving Theophylline and Imipenem or Ciprofloxacin or Metronidazole. South. Med. J. 1991, 84, 465–468. [Google Scholar] [CrossRef] [PubMed]
- Aggelopoulou, E.; Tzortzis, S.; Tsiourantani, F.; Agrios, I.; Lazaridis, K. Atrial Fibrillation and Shock: Unmasking Theophylline Toxicity. Med. Princ. Pract. 2018, 27, 387–391. [Google Scholar] [CrossRef] [PubMed]
- Chandrasekaran, V.P.; Parthasarathy, A.; Muruga, B.; Senthamil, T. Theophylline Toxicity: Successful Management of a Patient with Distributive Shock Secondary to Drug Overdose. Am. J. Emerg. Med. 2020, 38, 2491.e1. [Google Scholar] [CrossRef] [PubMed]
- Greenberg, A.; Piraino, B.H.; Kroboth, P.D.; Weiss, J. Severe Theophylline Toxicity. Role of Conservative Measures, Antiarrhythmic Agents, and Charcoal Hemoperfusion. Am. J. Med. 1984, 76, 854–860. [Google Scholar] [CrossRef]
- Korematsu, S.; Miyahara, H.; Nagakura, T.; Suenobu, S.; Izumi, T. Theophylline-Associated Seizures and Their Clinical Characterizations. Pediatr. Int. 2008, 50, 95–98. [Google Scholar] [CrossRef] [PubMed]
- Yoshikawa, H. First-Line Therapy for Theophylline-Associated Seizures. Acta Neurol. Scand. 2007, 115, 57–61. [Google Scholar] [CrossRef]
- Kapoor, S.; Thakkar, J.; Aggarwal, V. Theophylline Toxicity Leading to Suicidal Ideation in a Patient with No Prior Psychiatric Illness. SAGE Open Med. Case Rep. 2015, 3, 2050313X15583208. [Google Scholar] [CrossRef] [Green Version]
- Greene, S.C.; Halmer, T.; Carey, J.M.; Rissmiller, B.J.; Musick, M.A. Theophylline Toxicity: An Old Poisoning for a New Generation of Physicians. Turk. J. Emerg. Med. 2018, 18, 37–39. [Google Scholar] [CrossRef]
- Ichikawa, K.; Wada, T.; Nishihara, T.; Tsuji, M.; Mori, A.; Yokohama, F.; Hasegawa, D.; Kawamoto, K.; Tanakaya, M.; Katyama, Y.; et al. A Case of Life-Threatening Supraventricular Tachycardia Storm Associated with Theophylline Toxicity. J. Cardiol. Cases 2017, 15, 125–128. [Google Scholar] [CrossRef] [Green Version]
- Al-Jenoobi, F.I.; Ahad, A.; Mahrous, G.M.; Raish, M.; Alam, M.A.; Al-Mohizea, A.M. A Simple HPLC–UV Method for the Quantification of Theophylline in Rabbit Plasma and Its Pharmacokinetic Application. J. Chromatogr. Sci. 2015, 53, 1765–1770. [Google Scholar] [CrossRef] [PubMed] [Green Version]
- Nirogi, R.V.S.; Kandikere, V.N.; Shukla, M.; Mudigonda, K.; Ajjala, D.R. A Simple and Rapid HPLC/UV Method for the Simultaneous Quantification of Theophylline and Etofylline in Human Plasma. J. Chromatogr. B 2007, 848, 271–276. [Google Scholar] [CrossRef] [PubMed]
- Vergin, H.; Mahr, G.; Winterhalter, B.; Wigand, R. Relative Bioavailability and Bioequivalence Study of Theophylline Sustained Release Formulations. Arzneim.-Forsch./Drug Res. 2003, 53, 635–639. [Google Scholar] [CrossRef] [PubMed]
- Dadashzadeh, S.; Tajerzaden, H. Dose Dependent Pharmacokinetics of Theophylline: Michaelis-Menten Parameters for Its Major Metabolic Pathways. Eur. J. Drug Metab. Pharmacokinet. 2001, 26, 77–83. [Google Scholar] [CrossRef]
- Chiem, N.; Harrison, D.J. Microchip-Based Capillary Electrophoresis for Immunoassays: Analysis of Monoclonal Antibodies and Theophylline. Anal. Chem. 1997, 69, 373–378. [Google Scholar] [CrossRef]
- Singh, D.K.; Sahu, A. Spectrophotometric Determination of Caffeine and Theophylline in Pure Alkaloids and Its Application in Pharmaceutical Formulations. Anal. Biochem. 2006, 349, 176–180. [Google Scholar] [CrossRef]
- Charehsaz, M.; Gürbay, A.; Aydin, A.; Şahin, G. Simple, Fast and Reliable Liquid Chromatographic and Spectrophotometric Methods for the Determination of Theophylline in Urine, Saliva and Plasma Samples. Iran. J. Pharm. Res. 2014, 13, 431–439. [Google Scholar] [CrossRef]
- Garcinuño, R.M.; Fernández, P.; Pérez-Conde, C.; Gutiérrez, A.M.; Cámara, C. Development of a Fluoroimmunosensor for Theophylline Using Immobilised Antibody. Talanta 2000, 52, 825–832. [Google Scholar] [CrossRef]
- Nishiyama, K.; Sugiura, K.; Kaji, N.; Tokeshi, M.; Baba, Y. Development of a Microdevice for Facile Analysis of Theophylline in Whole Blood by a Cloned Enzyme Donor Immunoassay. Lab Chip 2019, 19, 233–240. [Google Scholar] [CrossRef]
- Zhou, M.X.; Guan, C.Y.; Chen, G.; Xie, X.Y.; Wu, S.H. Determination of Theophylline Concentration in Serum by Chemiluminescent Immunoassay. J. Zhejiang Univ. Sci. B 2005, 6, 1148–1152. [Google Scholar] [CrossRef] [Green Version]
- Erk, N. Assay of Ephedrine Hydrochloride and Theophylline in Pharmaceutical Formulations by Differential-Derivative Spectroscopy. J. Pharm. Biomed. Anal. 2000, 23, 255–261. [Google Scholar] [CrossRef]
- Şentürk, Z.; Erk, N.; Özkan, S.A.; Akay, C.; Cevheroğlu, Ş. Determination of Theophylline and Ephedrine HCL in Tablets by Ratio-Spectra Derivative Spectrophotometry and LC. J. Pharm. Biomed. Anal. 2002, 29, 291–298. [Google Scholar] [CrossRef]
- Lee, K.S.; Kim, T.H.; Shin, M.C.; Lee, W.Y.; Park, J.K. Disposable Liposome Immunosensor for Theophylline Combining an Immunochromatographic Membrane and a Thick-Film Electrode. Anal. Chim. Acta 1999, 380, 17–26. [Google Scholar] [CrossRef]
- Chen, X.; Guo, Z.; Tang, Y.; Shen, Y.; Miao, P. A Highly Sensitive Gold Nanoparticle-Based Electrochemical Aptasensor for Theophylline Detection. Anal. Chim. Acta 2018, 999, 54–59. [Google Scholar] [CrossRef] [PubMed]
- Hegde, R.N.; Hosamani, R.R.; Nandibewoor, S.T. Electrochemical Oxidation and Determination of Theophylline at a Carbon Paste Electrode Using Cetyltrimethyl Ammonium Bromide as Enhancing Agent. Anal. Lett. 2009, 42, 2665–2682. [Google Scholar] [CrossRef]
- Yoshimi, Y.; Sato, K.; Ohshima, M.; Piletska, E. Application of the “gate Effect” of a Molecularly Imprinted Polymer Grafted on an Electrode for the Real-Time Sensing of Heparin in Blood. Analyst 2013, 138, 5121–5128. [Google Scholar] [CrossRef] [PubMed]
- Hillberg, A.L.; Brain, K.R.; Allender, C.J. Molecular Imprinted Polymer Sensors: Implications for Therapeutics. Adv. Drug Deliv. Rev. 2005, 57, 1875–1889. [Google Scholar] [CrossRef] [PubMed]
- Aaryashree; Takeda, Y.; Kanai, M.; Hatano, A.; Yoshimi, Y.; Kida, M.A. “Single-Use” Ceramic-Based Electrochemical Sensor Chip Using Molecularly Imprinted Carbon Paste Electrode. Sensors 2020, 20, 5847. [Google Scholar] [CrossRef]
- Zengin, A.; Yildirim, E.; Tamer, U.; Caykara, T. Molecularly Imprinted Superparamagnetic Iron Oxide Nanoparticles for Rapid Enrichment and Separation of Cholesterol. Analyst 2013, 138, 7238–7245. [Google Scholar] [CrossRef]
- Yoshimi, Y.; Ishii, N. Improved Gate Effect Enantioselectivity of Phenylalanine-Imprinted Polymers in Water by Blending Crosslinkers. Anal. Chim. Acta 2015, 862, 77–85. [Google Scholar] [CrossRef]
- Yoshimi, Y.; Yagisawa, Y.; Yamaguchi, R.; Seki, M. Blood Heparin Sensor Made from a Paste Electrode of Graphite Particles Grafted with Molecularly Imprinted Polymer. Sens. Actuators B Chem. 2018, 259, 455–462. [Google Scholar] [CrossRef]
- Hattori, K.; Hiwatari, M.; Iiyama, C.; Yoshimi, Y.; Kohori, F.; Sakai, K.; Piletsky, S.A. Gate Effect of Theophylline-Imprinted Polymers Grafted to the Cellulose by Living Radical Polymerization. J. Memb. Sci. 2004, 233, 169–173. [Google Scholar] [CrossRef]
- Yoshimi, Y.; Oino, D.; Ohira, H.; Muguruma, H.; Moczko, E.; Piletsky, S. Size of Heparin-Imprinted Nanoparticles Reflects the Matched Interactions with the Target Molecule. Sensors 2019, 19, 2415. [Google Scholar] [CrossRef] [PubMed] [Green Version]
- Yoshimi, Y.; Ohdaira, R.; Iiyama, C.; Sakai, K. “Gate Effect” of Thin Layer of Molecularly-Imprinted Poly(Methacrylic Acid-Co-Ethyleneglycol Dimethacrylate). Sens. Actuators B Chem. 2001, 73, 49–53. [Google Scholar] [CrossRef]
- Liu, D.; Luo, P.; Sun, W.; Zhang, L.; Wang, Z. Detection of β-Glucans Using an Amperometric Biosensor Based on High-Affinity Interaction between Dectin-1 and β-Glucans. Anal. Biochem. 2010, 404, 14–20. [Google Scholar] [CrossRef]
- Zhao, S.S.; Bukar, N.; Toulouse, J.L.; Pelechacz, D.; Robitaille, R.; Pelletier, J.N.; Masson, J.-F. Miniature Multi-Channel SPR Instrument for Methotrexate Monitoring in Clinical Samples. Biosens. Bioelectron. 2015, 64, 664–670. [Google Scholar] [CrossRef]
- Dauphin-Ducharme, P.; Yang, K.; Arroyo-Currás, N.; Ploense, K.L.; Zhang, Y.; Gerson, J.; Kurnik, M.; Kippin, T.E.; Stojanovic, M.N.; Plaxco, K.W. Electrochemical Aptamer-Based Sensors for Improved Therapeutic Drug Monitoring and High-Precision, Feedback-Controlled Drug Delivery. ACS Sens. 2019, 4, 2832–2837. [Google Scholar] [CrossRef]
- Saccar, C.L.; Danish, M.; Ragni, M.C.; Rocci, M.L.; Greene, J.; Yaffe, S.J.; Mansmann, H.C. The Effect of Phenobarbital on Theophylline Disposition in Children with Asthma. J. Allergy Clin. Immunol. 1985, 75, 716–719. [Google Scholar] [CrossRef]
- Weiss, A.; Porter, S.; Rozenberg, D.; O’Connor, E.; Lee, T.; Balter, M.; Wentlandt, K. Chronic Obstructive Pulmonary Disease: A Palliative Medicine Review of the Disease, Its Therapies, and Drug Interactions. J. Pain Symptom Manag. 2020, 60, 135–150. [Google Scholar] [CrossRef]
- Majdecka, D.; Draminska, S.; Janusek, D.; Krysinski, P.; Bilewicz, R. A Self-Powered Biosensing Device with an Integrated Hybrid Biofuel Cell for Intermittent Monitoring of Analytes. Biosens. Bioelectron. 2018, 102, 383–388. [Google Scholar] [CrossRef]
- Buck, R.P.; Nahir, T.M.; Mäckel, R.; Liess, H. Unusual, Non-Cottrell Behavior of Ionic Transport in Thin Cells and in Films. J. Electrochem. Soc. 1992, 139, 1611–1618. [Google Scholar] [CrossRef]
- Heerman, L.; Tarallo, A. Theory of the Chronoamperometric Transient for Electrochemical Nucleation with Diffusion-Controlled Growth. J. Electroanal. Chem. 1999, 470, 70–76. [Google Scholar] [CrossRef]
- Suryana, S.; Mutakin; Rosandi, Y.; Hasanah, A.N. An Update on Molecularly Imprinted Polymer Design through a Computational Approach to Produce Molecular Recognition Material with Enhanced Analytical Performance. Molecules 2021, 26, 1891. [Google Scholar] [CrossRef] [PubMed]
- Yang, B.; Fu, C.; Li, J.; Xu, G. Frontiers in Highly Sensitive Molecularly Imprinted Electrochemical Sensors: Challenges and Strategies. TrAC Trends Anal. Chem. 2018, 105, 52–67. [Google Scholar] [CrossRef]
- Yoshimi, Y.; Inaba, R.; Ogawa, T.; Yoshino, W.; Inoue, M.; Kuwana, K. Stabilized Sensing of Heparin in Whole Blood Using the ‘Gate Effect’ of Heparin-Imprinted Polymer Grafted onto an Electrode. Mol. Impr. 2016, 4, 13–20. [Google Scholar] [CrossRef]
- Wang, J.; Wu, L.-H.; Lu, Z.; Li, R.; Sanchez, J. Mixed Ferrocene-Glucose Oxidase-Carbon-Paste Electrode for Amperometric Determination of Glucose. Anal. Chim. Acta 1990, 228, 251–257. [Google Scholar] [CrossRef]
- Coulter, B. Emit 2000 Theophylline Assay; Beckman Coulter, Inc.: Brea, CA, USA, 2010. [Google Scholar]
- Nanopia TDM Theophylline; Theophylline Assay Kit (Classification No.: 3041700); Sekisui Medical Co., Ltd.: Tokyo, Japan, 2017.


| Electrode | Sensitivity (A.m/g) | Change in Contact Angle (0–40 μg/mL) |
|---|---|---|
| MIP 1 | 4.2 | 21.8 |
| MIP 2 | 10.6 | 19.6 |
| MIP 3 | 16.8 | 41.1 |
| Technique | Recognition Element | Detection Method | Reagent Required | Stability | Plasma Separation | Operation Time (Min) | Ref. |
|---|---|---|---|---|---|---|---|
| Beckman Coulter * | Antibody | Absorbance | Yes | 2 weeks | Yes | 120 | [67] |
| Nanopia * | Antibody | Absorbance | Yes | NA | Yes | 10 | [68] |
| Paper-chip sensor | MIP | Electrochemistry | No | 4 Weeks | No | <1 | This work |
| Component | MIP 1 | MIP 2 | MIP 3 |
|---|---|---|---|
| IG | 0.25 g | 0.25 g | 0.25 g |
| THO | 0.15 g | 0.15 g | 0.15 g |
| MBAA | 1.58 g | - | 0.79 g |
| EDMA | - | 1.58 g | 0.79 g |
| MAA | 200 μL | 200 μL | 200 μL |
Publisher’s Note: MDPI stays neutral with regard to jurisdictional claims in published maps and institutional affiliations. |
© 2022 by the authors. Licensee MDPI, Basel, Switzerland. This article is an open access article distributed under the terms and conditions of the Creative Commons Attribution (CC BY) license (https://creativecommons.org/licenses/by/4.0/).
Share and Cite
Aaryashree; Ohishi, T.; Yoshimi, Y. A Disposable Sensor Chip Using a Paste Electrode with Surface-Imprinted Graphite Particles for Rapid and Reagentless Monitoring of Theophylline. Molecules 2022, 27, 2456. https://0-doi-org.brum.beds.ac.uk/10.3390/molecules27082456
Aaryashree, Ohishi T, Yoshimi Y. A Disposable Sensor Chip Using a Paste Electrode with Surface-Imprinted Graphite Particles for Rapid and Reagentless Monitoring of Theophylline. Molecules. 2022; 27(8):2456. https://0-doi-org.brum.beds.ac.uk/10.3390/molecules27082456
Chicago/Turabian StyleAaryashree, Tomoji Ohishi, and Yasuo Yoshimi. 2022. "A Disposable Sensor Chip Using a Paste Electrode with Surface-Imprinted Graphite Particles for Rapid and Reagentless Monitoring of Theophylline" Molecules 27, no. 8: 2456. https://0-doi-org.brum.beds.ac.uk/10.3390/molecules27082456