
Monitoring of Pollutants Content in Bottled and Tap Drinking Water in Italy

 , ,
, ,  , and
, and
Abstract
:1. Introduction
- 1,4-dichlorobenzene (DCB), and
- 1,2,4,5-tetrachlorobenzene (TCB) volatile organic compounds mainly used as solvents [30];
2. Results
2.1. Method Validation
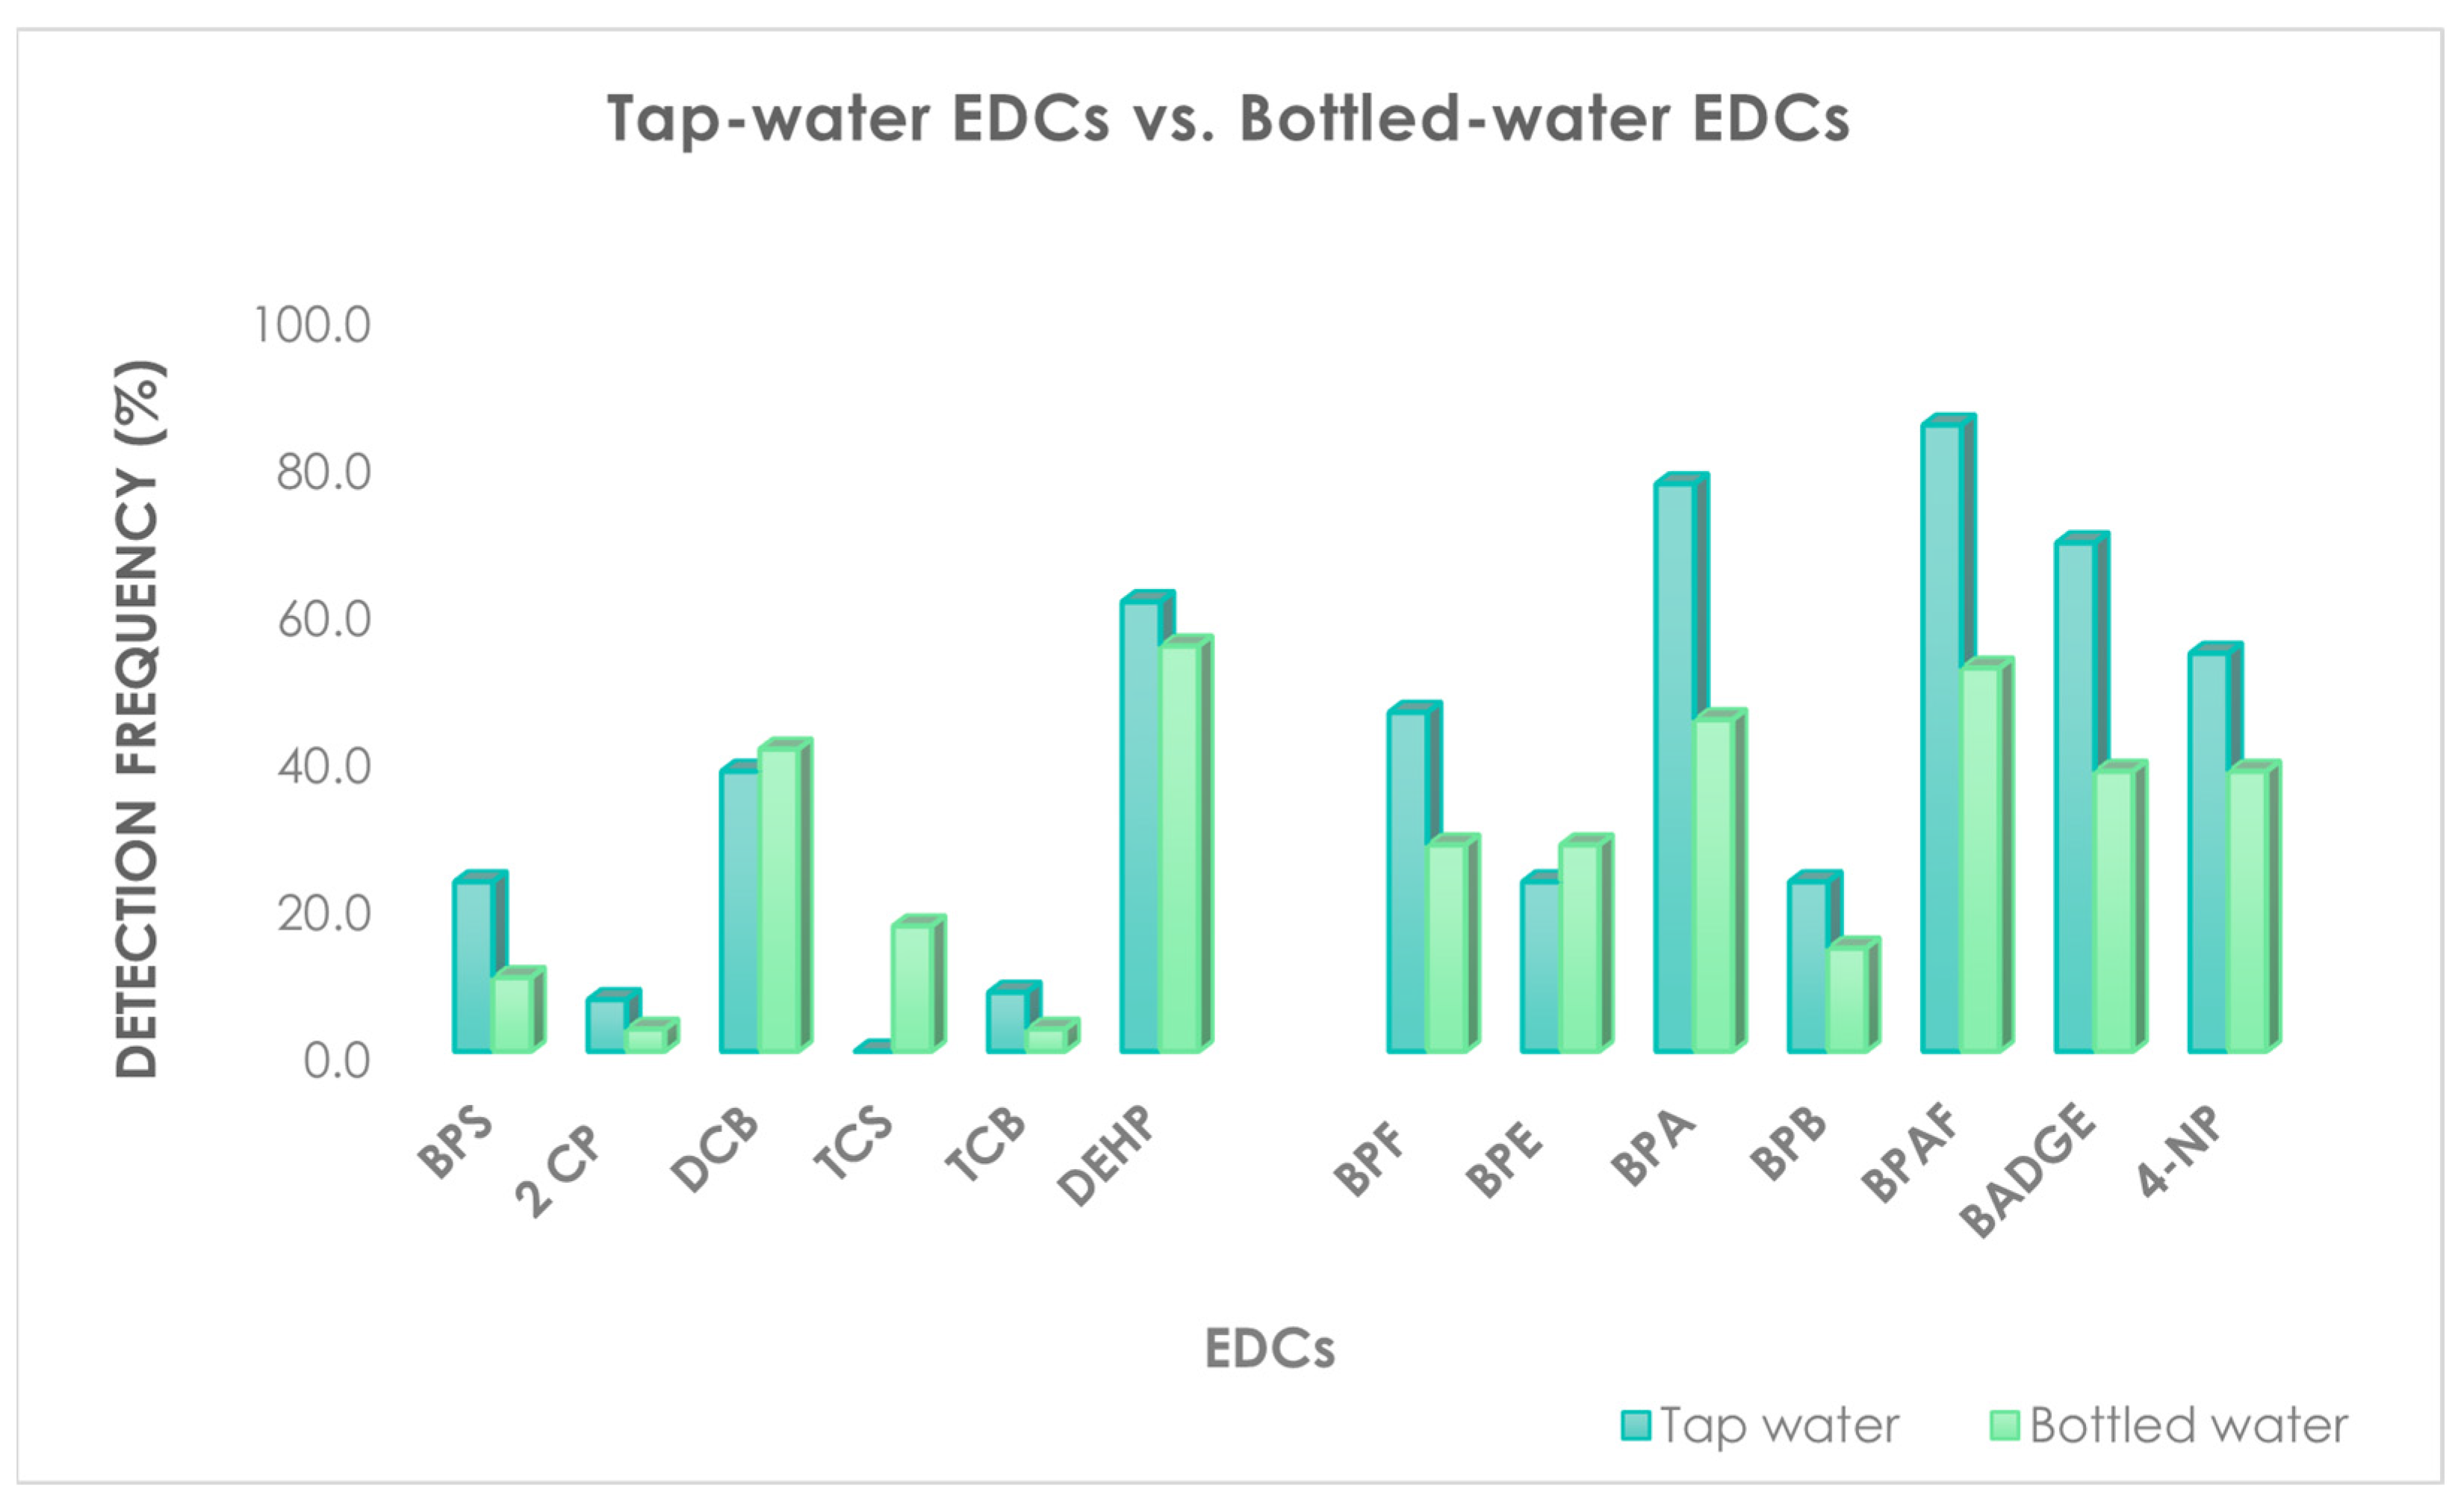
2.2. Real Samples
2.3. Heavy Metals
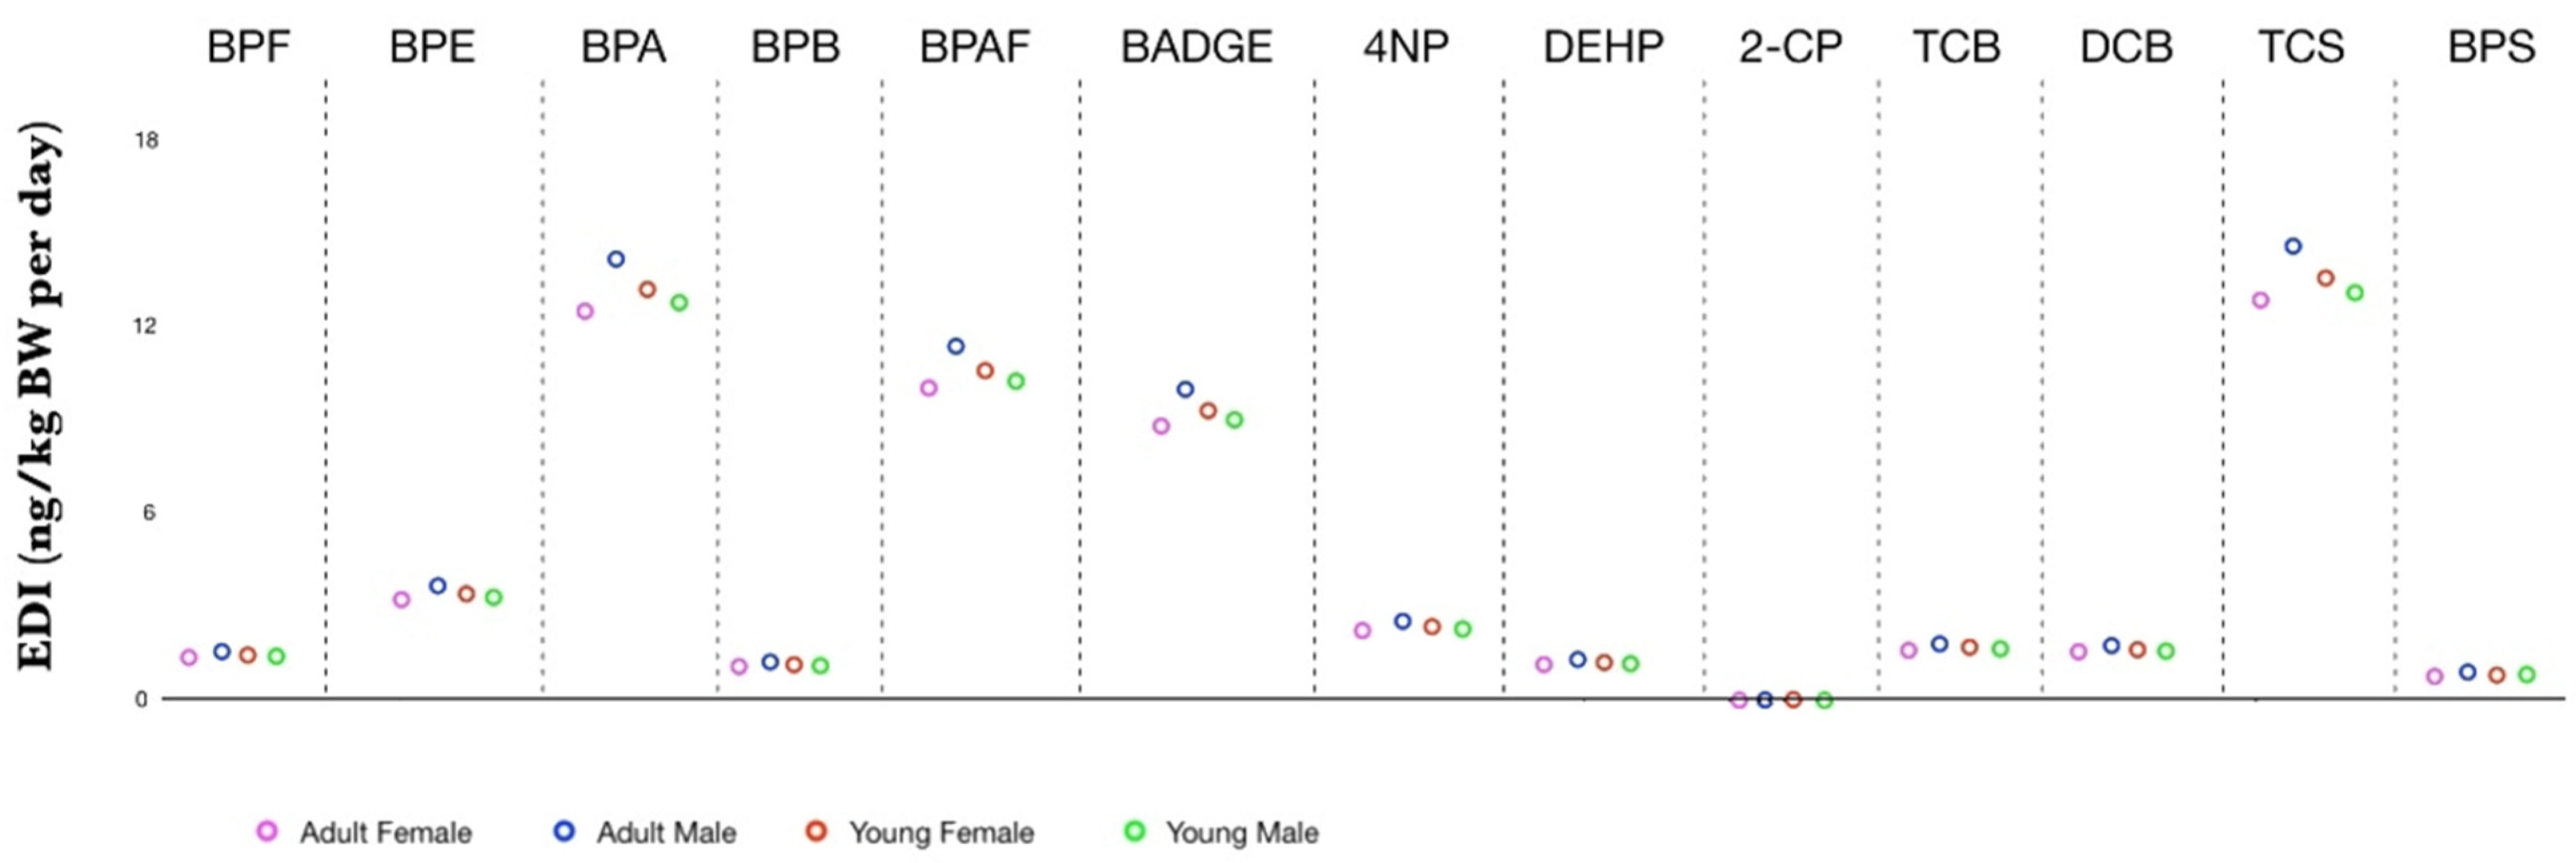
2.4. Estimated Daily Intake
3. Discussion
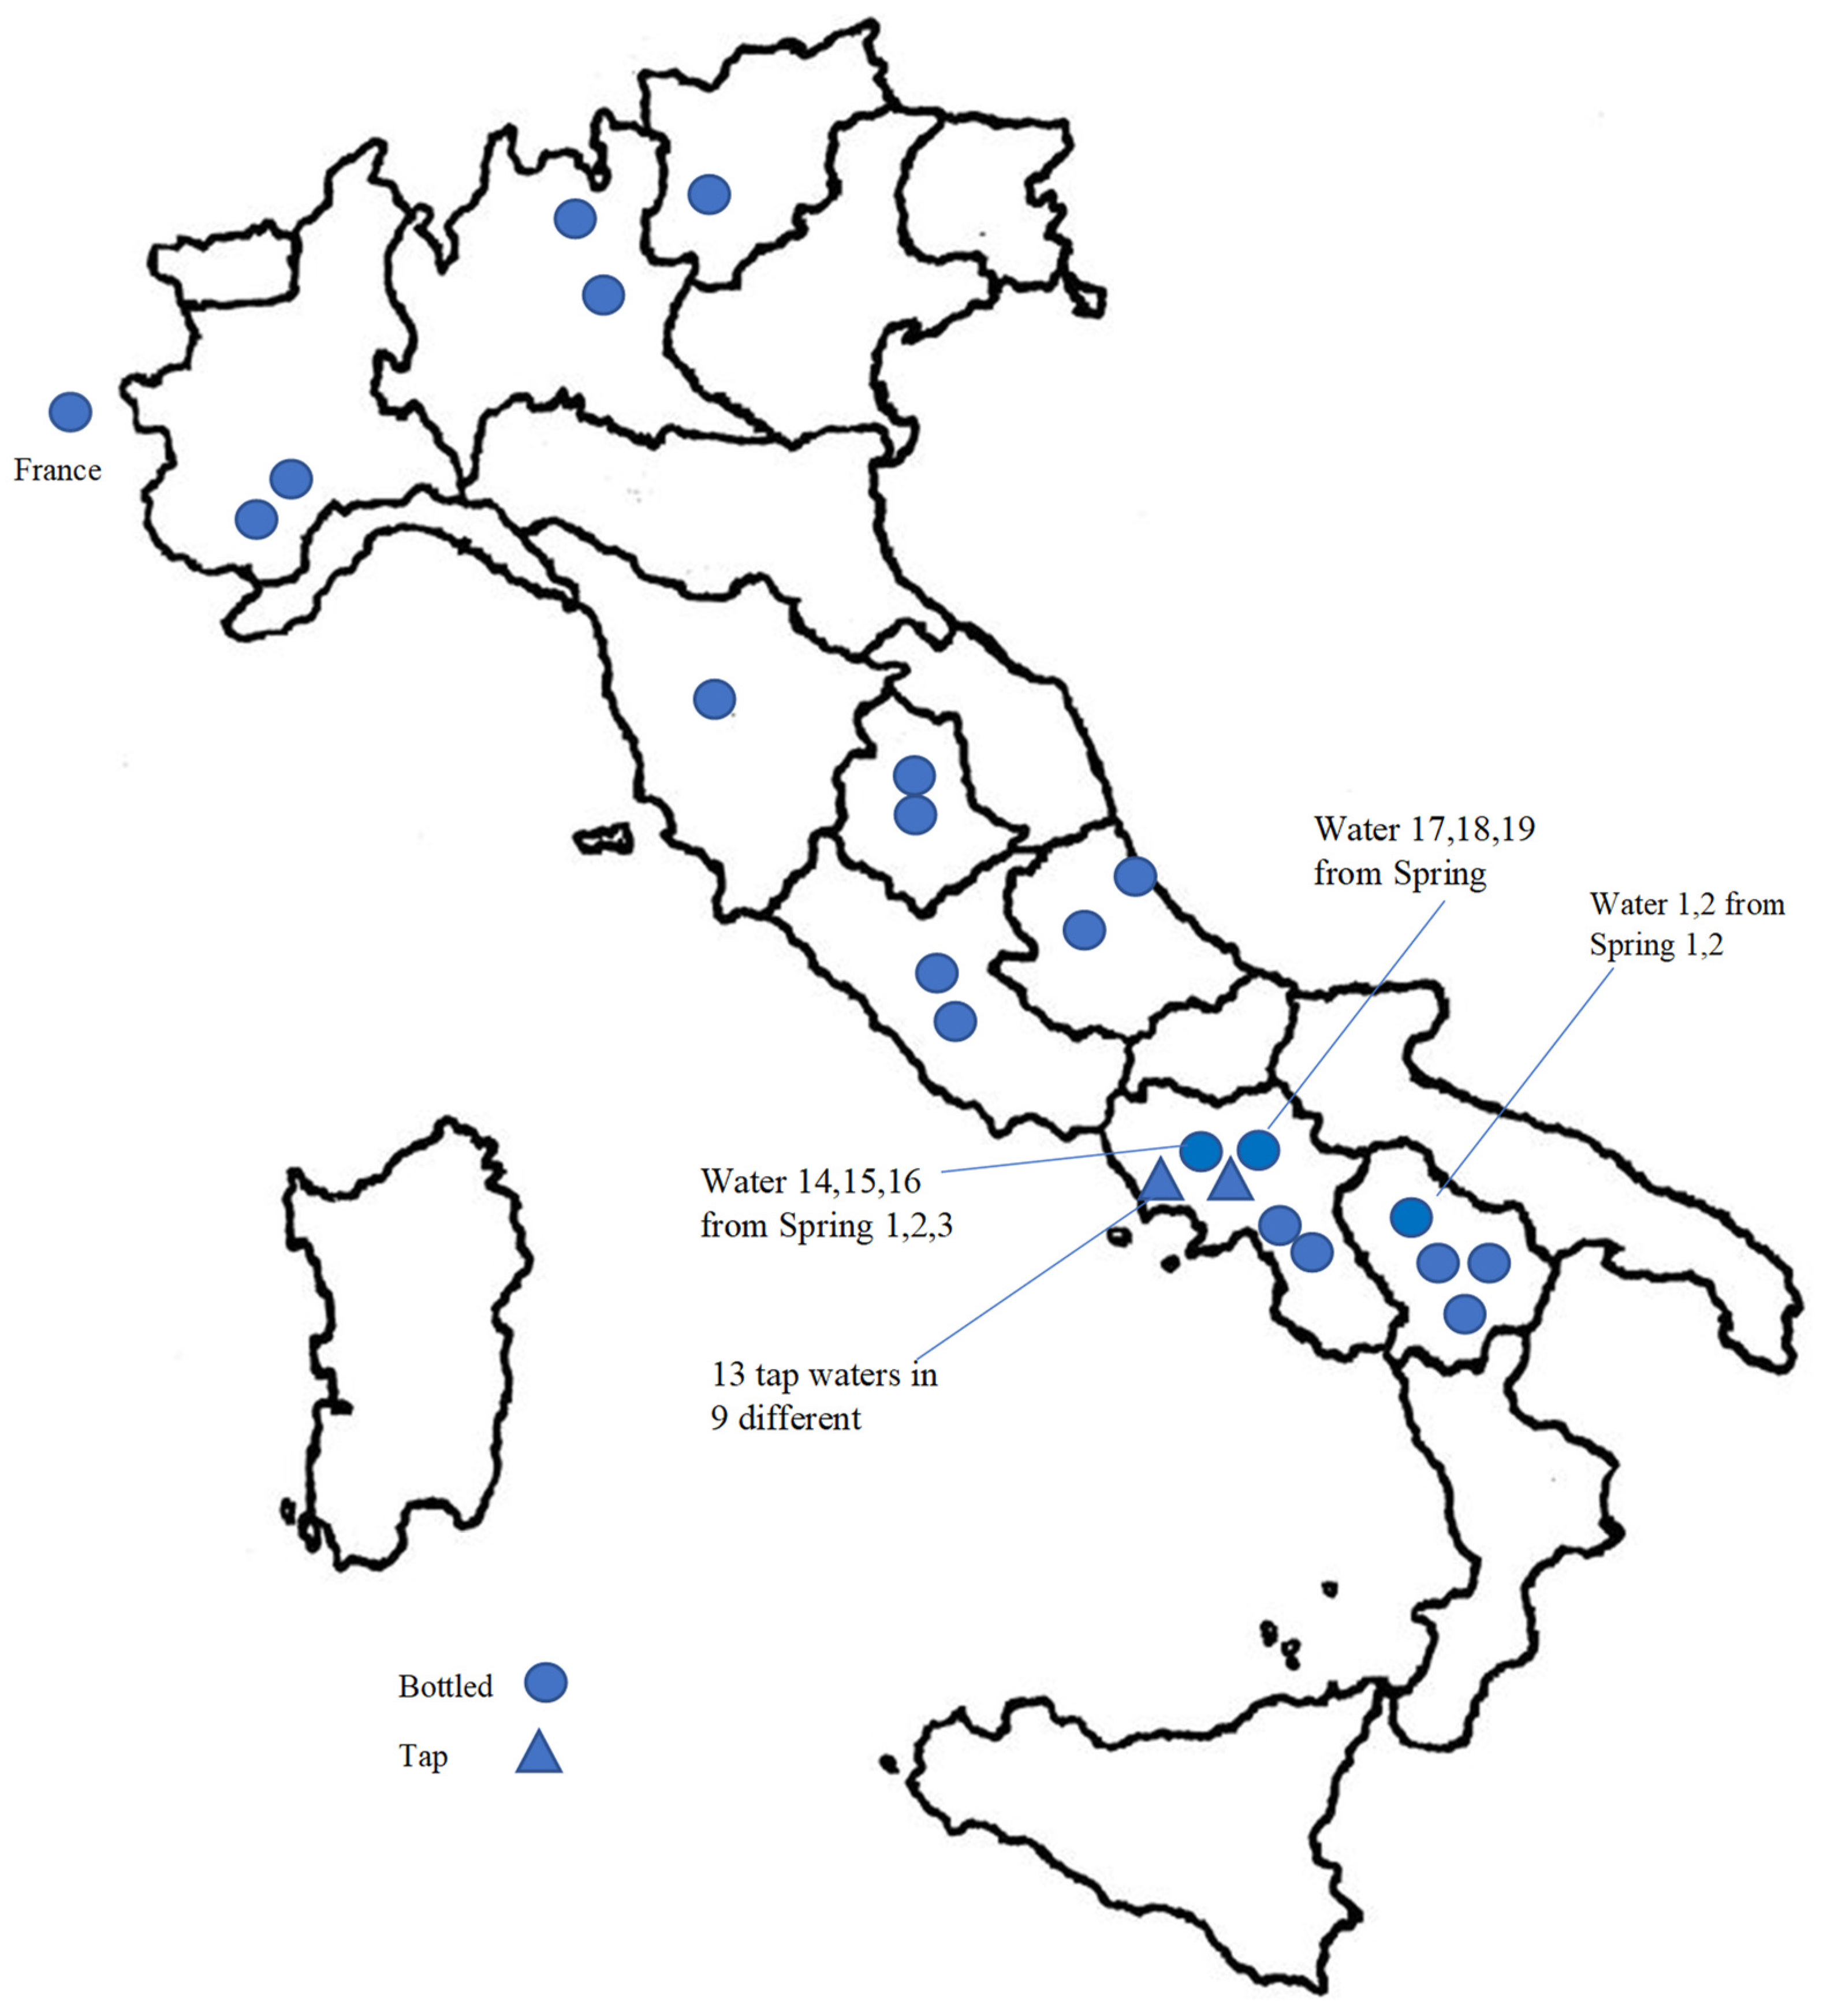
4. Materials and Methods
4.1. Analysis of Organic Pollutants
4.1.1. Reagents and Chemicals
4.1.2. Samples and Standard Solutions
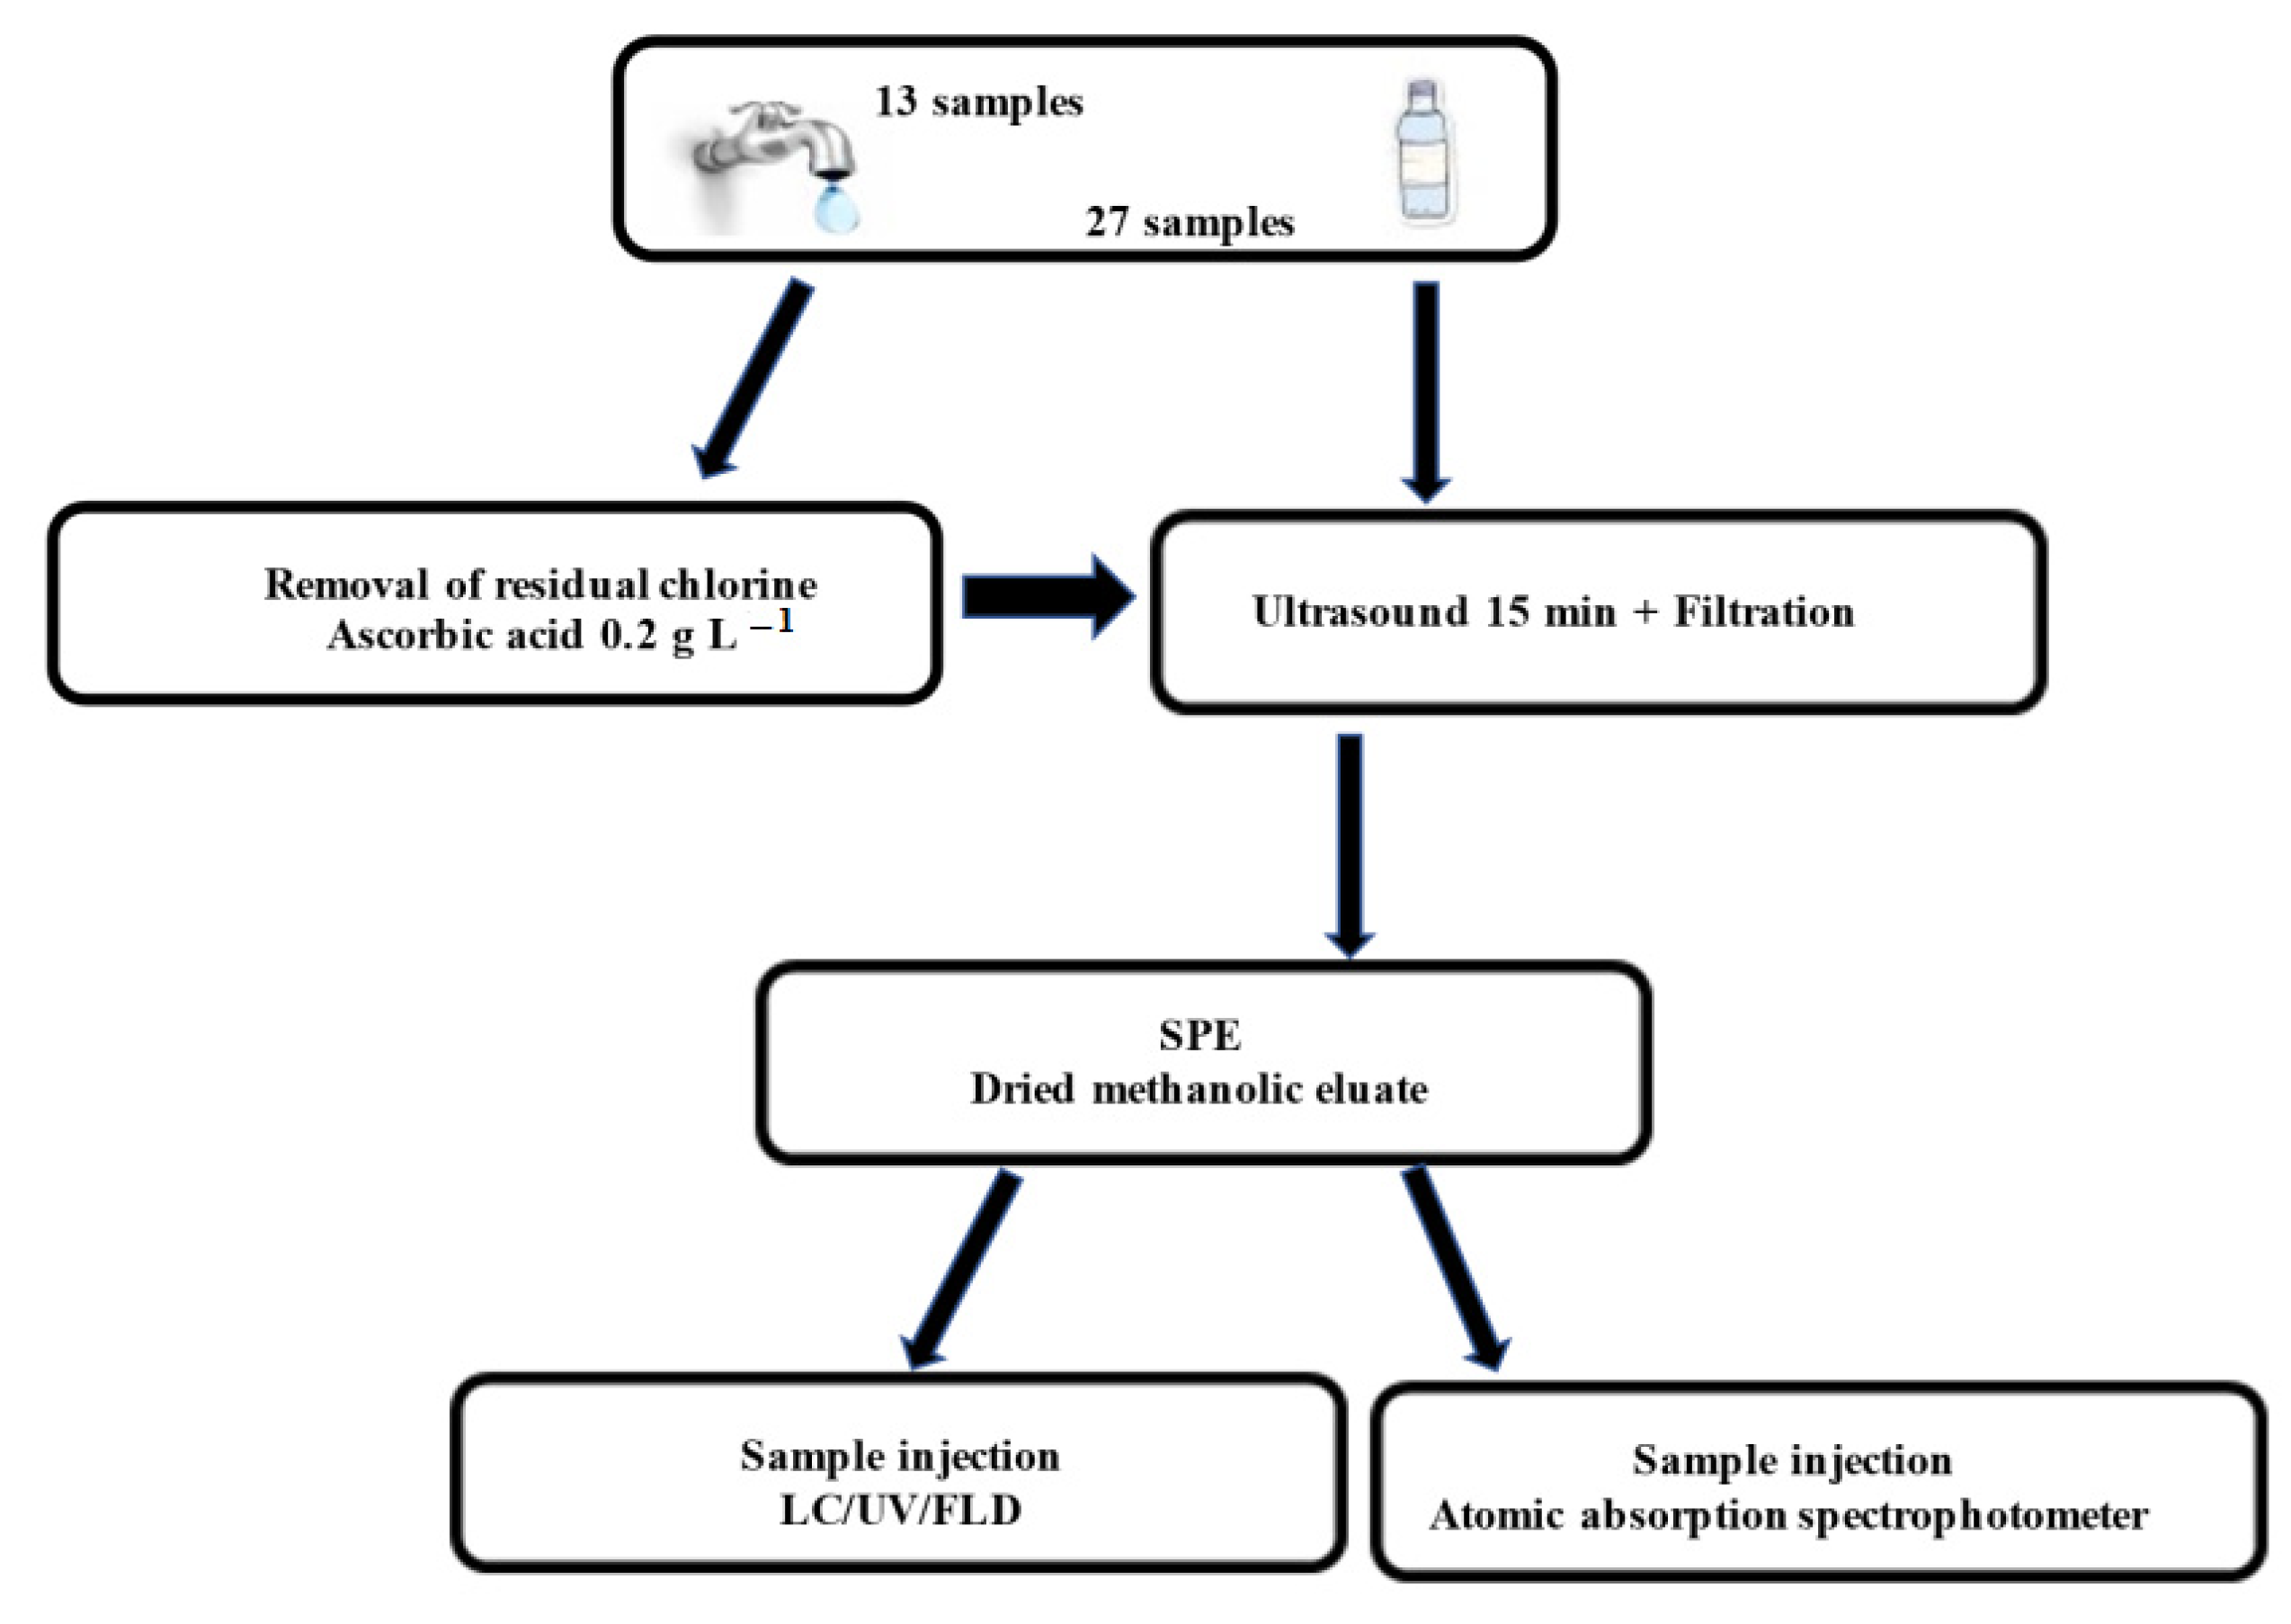
4.1.3. Sample Preparation
4.1.4. Analysis
4.2. Heavy Metals Analysis
4.2.1. Sample Preparation
4.2.2. Heavy Metal Analysis
4.3. Exposure Assessment
4.4. Data Analysis
5. Conclusions
Author Contributions
Funding
Institutional Review Board Statement
Informed Consent Statement
Data Availability Statement
Conflicts of Interest
Sample Availability
References
- Jéquier, E.; Constant, F. Water as an essential nutrient: The physiological basis of hydration. Eur. J. Clin. Nutr. 2010, 64, 115–123. [Google Scholar] [CrossRef] [PubMed] [Green Version]
- European Commission. Directive 2009/54/EC of the European Parliament and of the Council of 18 June 2009 on the Exploitation and Marketing of Natural Mineral Waters (Recast) (Text with EEA Relevance); European Commission: Brussels, Belgium, 2009. [Google Scholar]
- Gazzetta Ufficiale Repubblica Italiana DECRETO LEGISLATIVO 8 Ottobre 2011, n. 176 Attuazione della Direttiva 2009/54/CE, Sull’utilizzazione e la Commercializzazione delle Acque Minerali Naturali.(11G0218). 2011. Available online: https://www.gazzettaufficiale.it/eli/id/2011/11/05/011G0218/sg (accessed on 20 January 2022).
- Kabir, E.R.; Rahman, M.S.; Rahman, I. A review on endocrine disruptors and their possible impacts on human health. Environ Toxicol. Pharmacol. 2015, 40, 241–258. [Google Scholar] [CrossRef] [PubMed]
- Küblbeck, J.; Vuorio, T.; Niskanen, J.; Fortino, V.; Braeuning, A.; Abass, K.; Rautio, A.; Hakkola, J.; Honkakoski, P.; Levonen, A.L. The EDCMET Project: Metabolic Effects of Endocrine Disruptors. Int. J. Mol. Sci. 2020, 21, 3021. [Google Scholar] [CrossRef] [PubMed]
- Marotta, V.; Russo, G.; Gambardella, C.; Grasso, M.; La Sala, D.; Chiofalo, M.G.; D’Anna, R.; Puzziello, A.; Docimo, G.; Masone, S.; et al. Human exposure to bisphenol AF and diethylhexylphthalate increases susceptibility to develop differentiated thyroid cancer in patients with thyroid nodules. Chemosphere 2019, 218, 885–894. [Google Scholar] [CrossRef]
- Shafei, A.; Ramzy, M.M.; Hegazy, A.I.; Husseny, A.K.; El-Hadary, U.G.; Taha, M.M.; Mosa, A.A. The molecular mechanisms of action of the endocrine disrupting chemical bisphenol A in the development of cancer. Gene 2018, 647, 235–243. [Google Scholar] [CrossRef]
- Brenker, C.; Rehfeld, A.; Schiffer, C.; Kierzek, M.; Kaupp, U.B.; Skakkebæk, N.E.; Strünker, T. Synergistic activation of CatSper Ca2+ channels in human sperm by oviductal ligands and endocrine disrupting chemicals. Hum. Reprod. 2018, 33, 1915–1923. [Google Scholar] [CrossRef] [Green Version]
- Hamid, N.; Junaid, M.; Pei, D.S. Combined toxicity of endocrine-disrupting chemicals: A review. Ecotoxicol. Environ. Saf. 2021, 215, 112136. [Google Scholar] [CrossRef]
- Mao, W.; Song, Y.; Sui, H.; Cao, P.; Liu, Z. Analysis of individual and combined estrogenic effects of bisphenol, nonylphenol and diethylstilbestrol in immature rats with mathematical models. Environ. Health Prev. Med. 2019, 24, 32. [Google Scholar] [CrossRef]
- Fattore, M.; Russo, G.; Barbato, F.; Grumetto, L.; Albrizio, S. Monitoring of bisphenols in canned tuna from Italian markets. Food Chem. Toxicol. 2015, 83, 68–75. [Google Scholar] [CrossRef]
- Russo, G.; Barbato, F.; Grumetto, L. Development and Validation of a LC-FD Method for the Simultaneous Determination of Eight Bisphenols in Soft Drinks. Food Anal. Methods 2016, 9, 2732–2740. [Google Scholar] [CrossRef]
- Bae, B.; Jeong, J.H.; Lee, S.J. The quantification and characterization of endocrine disruptor bisphenol-A leaching from epoxy resin. Water Sci. Technol. 2002, 46, 381–387. [Google Scholar] [CrossRef] [PubMed]
- Lane, R.F.; Adams, C.D.; Randtke, S.J.; Carter, R.E., Jr. Bisphenol diglycidyl ethers and bisphenol A and their hydrolysis in drinking water. Water Res. 2015, 72, 331–339. [Google Scholar] [CrossRef] [PubMed]
- Russo, G.; Barbato, F.; Mita, D.G.; Grumetto, L. Occurrence of Bisphenol A and its analogues in some foodstuff marketed in Europe. Food Chem. Toxicol. 2019, 131, 110575. [Google Scholar] [CrossRef] [PubMed]
- Vandenberg, L.N.; Hauser, R.; Marcus, M.; Olea, N.; Welshons, W.V. Human exposure to bisphenol A (BPA). Reprod. Toxicol. 2007, 24, 139–177. [Google Scholar] [CrossRef] [PubMed]
- Jayaweera, M.; Perera, H.; Bandara, N.; Danushika, G.; Gunawardana, B.; Somaratne, C.; Manatunge, J.; Zoysa, K.; Thathsara, T. Migration of phthalates from PET water bottle in events of repeated uses and associated risk assessment. Environ. Sci. Pollut. Res. Int. 2020, 27, 39149–39163. [Google Scholar] [CrossRef] [PubMed]
- Kako, S.; Isobe, A.; Kataoka, T.; Hinata, H. A decadal prediction of the quantity of plastic marine debris littered on beaches of the East Asian marginal seas. Mar. Pollut. Bull. 2014, 81, 174–184. [Google Scholar] [CrossRef]
- Amiridou, D.; Voutsa, D. Alkylphenols and phthalates in bottled waters. J. Hazard. Mater. 2011, 185, 281–286. [Google Scholar] [CrossRef]
- European Commission. Commission Regulation (EU) No 10/2011 of 14 January 2011 on Plastic Materials and Articles Intended to Come into Contact with Food Law; E.U., Ed.; European Commission: Brussels, Belgium, 2011. [Google Scholar]
- Melnick, R.; Lucier, G.; Wolfe, M.; Hall, R.; Stancel, G.; Prins, G.; Gallo, M.; Reuhl, K.; Ho, S.M.; Brown, T.; et al. Summary of the National Toxicology Program’s report of the endocrine disruptors low-dose peer review. Environ. Health Perspect. 2002, 110, 427–431. [Google Scholar] [CrossRef]
- Chen, D.; Kannan, K.; Tan, H.; Zheng, Z.; Feng, Y.L.; Wu, Y.; Widelka, M. Bisphenol Analogues Other Than BPA: Environmental Occurrence, Human Exposure, and Toxicity-A Review. Environ. Sci. Technol. 2016, 50, 5438–5453. [Google Scholar] [CrossRef]
- Huang, M.; Liu, S.; Fu, L.; Jiang, X.; Yang, M. Bisphenol A and its analogues bisphenol S, bisphenol F and bisphenol AF induce oxidative stress and biomacromolecular damage in human granulosa KGN cells. Chemosphere 2020, 253, 126707. [Google Scholar] [CrossRef]
- Mustieles, V.; D’Cruz, S.C.; Couderq, S.; Rodríguez-Carrillo, A.; Fini, J.B.; Hofer, T.; Steffensen, I.L.; Dirven, H.; Barouki, R.; Olea, N.; et al. Bisphenol A and its analogues: A comprehensive review to identify and prioritize effect biomarkers for human biomonitoring. Environ. Int. 2020, 144, 105811. [Google Scholar] [CrossRef] [PubMed]
- Russo, G.; Capuozzo, A.; Barbato, F.; Irace, C.; Santamaria, R.; Grumetto, L. Cytotoxicity of seven bisphenol analogues compared to bisphenol A and relationships with membrane affinity data. Chemosphere 2018, 201, 432–440. [Google Scholar] [CrossRef] [PubMed]
- Khalil, F.; Amir, A.M.; Hatam, A.; Pourya, B.; Hossein, T.; Amir, A.F.; Hossein, P. A novel dispersive micro solid phase extraction using zein nanoparticles as the sorbent combined with headspace solid phase micro-extraction to determine chlorophenols in water and honey samples by GC–ECD. Talanta 2014, 128, 493–499. [Google Scholar]
- Zheng, D.; Jiao, H.; Zhong, H.; Qiu, J.; Yan, X.; Duan, Q.; Chai, L. Chlorophenols in marine organisms from the southern coast of Hangzhou Bay, China, and an assessment of risks posed to human health. J. Oceanol. Limnol. 2018, 36, 726–737. [Google Scholar] [CrossRef]
- Ying, G.; Williams, B.; Kookana, R. Environmental fate of alkylphenols and alkylphenol ethoxylates—A review. Environ. Int. 2002, 28, 215–226. [Google Scholar] [CrossRef]
- Ji, X.; Li, N.; Yuan, S.; Zhou, X.; Ding, F.; Rao, K.; Ma, M.; Wang, Z. A comparison of endocrine disruption potential of nonylphenol ethoxylate, vanillin ethoxylate, 4-n-nonylphenol and vanillin in vitro. Ecotoxicol. Environ. Saf. 2019, 175, 208–214. [Google Scholar] [CrossRef]
- Lehmann, I.; Roder-Stolinski, C.; Nieber, K.; Fischader, G. In vitro models for the assessment of inflammatory and immuno-modulatory effects of the volatile organic compound chlorobenzene. Exp. Toxicol. Pathol. 2008, 60, 185–193. [Google Scholar] [CrossRef]
- Montagnini, B.G.; Pernoncine, K.V.; Borges, L.I.; Costa, N.O.; Moreira, E.G.; Anselmo-Franci, J.A.; Kiss, A.C.I.; Gerardin, D.C.C. Investigation of the potential effects of triclosan as an endocrine disruptor in female rats: Uterotrophic assay and two-generation study. Toxicology 2018, 410, 152–165. [Google Scholar] [CrossRef]
- Sharma, P.; Tseng, H.H.; Lee, J.L.; Tsai, E.M.; Suen, J.L. A prominent environmental endocrine disruptor, 4-nonylphenol, promotes endometriosis development via plasmacytoid dendritic cells. Mol. Hum. Reprod. 2020, 26, 601–614. [Google Scholar] [CrossRef]
- Makita, Y. Effects of perinatal, combined exposure to 1,4-dichlorobenzene and 1,1-dichloro-2,2-bis(p-chlorophenyl)ethylene on rat female reproductive system. Basic Clin. Pharmacol. Toxicol. 2008, 102, 360–364. [Google Scholar] [CrossRef]
- Stoker, T.E.; Gibson, E.K.; Zorrilla, L.M. Triclosan exposure modulates estrogen-dependent responses in the female wistar rat. Toxicol. Sci. 2010, 117, 45–53. [Google Scholar] [CrossRef] [PubMed]
- Tchounwou, P.B.; Yedjou, C.G.; Patlolla, A.K.; Sutton, D.J. Heavy metal toxicity and the environment. Exp. Suppl. 2012, 101, 133–164. [Google Scholar] [PubMed] [Green Version]
- Wu, X.; Cobbina, S.J.; Mao, G.; Xu, H.; Zhang, Z.; Yang, L. A review of toxicity and mechanisms of individual and mixtures of heavy metals in the environment. Environ. Sci. Pollut. Res. Int. 2016, 23, 8244–8259. [Google Scholar] [CrossRef] [PubMed]
- European Commission. EC implementing Council Directive 96/23/EC, Concerning the Performance of Analytical Methods and the Interpretation of Results. 2002/657/EC. Off. J. Eur. Commun. 2002, 221, 8–36. [Google Scholar]
- Russo, G.; Barbato, F.; Mita, D.G.; Grumetto, L. Simultaneous determination of fifteen multiclass organic pollutants in human saliva and serum by liquid chromatography-tandem ultraviolet/fluorescence detection: A validated method. Biomed. Chromatogr. 2019, 33, e4427. [Google Scholar] [CrossRef] [PubMed]
- Gazzetta Ufficiale Repubblica Italiana. Attuazione della Direttiva 98/83/CE Relativa alla Qualita’ delle Acque Destinate al Consumo Umano. Gazzetta Ufficiale n. 52 del 3 Marzo 2001—Supplemento Ordinario n. 41. 2001. Available online: https://www.gazzettaufficiale.it/eli/id/2001/03/03/001G0074/sg (accessed on 20 January 2022).
- Alamri, M.S.; Qasem, A.A.A.; Mohamed, A.A.; Hussain, S.; Ibraheem, M.A.; Shamlan, G.; Alqah, H.A.; Qasha, A.S. Food packaging’s materials: A food safety perspective. Saudi J. Biol. Sci. 2021, 28, 4490–4499. [Google Scholar] [CrossRef]
- Esteban, S.; Gorga, M.; Petrovic, M.; Gonzalez-Alonso, S.; Barcelo, D.; Valcarcel, Y. Analysis and occurrence of endocrine-disrupting compounds and estrogenic activity in the surface waters of Central Spain. Sci. Total Environ. 2014, 466–467, 939–951. [Google Scholar] [CrossRef]
- Valcarcel, Y.; Valdehita, A.; Becerra, E.; Lopez de Alda, M.; Gil, A.; Gorga, M.; Petrovic, M.; Barcelo, D.; Navas, J.M. Determining the presence of chemicals with suspected endocrine activity in drinking water from the Madrid region (Spain) and assessment of their estrogenic, androgenic and thyroidal activities. Chemosphere 2018, 201, 388–398. [Google Scholar] [CrossRef]
- Li, X.; Ying, G.G.; Su, H.C.; Yang, X.B.; Wang, L. Simultaneous determination and assessment of 4-nonylphenol, bisphenol A and triclosan in tap water, bottled water and baby bottles. Environ. Int. 2010, 36, 557–562. [Google Scholar] [CrossRef]
- Zhang, H.; Zhang, Y.; Li, J.; Yang, M. Occurrence and exposure assessment of bisphenol analogues in source water and drinking water in China. Sci. Total Environ. 2019, 655, 607–613. [Google Scholar] [CrossRef]
- Kuch, H.M.; Ballschmiter, K. Determination of endocrine-disrupting phenolic compounds and estrogens in surface and drinking water by HRGC-(NCI)-MS in the picogram per liter range. Environ. Sci. Technol. 2001, 35, 3201–3206. [Google Scholar] [CrossRef] [PubMed]
- Coogan, M.A.; Edziyie, R.E.; La Point, T.W.; Venables, B.J. Algal bioaccumulation of triclocarban, triclosan, and methyl-triclosan in a North Texas wastewater treatment plant receiving stream. Chemosphere 2007, 67, 1911–1918. [Google Scholar] [CrossRef]
- Halden, R.U.; Paull, D.H. Co-occurrence of triclocarban and triclosan in U.S. water resources. Environ. Sci. Technol. 2005, 39, 1420–1426. [Google Scholar] [CrossRef] [PubMed]
- Jeddi, M.Z.; Rastkari, N.; Ahmadkhaniha, R.; Yunesian, M. Endocrine disruptor phthalates in bottled water: Daily exposure and health risk assessment in pregnant and lactating women. Environ. Monit. Assess. 2016, 188, 534. [Google Scholar] [CrossRef]
- Luo, Q.; Liu, Z.H.; Yin, H.; Dang, Z.; Wu, P.X.; Zhu, N.W.; Lin, Z.; Liu, Y. Migration and potential risk of trace phthalates in bottled water: A global situation. Water Res. 2018, 147, 362–372. [Google Scholar] [CrossRef] [PubMed]
- Maggioni, S.; Balaguer, P.; Chiozzotto, C.; Benfenati, E. Screening of endocrine-disrupting phenols, herbicides, steroid estrogens, and estrogenicity in drinking water from the waterworks of 35 Italian cities and from PET-bottled mineral water. Environ. Sci. Pollut. Res. Int. 2013, 20, 1649–1660. [Google Scholar] [CrossRef] [PubMed]
- Wee, S.Y.; Aris, A.Z.; Yusoff, F.M.; Praveena, S.M. Tap water contamination: Multiclass endocrine disrupting compounds in different housing types in an urban settlement. Chemosphere 2021, 264 Pt 1, 128488. [Google Scholar] [CrossRef]
- Carnevali, O.; Notarstefano, V.; Olivotto, I.; Graziano, M.; Gallo, P.; Di Marco Pisciottano, I.; Vaccari, L.; Mandich, A.; Giorgini, E.; Maradonna, F. Dietary administration of EDC mixtures: A focus on fish lipid metabolism. Aquat. Toxicol. 2017, 185, 95–104. [Google Scholar] [CrossRef]
- Olivieri, A.; Degenhardt, O.S.; McDonald, G.R.; Narang, D.; Paulsen, I.M.; Kozuska, J.L.; Holt, A. On the disruption of biochemical and biological assays by chemicals leaching from disposable laboratory plasticware. Can. J. Physiol. Pharmacol. 2012, 90, 697–703. [Google Scholar] [CrossRef]
- Urbansky, E.T.; Freeman, D.M.; Rubio, F.J. Ascorbic acid reduction of residual active chlorine in potable water prior to halocarboxylate determination. J. Environ. Monit. 2000, 2, 253–256. [Google Scholar] [CrossRef]
- Shi, W.; Zhang, F.; Zhang, X.; Su, G.; Wei, S.; Liu, H.; Cheng, S.; Yu, H. Identification of trace organic pollutants in freshwater sources in Eastern China and estimation of their associated human health risks. Ecotoxicology 2011, 20, 1099–1106. [Google Scholar] [CrossRef] [PubMed]
- DIRECTIVE (EU) 2020/2184 on the Quality of Water Intended for Human Consumption. Off. J. Eur. Union 2020, 435, 1–62. Available online: https://eur-lex.europa.eu/legal-content/EN/TXT/PDF/?uri=CELEX:32020L2184&from=EN (accessed on 20 January 2022).


| Sample | Origin | BPF | BPE | BPA | BPB | BPAF | BADGE | 4-NP |
|---|---|---|---|---|---|---|---|---|
| ng L−1 | ng L−1 | ng L−1 | ng L−1 | ng L−1 | ng L−1 | ng L−1 | ||
| Water 1 | South Italy spring 1 | * | 88.37 | * | * | 811.61 | * | 117.95 |
| Water 2 | South Italy spring 2 | * | 11.65 | * | 192.36 | 512.39 | * | 81.55 |
| Water 3 | Central Italy | * | 43.11 | * | * | 1544.68 | * | 156.71 |
| Water 4 | South Italy | 30.29 | * | 48.94 | * | 57.35 | 23.04 | * |
| Water 5 | South Italy | 9.13 | 5.63 | 4.34 | * | 639.51 | 29.74 | 67.81 |
| Water 6 | North Italy | * | * | * | * | 322.37 | * | 188.09 |
| Water 7 | North Italy | * | * | * | * | 179.95 | * | * |
| Water 8 | Central Italy | * | * | * | 21.78 | * | 21.15 | * |
| Water 9 | Central Italy | * | * | * | * | * | * | * |
| Water 10 | Central Italy | * | * | * | * | * | * | * |
| Water 11 | South Italy | * | * | * | * | 110.05 | * | * |
| Water 12 | North Italy | * | * | 50.57 | * | * | 375.49 | * |
| Water 13 | Central Italy | * | * | * | * | * | * | * |
| Water 14 | South Italy spring 1 | * | 16.03 | * | * | 54.57 | 52.10 | 41.80 |
| Water 15 | South Italy spring 2 | 14.07 | 9.24 | 4.34 | 2.56 | 62.53 | 30.96 | 67.39 |
| Water 16 | South Italy spring 3 | 7.96 | 67.91 | 28.85 | * | 863.45 | * | 97.34 |
| Water 17 | South Italy spring 1 | * | * | * | * | 165.17 | 19.04 | 33.64 |
| Water 18 | South Italy spring 2 | * | * | * | * | 51.58 | * | * |
| Water 19 Water 20 Water 21 # Water 22 # Water 23 # Water 24 # Water 25 # Water 26 # Water 27 # Water 28 # Water 29 # Water 30 # Water 31 Water 32 Water 33 Water 34 # Water 35 # Water 36 # Water 37 Water 38 Water 39 Water 40 | South Italy spring 3 Central Italy spring 1 South Italy South Italy South Italy South Italy pickup site1 South Italy pickup site 2 South Italy pickup site 3 South Italy South Italy South Italy South Italy Central Italy South Italy France South Italy South Italy South Italy Central Italy North Italy South Italy Central Italy | 42.02 * * 63.05 * * * 327.42 * * * 18.18 * 9.60 6.24 77.29 127.42 11.60 * * * 29.37 | * * 23.20 * * * * 164.01 * * * * * * * 779.53 * * * * * 223.3 | 18.97 * 4.34 27.47 4.34 * * 204.54 26.83 * 46.17 12.82 85.44 30.64 25.44 68.19 329.19 56.69 52.13 716.00 1050.00 900 | * * * * 3.90 * 1.16 * * * * * * * * 67.75 * * * 15.24 * * | * 485.90 582.82 866.37 37.71 942.61 1.02 373.44 345.55 35.15 109.59 871.92 19.82 * * 20.30 * * * * * * | * 214.64 49.01 177.72 17.70 101.17 * 75.85 * * 1246.91 * * * * 67.97 2363.46 17.09 * 175.15 173.45 1842.64 | 136.22 128.09 66.80 34.53 4.39 133.47 * 120.18 * 57.56 * 84.87 * * * * * * * * * * |
| Sample | Origin | BPS | 2-CP | DCB | TCS | TCB | DEHP |
|---|---|---|---|---|---|---|---|
| µg L−1 | µg L−1 | µg L−1 | µg L−1 | µg L−1 | µg L−1 | ||
| Water 1 | South Italy spring 1 | * | * | 26.28 | * | * | 21.51 |
| Water 2 | South Italy spring 2 | 6.58 | * | * | 19.14 | * | 21.59 |
| Water 3 | Central Italy | * | * | * | * | * | 22.53 |
| Water 4 | South Italy | 0.24 | * | 1.49 | * | * | 5.89 |
| Water 5 | South Italy | * | * | 6.76 | * | * | 5.33 |
| Water 6 | North Italy | * | * | * | * | * | 20.0 |
| Water 7 | North Italy | * | * | * | * | * | * |
| Water 8 | Central Italy | * | * | * | * | * | * |
| Water 9 | Central Italy | * | * | * | * | * | * |
| Water 10 | Central Italy | * | * | * | * | * | * |
| Water 11 | South Italy | * | * | * | * | * | * |
| Water 12 | North Italy | * | * | * | * | * | * |
| Water 13 | Central Italy | * | * | * | * | * | * |
| Water 14 | South Italy spring 1 | * | * | 15.30 | * | * | 21.55 |
| Water 15 | South Italy spring 2 | * | * | * | * | * | 6.15 |
| Water 16 | South Italy spring 3 | * | 0.16 | 27.22 | 0.26 | * | 32.46 |
| Water 17 | South Italy spring 1 | * | * | 5.62 | * | * | 6.20 |
| Water 18 | South Italy spring 2 | * | * | * | * | * | 2.10 |
| Water 19 | South Italy spring 3 | * | * | 16.29 | * | * | * |
| Water 20 | Central Italy spring 1 | * | * | * | * | * | 24.65 |
| Water 21 # | South Italy | * | * | 20.18 | * | * | 3.57 |
| Water 22 # | South Italy | 1.83 | * | 11.03 | * | * | 5.06 |
| Water 23 # | South Italy | * | * | * | * | * | 2.10 |
| Water 24 # | South Italy pickup site1 | * | * | 24.26 | * | * | 6.95 |
| Water 25 # | South Italy pickup site 2 | * | * | * | * | * | * |
| Water 26 # | South Italy pickup site3 | 11.84 | 0.16 | 22.18 | * | * | 35.28 |
| Water 27 # | South Italy | * | * | * | * | * | * |
| Water 28 # | South Italy | * | * | * | * | 31.03 | 39.24 |
| Water 29 # | South Italy | 51.45 | * | * | * | * | * |
| Water 30 # | South Italy | * | * | 19.05 | * | * | 5.04 |
| Water 31 | Central Italy | * | * | * | * | * | * |
| Water 32 | South Ital | * | * | 207.98 | * | * | * |
| Water 33 | France | 10.04 | * | 16.51 | * | * | 34.90 |
| Water 34 # | South Italy | * | * | * | 162.29 | * | 383.48 |
| Water 35 # | South Italy | * | * | 233.40 | * | * | * |
| Water 36 # | South Italy | * | * | * | * | * | * |
| Water 37 | Central Italy | * | * | 112.80 | * | * | 121.26 |
| Water 38 | North Italy | * | * | 127.47 | 67.16 | 97.12 | 134.52 |
| Water 39 | South Italy | * | * | * | 355.73 | * | 75.00 |
| Water 40 | Central Italy | * | * | 219.36 | * | * | 118.46 |
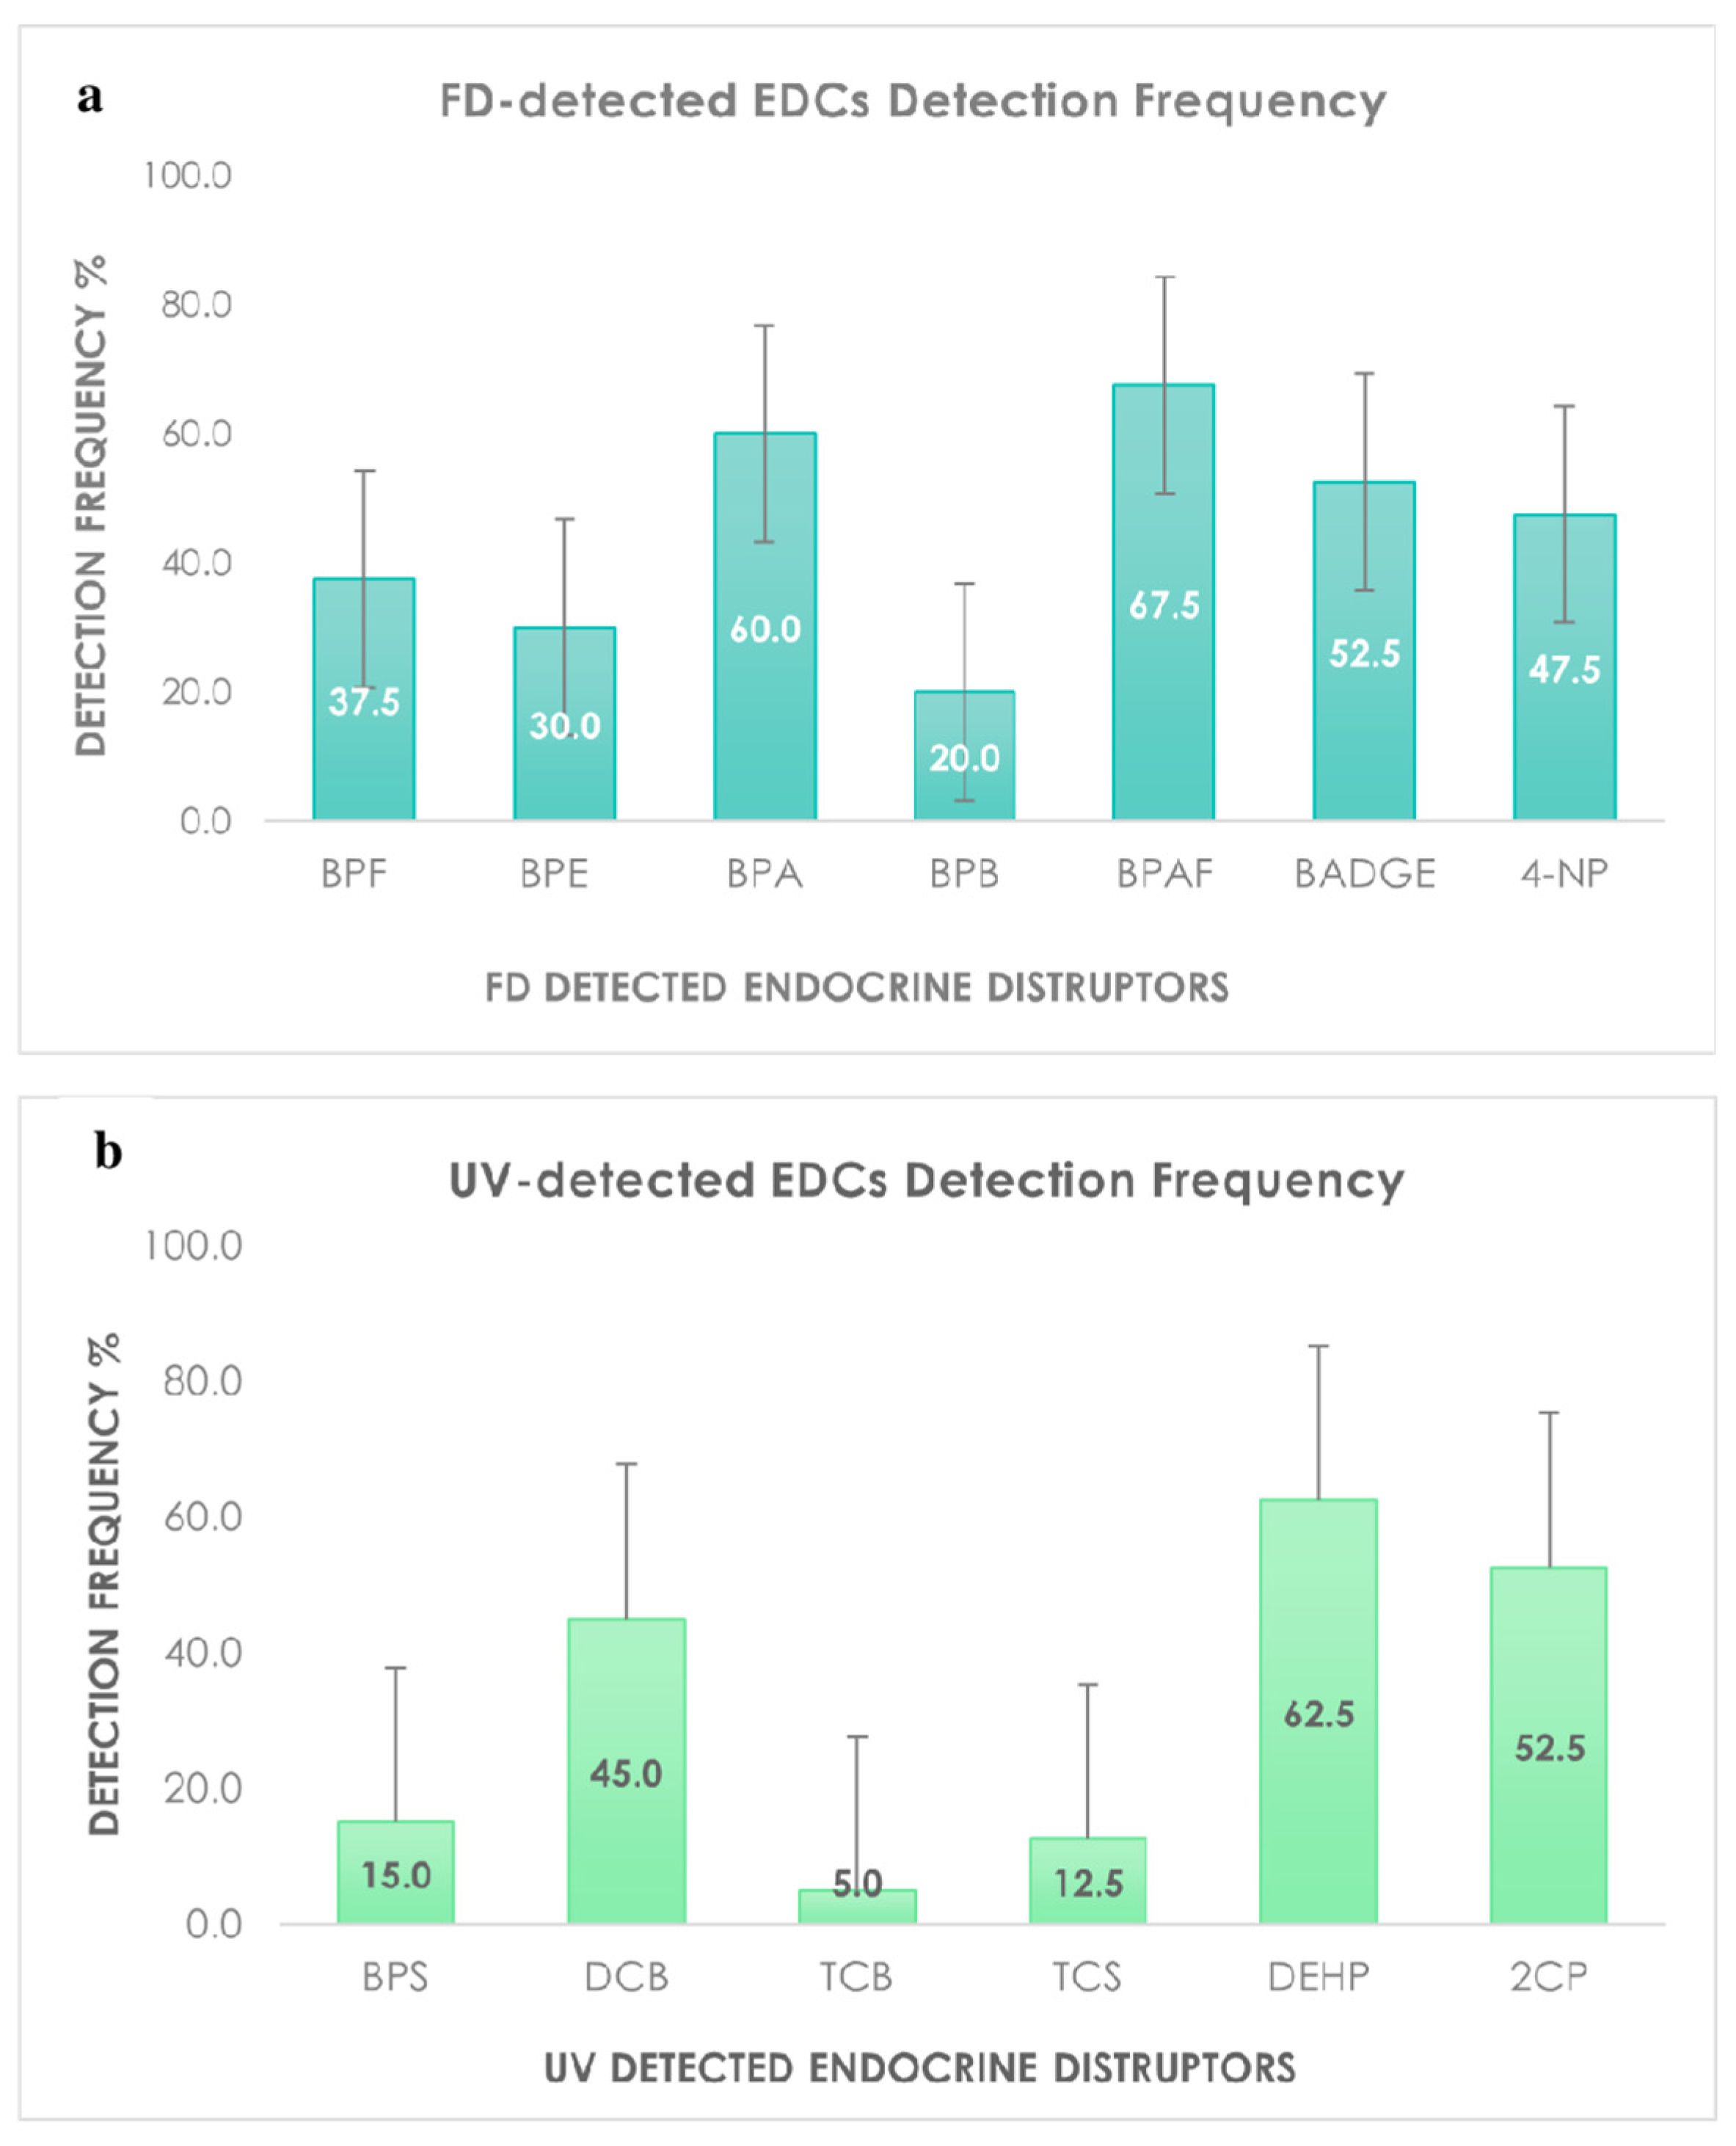
| Compound | Mean | Median | Range | DF% |
|---|---|---|---|---|
| FLD detected | ||||
| BPF | 55.26 | 23.78 | 6.24–327.42 | 37.5 |
| BPE | 130.01 | 45.56 | 2.92–779.53 | 30.0 |
| BPA | 458.57 | 46.17 | 4.34–1050.00 | 60.0 |
| BPB | 43.54 | 9.57 | 1.16–192.36 | 20.0 |
| BPAF | 387.21 | 165.17 | 1.02–1544.68 | 67.5 |
| BADGE | 353.71 | 71.91 | 17.7–2363.46 | 52.5 |
| 4-NP | 89.91 | 67.81 | 4.39–188.09 | 47.5 |
| UV detected | ||||
| 2-CP | NA | NA | NA | 5.0 |
| BPS | 30.74 | 8.31 | 0.24–51.45 | 15.0 |
| DCB | 61.84 | 13.77 | 1.49–233.4 | 45.0 |
| TCB | 64.07 | NA | 31.03–97.12 | 5.0 |
| TCS | 151.08 | 19.14 | 0.26–355.73 | 12.5 |
| DEHP | 46.19 | 21.59 | 2.10–383.48 | 62.5 |
| Element | Wavelength (nm) | Slit Width (nm) | LOD (mg/L) | LMA (mg/L) * | Calibration Curve | LR | R2 |
|---|---|---|---|---|---|---|---|
| Hg | 253.7 | 0.2 | 0.0001 | 0.0010 | y = 0.0005 x + 0.0001 | 0–20 | 0.9810 |
| Pb | 283.3 | 0.2 | 0.001 | 0.010 | y = 0.0315 x − 0.01454 | 0–20 | 0.9990 |
| Cr | 357.9 | 0.5 | 0.0001 | 0.050 | y = 0.0008 x + 0.0089 | 0–10 | 0.9972 |
| Co | 240.7 | 0.2 | 0.0001 | NA. | y = 0.0994 x + 0.0279 | 0–20 | 0.9609 |
| Ni | 232.0 | 0.2 | 0.0001 | 0.020 | y = 0.0754 x + 0.0143 | 0–20 | 0.9983 |
| Cd | 228.8 | 0.5 | 0.0003 | 0.003 | y = 0.0127 x + 0.00175 | 0–10 | 0.9983 |
| As | 193.7 | 0.2 | 0.001 | 0.010 | y = 0.0016 x + 0.0006 | 0–20 | 0.9797 |
| Sample | Hg | Pb | Cr | Co | Ni | Cd | As |
|---|---|---|---|---|---|---|---|
| Water 1 | <0.0001 | 0.000223 | 0.00056 | <0.0001 | 0.0005 | 0.00056 | 0.00081 |
| Water 2 | <0.0001 | 0.000223 | 0.00056 | <0.0001 | 0.0005 | 0.00056 | 0.00081 |
| Water 3 | <0.0001 | 0.000162 | 0.00015 | <0.0001 | 0.00016 | 0.00018 | 0.00018 |
| Water 4 | <0.0001 | 0.000555 | 0.00034 | <0.0001 | 0.00063 | 0.00084 | 0.00088 |
| Water 5 | <0.0001 | 0.000398 | 0.00022 | <0.0001 | 0.00068 | 0.00088 | 0.00238 |
| Water 6 | <0.0001 | 0.00022 | 0.00088 | <0.0001 | 0.00045 | 0.00059 | 0.00281 |
| Water 7 | <0.0001 | 0.000162 | 0.00015 | <0.0001 | 0.00016 | 0.00018 | 0.00018 |
| Water 8 | <0.0001 | 0.000162 | 0.00015 | <0.0001 | 0.00016 | 0.00018 | 0.00018 |
| Water 9 | <0.0001 | 0.000224 | 0.00056 | <0.0001 | 0.00022 | 0.00021 | 0.0033 |
| Water 10 | <0.0001 | 0.000433 | 0.00023 | <0.0001 | 0.00027 | 0.00034 | 0.00029 |
| Water 11 | <0.0001 | 0.000432 | 0.00022 | <0.0001 | 0.00033 | 0.00033 | 0.00344 |
| Water 12 | <0.0001 | 0.000162 | 0.00015 | <0.0001 | 0.00016 | 0.00018 | 0.00018 |
| Water 13 | <0.0001 | 0.000311 | 0.00039 | <0.0001 | 0.00044 | 0.00022 | 0.00026 |
| Water 14 | <0.0001 | 0.000331 | 0.00025 | <0.0001 | 0.00361 | 0.00079 | 0.00178 |
| Water 15 | <0.0001 | 0.000313 | 0.00061 | <0.0001 | 0.00264 | 0.00079 | 0.00105 |
| Water 16 | <0.0001 | 0.000422 | 0.00038 | <0.0001 | 0.00033 | 0.00085 | 0.00109 |
| Water 17 | <0.0001 | 0.00038 | 0.00024 | <0.0001 | 0.00048 | 0.00092 | 0.00077 |
| Water 18 | <0.0001 | 0.000231 | 0.00034 | <0.0001 | 0.00019 | 0.00018 | 0.00055 |
| Water 19 | <0.0001 | 0.000231 | 0.00034 | <0.0001 | 0.00019 | 0.00018 | 0.00055 |
| Water 20 | <0.0001 | 0.000299 | 0.00021 | <0.0001 | 0.00056 | 0.00036 | 0.00018 |
| Water 21 | <0.0001 | 0.000561 | 0.00027 | <0.0001 | 0.00244 | 0.00085 | 0.00126 |
| Water 22 | <0.0001 | 0.000259 | 0.00015 | <0.0001 | 0.00054 | 0.00081 | 0.00091 |
| Water 23 | <0.0001 | 0.00047 | 0.00044 | <0.0001 | 0.00066 | 0.00077 | 0.00158 |
| Water 24 | <0.0001 | 0.000404 | 0.00017 | <0.0001 | 0.00033 | 0.00085 | 0.00084 |
| Water 25 | <0.0001 | 0.000404 | 0.00017 | <0.0001 | 0.00033 | 0.00085 | 0.00084 |
| Water 26 | <0.0001 | 0.000404 | 0.00017 | <0.0001 | 0.00033 | 0.00085 | 0.00084 |
| Water 27 | <0.0001 | 0.000368 | 0.00023 | <0.0001 | 0.00079 | 0.00083 | 0.00109 |
| Water 28 | <0.0001 | 0.00047 | 0.00044 | <0.0001 | 0.00066 | 0.00077 | 0.00158 |
| Water 29 | <0.0001 | 0.000563 | 0.00055 | <0.0001 | 0.00019 | 0.00026 | 0.00054 |
| Water 30 | <0.0001 | 0.000579 | 0.00046 | <0.0001 | 0.00175 | 0.00088 | 0.00103 |
| Water 31 | <0.0001 | 0.000299 | 0.00021 | <0.0001 | 0.00056 | 0.00036 | 0.00018 |
| Water 32 | <0.0001 | 0.000311 | 0.00034 | <0.0001 | 0.00041 | 0.00045 | 0.0019 |
| Water 33 | <0.0001 | 0.000162 | 0.00015 | <0.0001 | 0.00016 | 0.00018 | 0.00018 |
| Water 34 | <0.0001 | 0.000579 | 0.00046 | <0.0001 | 0.00175 | 0.00088 | 0.00103 |
| Water 35 | <0.0001 | 0.000579 | 0.00046 | <0.0001 | 0.00175 | 0.00088 | 0.00103 |
| Water 36 | <0.0001 | 0.000579 | 0.00046 | <0.0001 | 0.00175 | 0.00088 | 0.00103 |
| Water 37 | <0.0001 | 0.000341 | 0.00067 | <0.0001 | 0.00016 | 0.00032 | 0.00034 |
| Water 38 | <0.0001 | 0.000162 | 0.00015 | <0.0001 | 0.00016 | 0.00018 | 0.00018 |
| Water 39 | <0.0001 | 0.000162 | 0.00025 | <0.0001 | 0.0002 | 0.00083 | 0.00077 |
| Water 40 | <0.0001 | 0.000456 | 0.00031 | <0.0001 | 0.00071 | 0.00067 | 0.00067 |
| Analyte | Adult Male | Adult Female | Young Male | Young Female |
|---|---|---|---|---|
| BPA | 0.003568 | 0.003147 | 0.003216 | 0.003319 |
| BPAF | 2.29 × 10⁻⁶ | 2.02 × 10⁻⁶ | 2.06 × 10⁻⁶ | 2.13 × 10⁻⁶ |
| BADGE | 6.71 × 10⁻⁵ | 5.91 × 10⁻⁵ | 6.04 × 10⁻⁵ | 6.24 × 10⁻⁵ |
| TCS | 2.94 × 10⁻⁶ | 2.59 × 10⁻⁶ | 2.65 × 10⁻⁶ | 2.73 × 10⁻⁶ |
Publisher’s Note: MDPI stays neutral with regard to jurisdictional claims in published maps and institutional affiliations. |
© 2022 by the authors. Licensee MDPI, Basel, Switzerland. This article is an open access article distributed under the terms and conditions of the Creative Commons Attribution (CC BY) license (https://creativecommons.org/licenses/by/4.0/).
Share and Cite
Russo, G.; Laneri, S.; Di Lorenzo, R.; Neri, I.; Dini, I.; Ciampaglia, R.; Grumetto, L. Monitoring of Pollutants Content in Bottled and Tap Drinking Water in Italy. Molecules 2022, 27, 3990. https://0-doi-org.brum.beds.ac.uk/10.3390/molecules27133990
Russo G, Laneri S, Di Lorenzo R, Neri I, Dini I, Ciampaglia R, Grumetto L. Monitoring of Pollutants Content in Bottled and Tap Drinking Water in Italy. Molecules. 2022; 27(13):3990. https://0-doi-org.brum.beds.ac.uk/10.3390/molecules27133990
Chicago/Turabian StyleRusso, Giacomo, Sonia Laneri, Ritamaria Di Lorenzo, Ilaria Neri, Irene Dini, Roberto Ciampaglia, and Lucia Grumetto. 2022. "Monitoring of Pollutants Content in Bottled and Tap Drinking Water in Italy" Molecules 27, no. 13: 3990. https://0-doi-org.brum.beds.ac.uk/10.3390/molecules27133990