Article

Difficulties in the Modeling of E. coli Spreading from Various Sources in a Coastal Marine Area

1
Department of Environmental Toxicology, Faculty of Health Sciences, Medical University of Gdańsk, Dębowa Str. 23A, 80-204 Gdańsk, Poland
2
Institute of Oceanography, University of Gdańsk, Av. Marszałka Piłsudskiego 46, 81-378 Gdynia, Poland
*
Author to whom correspondence should be addressed.
Submission received: 9 May 2022 / Revised: 30 June 2022 / Accepted: 1 July 2022 / Published: 7 July 2022

Abstract

:
Coastal and transitional waters are often used as bathing waters. In many regions, such activities play an important economic role. According to the European Union Bathing Water Directive (2006/7/EC) (BWD) the concentration of Escherichia coli in bathing water exceeding 500 CFU·100 mL−1 poses a high risk for bathers’ health. In order to safeguard public health, microbiological environmental monitoring is carried out, which has recently been supported or replaced by mathematical models detailing the spread of sanitary contamination. This study focuses on the problems and limitations that can be encountered in the process of constructing a mathematical model describing the spread of biological contamination by E. coli bacteria in coastal seawater. This and other studies point to the following problems occurring during the process of building and validating a model: the lack of data on loads of sanitary contamination (often connected with multiple sources of biological contamination inflow) makes the model more complex; E. coli concentrations higher than 250 CFU·100 mL−1 (low hazard for health) are observed very rarely, and are associated with great uncertainty; the impossibility of predicting the time and intensity of precipitation as well as stronger winds and rougher sea, which may be a significant source of E. coli. However, there is universal agreement that such models will be useful in managing bathing water quality and protecting public health, especially during big failures of the wastewater network.

Graphical Abstract

1. Introduction

The process of environmental pollution, which has been occurring for hundreds of years, has clearly accelerated in the last century, and it has taken on dimensions unprecedented in the history of mankind, both in terms of quantity and variety of physical, chemical, and microbiological pollutants emitted into the environment [1]. This has resulted in the degradation of the environment, especially the aquatic one and has increased human health problems leading to chronic diseases or even premature deaths [2].
For over 50 years, the predominant focus has been on the use of specific technical solutions for discharging treated wastewater from wastewater treatment plants (WWTPs) into the waterways as an advantageous solution to effectively reduce the number of microorganisms present in the wastewater, which for various reasons (including WWTPs function failures) are not eliminated in the treatment process [3]. In general, treated wastewater is discharged several kilometers into the sea, where it is mixed with seawater through diffusers placed on the seabed. However, in this process, freshwater is pushed to the surface of the sea, forming so-called lenses. Could this strategy pose a risk to bathers and beach-goers in the vicinity of diffusers discharging wastewater into the sea? Factors such as hydrological conditions or wind direction can cause freshwater lenses to return towards land (beaches), transporting microorganisms, including pathogens that may worsen bathing water quality. Moreover, in the case of WWTP failure, significant quantities of contaminants and microorganisms, including fecal pathogens such as Enteropathogenic Escherichia coli and Salmonella spp., may be introduced into the sea with the wastewater discharge. Is there, therefore, a risk that people bathing in the sea could be infected with these bacteria? One of the health problems that may occur due to the increased fecal pathogen presence in the seawater is urinary tract infection (UTI). In 70–95% of UTI cases, the main cause of this illness is E. coli infection, less frequently a fungal or viral contagion. Although UTI is associated with a lack of personal hygiene and translocation of the fecal flora from the intestine to the bladder or the urethra, where its epithelium becomes colonized and infected [4], water reservoirs are also an important source of UTI-causing bacterial strains [5]. Therefore, sanitary services provide microbiological control of bathing sites, so people are generally aware of the presence of UTI-causing bacteria in the water. Nevertheless, these actions are limited in time and localized [6,7]. There are several groups of people that should monitor sanitary service announcements due to their increased risk of UTI, i.e., infants and children, elderly people, pregnant women, diabetics, patients suffering from multiple sclerosis or spinal cord injuries as well as individuals with acquired immunodeficiency syndrome or urological diseases [5,8,9,10,11]. Both UTI and urosepsis are treatable conditions, but delayed management can lead to severe consequences, such as kidney failure, septic shock, and death [12]. Drug-resistant E. coli are also detected in bathing waters [13]. Infection with such bacteria during sea bathing raises additional problems related to the treatment process.
Water bodies, including discharging areas, are important feeding and spawning zones for marine, anadromous, and freshwater ichthyofauna species. The abundance of individual species is variable and dependent on weather conditions. Unfortunately, the consumption of fish caught from the treated wastewater discharge areas can be considered an additional threat since enteropathogenic E. coli strains have been isolated from both farmed and free-living fish [14]. These microorganisms infect fish through their digestive tract, leading to inflammation of the gastric and intestinal mucosa. An increased concentration of E. coli in anthropopressed waters from treated wastewater can result in a rise in the number of infections in free-living fish, which can cause an epidemiological threat to humans who consume them. Enteropathogenic E. coli may cause food poisoning, especially in children under two years old [15].
According to the Bathing Water Directive (2006/7/EC) (BWD) [16], E. coli concentration in bathing water exceeding 500 CFU·100 mL−1 poses a high risk for bathers’ health. Concentration of E. coli > 250 and < 500 CFU·100 mL−1 poses medium hazard and concentration of E. coli < 250 CFU·100 mL−1 poses a low hazard.
In accordance with European and Polish national legal requirements [16], bathing water quality must be monitored. Reports published annually by the European Environment Agency (EEA) indicate that water quality in European bathing waters is high [17]; however, the situation in Poland is not so good. Up to 2010, coastal and transitional waters were often classified as posing a high risk for bathers’ health (E. coli concentration in bathing water exceeding 500 CFU·100 mL−1).
Microbiological monitoring of water quality is an essential tool for water quality assessment and health risk management. However, in its present form, it is time-consuming (sampling, inoculation, incubation, result readings), costly, and the results are obtained with a significant delay (more than 48 h). Unfortunately, these aspects are causing complications in managing bathing sites and maintaining the sanitary safety of bathers [18].
A practical model to forecast the cases of exceeding the norms for bathing waters on the basis of monitoring the data was presented by Džal et al. 2021 [19]. Authors underline that “the main problem with this modeling approach is to record a sufficient number of cases where bathing water quality is poor (exceedances) so that the data are more balanced”.
Another approach is the mathematical modeling of the spread of E. coli in the aquatic environment. The use of mathematical models describing the spread of pollutants in the environment has assisted environmental management for years. Modeling is a mathematical description of a phenomenon along with the determination of the spatial distribution of pollutant concentrations in the studied area (on a small scale, e.g., river section or pollutant discharge area, or on a global scale—the continent or the whole globe). The preparation of the model is a very complex and difficult issue, including both knowledge from the area of basic sciences (description of phenomena such as adsorption, desorption, diffusion, as well as information on chemical properties of compounds, survival of microorganisms in the environment, etc.) and interdisciplinary areas (knowledge of movement of air masses in the atmosphere, movement of water in rivers or sea basins, the condition of soil/sediment). The reliability of the obtained results depends mainly on the accuracy of the model used, its adaptation to the expected results, consideration of spatial and temporal dimensionality, and the amount and quality of the input data used for modeling. Models for the spread of microorganisms in different waterways (rivers, lakes, seas, and oceans), which have been used over the last 10 years, are presented in supplementary material, Section S1, Table S1 [20,21,22,23,24,25,26,27,28,29,30,31,32,33,34,35].
Currently, there is no standardized, universally applicable microbial pollution distribution model for marine coastal waters. An overview of the different models used for this purpose can be found in the work of Weiskerger et al. (2020) [36]; however, most of them were applied to freshwater (rivers and lakes), and only a few to estuaries and coastal waters. Therefore, the aims of this publication are:
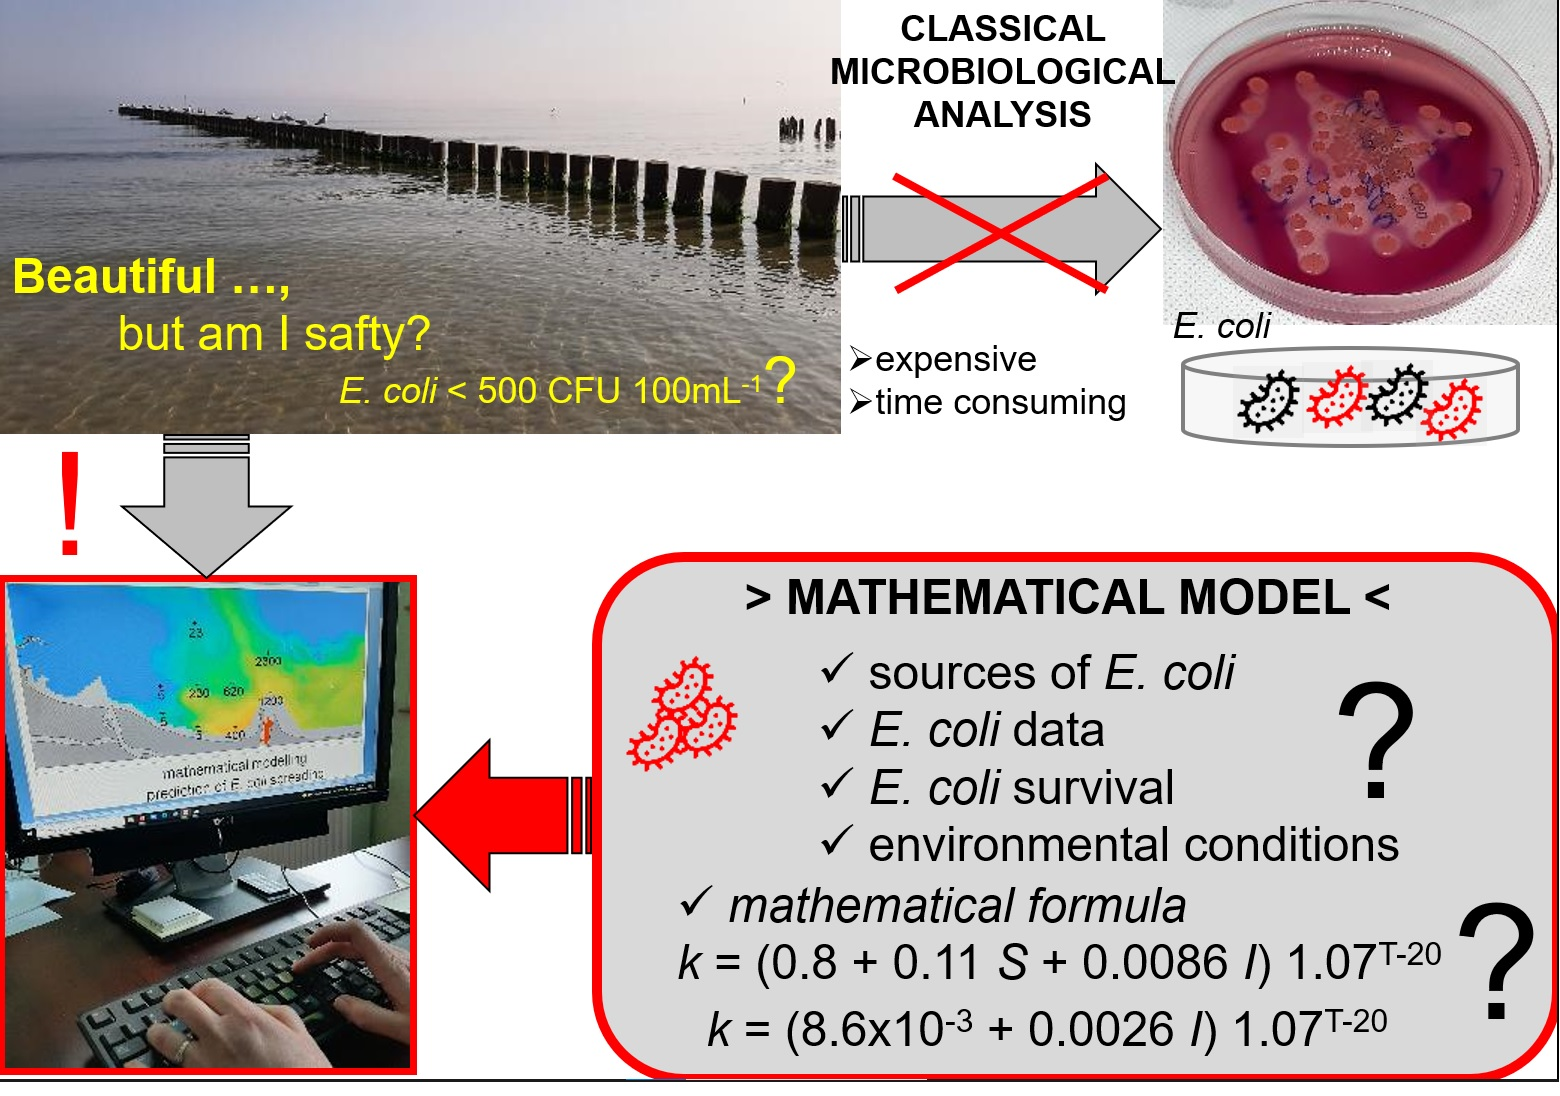
  • To present results of the application of the PM3Dhydrodynamic model with the use of the microbiological module to predict the level of E. coli concentrations around the point of discharge of treated wastewater into the waters of the Gulf of Gdańsk, Poland;
  • To describe problems/barriers/obstacles encountered by researchers who undertake the development of a mathematical model of pathogen spread in the marine environment under conditions of discharging treated wastewater into brackish/saline water on the example of the Gulf of Gdańsk, Poland.

2. Results

E. coli is widely used as a fecal indicator organism. Their spread and survival in the environment depend on many factors such as temperature, solar insolation, hydrologic conditions, water chemistry, nutrient conditions, suspended and settled solids, and land-use practices [37].
The concentration of E. coli is important from a human health perspective. The Bathing Water Directive (2006/7/EC) (BWD) underlines that E. coli concentration in bathing water exceeding 500 CFU·100 mL−1 poses a high risk for bathers’ health.
Nag et al. (2021) indicate that a single exposure exceeding 500 CFU·100 mL−1 has a 10% chance of resulting in a gastrointestinal illness [38].
Given the widespread occurrence of fecal water contamination, with more information also coming from mathematical models, the implementation of effective management strategies for health should be possible and widely applied.
The exemplary spatial distribution of E. coli calculated in the study area using four proposed versions of the model (Figure 1) shows the high influence of the chosen parametrization method on bacterial survival. The different versions used formulas describing E. coli survival rates previously used in different models (see Table 3). The comparison of the simulation results to the distribution of E. coli concentrations observed at the end of May 2003 points to the survival rate in the v2 version as being far too low, while in the v3 version too high. The final selection of the model version, i.e., the method of parameterization of bacterial survival in the model under development, was based on comparing the values of the modeled concentrations with the observed ones and a visual assessment of the consistency of spatial distributions made by several researchers.
Finally, the v4 [39] version of the model was selected as the most realistic description of the survival of E. coli bacteria.

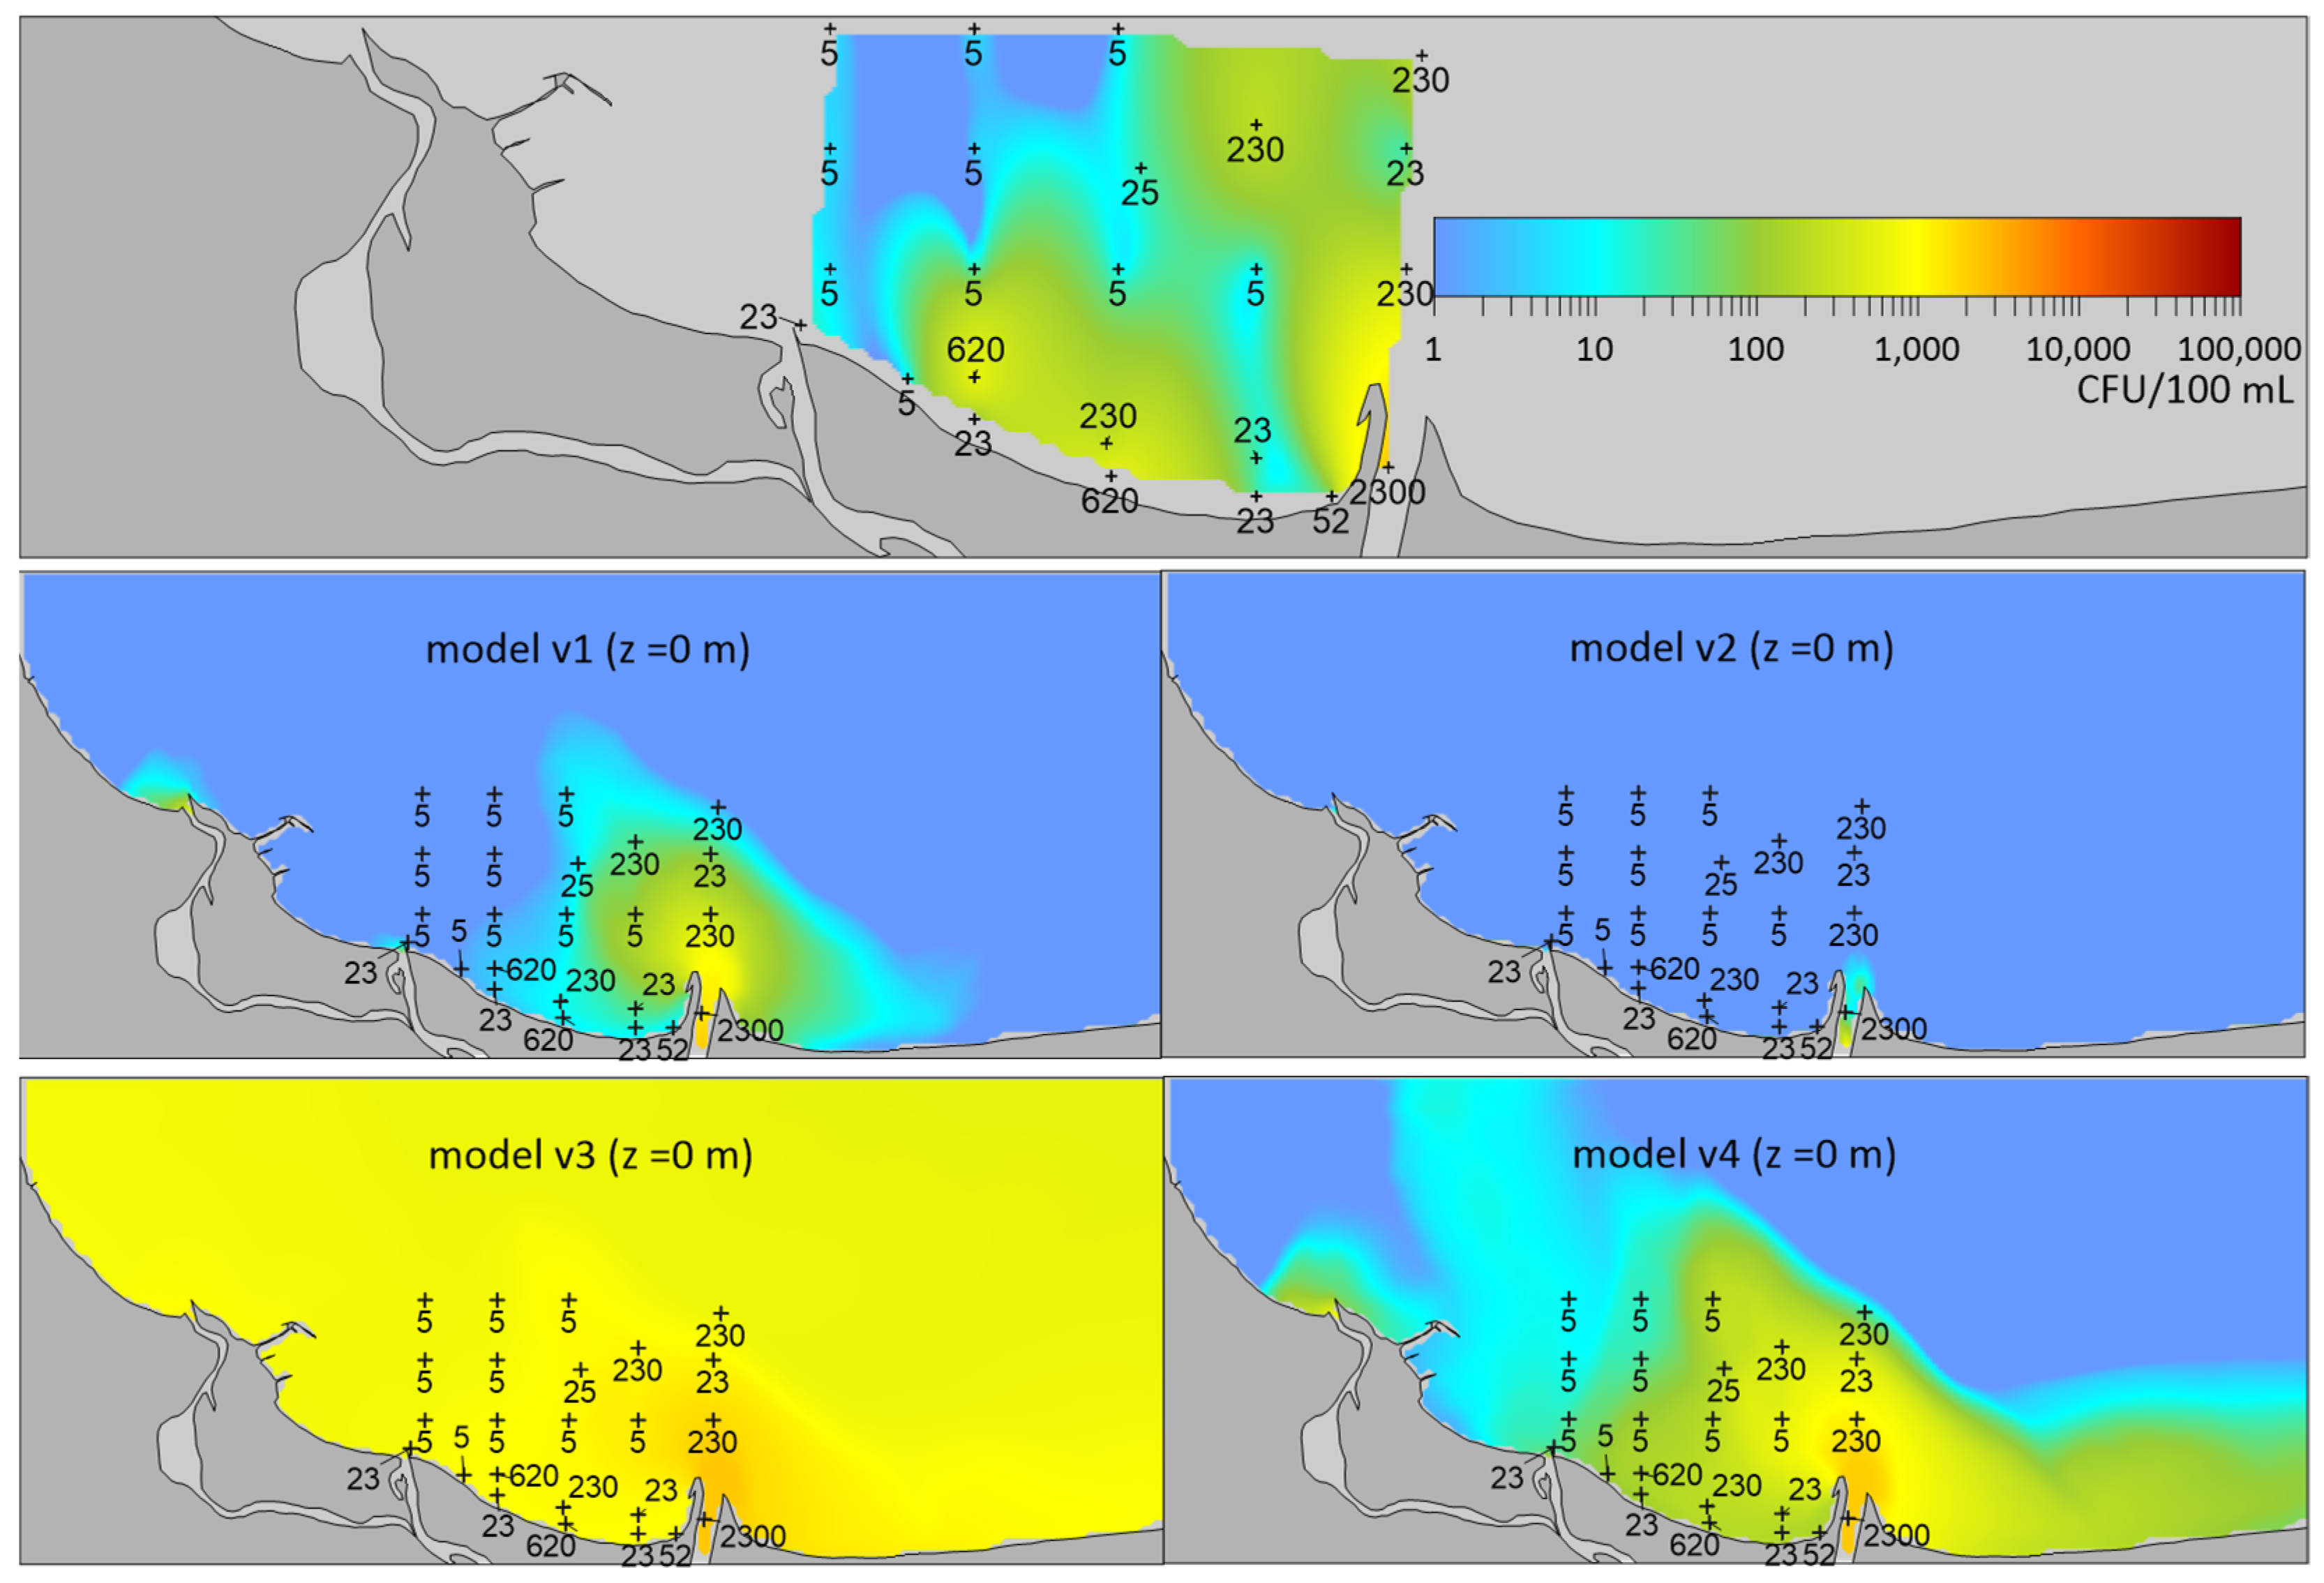
2.1. Validation of the Model

Model validation for version v4 was performed by comparing model results with measurements of E. coli concentrations carried out in the Gulf of Gdansk from November 2002 to October 2003. Statistical accuracy characteristics such as bias, RMSE (root mean square error), and the correlation coefficient (r) were calculated for the decimal logarithm values of the measured and modeled concentrations at individual stations. (Table 1). The compatibility between model results and observations varied considerably on individual days. For example, the model underestimated the concentrations in November and December 2002 (BIAS = −1.94) while at the same time reporting the lowest statistical errors (RMSE). The correlation coefficient was very high in November (r = 0.96), while in December, it was negative (r = −0.46).

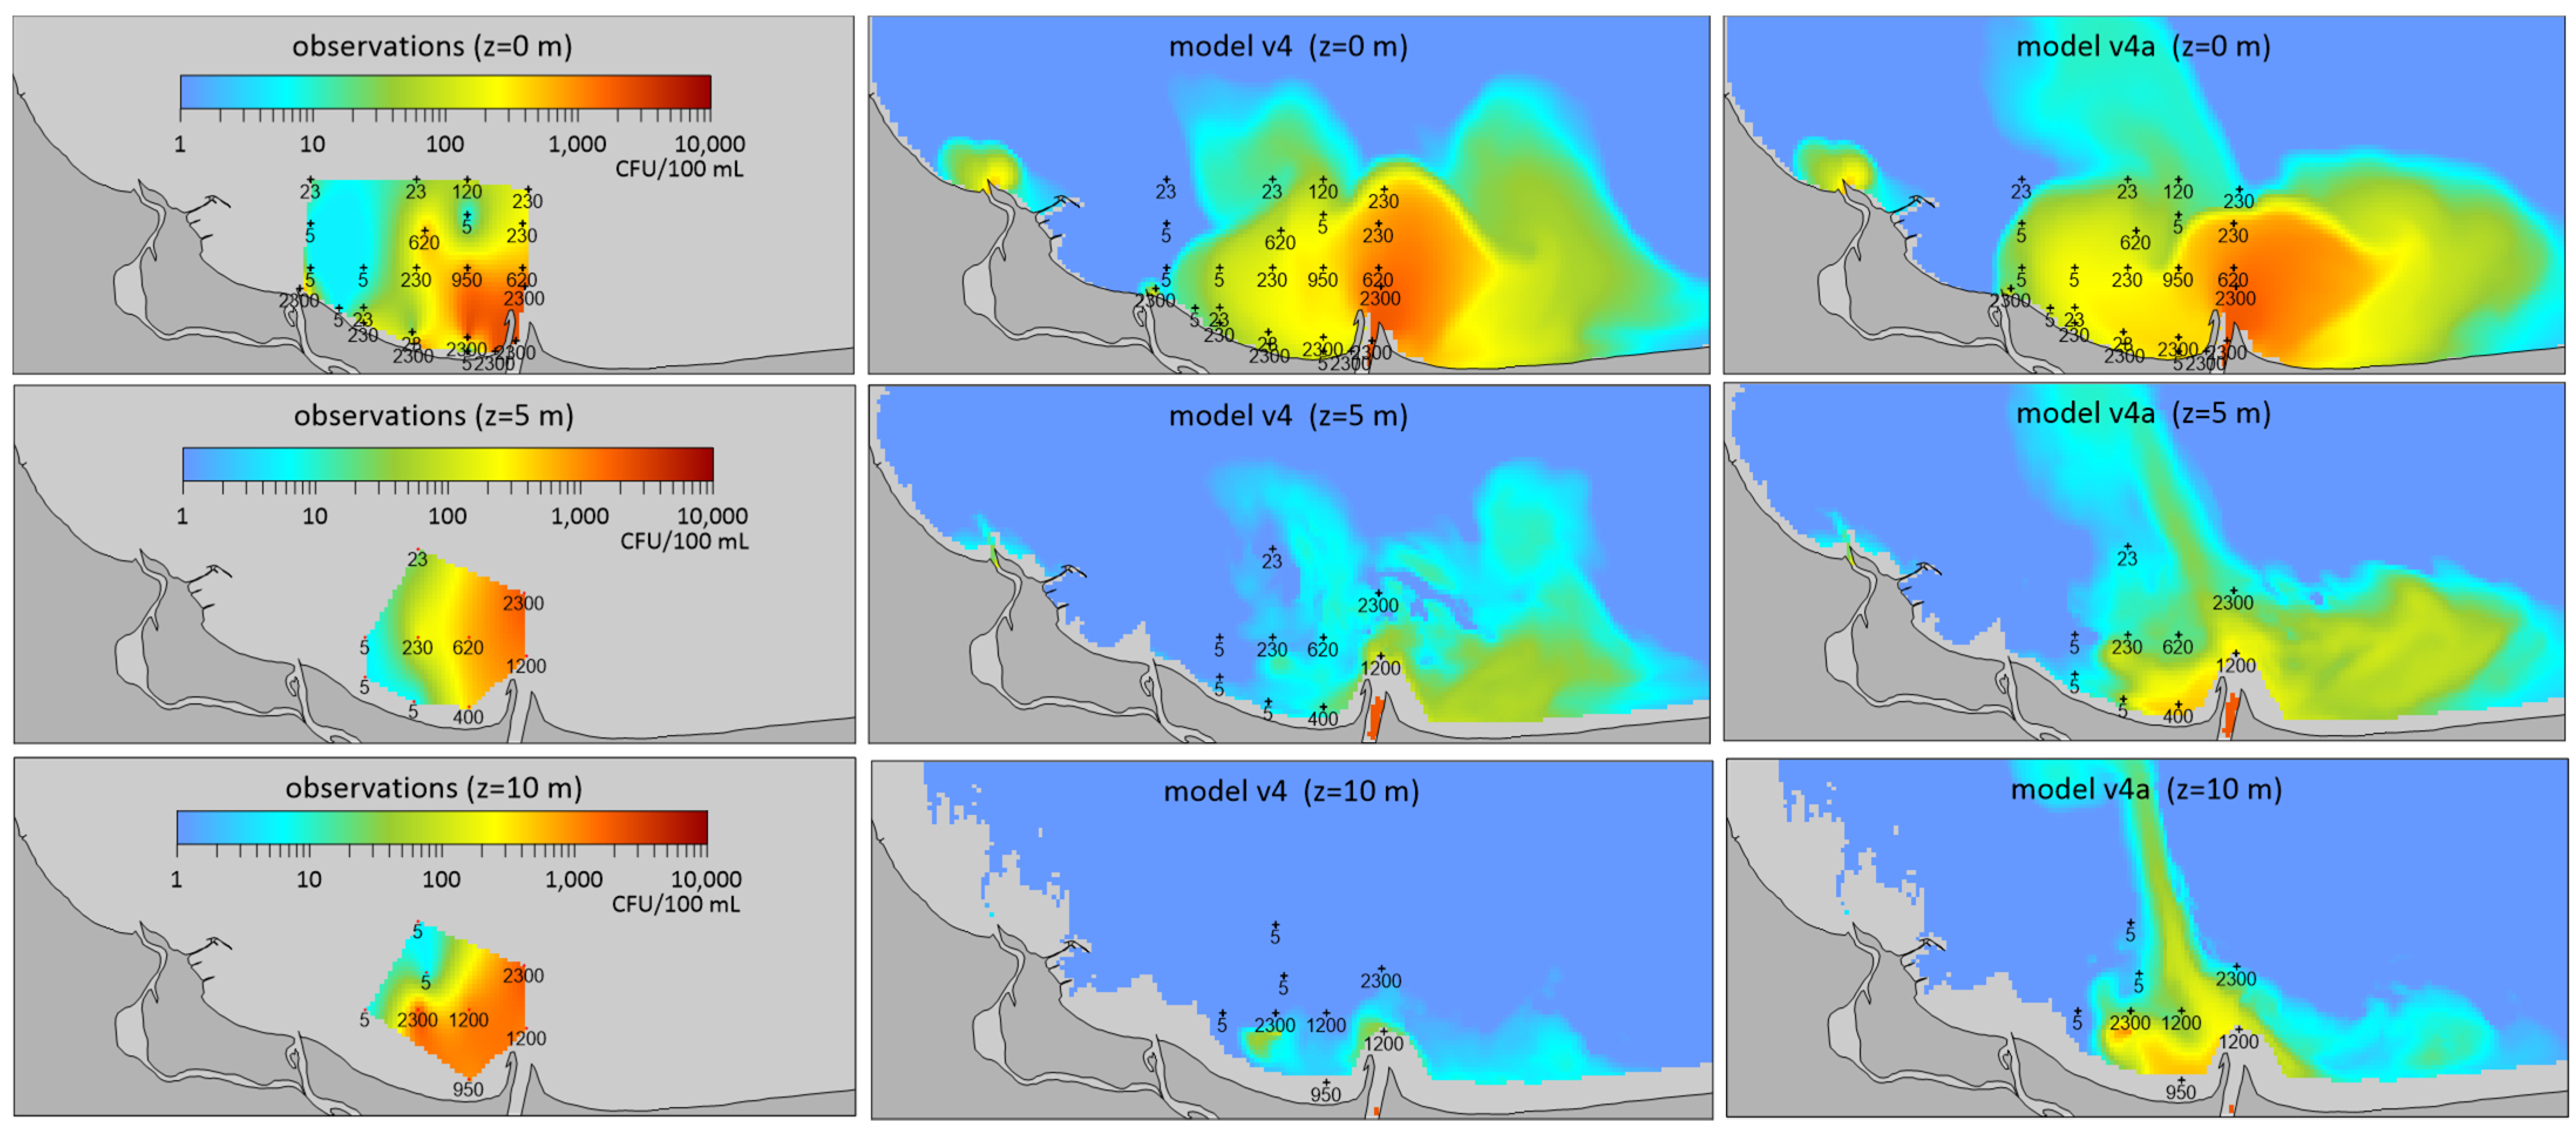
2.2. A Case Study Dated 12 August 2003—Spatial Distribution at Different Depths

During a series of tests on E. coli concentrations carried out at the outlet of the wastewater collector from the Gdańsk Wschód WWTP (Waste Water Treatment Plant), one case, dated 12 August 2003, differed significantly from the others. In particular, this applied to E. coli concentrations at depths of 5 and 10 m. In contrast to the measurements made on the other dates, the content of fecal bacteria was very high (up to 2300 CFU·100 mL−1) at that time (Figure 2).
The standard version of model calculations (v4) presented high concentrations in the foreland of the Vistula mouth only in the surface layer. However, measurements showed high concentrations of E. coli (up to 2300 CFU·100 mL−1) also at depths of 5 and 10 m. As fresh water in the Vistula spreads in a thin surface layer, it cannot be the source of high bacteria concentrations at these depths. The probable cause of such bacteria content may be the inflow of water from the WWTP via the collector. Measurements of E. coli concentrations performed on 12 August 2003 in wastewater discharged from the collector showed a concentration of 23,000 CFU·100 mL−1, and this value was used for model calculations. However, regarding these concentrations, only slightly higher values in the v4 model results were observed in the close vicinity of the collector outlet. It was hypothesized that bacterial content was significantly higher on the days before the study and assumed that in the period from 8 to 11 August, the concentrations were around 1,000,000 CFU·100 mL−1. With these assumptions, the results of the model, which were marked as the v4a version (Figure 2), indicated higher E. coli concentrations in the area of the collector and the Vistula mouth than in the reference version (v4), although simulated concentrations were still lower than the measured values. Model simulations showed that water with high concentrations of bacteria entering through the collector spread at a depth of 5–10 m towards the mouth of the Vistula and was then discharged towards the open waters of the Gulf of Gdańnsk. Such a distribution is consistent with observations, which confirms that the cause of high bacteria concentrations in subsurface waters could have been the inflow of large loads of sanitary pollutants on the days preceding the study.

3. Discussion

This research focuses on the problems and limitations that can be encountered in the process of preparing a mathematical model of the spread of biological contamination by E. coli bacteria in coastal seawater which can be an appealing alternative to expensive and time-consuming monitoring.
In our study, the main difficulty in creating a model of the spread of sanitary contamination, which was revealed by the analysis carried out in the study area, is the lack of the following data:
  • E. coli concentration in river tributaries (including the largest one, the Vistula River);
  • Results of systematic monitoring of E. coli concentration provided in treated wastewater discharged into the Gdańsk Bay.
As these concentrations can vary by an order of magnitude over very short periods of time, individual measurements may not be represented in the model validation database, and their absence can cause significant miscalculations in the model results. Multiplicity and variety in sources of inflow of the biological contamination additionally make the model more complex.
A mathematical model similar to ours was used by Locatelli et al. [20], who modeled the distribution of E. coli in coastal waters. In that study, bacteria entered the water with runoff from storm sewers. A constant concentration of the bacteria in the storm sewer (1 × 106 CFU·100 mL−1) was assumed, many times higher than the concentration in coastal waters. The authors obtained better validation results (the correlation coefficient was 0.83 and RMSE: 0.66) compared to those obtained in the model presented in this paper (Table 3). However, it should be noted that modeling the inflow of contaminants with very high concentrations from a single source is much easier compared to modeling the inflow from multiple points and diffuse sources with relatively low concentrations. In the study conducted by Locatelli et al., modeling was carried out for only one point (Pont del Petroli) and only for the case of intense rainfall, which resulted in the inflow of large loads of E. coli through storm sewers [20]. A distinct source with very high loads of E. coli provides a more convenient case for modeling.
Another problem is the lack of data on loads of sanitary contamination from area sources, e.g., precipitation and feces of seagulls and other birds, as well as marine animals living in the study area (e.g., seals). Locatelli et al. indicated the presence of these bacteria in atmospheric air. Thus, heavy rainfall is expected to contribute significant loads of E. coli to the discharge area of the Gdańsk Wschód WWTP [20]. One of the problems inherent in prognostic models is the unpredictability of precipitation, i.e., the lack of knowledge about the time of occurrence of precipitation and its amount. In addition, stronger winds and rougher seas lead to shorter periods of seawater contamination [20,40], Locatelli et al. concluded that: “a great uncertainty is associated with the evaluated pollutant hazard, mainly due to the variability of water quality variables, rainfall patterns and seawater currents”.
The problems mentioned above indicate that the analysis of pathogen spread in seawater still implies a high degree of unpredictability, especially when several sources of contamination are considered in the model.
The monitoring of the bathing waters shows a systematic decline in the level of E. coli concentration in the area of the study (Figure 3). Currently, E. coli concentrations higher than 250 CFU·100 mL−1 (low hazard for health) are observed very rarely. E. coli concentrations higher than 500 CFU·100 mL−1, with a high risk for bathers’ health, are found in case of accidents.
Nevertheless, efforts to develop such a model should be maintained in order to obtain a valuable tool for studying the spread of contaminants and identifying the most affected areas. The necessity of preparation and improvement of the mathematical model of the spread of microbiological contaminants (in particular E. coli) is justified by the occurrence of major accidents affecting the quality of the Baltic Sea water over the period of the last four years (Table 2).
In summer, the coastal beaches are used intensively for tourism (sunbathing, walking, and bathing). However, in the other seasons, the beaches are also frequently visited (weekly winter swimming, walking). Incidental discharges of untreated wastewater have forced the Sanitary Inspectorate to carry out intensive microbiological testing. Detection of high levels of pathogen contamination can lead to beach closures, with the resulting economic and public image losses for the region (especially in the summer season).

4. Materials and Methods

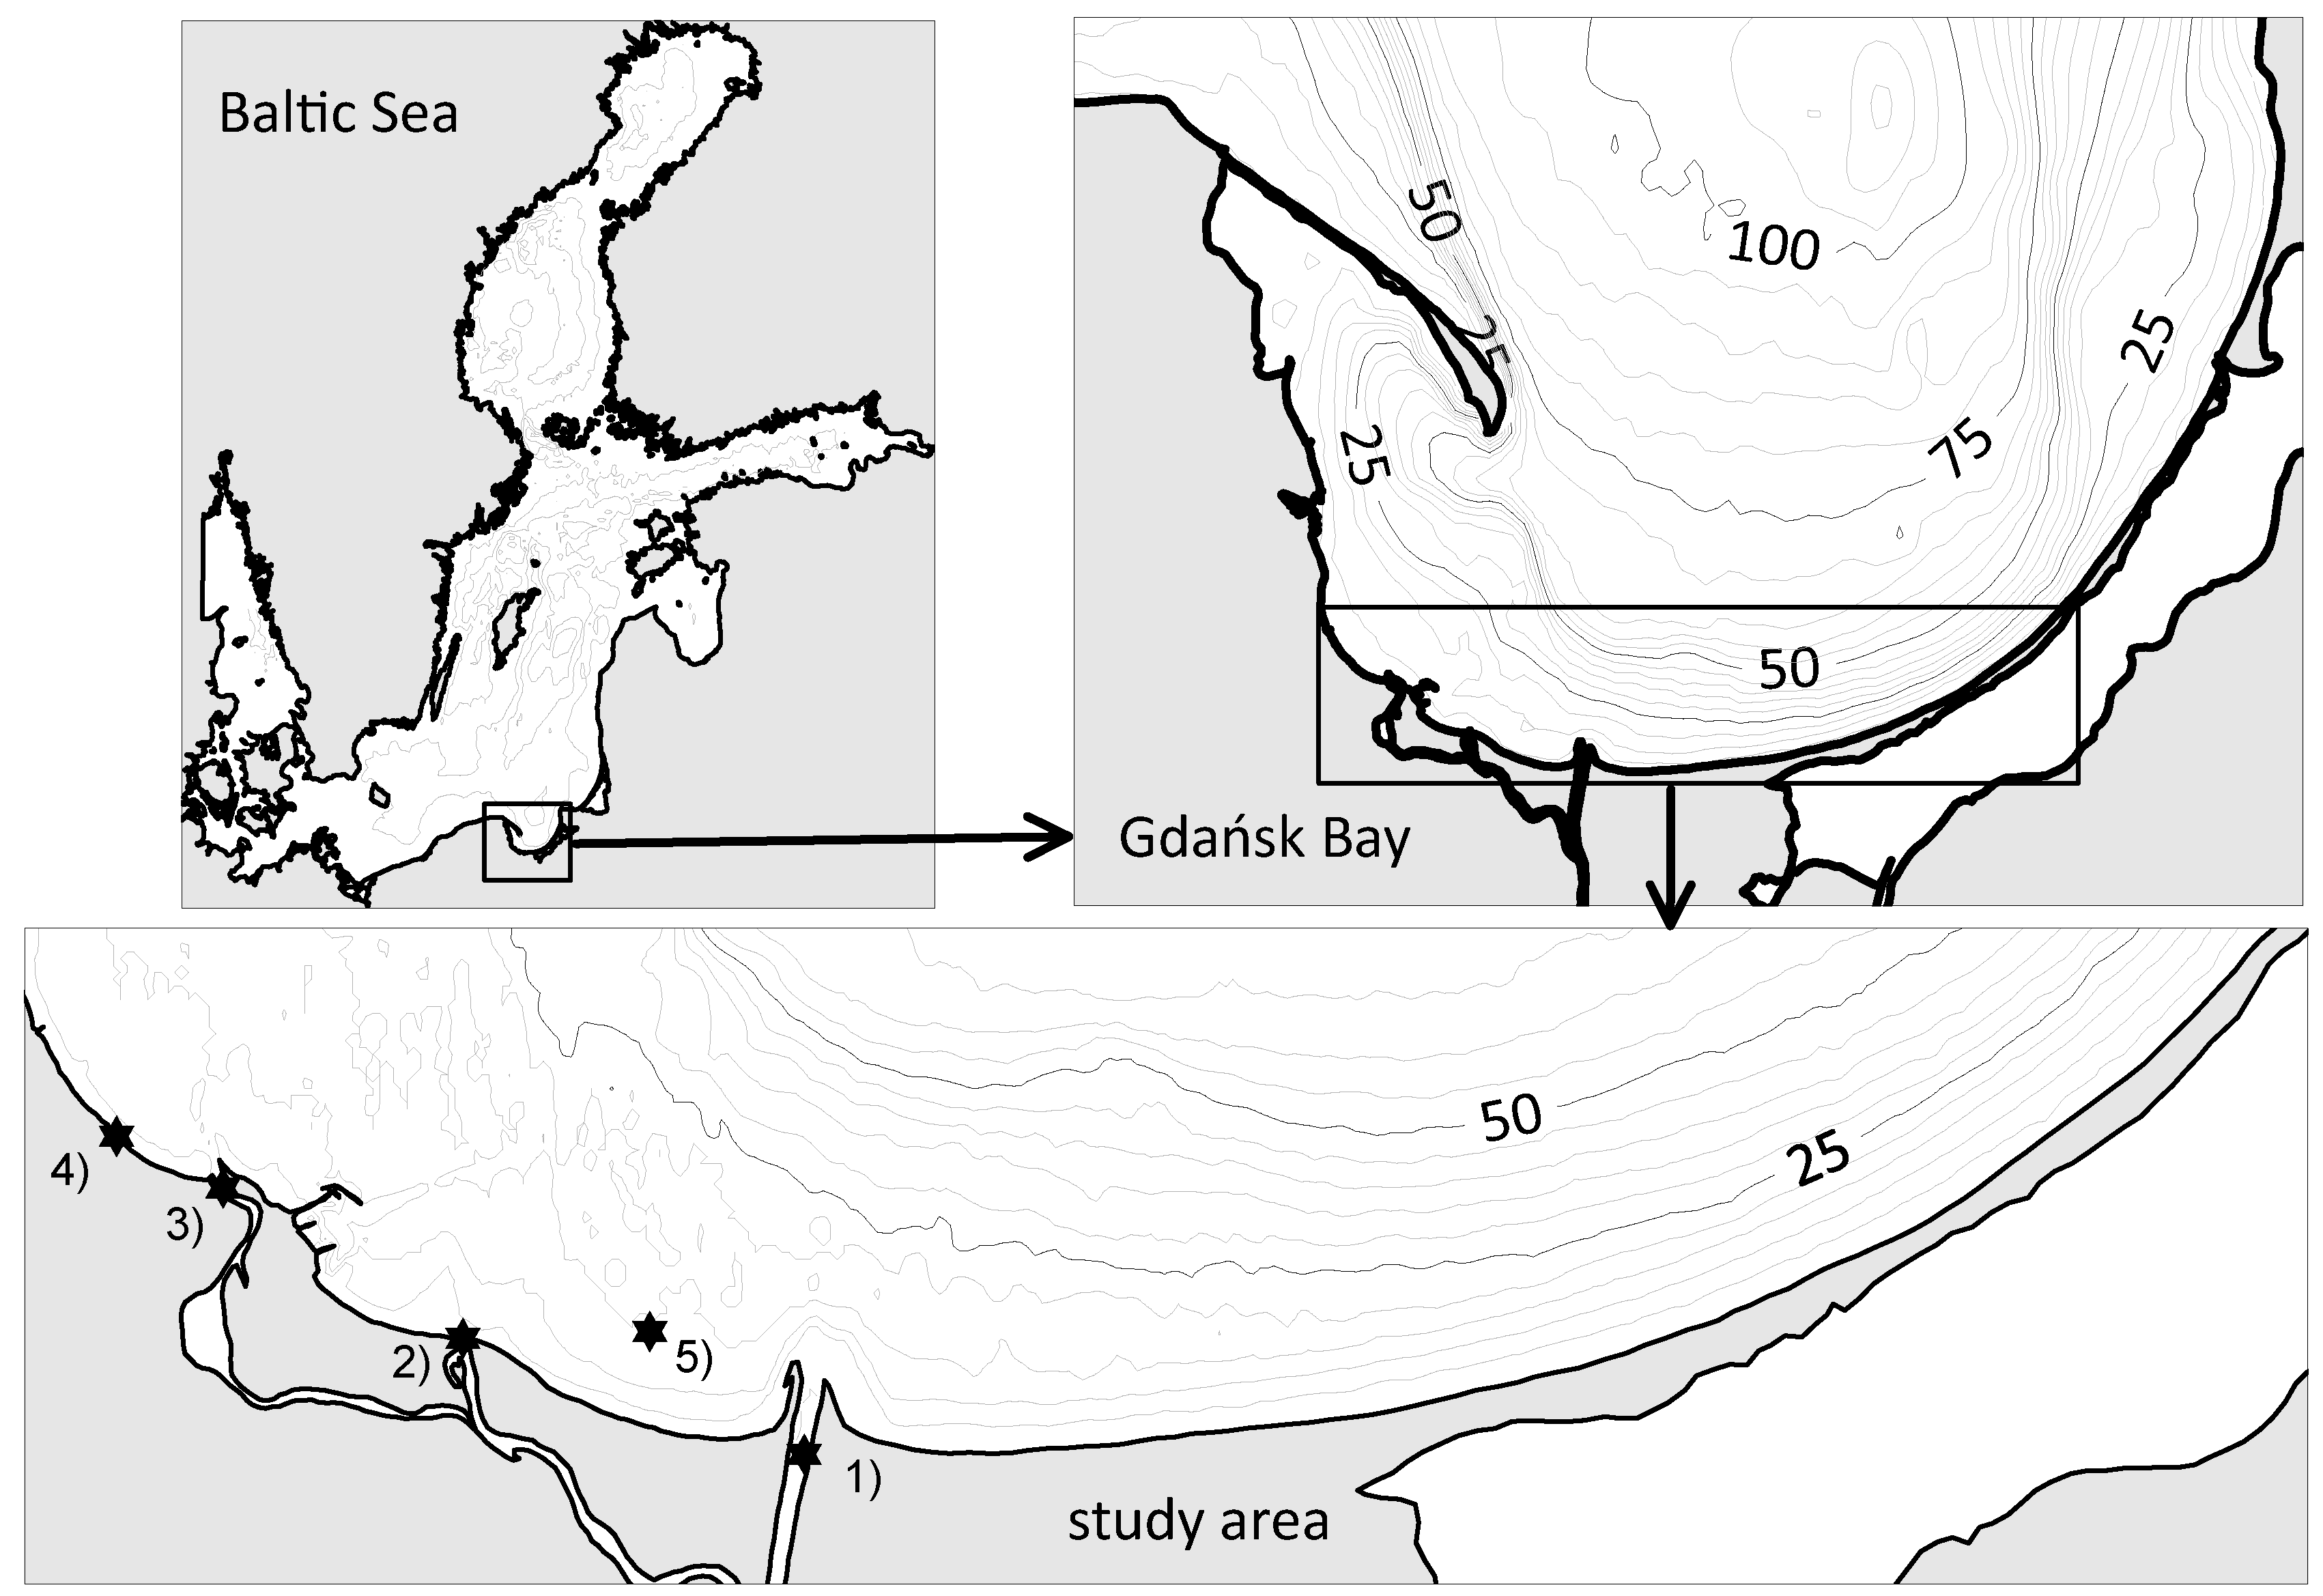
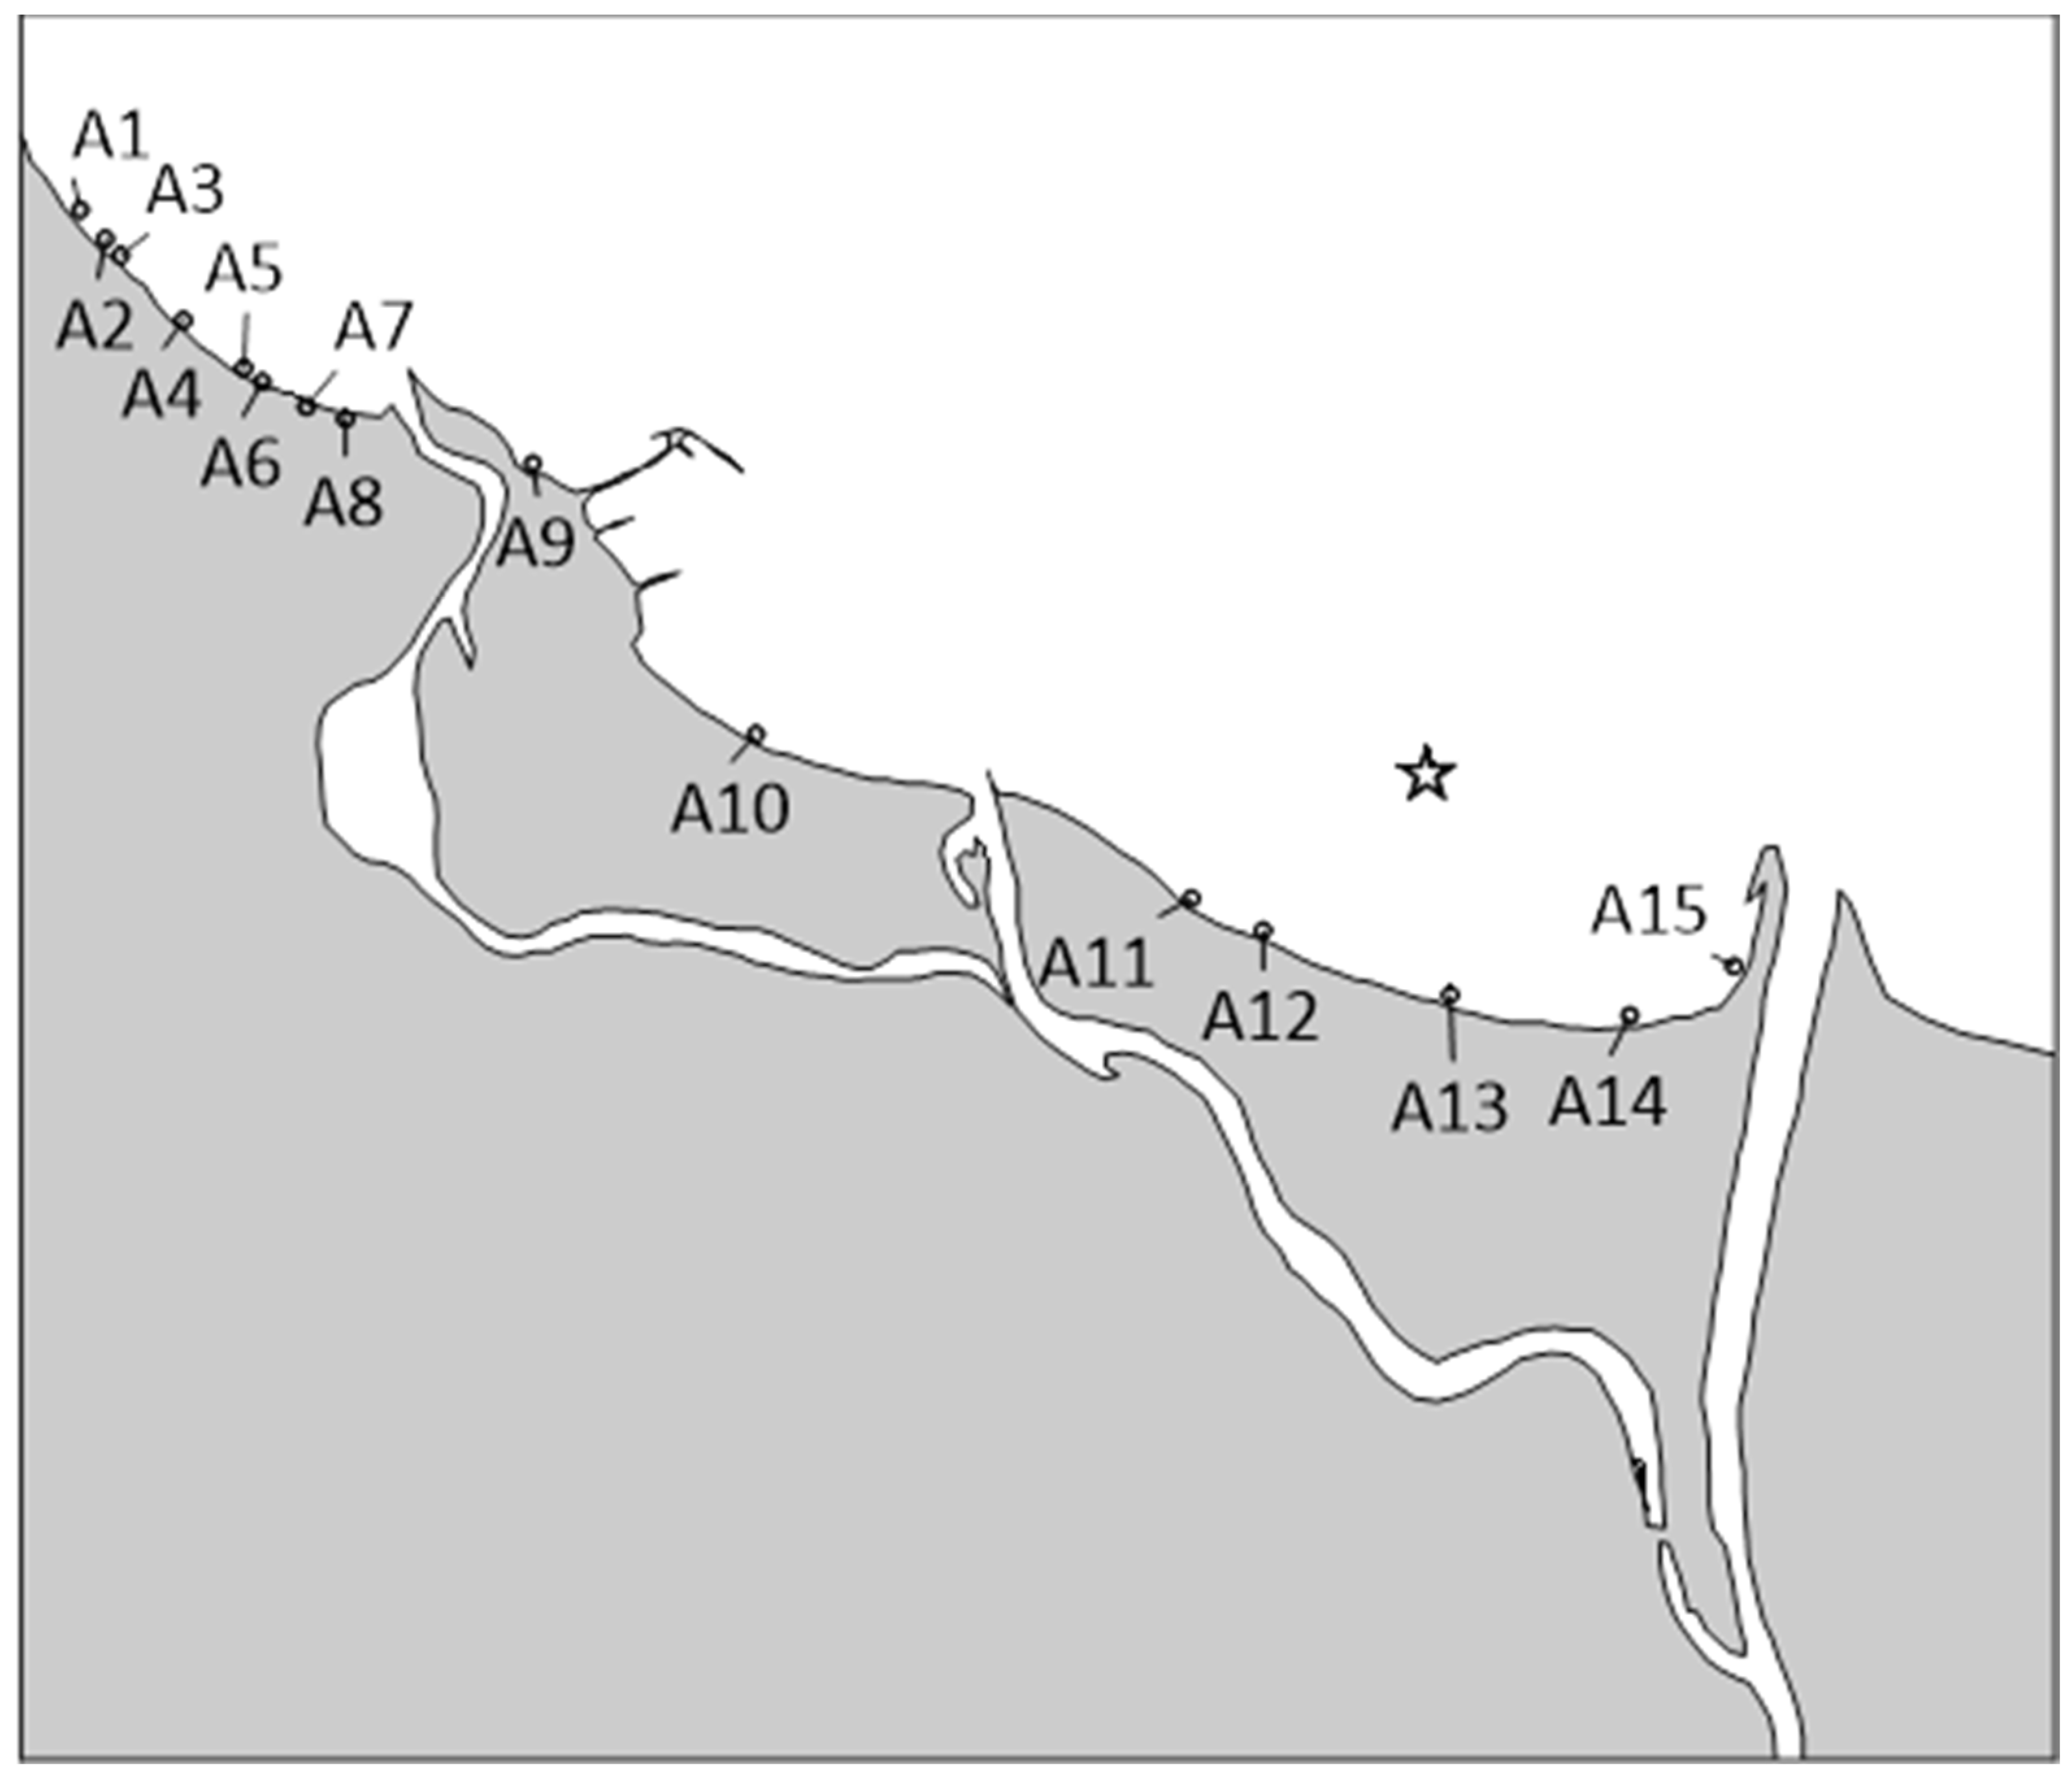
4.1. Description of the Study Area

The study area is situated in the southern part of the Gdańsk Bay, which forms part of the Gdańsk Basin located in the southern part of the Baltic Proper (Figure 3). The area is located between the mouth of the Vistula and the Wisła Śmiała and can be regarded as an estuary as its environmental conditions are influenced by both the brackish water of the Bay of Gdańsk (approx. 7 PSU) and the freshwater of the river. The water area affected by the Vistula is characterized by low salinity and is limited on the seaward side by a hydrological front, which restricts the spread of both the freshwater of the Vistula and the pollutants carried in this water [41]. The river’s fresh water, due to its lower density, flows on the surface over saline water, creating a clear vertical stratification of the water. The high variability of wind conditions results in a lack of constant surface currents in the Baltic Sea [42]. On short timescales, flows, especially surface ones, are determined by wind conditions. At longer scales, cyclonic systems of significant stability are observed. Their pattern is the result of depth distribution and freshwater inflow from land, and it can be noticed, for instance, in the Gdańsk Basin [43]. A more detailed description of hydrological conditions in the research area is provided in supplementary material, Section S4 [41,43,44,45,46,47].

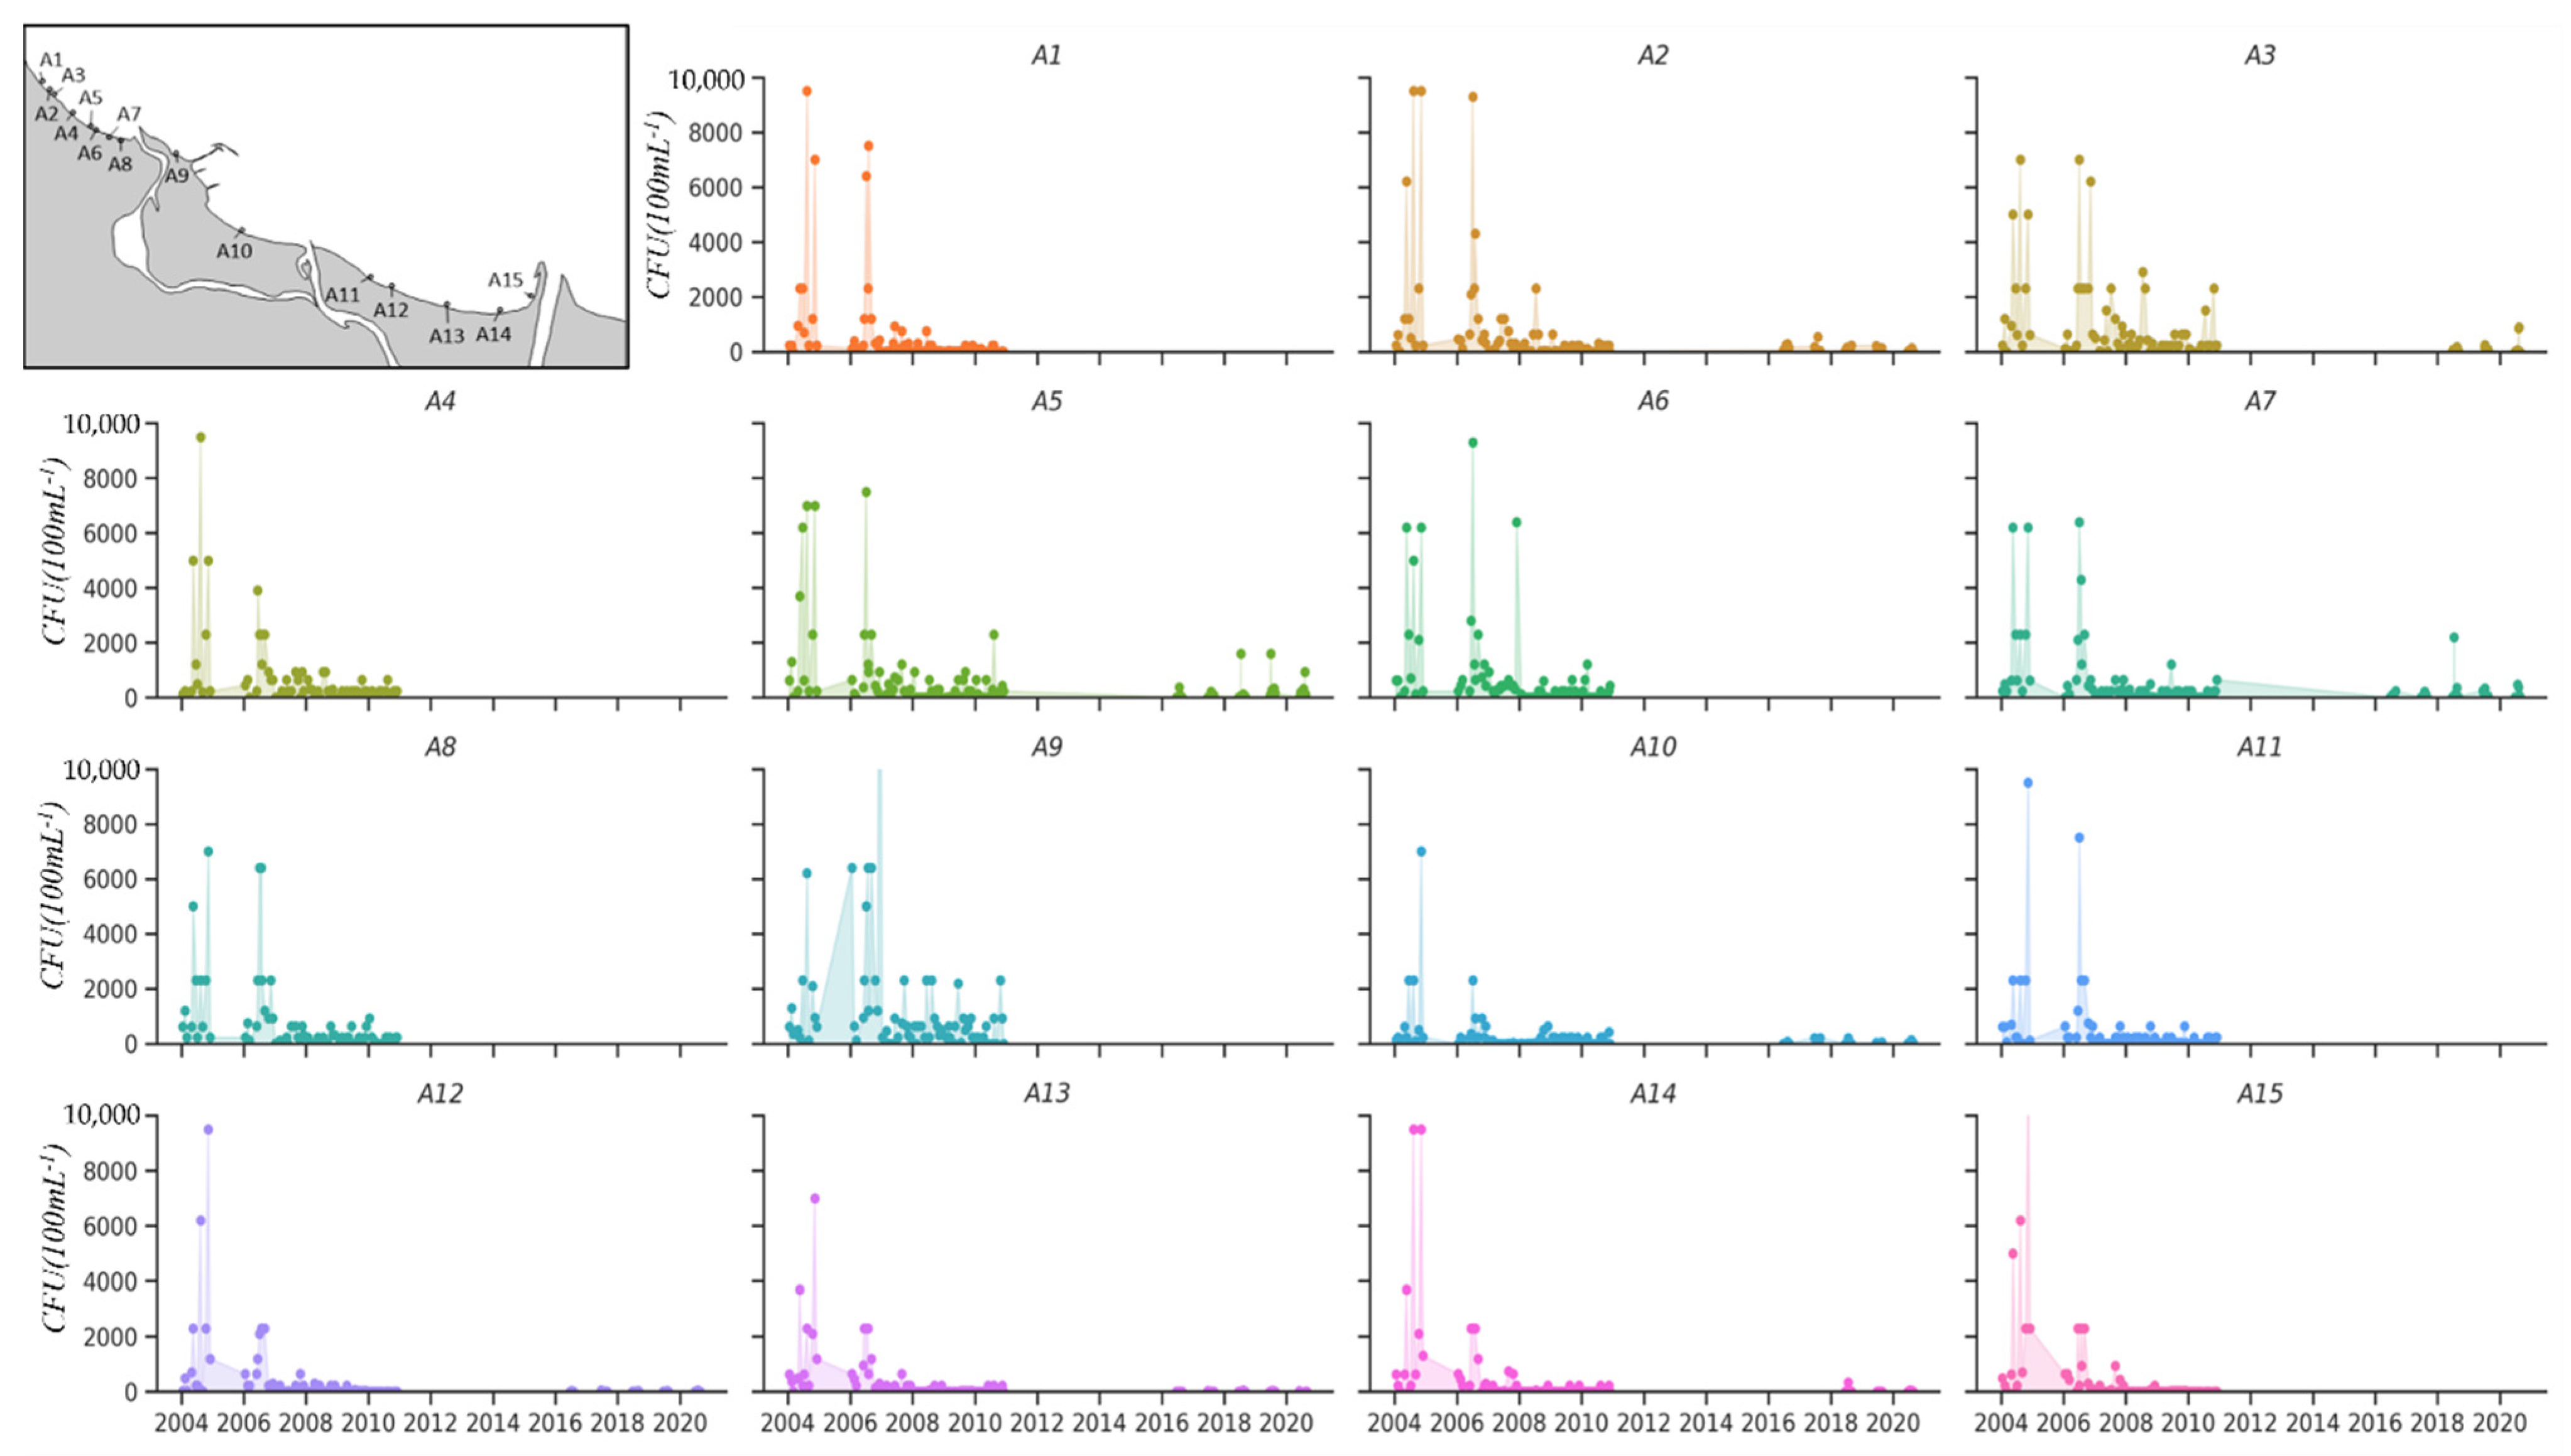
4.2. Quality of the Bathing Water in the Gdańsk Bay Area

The microbiological quality of the water entering the Bay of Gdańsk is crucial both for bathing water quality and for the sanitary safety of thousands of people using beaches in that area. The water of the Gdańsk Bay is supplied from both point and area sources.

4.2.1. Point Sources

The following point sources of E. coli inflow located in the Bay of Gdańsk are:
  • Four WWTPs (of which only two have a biological treatment stage);
  • the Vistula estuary and local water courses;
  • storm sewer.

4.2.2. Area Sources

Area sources of microbiological inflow contamination are feces of birds (seagulls) and other animals (e.g., seals, dogs) and precipitation. There is currently no data on E. coli concentrations in rain; however, some information is available on E. coli content in the air at Gdańsk beaches in 2018. According to Michalska et al. [40], E. coli was detected in the range of 0–95 CFU·100 mL−1 the atmospheric air over sampling points A1–A15 (Figure 4).
It is estimated that the contribution of area sources to the inflow of E. coli into the Gdańsk Bay is negligible. In this case, the predominant sources of E. coli are the Vistula River and local water courses. The Gdańsk Wschód WWTP discharges less than 10% of a total load of microbiological contamination. Its collector was commissioned at the turn of 2002/2003, and since then, it has been covering beaches from A11 to A15.
Bathing water monitoring used to be carried out by the Sanitary Inspectorate once a month between 2004 and 2020 at locations A1–A15 (Figure 2). Points A1–A8 are Tricity beaches located between Sopot and Gdańsk Brzeźno (a storm sewer is located at point A2), point A9 is Westerplatte beach, point A10 is Gdańsk Stogi beach, and points A11–A15 are beaches of Sobieszewo Island.
From 2004 to 2006, in the months from May to November, almost all beaches (A1 to A15) were contaminated with E. coli concentrations higher than 500 CFU·100 mL−1. According to the Bathing Water Directive (2006/7/EC) (BWD), such bathing water quality posed a high health risk (Figure 5). After 2007, E. coli concentrations at all locations decreased twofold. The occurrence of high levels of bacteria was sporadic and affected sites A2 and A3 (near the storm sewer) as well as A5 and A9.
The atmospheric deposition of E. coli by rain is difficult to estimate. The spatial distribution of annual precipitation in 2018 showed values ranging from 500 mm on Sobieszewo Island to 700 mm in the forested area of the moraine hills in the western part of Gdańsk [40]. Nevertheless, literature data show that E. coli concentration during a rainstorm can range from a few thousand to about twenty thousand CFU·100 mL−1 [48].
A more detailed description of the sources of E. coli inflow to the Gdańsk Bay is provided in supplementary material, Section S2 [49,50,51].
Correlation analysis between E. coli concentration results in bathing water in the Gdańsk Bay (Figure 6).
Results from beach A9 are not correlated with the results of any other beach. Beach A10 shows a weak correlation with A11 and A12 and very weak with the other sites. A very strong correlation of results is observed for beaches A12–A15. This is the direct area of impact of the wastewater collector. A slightly weaker correlation of A11 results with points A12–15 suggests most likely the effect of wind directions dominating in this area (westerly and westerly-south winds). These winds displace the water at the surface and that below in an easterly direction, i.e., from A11 to A15.

5. Description of the Model for E. coli Spread

5.1. General Assumptions

The research methodology included the simulation of microbiological contaminant spread using the PM3D hydrodynamic model coupled with a microbiological module. This model simulated the spread of contaminants, especially E. coli concentrations, in relation to factors such as the volume of discharge from the Gdańsk Wschód WWTP, transport under the influence of sea currents, and turbulent diffusion. The mortality of bacteria in marine conditions, which depends on solar radiation input, temperature, and water salinity, was also taken into consideration.
The PM3D model [43] is a more recent version of the M3D model [52] developed by the Institute of Oceanography, University of Gdańsk. This model was derived from Blumberg and Mellor’s (1987) POM (Princeton Ocean Model) model and was also used as a basis for the ProDeMo (Production and Destruction of Organic Matter) eco-hydrodynamic model [53,54].
To simulate the sea current fields in the Gulf of Gdańsk, it is necessary to model the hydrodynamics of the entire Baltic Sea. However, modeling of the Vistula estuary and the collector area has to be done with a high spatial resolution (of the order of 100–200 m). Due to the time required for the calculations, the hydrodynamic conditions in the entire Baltic Sea cannot be modeled with such high resolution. Therefore, during this study, calculations were performed simultaneously for three domains, i.e., areas at different spatial resolutions (Figure 2). A previously developed model [28] with a resolution of 3 nautical miles (ca. 5.5 km) was used for calculations for the entire Baltic Sea. In the case of the Gulf of Gdańsk, a grid (domain) with a resolution of 0.5 nautical miles (ca. 0.9 km), previously used in upwelling studies, was adopted [55]. In contrast, a grid with a resolution of 0.1 nautical miles (ca. 185 m) was adopted to achieve high resolution in the Vistula estuary and the collector region.
In the computational domain of the southern part of the Gulf of Gdańsk, upstream flows from four streams (Vistula, Martwa Wisła, Wisła Śmiała, and Potok Jelitkowski) were taken into account (Figure 3). The flow values used for the Vistula were based on the daily measurements of the water level in Tczew. The average monthly flows were used in the case of the Martwa Wisła, Wisła Śmiała and Potok Jelitkowski. In the remaining computational domains, monthly average (1990–2000) inflows from about 200 of the largest rivers flowing into the Baltic Sea were taken into account. Zero salinity of river waters and climatic water temperature values were assumed.
The model takes into account the inflow of treated wastewater from the “Gdańsk Wschód” sewage treatment plant through the collector built in 2002–2003. This collector discharges treated water into the Gulf of Gdańsk. The distribution chamber is located at the position 18°52.232′ E, 54°22.29′ N. Two diffusers, each 218 m long, lead out of this chamber, placed horizontally above the bottom and perpendicular to each other. They are located approximately 3 m above the bottom at an approximate depth of 12 m, whereas the depth of the Bay is approximately 15 m. In the model, the position of the diffusers was taken into account in two different nodes of the computational grid for the southern part of the Gulf of Gdańsk. The survival rate of E. coli in the analyzed aquatic environment (Supplementary material, Section S3 [56,57,58,59,60,61,62,63]) is a key parameter in the mathematical model. The available literature reports that E. coli can survive in river water for up to 260 days in a wide range of temperatures (4–25 °C), while in brackish and saline waters, the survival rate decreases. The growth of the bacteria also depends on sunlight and the presence of organic matter [64].
The variation in the number of bacteria in a defined volume of water (N) over time is described by a function
N = N0ekt
where K = the survival rate; t = time.
Various mathematical models use different empirical formulas to parameterize survival rates as a function of environmental conditions such as lighting, temperature, or water salinity.
The baseline mortality rate in the absence of light, used in those prognostic models, assumed a value in a wide range from 8.6 × 10⁻⁵ d−1 to 2.2 d−1 [20]. In this study, simulations were performed with four versions of the model (Table 3), adopting different formulas for the parameterization of the survival rate.
In order to select the optimal parameterization of mortality in the model, numerical simulations of the four versions of the model (designated as v1, v2, v3, and v4) were carried out for the study period related to the construction of the collector, i.e., from July 2002 to March 2003. According to Nowacki et al., the wastewater inflow from Gdańsk Wschód WWTP in 2002 reached 32,058.3 thousand m3·year−1 [68]. Due to the lack of specific data on the temporal variability of the WWTP inflow, a time-constant value of the water flow from the collector (1.01 m3·s−1) and in each diffuser tip (0.505 m3·s−1) was assumed for the calculations. Concentrations of fecal coliforms in wastewater discharged from the collector were calculated for each day on the basis of a linear interpolation of the values recorded on the days when measurements were taken Section S5 (Table S5). The simulations also included the inflow of E. coli into the Gulf of Gdańsk from the Vistula and the Wisła Śmiała River (Figure 2). The concentration of coliforms flowing into the Gulf of Gdańsk from these rivers was based on measurements made in their estuarial section (Section S5, Tables S3 and S4). In the periods between the measurements, the values resulting from linear interpolation of the measured bacterial concentrations were adopted for the simulation.

5.2. Faecal Coliforms (MPN of Faecal Coliforms)

The spatial distribution of fecal bacteria (ranges and directions of distribution) in the area under consideration was similar to that of coliforms, except that the size range was lower, ranging from <5 to 2300 (on average, the concentration difference between coliforms and fecal coliforms corresponds to one order of magnitude). The only exception is the results of tests carried out on 3 June 2003, when concentrations of fecal coliforms reached 23,000 CFU·100 mL−1 at points 9 and 25 (mouth of the Wisła Przekop). Fecal coliforms are commonly used in sanitary surveys as a basic indicator/marker of bacteriological water pollution. The value of this indicator/marker determines, in particular, the suitability of the bathing water. There are four popular bathing sites in the study area, the quality of which is systematically monitored by the Division of Environmental Toxicology, Medical University of Gdańsk.

6. Conclusions

This study focuses on the problems and limitations that can be encountered in the process of constructing a mathematical model describing the spread of biological contamination by E. coli bacteria in coastal seawater. The main difficulty in creating a model of the spread of sanitary contamination, which was revealed by the analyses carried out in the study area, is the lack of data regarding E. coli concentration in river tributaries (including the largest one, the Vistula River) and the lack of systematic monitoring of E. coli concentration in treated wastewater discharged into the Gdańsk Bay.
As these concentrations can vary by an order of magnitude over very short periods of time, individual measurements may not represent this adequately in the model validation database, and their absence can cause significant miscalculations in the model results. Additionally, multiple sources of biological contamination inflow make the model more complex.
Another problem is the lack of data on loads of sanitary contamination from area sources, e.g., precipitation and feces of seagulls and other birds, as well as marine animals living in the study area (e.g., seals). Locatelli et al. have pointed out the presence of this bacterium in atmospheric air. Thus, heavy rainfall is expected to contribute significant loads of E. coli to the discharge area of the Gdańsk Wschód WWTP [20].
One of the problems inherent in prognostic models is the unpredictability of precipitation, i.e., the lack of knowledge about the time of occurrence of precipitation and its amount. In addition, stronger winds and rougher seas lead to shorter periods of seawater contamination [20]. Locatelli et al. concluded that: “a great uncertainty is associated with the evaluated pollutant hazard, mainly due to the variability of water quality variables, rainfall patterns and seawater currents”.

Supplementary Materials

The following are available online at https://0-www-mdpi-com.brum.beds.ac.uk/article/10.3390/molecules27144353/s1, Section S1. Table S1. Overview of mathematical models predicting water quality (including bathing water quality) available since 2010. Section S2. Area and point sources of E. coli in the research area Table S2. Characteristics of the treatment plant; Section S3. Bacterial survival in water, Section S4. Characteristics of hydrological conditions in the research area, Section S5. Description of the data used to create and validate the model; Table S3. The concentration of fecal coliforms (coli index) measured at the mouth Vistula; Table S4. ConcentrationS of fecal coliforms (coliform index) measured at the mouth Wisła Śmiała; Table S5. Concentrations of fecal coliform bacteria in treated sewage leaving the treatment plant as well as the results for the same bacteria at the sewage discharge point.

Author Contributions

Design of the concept of the work (L.W. and M.K.), data collection (B.R., L.W. and V.R.), preparation of the database (V.R.), software development, data modeling and formal analysis (M.K.), writing the initial draft (L.W.), preparing the manuscript (L.W., M.K., M.P., B.R. and V.R.), interpreting/discussion of the results (L.W. and M.K.), critical review (L.W., M.K., M.P., B.R. and V.R.), figures and tables preparation (M.K., V.R. and L.W.), preparing the final version of the manuscript (L.W.), editing the final version of the manuscript (B.R.), supervision and acquisition of the financial support for the project (L.W.). All authors have read and agreed to the published version of the manuscript.

Funding

This work was supported by the Ministry of Science and Higher Education of Poland, project no.: ST−02-0103/07/322.

Institutional Review Board Statement

Not applicable.

Informed Consent Statement

Not applicable.

Data Availability Statement

Data contained within the article and supplementary materials are available on request from the authors.

Acknowledgments

Małgorzata Michalska for help in finding and collecting source data and Goran Gržinić for English correction of the manuscript.

Conflicts of Interest

The authors declare that the research was conducted in the absence of any commercial or financial relationships that could be construed as a potential conflict of interest.

Sample Availability

Not available.

References

  1. Chu, E.W.; Karr, J.R. Environmental Impact: Concept, Consequences, Measurement. In Reference Module in Life Sciences; Elsevier: Amsterdam, The Netherlands, 2017. [Google Scholar]
  2. Manisalidis, I.; Stavropoulou, E.; Stavropoulos, A.; Bezirtzoglou, E. Environmental and Health Impacts of Air Pollution: A Review. Front. Public Health 2020, 8, 14. [Google Scholar] [CrossRef] [PubMed] [Green Version]
  3. Igere, B.E.; Okoh, A.I.; Nwodo, U.U. Wastewater treatment plants and release: The vase of Odin for emerging bacterial contaminants, resistance and determinant of environmental wellness. Emerg. Contam. 2020, 6, 212–224. [Google Scholar] [CrossRef]
  4. Foxman, B. Epidemiology of urinary tract infections: Incidence, morbidity, and economic costs. Dis. Mon. 2003, 49, 53–70. [Google Scholar] [CrossRef] [PubMed]
  5. Fowler, C.J.; van Kerrebroeck, P.E.; Nordenbo, A.; Van Poppel, H. Treatment of lower urinary tract dysfunction in patients with multiple sclerosis. Committee of the European Study Group of SUDIMS (Sexual and Urological Disorders in Multiple Sclerosis). J. Neurol. Neurosurg. Psychiatry 1992, 55, 986–989. [Google Scholar] [CrossRef] [PubMed]
  6. Heyns, C.F.; Fisher, M. The urological management of the patient with acquired immunodeficiency syndrome. BJU Int. 2005, 95, 709–716. [Google Scholar] [CrossRef]
  7. Peeling, R.W.; Brunham, R.C. Chlamydiae as pathogens: New species and new issues. Emerg. Infect. Dis. 1996, 2, 307–319. [Google Scholar] [CrossRef]
  8. Chang, S.L.; Shortliffe, L.D. Pediatric urinary tract infections. Pediatric Clin. 2006, 53, 379–400. [Google Scholar] [CrossRef]
  9. Prakash, J. The kidney in pregnancy: A journey of three decades. Indian J. Nephrol. 2012, 22, 159–167. [Google Scholar] [CrossRef]
  10. Hooton, T.M.; Bradley, S.F.; Cardenas, D.D.; Colgan, R.; Geerlings, S.E.; Rice, J.C.; Saint, S.; Schaeffer, A.J.; Tambayh, P.A.; Tenke, P.; et al. Diagnosis, prevention, and treatment of catheter-associated urinary tract infection in adults: 2009 International Clinical Practice Guidelines from the Infectious Diseases Society of America. Clin. Infect. Dis. 2010, 50, 625–663. [Google Scholar] [CrossRef]
  11. Ronald, A.; Ludwig, E. Urinary tract infections in adults with diabetes. Int. J. Antimicrob. Agents 2001, 17, 287–292. [Google Scholar] [CrossRef]
  12. Grüne, B.; Viehweger, V.; Waldbillig, F.; Nientiedt, M.; Kriegmair, M.C.; Rassweiler-Seyfried, M.-C.; Ritter, M. Preoperative urine culture—Is it necessary to prevent infectious complications following ureterorenoscopy? J. Microbiol. Methods 2020, 173, 105933. [Google Scholar] [CrossRef] [PubMed]
  13. Leonard, A.F.C.; Zhang, L.; Balfour, A.J.; Garside, R.; Hawkey, P.M.; Murray, A.K.; Ukoumunne, O.C.; Gaze, W.H. Exposure to and colonisation by antibiotic-resistant E. coli in UK coastal water users: Environmental surveillance, exposure assessment, and epidemiological study (Beach Bum Survey). Environ. Int. 2018, 114, 326–333. [Google Scholar] [CrossRef] [PubMed]
  14. Cardozo, M.V.; Borges, C.A.; Beraldo, L.G.; Maluta, R.P.; Pollo, A.S.; Borzi, M.M.; Dos Santos, L.F.; Kariyawasam, S.; de Ávila, F.A. Shigatoxigenic and atypical enteropathogenic Escherichia coli in fish for human consumption. Braz. J. Microbiol. 2018, 49, 936–941. [Google Scholar] [CrossRef] [PubMed]
  15. Maluta, R.P.; Fairbrother, J.M.; Stella, A.E.; Rigobelo, E.C.; Martinez, R.; de Ávila, F.A. Potentially pathogenic Escherichia coli in healthy, pasture-raised sheep on farms and at the abattoir in Brazil. Vet. Microbiol. 2014, 169, 89–95. [Google Scholar] [CrossRef] [PubMed]
  16. Directive 2006/7/EC of the European Parliament and of the Council of 15 February 2006 concerning the management of bathing water quality and repealing Directive 76/160/EEC. Off. J. Eur. Union 2006, 4, 37–51.
  17. European Environment Agency. State of Bathing Water. Details on All Member States Bathing Waters for the 2020 Season Can Be Found in the National Bathing Water Reports. 2020. Available online: https://www.eea.europa.eu/themes/water/europes-seas-and-coasts/assessments/state-of-bathing-water/country-reports-2020-bathing-season/polish-bathing-water-quality-in-2020 (accessed on 21 February 2020).
  18. Commission, T.E. Bathing Water Quality. Available online: https://ec.europa.eu/environment/water/water-bathing/ (accessed on 23 February 2022).
  19. Džal, D.; Kosović, I.N.; Mastelić, T.; Ivanković, D.; Puljak, T.; Jozić, S. Modelling Bathing Water Quality Using Official Monitoring Data. Water 2021, 13, 3005. [Google Scholar] [CrossRef]
  20. Locatelli, L.; Russo, B.; Acero Oliete, A.; Sánchez Catalán, J.C.; Martinez-Gomariz, E.; Martinez, M. Modeling of E. coli distribution for hazard assessment of bathing waters affected by combined sewer overflows. Nat. Hazards Earth Syst. Sci. 2020, 20, 1219–1232. [Google Scholar] [CrossRef]
  21. Daniel, D.; Iswarani, W.P.; Pande, S.; Rietveld, L. A Bayesian Belief Network model to link sanitary inspection data to drinking water quality in a medium resource setting in rural Indonesia. Sci. Rep. 2020, 10, 18867. [Google Scholar] [CrossRef]
  22. Srikandi, E.D.; Karnaningroem, N. Dynamic modelling of Escherichia coli growth in water distribution system (a case study: Water supply zone 3 in Surabaya Indonesia). Int. J. Adv. Res. 2017, 5, 1145–1149. [Google Scholar] [CrossRef] [Green Version]
  23. Pandey, P. Modeling in- stream Escherichia coli concentrations. Diss. Abstr. Int. 2012, 74 (Suppl. B:1–336), 5. [Google Scholar]
  24. Stocker, M.D.; Jeon, D.J.; Sokolova, E.; Lee, H.; Kim, M.S.; Pachepsky, Y.A. Accounting for the Three-Dimensional Distribution of Escherichia coli Concentrations in Pond Water in Simulations of the Microbial Quality of Water Withdrawn for Irrigation. Water 2020, 12, 1708. [Google Scholar] [CrossRef]
  25. Herrig, I.; Seis, W.; Fischer, H.; Regnery, J.; Manz, W.; Reifferscheid, G.; Böer, S. Prediction of fecal indicator organism concentrations in rivers: The shifting role of environmental factors under varying flow conditions. Environ. Sci. Eur. 2019, 31, 59. [Google Scholar] [CrossRef]
  26. Hu, J.; Yang, M.; Gompper, G.; Winkler, R.G. Modelling the mechanics and hydrodynamics of swimming E. coli. Soft Matter 2015, 11, 7867–7876. [Google Scholar] [CrossRef] [PubMed] [Green Version]
  27. Huang, G.; Falconer, R.A.; Lin, B. Integrated hydro-bacterial modelling for predicting bathing water quality. Estuar. Coast. Shelf Sci. 2017, 188, 145–155. [Google Scholar] [CrossRef]
  28. Cho, K.H.; Pachepsky, Y.A.; Oliver, D.M.; Muirhead, R.W.; Park, Y.; Quilliam, R.S.; Shelton, D.R. Modeling fate and transport of fecally-derived microorganisms at the watershed scale: State of the science and future opportunities. Water Res. 2016, 100, 38–56. [Google Scholar] [CrossRef]
  29. Niu, J.; Phanikumar, M. Modeling watershed-scale solute transport using an integrated, process-based hydrologic model with applications to bacterial fate and transport. J. Hydrol. 2015, 529, 35–48. [Google Scholar] [CrossRef]
  30. De Brauwere, A.; Gourgue, O.; de Brye, B.; Servais, P.; Ouattara, N.K.; Deleersnijder, E. Integrated modelling of faecal contamination in a densely populated river-sea continuum (Scheldt River and Estuary). Sci. Total Environ. 2014, 468–469, 31–45. [Google Scholar] [CrossRef]
  31. Zhou, J.; Falconer, R.A.; Lin, B. Refinements To The Efdc Model For Predicting The Hydro-Environmental Impacts Of A Barrage Across The Severn Estuary. Renew. Energy 2014, 1, 458–476. [Google Scholar] [CrossRef]
  32. Bedri, Z.; Corkery, A.; O’Sullivan, J.J.; Alvarez, M.X.; Erichsen, A.C.; Deering, L.A.; Demeter, K.; O’Hare, G.M.P.; Meijer, W.G.; Masterson, B. An Integrated Catchment-Coastal Modelling System for Real-Time Water Quality Forecasts. Environ. Model. Softw. 2014, 61, 458–476. [Google Scholar] [CrossRef]
  33. Yakirevich, A.; Pachepsky, Y.A.; Guber, A.K.; Gish, T.J.; Shelton, D.R.; Cho, K.H. Modeling transport of Escherichia coli in a creek during and after artificial high-flow events: Three-year study and analysis. Water Res. 2013, 47, 2676–2688. [Google Scholar] [CrossRef]
  34. Chan, S.N.; Thoe, W.; Lee, J.H.W. Real-time forecasting of Hong Kong beach water quality by 3D deterministic model. Water Res. 2013, 47, 1631–1647. [Google Scholar] [CrossRef] [PubMed]
  35. Pandey, P.K.; Soupir, M.L.; Ikenberry, C.D.; Rehmann, C.R. Predicting Streambed Sediment and Water Column Escherichia coli Levels at Watershed Scale. JAWRA J. Am. Water Resour. Assoc. 2016, 52, 184–197. [Google Scholar] [CrossRef]
  36. Weiskerger, C.J.; Phanikumar, M.S. Numerical Modeling of Microbial Fate and Transport in Natural Waters: Review and Implications for Normal and Extreme Storm Events. Water 2020, 12, 1876. [Google Scholar] [CrossRef]
  37. Petersen, F.; Hubbart, J.A. Physical Factors Impacting the Survival and Occurrence of Escherichia coli in Secondary Habitats. Water 2020, 12, 1796. [Google Scholar] [CrossRef]
  38. Nag, R.; Monahan, C.; Whyte, P.; Markey, B.K.; O’Flaherty, V.; Bolton, D.; Fenton, O.; Richards, K.G.; Cummins, E. Risk assessment of Escherichia coli in bioaerosols generated following land application of farmyard slurry. Sci. Total Environ. 2021, 791, 148189. [Google Scholar] [CrossRef] [PubMed]
  39. García-Alba, J.; Bárcena, J.F.; Ugarteburu, C.; García, A. Artificial neural networks as emulators of process-based models to analyse bathing water quality in estuaries. Water Res. 2019, 150, 283–295. [Google Scholar] [CrossRef]
  40. Michalska, M.; Zorena, K.; Bartoszewicz, M. Analysis of faecal bacteria isolated from air and seawater samples following an emergency sewage discharge into the Gulf of Gdansk in 2018-preliminary study. Int. Marit. Health 2019, 70, 239–243. [Google Scholar] [CrossRef]
  41. Matciak, M.; Nowicki, J. The hydrological and hydrochemical division of the surface observations. Oceanologia 1996, 37, 75–88. [Google Scholar]
  42. Jankowski, A. Matematyczne modelowanie pola przepływów w Morzu Bałtyckim. In Prace Habilitacyjne—Polska Akademia Nauk. Instytut Oceanologii; Ossolineum: Wroclaw, Poland, 1988; p. 281. [Google Scholar]
  43. Jędrasik, J.; Kowalewski, M. Mean annual and seasonal circulation patterns and long-term variability of currents in the Baltic Sea. J. Mar. Syst. 2019, 193, 1–26. [Google Scholar] [CrossRef]
  44. Taranowska, S. O kierunkach i prędkościach wiatrów dolnych na obszarze Środkowego i Południowego Bałtyku (1947–1960). Przegląd Geogr. 1968, 13, 75–88. [Google Scholar]
  45. Kullenberg, G. Physical Oceanograph7y. In The Baltic Sea; Voipio, A., Ed.; Elsevier Oceanography Series; Elsevier: Amsterdam, The Netherlands, 1981; Volume 30, pp. 135–181. [Google Scholar]
  46. Voipio, A. (Ed.) The Baltic Sea; Elsevier Oceanography Series; Elsevier: Amsterdam, The Netherlands, 1981; Volume 30. [Google Scholar]
  47. Kwiecień, K. Warunki klimatyczne. In Bałtyk Południowy; Ossolineum: Wrocław, Poland, 1987; pp. 219–288. [Google Scholar]
  48. Islam, M.M.M.; Hofstra, N.; Islam, M.A. The Impact of Environmental Variables on Faecal Indicator Bacteria in the Betna River Basin, Bangladesh. Environ. Processes 2017, 4, 319–332. [Google Scholar] [CrossRef]
  49. Ratajczak, W. Environmental Threats Resulting from the Discharge of Treated Sewage to Sea Waters. Ph.D. Thesis, Medical University of Gdańsk, Gdańsk, Poland, 2017. Unpublished. (In Polish). [Google Scholar]
  50. Majewski, W. General characteristics of the Vistula and its basin. Acta Energetica 2013, 2, 6–15. [Google Scholar] [CrossRef]
  51. Meissner, W.; Kośmicki, A.; Bzoma, S. Liczebność ptaków wodnych na Zatoce Gdańskiej w okresie wrzesień 2020–kwiecień 2021. Ornis Pol. 2021, 62, 357–363. [Google Scholar]
  52. Kowalewski, M. A three-dimensional hydrodynamic model of the Gulf of Gdansk. Oceanol. Stud. 1997, 26, 77–98. [Google Scholar]
  53. Ołdakowski, B.; Kowalewski, M.; Jędrasik, J.; Szymelfenig, M. Ecohydrodynamic model of the Baltic Sea. Part 1. Description of the ProDeMo model. Oceanologia 2005, 47, 477–516. [Google Scholar]
  54. Kowalewski, M. The flow of nitrogen into the euphotic zone of the Baltic Proper as a result of the vertical migration of phytoplankton: An analysis of the long-term observations and ecohydrodynamic model simulation. J. Mar. Syst. 2015, 145, 53–68. [Google Scholar] [CrossRef]
  55. Kowalewska-Kalkowska, H.; Kowalewski, M. Combining Satellite Imagery and Numerical Modelling to Study the Occurrence of Warm Upwellings in the Southern Baltic Sea in Winter. Remote Sens. 2019, 11, 2982. [Google Scholar] [CrossRef] [Green Version]
  56. Flint, K.P. The long-term survival of Escherichia coli in river water. J. Appl. Bacteriol. 1987, 63, 261–270. [Google Scholar] [CrossRef]
  57. Liang, C.; Yao, Z.; Du, S.; Hong, M.; Wang, K.; Zhang, D. Sediment pH, not the bacterial diversity, determines Escherichia coli O157:H7 survival in estuarine sediments. Environ. Pollut. 2019, 252, 1078–1086. [Google Scholar] [CrossRef]
  58. Wanjugi, P.; Fox, G.A.; Harwood, V.J. The Interplay Between Predation, Competition, and Nutrient Levels Influences the Survival of Escherichia coli in Aquatic Environments. Microb. Ecol. 2016, 72, 526–537. [Google Scholar] [CrossRef]
  59. Garcia-Armisen, T.; Servais, P. Partitioning and fate of particle-associated E. coli in river waters. Water Environ. Res. 2009, 81, 21–28. [Google Scholar] [CrossRef] [PubMed]
  60. Sagarduy, M.; Courtois, S.; Del Campo, A.; Garmendia, J.M.; Petrau, A. Differential decay and prediction of persistence of Enterococcus spp. and Escherichia coli culturable cells and molecular markers in freshwater and seawater environments. Int. J. Hyg. Environ. Health 2019, 222, 695–704. [Google Scholar] [CrossRef] [PubMed]
  61. Rozen, Y.; Belkin, S. Survival of enteric bacteria in seawater. FEMS Microbiol. Rev. 2001, 25, 513–529. [Google Scholar] [CrossRef] [PubMed]
  62. Korajkic, A.; Wanjugi, P.; Harwood, V.J. Indigenous microbiota and habitat influence Escherichia coli survival more than sunlight in simulated aquatic environments. Appl. Environ. Microbiol. 2013, 79, 5329–5337. [Google Scholar] [CrossRef] [PubMed] [Green Version]
  63. Lothigius, A.; Sjöling, A.; Svennerholm, A.-M.; Bölin, I. Survival and gene expression of enterotoxigenic Escherichia coli during long-term incubation in sea water and freshwater. J. Appl. Microbiol. 2010, 108, 1441–1449. [Google Scholar] [CrossRef] [Green Version]
  64. Alonso-Sáez, L.; Gasol, J.M.; Lefort, T.; Hofer, J.; Sommaruga, R. Effect of natural sunlight on bacterial activity and differential sensitivity of natural bacterioplankton groups in northwestern Mediterranean coastal waters. Appl. Environ. Microbiol. 2006, 72, 5806–5813. [Google Scholar] [CrossRef] [Green Version]
  65. Krolska, M.; Latala, A.; Michalska, M.; Nowacki, J.S.Z. Escherichia coli survival in the water from the Gulf of Gdansk under laboratory conditions. Oceanol. Stud. 1997, 26, 133–143. [Google Scholar]
  66. Jozić, S.; Morović, M.; Šolić, M.; Krstulović, N.; Ordulj, M. Effect of solar radiation, temperature and salinity on the survival of two different strains of Escherichia coli. Fresenius Environ. Bull. 2014, 23, 1852–1859. [Google Scholar]
  67. Thupaki, P.; Phanikumar, M.S.; Beletsky, D.; Schwab, D.J.; Nevers, M.B.; Whitman, R.L. Budget analysis of Escherichia coli at a Southern Lake Michigan Beach. Environ. Sci. Technol. 2010, 44, 1010–1016. [Google Scholar] [CrossRef]
  68. Szumilas, T.; Michalska, M.; Bartoszewicz, M. Changes of sanitary conditions of coastal waters near Gdańsk in years 1993–2002. Inżynieria Morska i Geotech 2004, 3, 131–138. [Google Scholar]
Figure 1. Comparison of E. coli concentrations observed on 29 May 2003 (top panel) and modeled with the use of different formulas for bacterial survival (versions: v1, v2, v3, v4, see Table 3).
Molecules 27 04353 g001
Figure 2. Distribution of E. coli concentration in the study area on 12 August 2003 at the depths of 0, 5, and 10 m; left: observed distributions; center: reference version of the model (v4); right: results of simulation modeled with assumed high concentration of E. coli in water flowing through the collector (v4a). Points indicate the location of the station and measured values.
Molecules 27 04353 g002
Figure 3. Bathymetry of the study area—the southern part of the Gulf of Gdańsk and areas modeled in lower resolution: the Baltic Sea and the Gulf of Gdańsk. Indicated locations are: (1) the mouth of the Vistula River, (2) the mouth of the Wisła Śmiała River, (3) the Martwa Wisła River, (4) the Jelitkowski Stream, and (5) the outlet from the collector of the Gdańsk Wschód WWTP.
Molecules 27 04353 g003
Figure 4. Location of bathing water sampling sites (A1–A15) with pipe outlet from the Gdańsk Wschód WWTP (star).
Molecules 27 04353 g004
Figure 5. The average concentration of E. coli (CFU·100 mL−1) in bathing water of Gdańsk Bay for the period 2004–2020.
Molecules 27 04353 g005
Figure 6. Correlation matrix for locations A1–A15.
Molecules 27 04353 g006
Table 1. Statistical compliance characteristics of the observed and modeled decimal logarithms of E. coli concentrations in the surface waters of the Gulf of Gdańsk in the period from November 2002 to October 2003.
DATEBIASRMSER
5 November 2002−1.940.280.96
10 December 2002−1.940.26−0.46
5 February 2003−1.251.010.58
25 March 2003−0.241.250.48
29 March 2003−0.291.470.35
8 May 20030.081.200.17
10 May 20030.321.080.13
29 May 20030.180.860.37
17 June 20030.080.880.54
4 July 2003−0.170.970.33
16 July 20030.331.000.19
12 August 2003−0.631.180.29
6 September 2003−0.141.170.26
26 September 2003−0.611.250.22
3 October 2003−0.410.980.23
Table 2. Failures of the wastewater network that have occurred in the last four years during the late spring and summer seasons.
DateArea of AccidentDescription
15 May 2018Gdańsk Ołowianka wastewater pumping stationEngine failure at the pumping station managing 60% of the wastewater from Gdańsk and transporting it to the Gdańsk Wschód (WWTP). At that time, about 2600 m3 of wastewater was discharged per hour directly into Gdańsk Bay.
12 June 2019outlet from Swarzewo WWTPPipe bursting and wastewater spilling into Puck Bay and onto residents’ properties
27 August 2019the Vistula RiverFirst pipeline failure in Warsaw
29 August 2020the Vistula River Second pipeline failure in Warsaw
Table 3. Mathematical formulas for the survival rate of E. coli used in different versions of the selected model.
Version of ModelFormulaReference
v1k = 6.466 − 0.195 T + 2.215·10−7 T2 I2[65]
v2 k = ln ( 0.1 ) 31.305 · exp ( 0.17 I U V A ) [66]
v3 k = ( 8 . 6   ×   10 5   +   0 . 0026   I ) 1.07 T 20 [67]
v4 k = ( 0.8 + 0.11   S + 0.0086   I ) 1.07 T 20 [39]
Where: T: water temperature; I, IUVA: total irradiance; UVA: irradiance; S: water salinity.
Publisher’s Note: MDPI stays neutral with regard to jurisdictional claims in published maps and institutional affiliations.

