

Intersystem Crossing of 2-Methlypyrazine Studied by Femtosecond Photoelectron Imaging

Abstract
: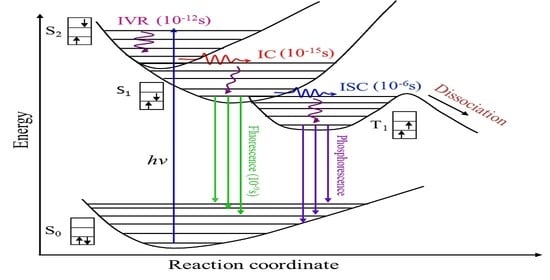
1. Introduction
2. Materials and Methods
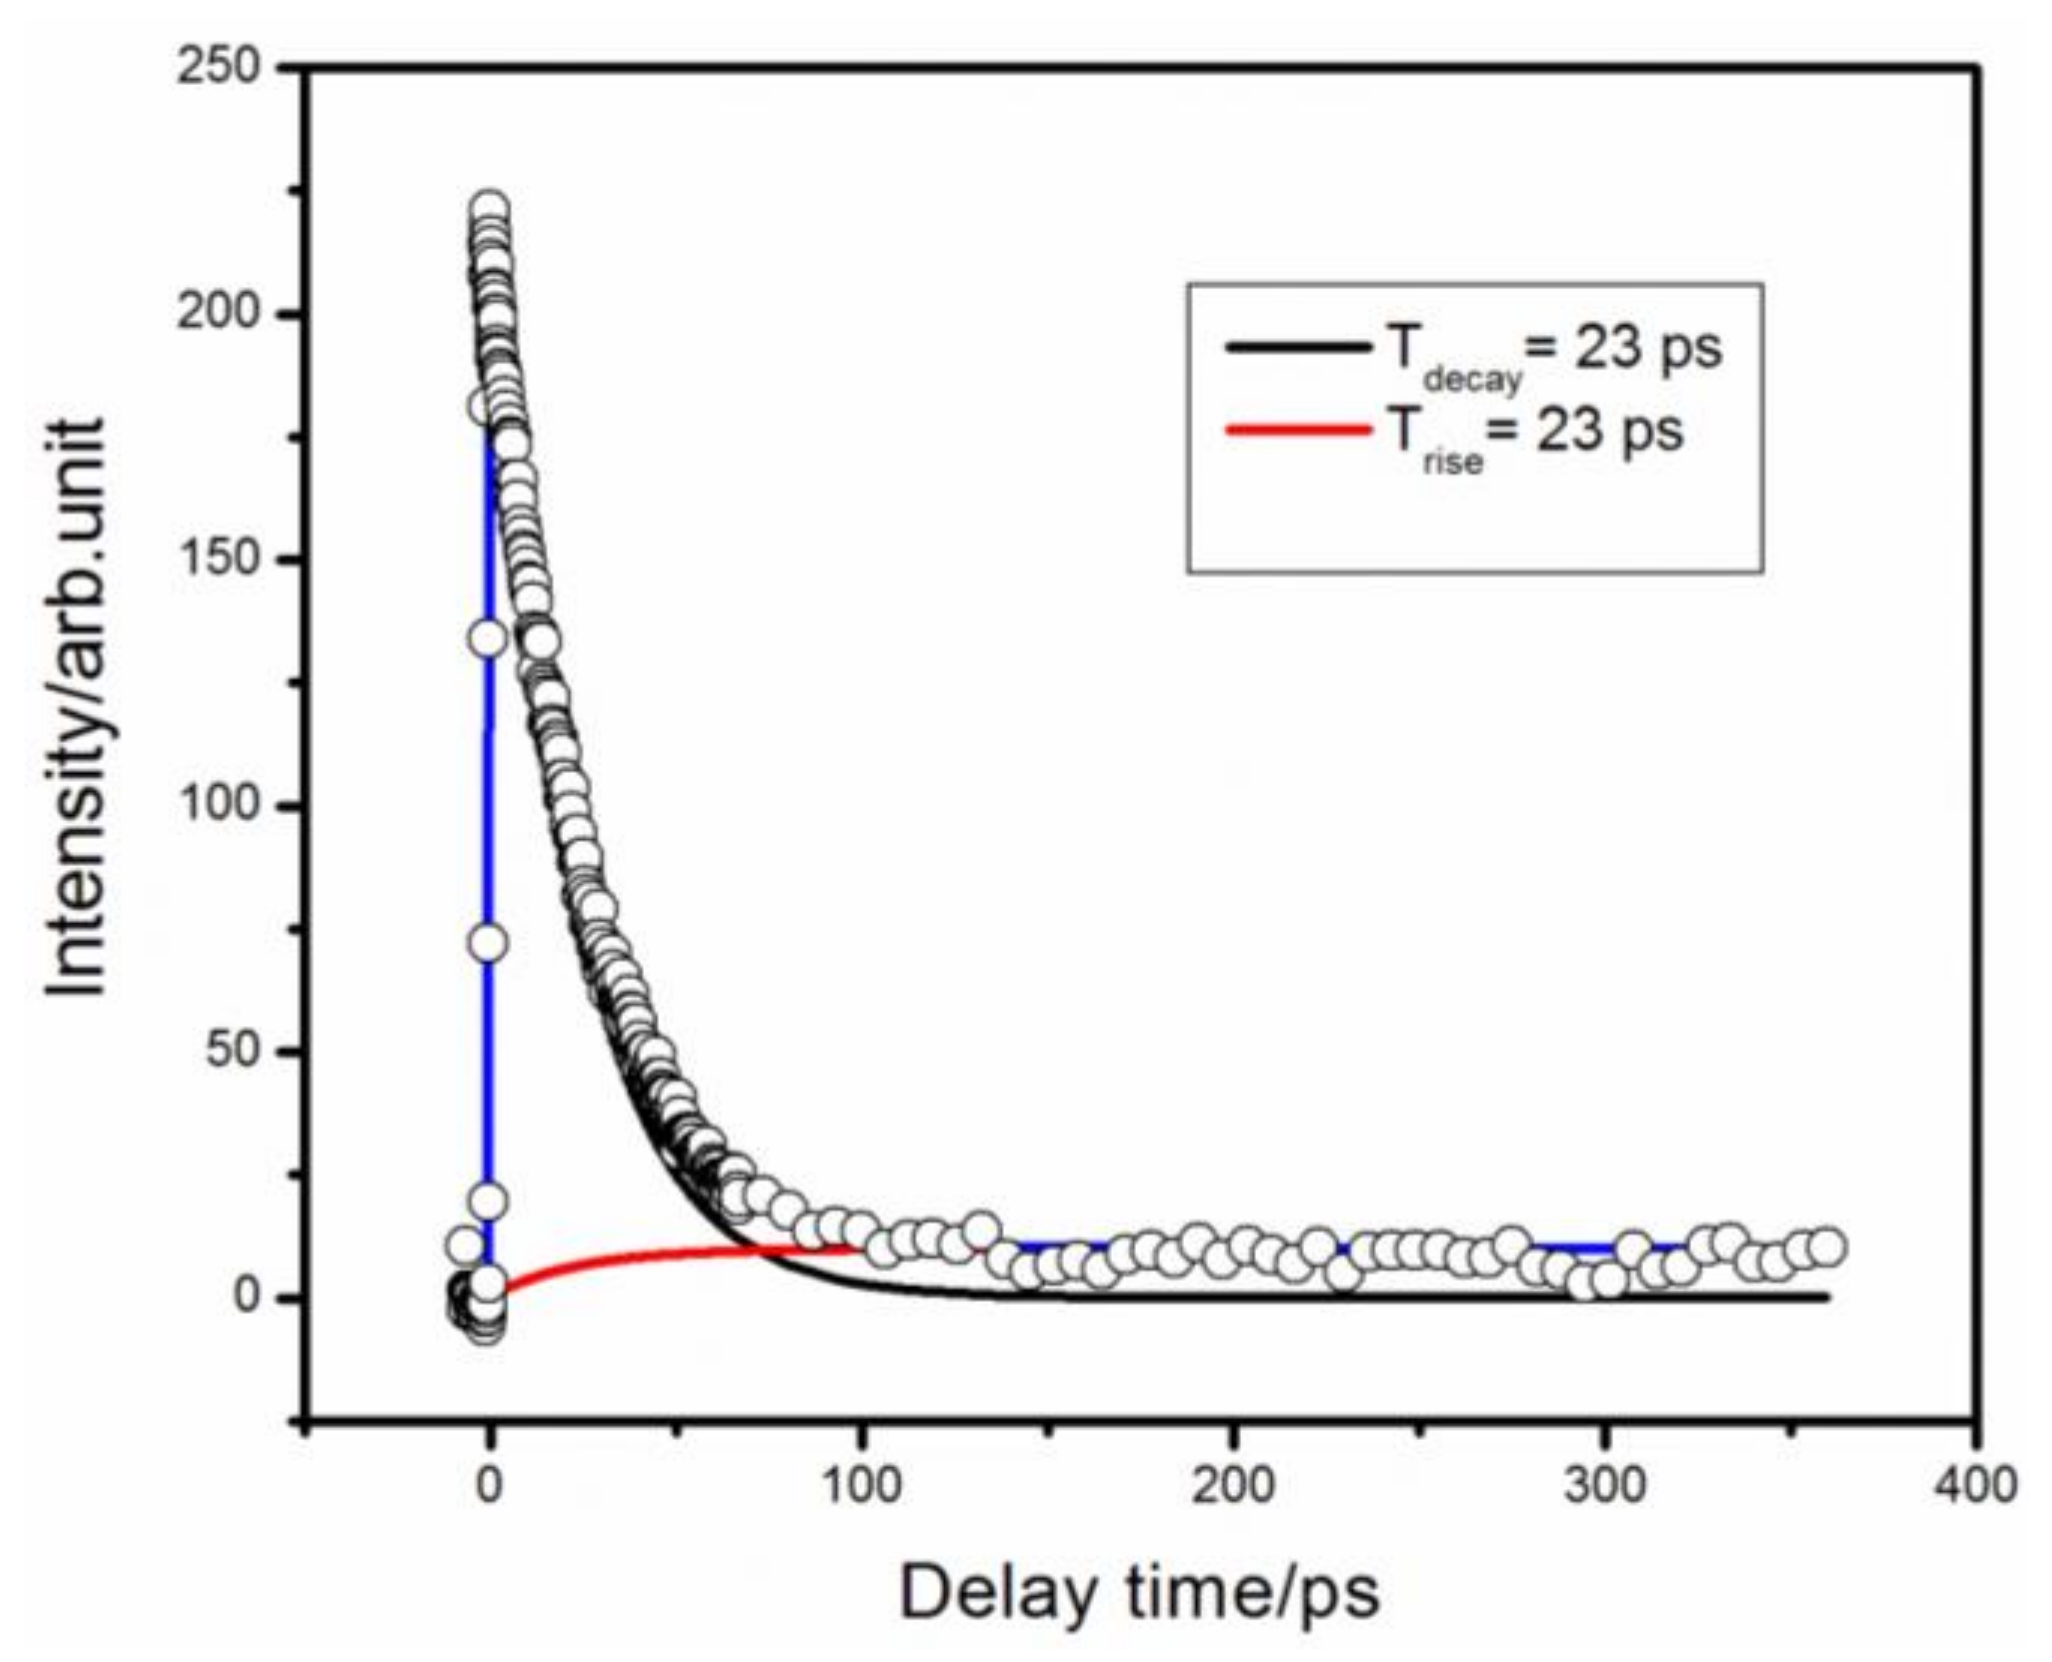
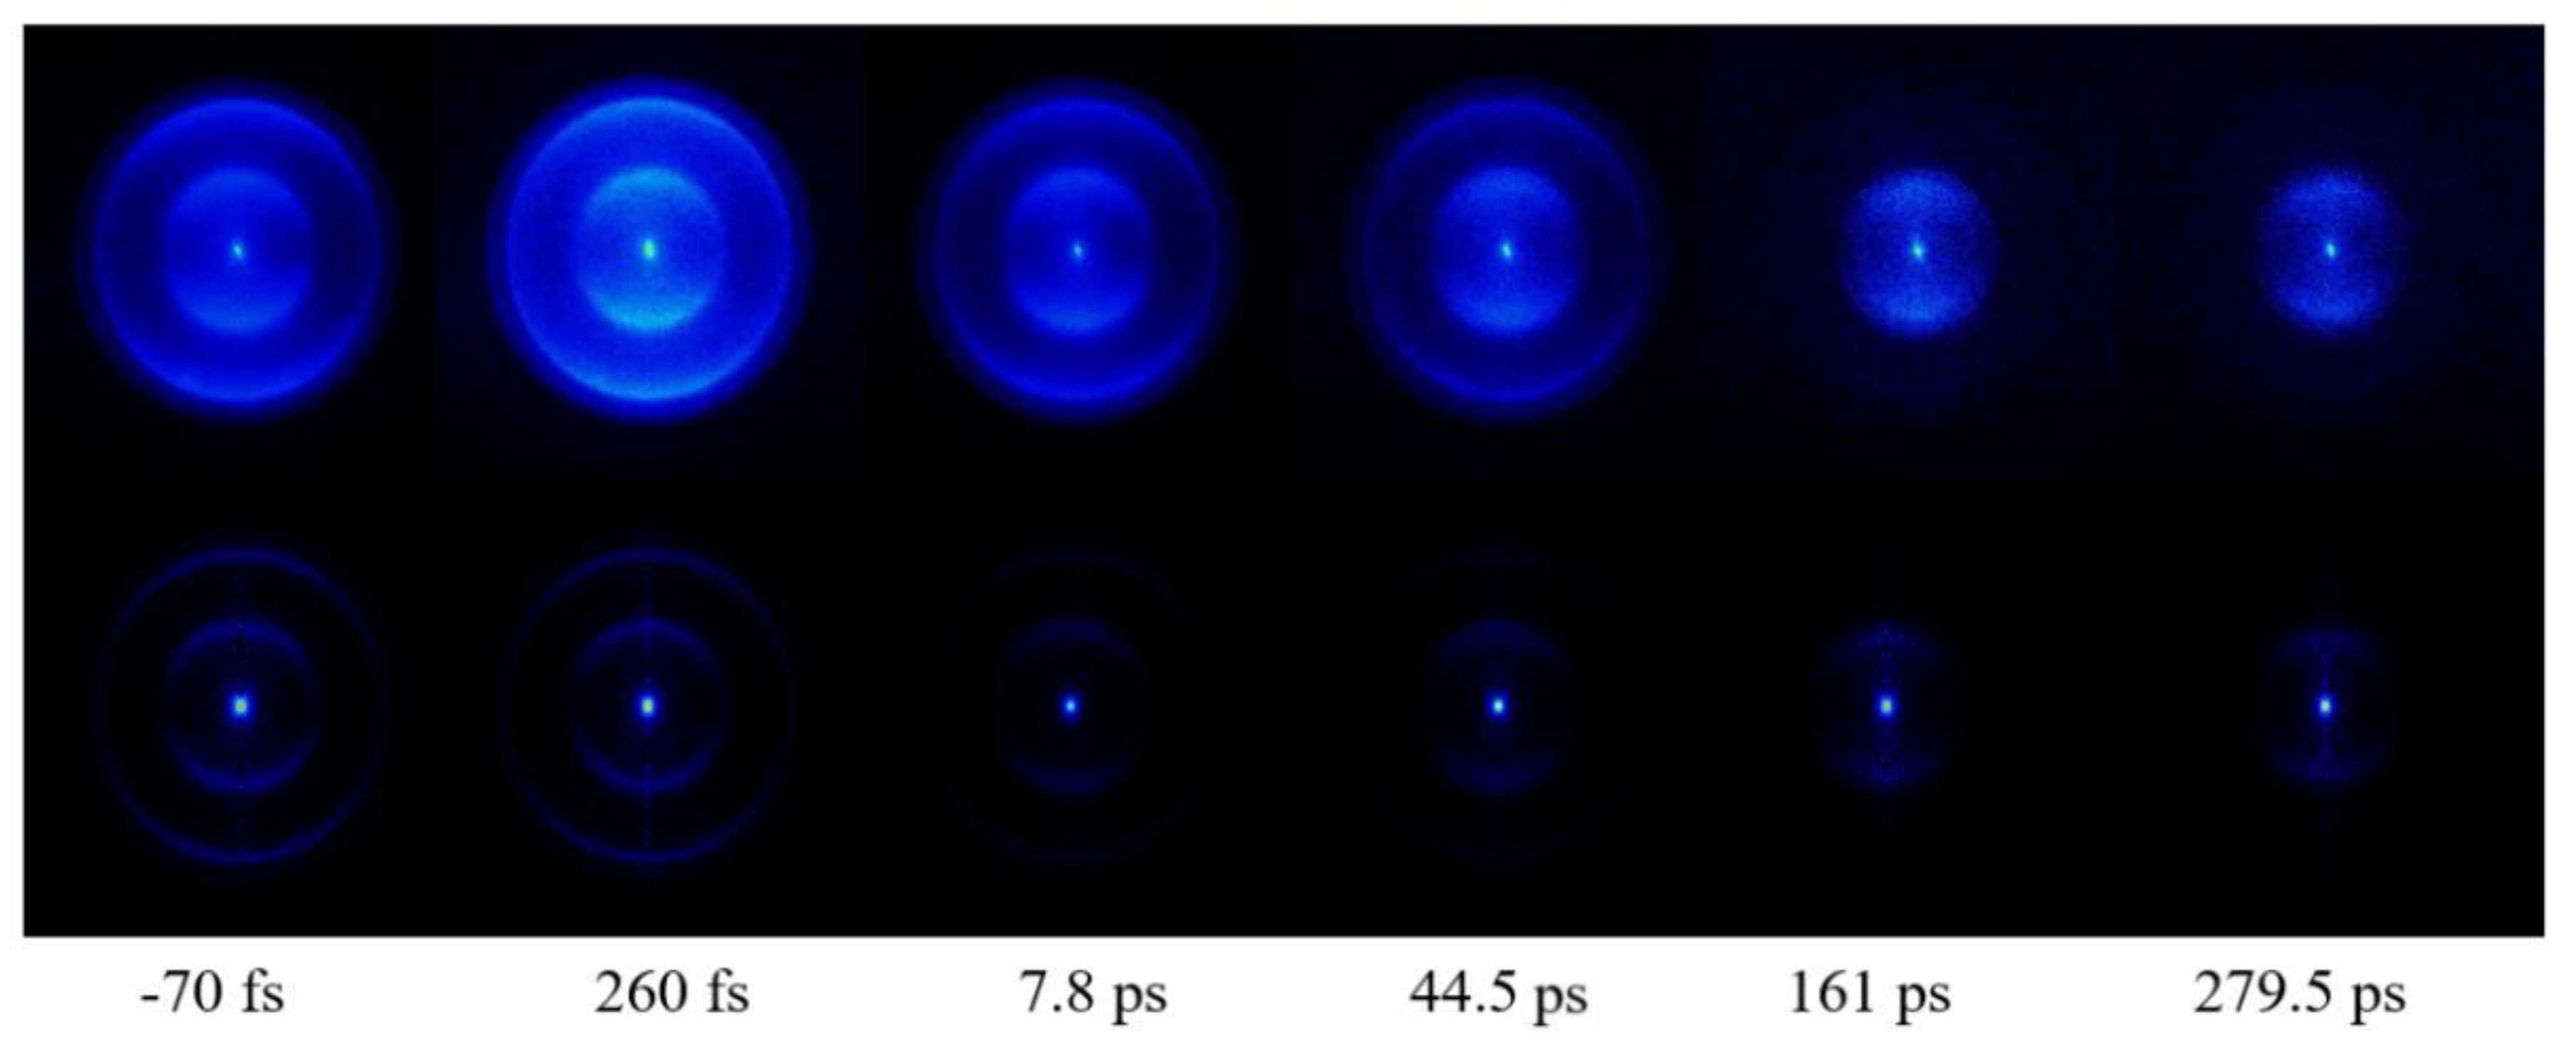
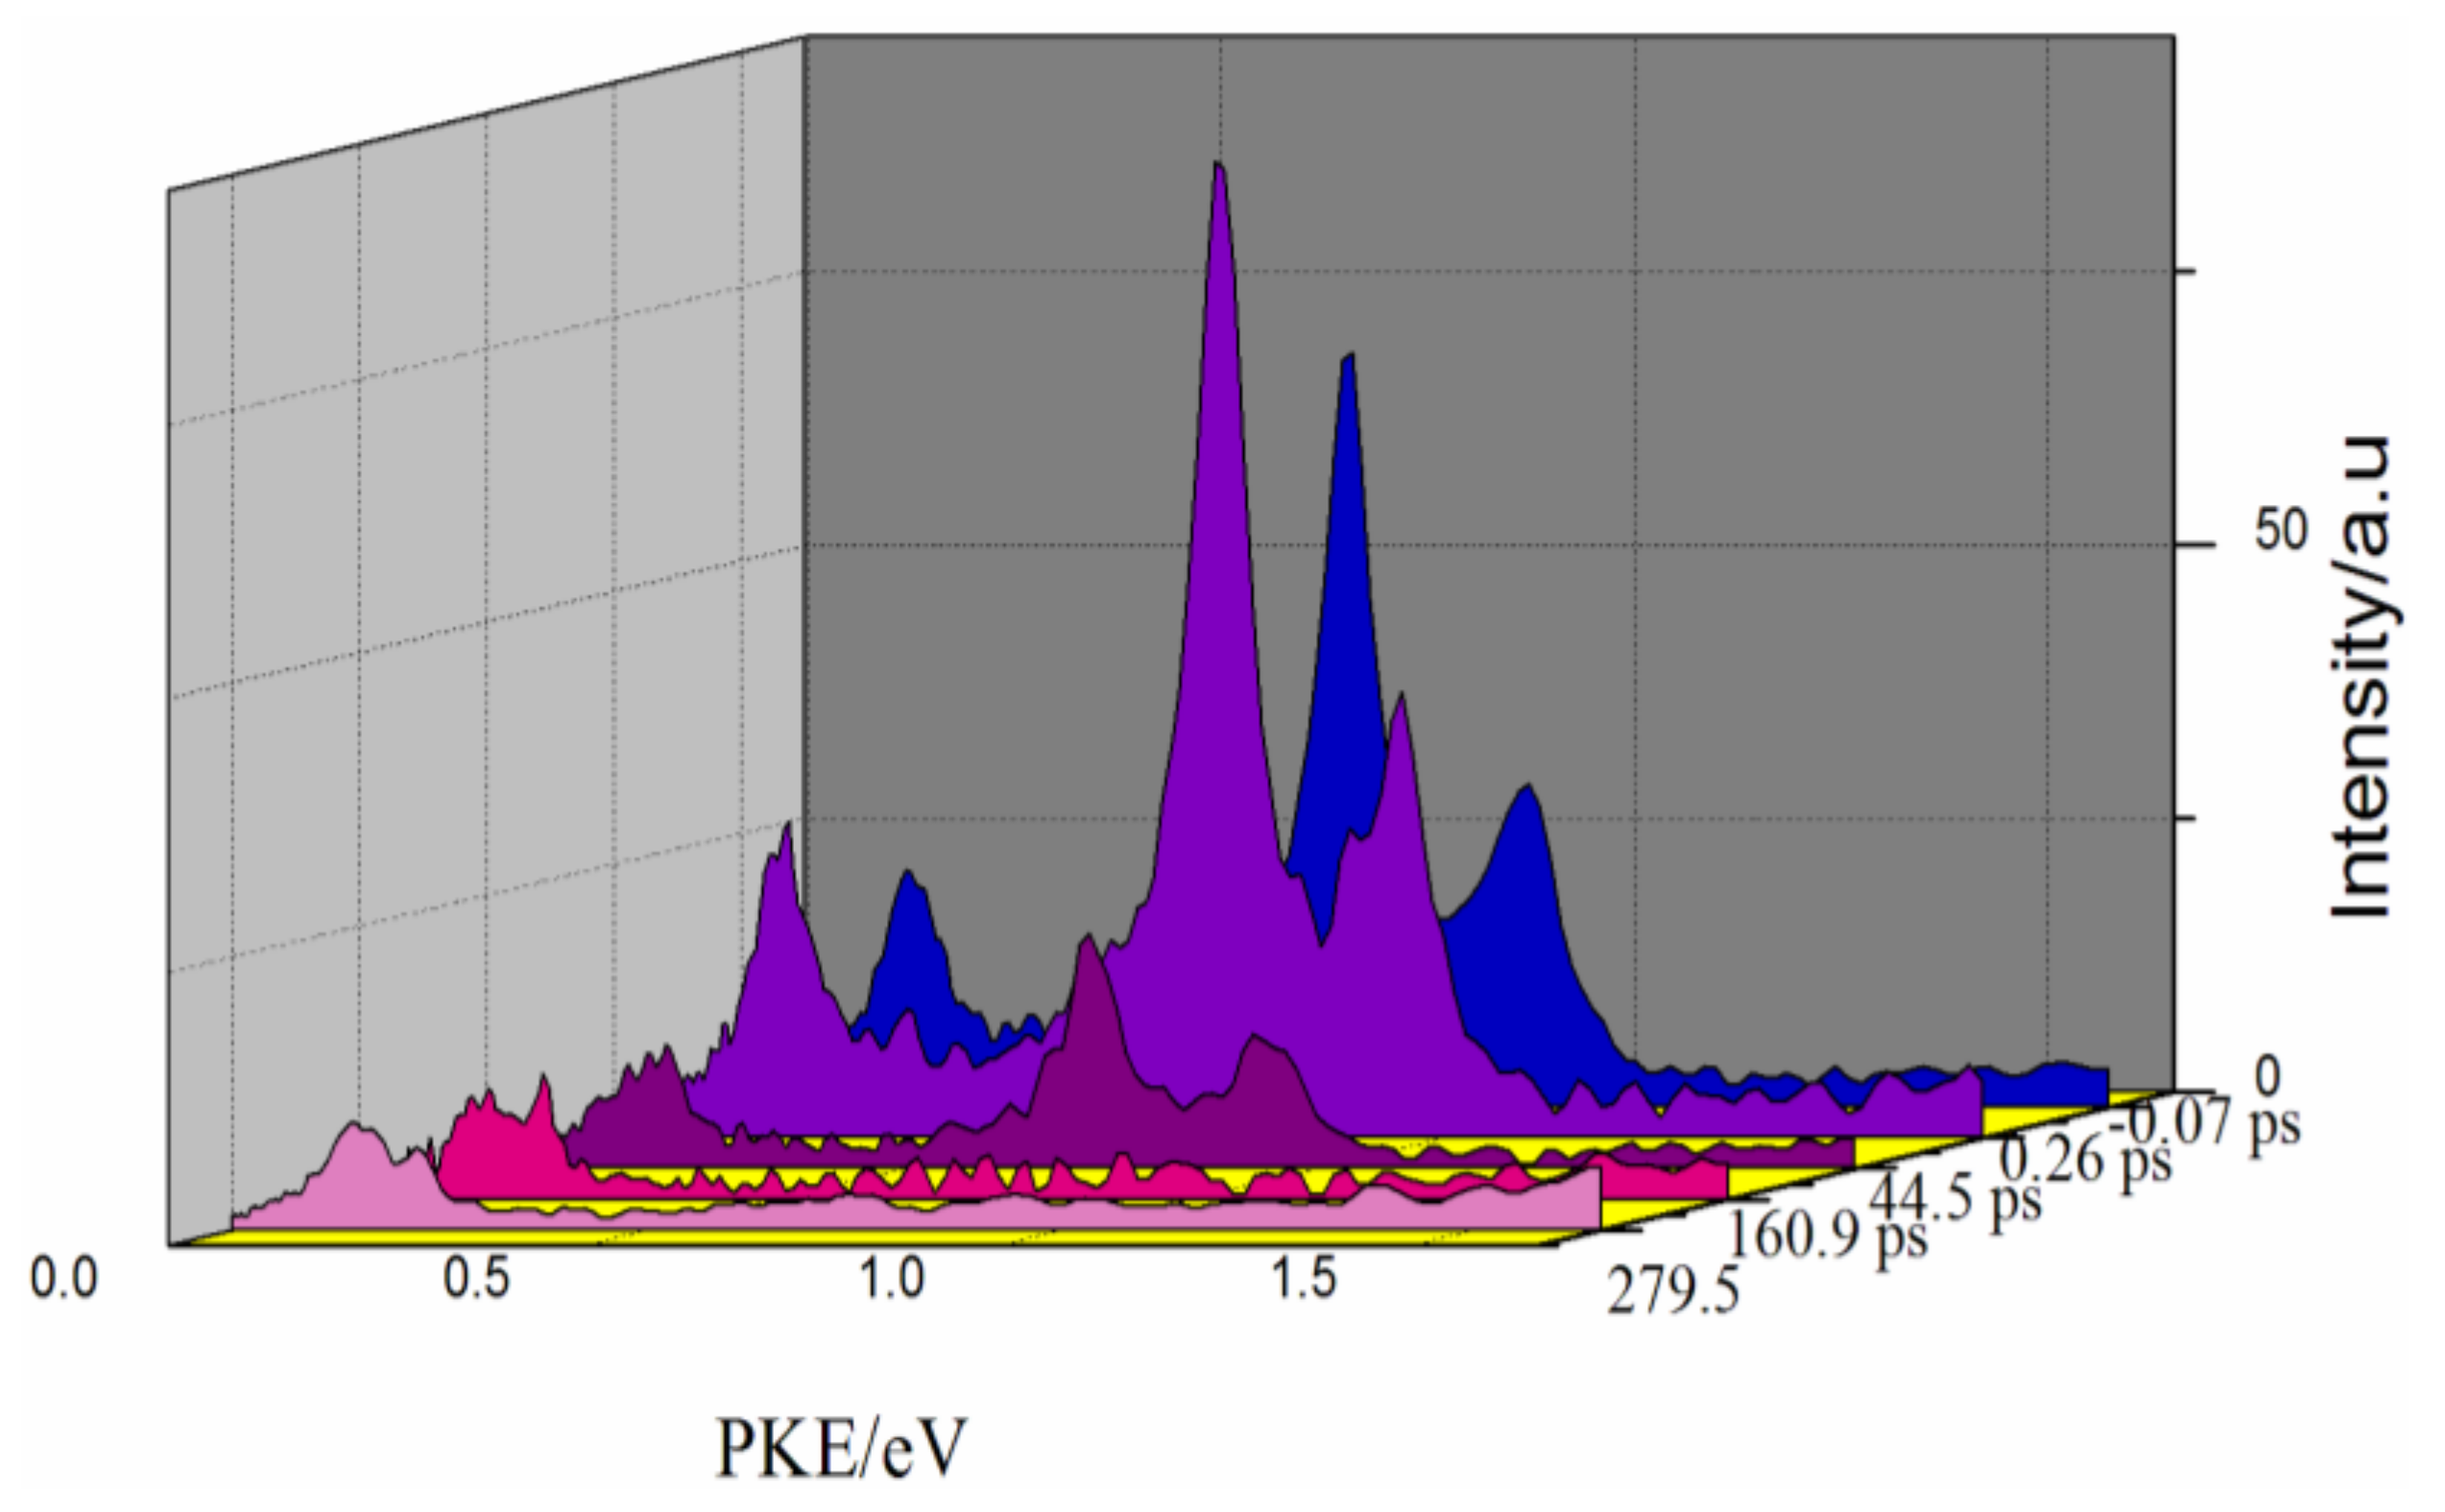
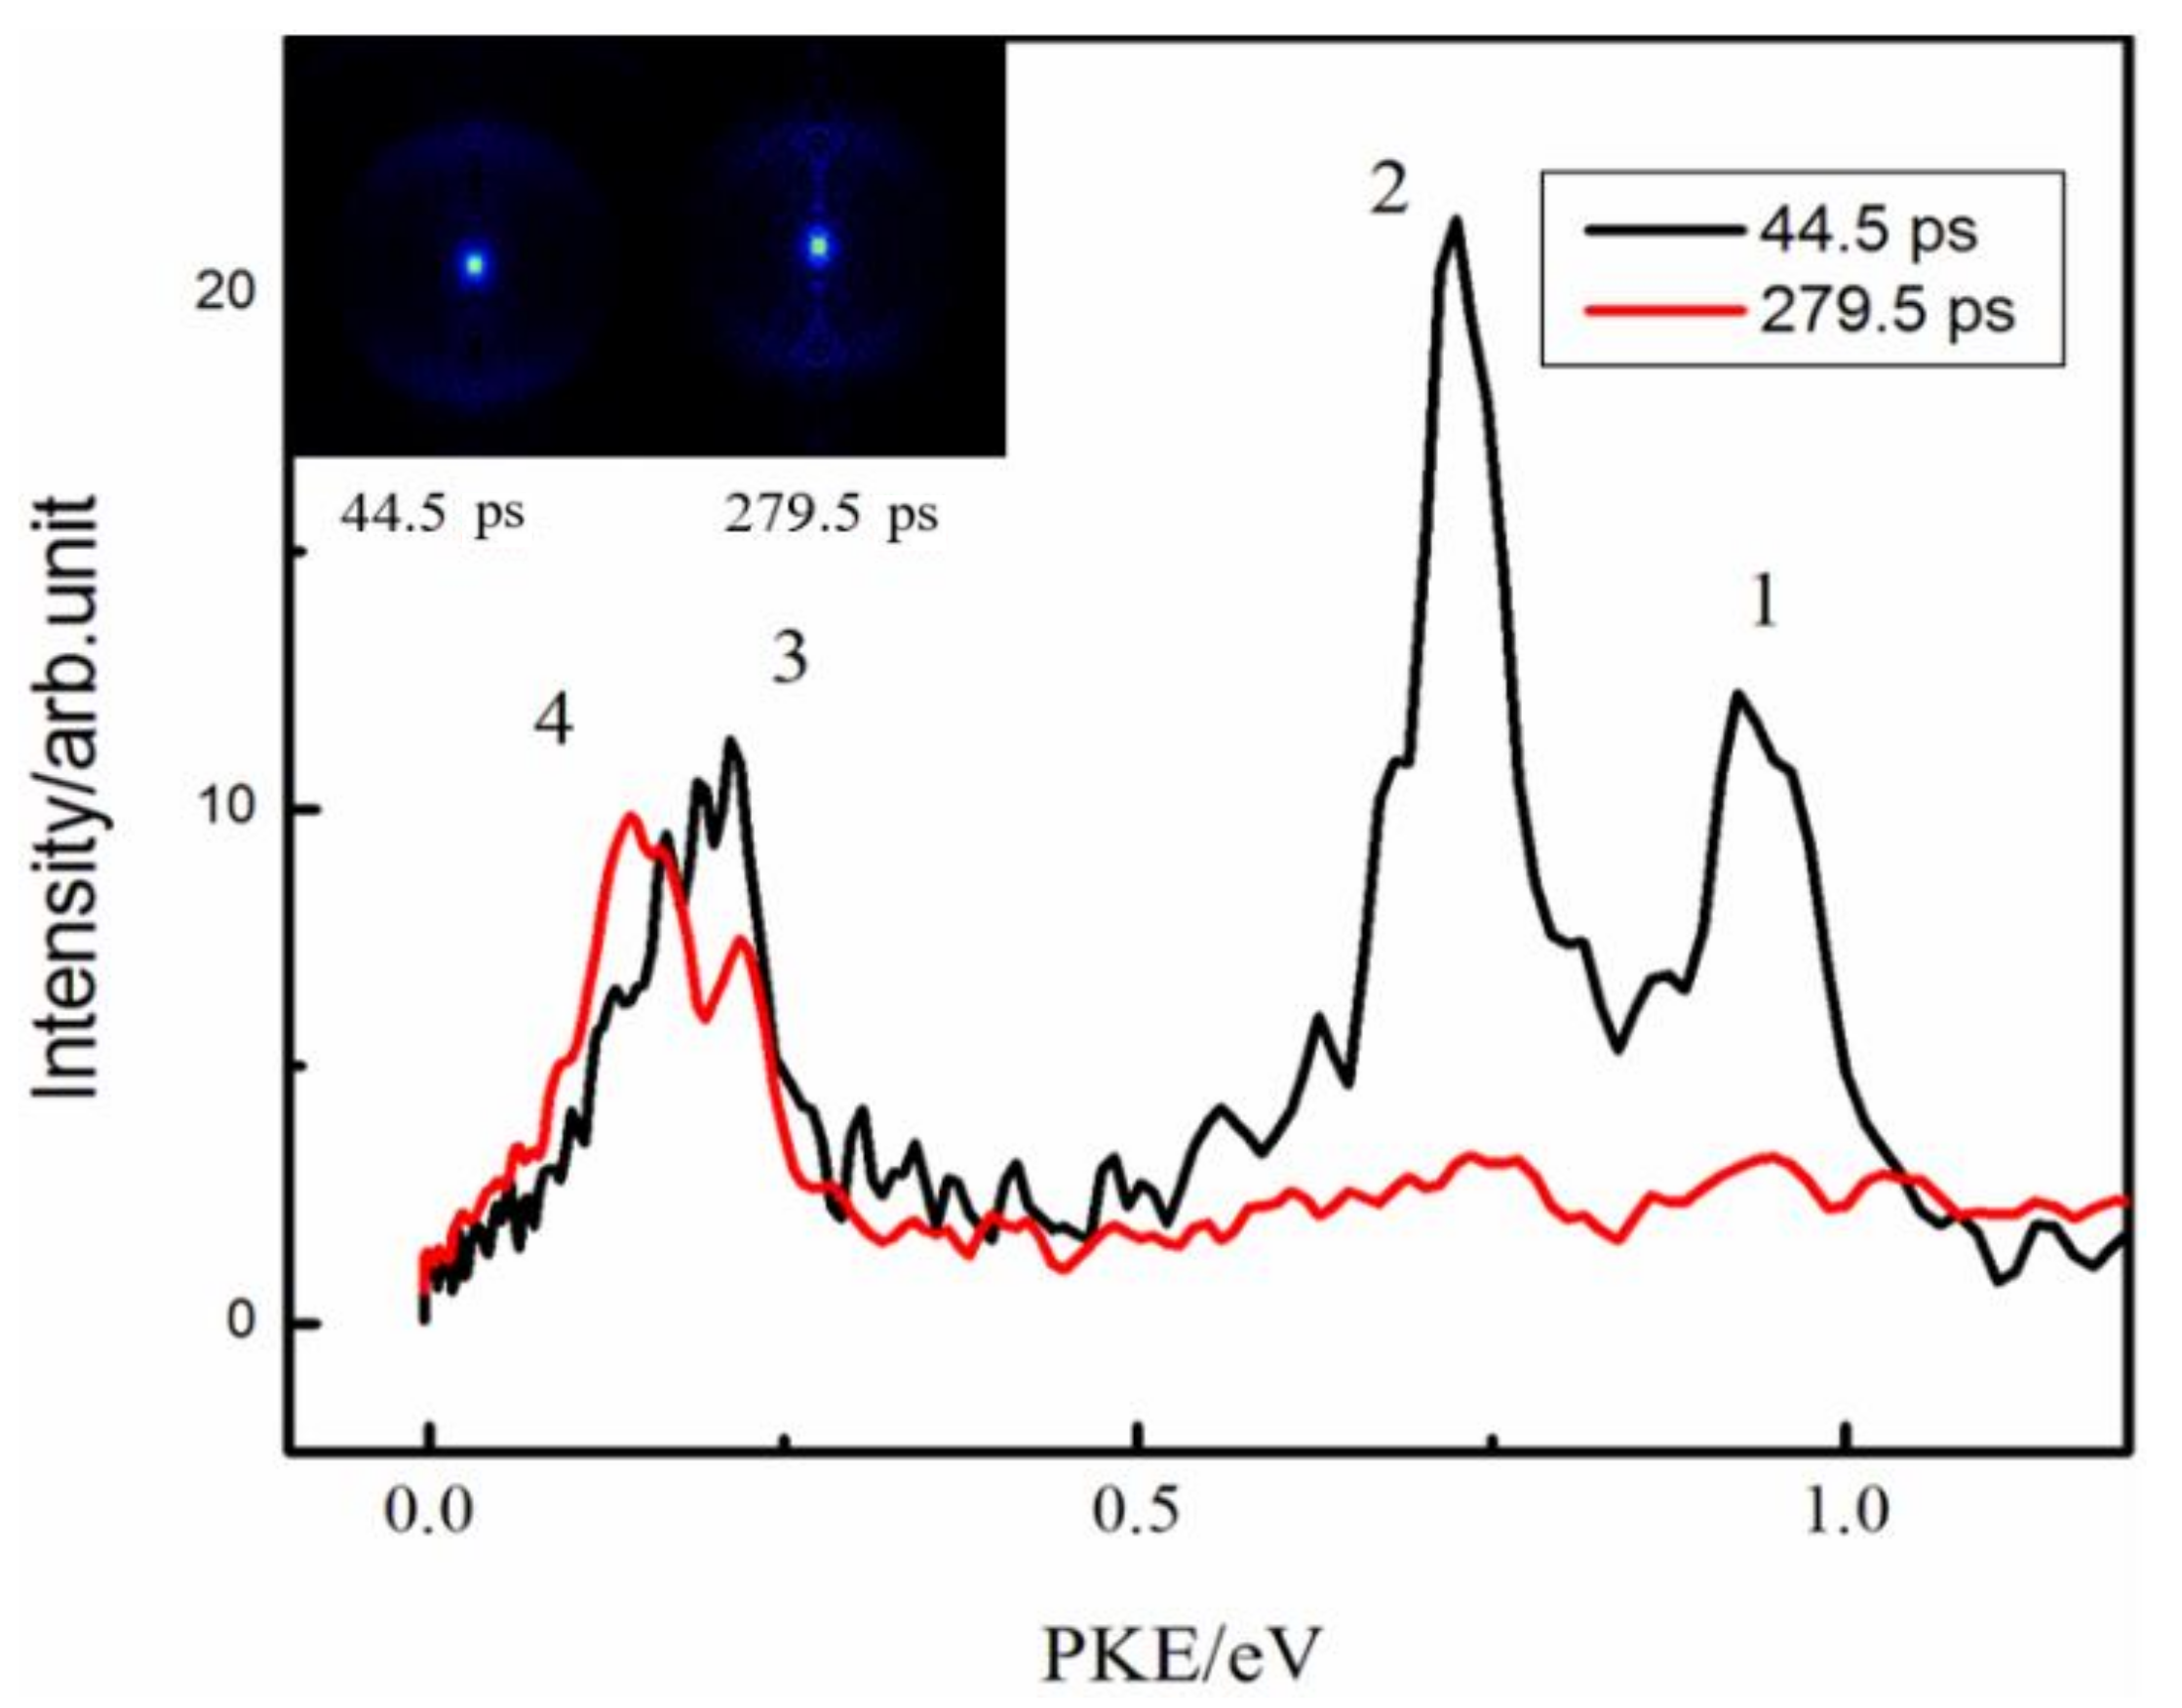
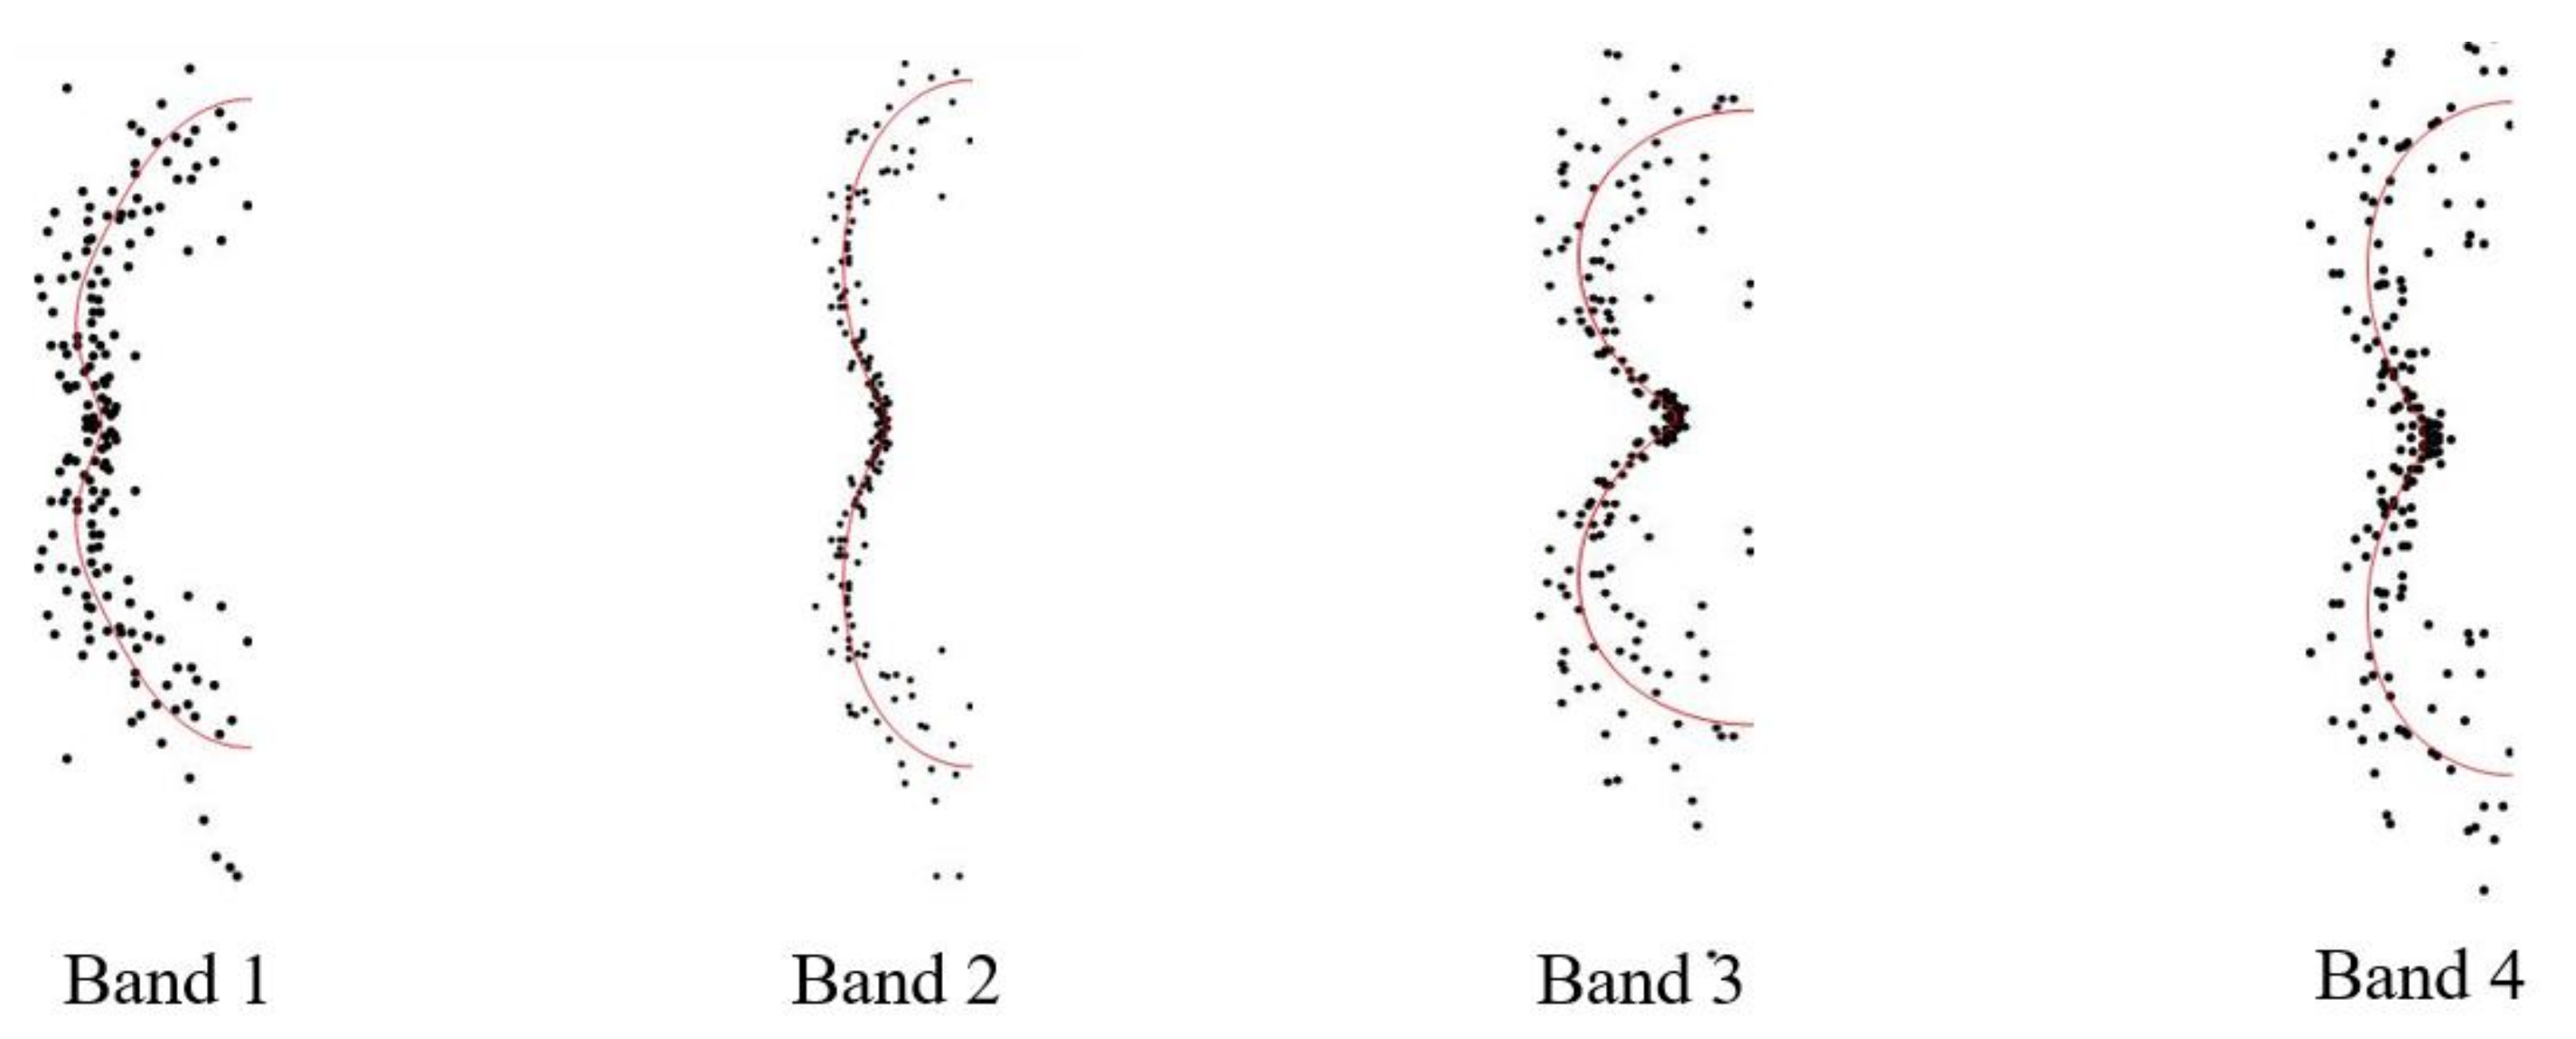
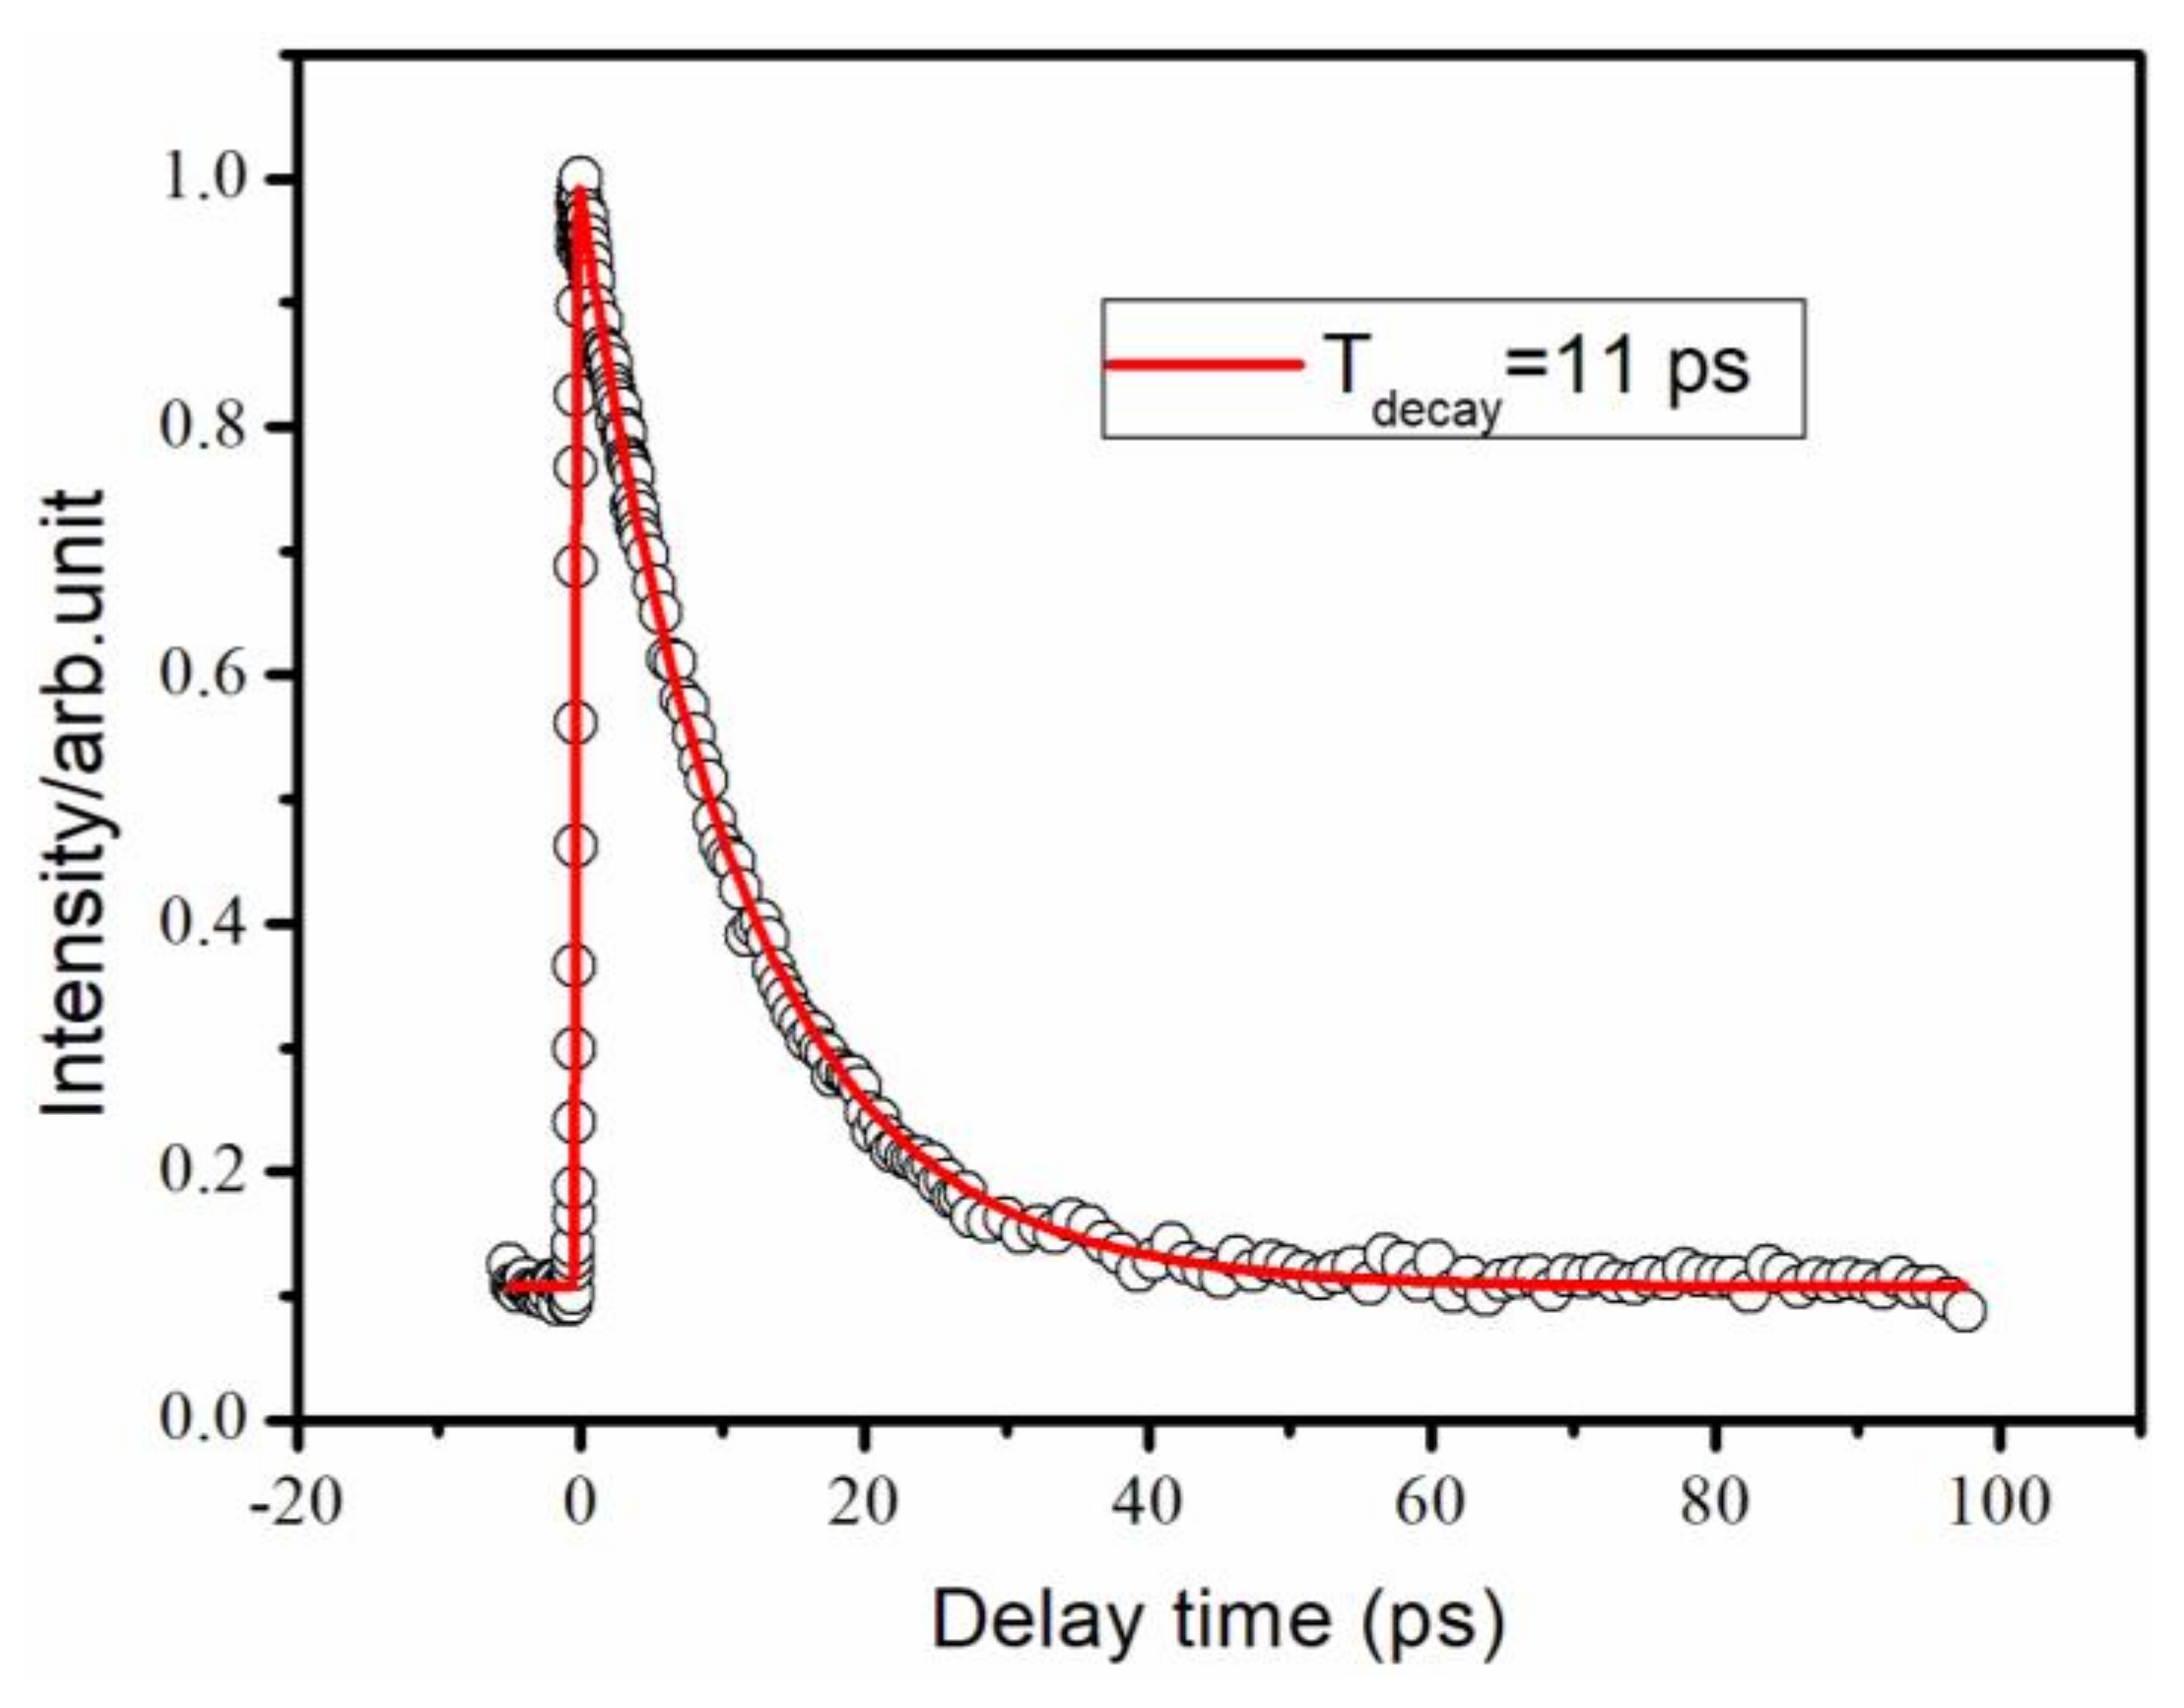
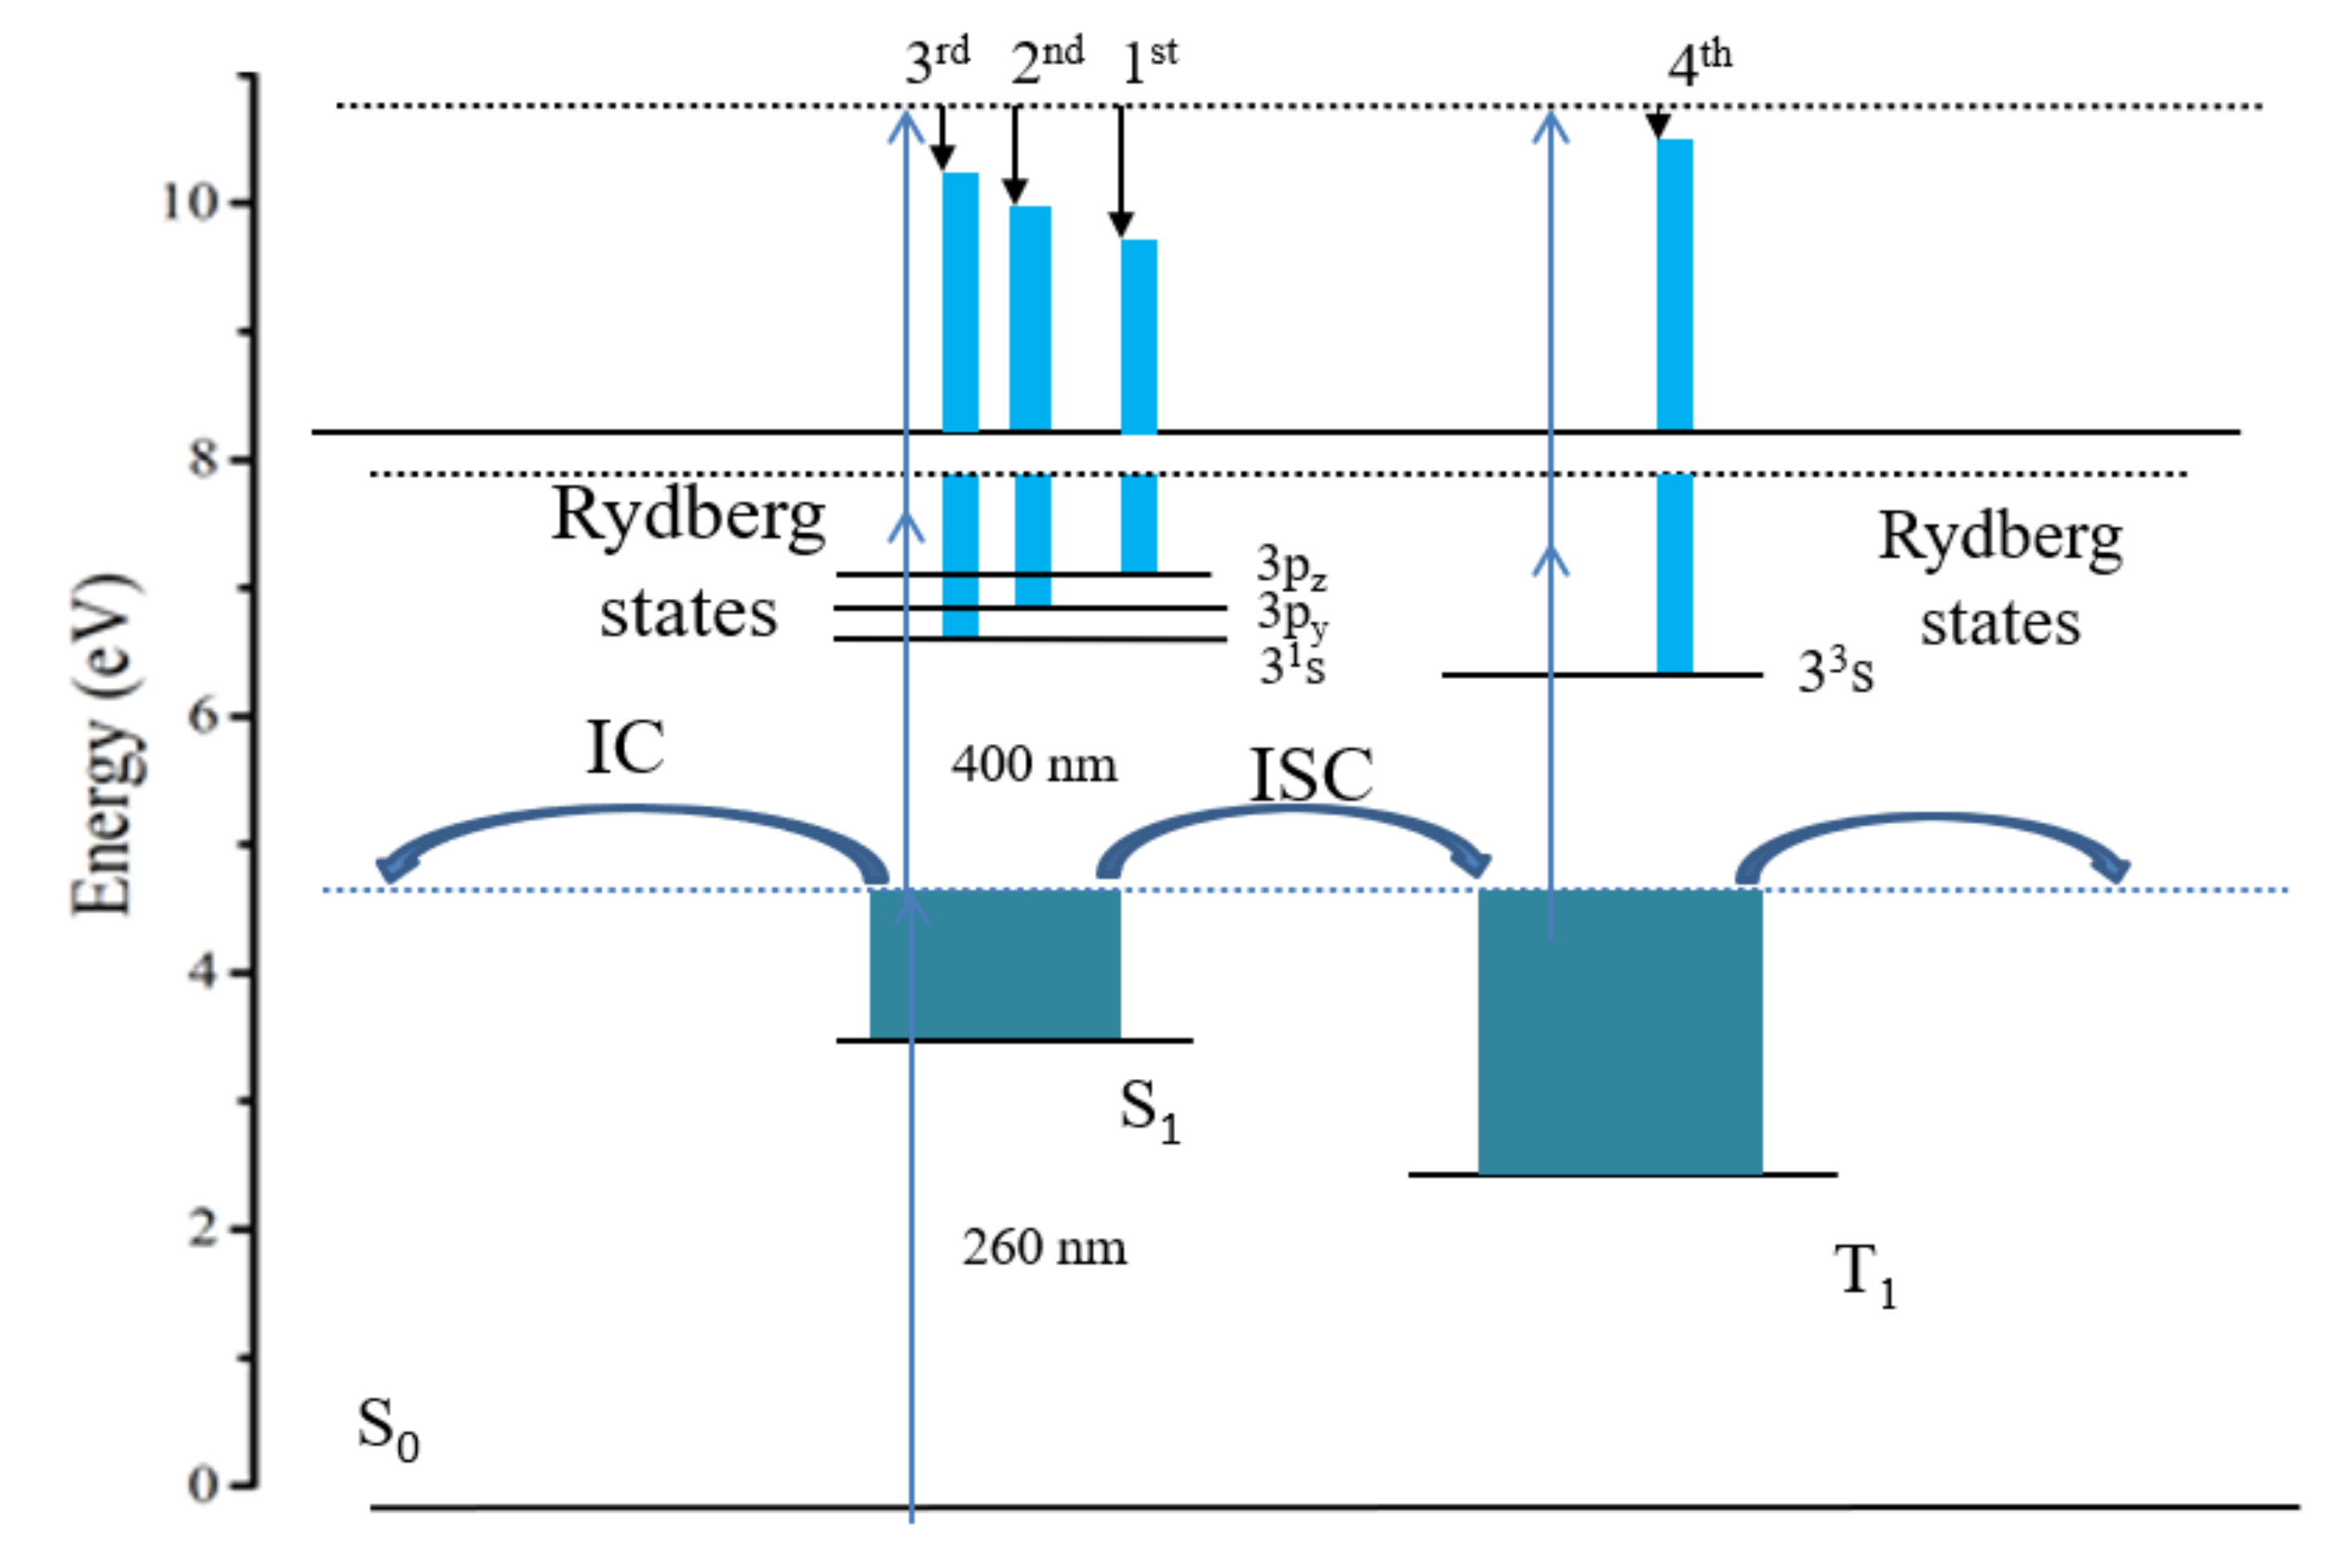
3. Results and Discussion
4. Conclusions
Author Contributions
Funding
Data Availability Statement
Conflicts of Interest
Sample Availability
References
- Ichihashi, M.; Ueda, M.; Budiyanto, A. UV-induced skin damage. Toxicology 2003, 189, 21. [Google Scholar] [CrossRef]
- Iqbal, A.; Stavros, V.G. Active participation of 1πσ* states in the photodissociation of tyrosine and its subunits. J. Phys. Chem. Lett. 2010, 1, 2274–2278. [Google Scholar] [CrossRef]
- Suzuki, T.; Wang, L.; Kohguchi, H. Femtosecond time-resolved photoelectron imaging on ultrafast electronic dephasing in an isolated molecule. J. Chem. Phys. 1999, 111, 4859–4861. [Google Scholar]
- Tsubouchi, M.; Whitaker, B.J.; Wang, L. Photoelectron imaging on time-dependent molecular alignment created by a femtosecond laser pulse. Phys. Rev. Lett. 2001, 86, 4500. [Google Scholar] [CrossRef]
- Farmanara, P.; Stert, V.; Radloff, W. Ultrafast Internal Conversion in Highly Excited Toluene Monomers and Dimers. J. Phys. Chem. A 2001, 105, 5613–5617. [Google Scholar] [CrossRef]
- Valverde, D.; de Araújo, A.V.S.; Borin, A.C. Photophysical Deactivation Mechanisms of the Pyrimidine Analogue 1-Cyclohexyluracil. Molecules 2021, 26, 5191. [Google Scholar] [PubMed]
- Radloff, W.; Stert, V.; Freudenberg, T.; Hertel, I.V.; Jouvet, C.; Dedonder-Lardeux, C.; Solgadi, D. Internal conversion in highly excited benzene and benzene dimer: Femtosecond time-resolved photoelectron spectroscopy. Chem. Phys. Lett. 1997, 281, 20–26. [Google Scholar] [CrossRef]
- Minns, R.S.; Parker, S.N.D.; Penfold, T.J.; Worth, G.A.; Fielding, H.H. Competing ultrafast intersystem crossing and internal conversion in the “channel 3” region of benzene. Phys. Chem. Chem. Phys. 2010, 12, 15607–15615. [Google Scholar] [CrossRef]
- Riedle, E.; Neusser, H.J.; Schlag, E.W. Sub-Doppler high-resolution spectra of benzene: Anomalous results in the \“channel three\” region. J. Phys. Chem. 1982, 86, 4847–4850. [Google Scholar] [CrossRef]
- Suzuki, Y.-I.; Horio, T.; Fuji, T. Time-resolved photoelectron imaging of S2→S1 internal conversion in benzene and toluene. J. Chem. Phys. 2011, 134, 369. [Google Scholar] [CrossRef]
- Lee, S.H.; Tang, K.C.; Chen, I.C.; Schmitt, M.; Shaffer, J.P. Substituent Effects in Molecular Electronic Relaxation Dynamics via Time-Resolved Photoelectron Spectroscopy: ππ* States in Benzenes. J. Phys. Chem. A 2002, 106, 8979–8991. [Google Scholar] [CrossRef] [Green Version]
- Cheng, P.Y.; Zhong, D.; Zewail, A.H. Kinetic-energy, femtosecond resolved reaction dynamics. Modes of dissociation (in iodobenzene) from time-velocity correlations. Chem. Phys. Lett. 1995, 237, 399–405. [Google Scholar] [CrossRef]
- Soren, P.; Ahmed, Z. Femtosecond real-time probing of reactions XXII. Kinetic description of probe absorption, fluorescence, depletion and mass spectrometry. Mol. Phys. 1996, 89, 1455–1502. [Google Scholar]
- Liu, Y.; Tang, B.; Shen, H. Probing ultrafast internal conversion of o-xylene via femtosecond time-resolved photoelectron imaging. Opt. Express 2010, 18, 5791–5801. [Google Scholar] [CrossRef]
- Dantus, M.; Rosker, M.J.; Zewail, A.H. Real-time femtosecond probing of “transition states” in chemical reactions. J. Chem. Phys. 1987, 87, 2395. [Google Scholar] [CrossRef]
- Callomon, J.H.; Dunn, T.M.; Mills, I.M. Rotational analysis of the 2600 angstrom absorption system of benzene. Philos. Trans. R. Soc. A 1966, 259, 499–532. [Google Scholar]
- Otis, C.E.; Knee, J.L.; Johnson, P.M. Nonradiative processes in the channel three region of the S1 state of ultracold benzene. J. Phys. Chem. 1983, 87, 2232–2239. [Google Scholar] [CrossRef]
- Frad, A. Luminescence and radiationless transitions from single vibronic levels of the isolated pyrazine molecule in the S 1(n,π*) state. J. Chem. Phys. 1974, 60, 4419–4430. [Google Scholar] [CrossRef]
- Lahmani, F. Nonexponential decays in single vibronic level fluorescence: A comparison between kinetics and quantum mechanical treatment. J. Chem. Phys. 1974, 60, 4431–4447. [Google Scholar] [CrossRef]
- Yamazaki, I.; Murao, T.; Yoshihara, K. Picosecond fluorescence decays from vibrational levels in the S1(n,π*) state of pyridine vapor. Chem. Phys. Lett. 1982, 92, 421–424. [Google Scholar] [CrossRef]
- Green, J.A.; Jouybari, M.Y.; Aranda, D. Nonadiabatic Absorption Spectra and Ultrafast Dynamics of DNA and RNA Photoexcited Nucleobases. Molecules 2021, 26, 1743. [Google Scholar] [CrossRef]
- De Pieter, J. The absolute value of the quantum yield of the fluorescence of the 1 B 3u 0–0 state of pyrazine as a function of the rotational quantum numbers. J. Chem. Phys. 1987, 86, 4004–4010. [Google Scholar]
- Zhong, D.; Diau, W.G.; Bernhardt, T.M. Femtosecond dynamics of valence-bond isomers of azines: Transition states and conical intersections. Chem. Phys. Lett. 1998, 298, 129–140. [Google Scholar] [CrossRef]
- Yan, Y.H.; Long, J.Y.; Liu, Y.Z. Study on photodynamics of furan via strong field multiphoton ionization by velocity map imaging technique. Chem. Phys. 2020, 530, 110611. [Google Scholar]
- Hertel, I.V.; Radloff, W. Ultrafast dynamics in isolated molecules and molecular clusters. Rep. Prog. Phys. 2006, 69, 1897–2003. [Google Scholar] [CrossRef] [Green Version]
- Dribinski, V.; Ossadtchi, A.; Mandelshtam, V.A. Reconstruction of Abel-transformable images: The Gaussian basis-set expansion Abel transform method. Rev. Sci. Instrum. 2002, 73, 2634–2642. [Google Scholar] [CrossRef]
- Liu, Y.Z.; Chen, Y.Y.; Zheng, G.G. Multiphoton ionization and dissociation dynamics of Freon-113 induced by femtosecond laser pulse. Acta Phys. Sin.-Chin. Ed. 2016, 65, 053302. [Google Scholar] [CrossRef]
- Tsubouchi, M.; Suzuki, T. Femtosecond Photoelectron Imaging on Pyridine: Ultrafast Electronic Dephasing from the S 1 (n π*) State and Rydberg State Energetics. J. Phys. Chem. A 2003, 107, 10897–10903. [Google Scholar]
- Suzuki, T.; Wang, L.; Tsubouchi, M. Femtosecond Photoelectron Imaging on Pyrazine: (1 + 2’) REMPI of Deuterated Pyrazine. J. Phys. Chem. A 2004, 108, 5764–5769. [Google Scholar] [CrossRef]
- Abulimiti, B.; Zhu, R.; Long, J. Study of ultrafast dynamics of 2-picoline by time-resolved photoelectron imaging. J. Chem. Phys. 2011, 134, 234301. [Google Scholar] [CrossRef]
- Abulimiti, B.; Fengzi, L.; Xulan, D. Intersystem crossing of 2-Methlypyrazine studied by femtosecond photoelectron imaging. Acta Phys. Sin. 2020, 69, 171–178. [Google Scholar]


| State | Transition | Eexc/eV (cal) | f | Eexc/eV (exp) |
|---|---|---|---|---|
| S1 | 25→26 | 3.93 | 0.0055 | 3.838 |
| S2 | 25→27 | 4.69 | 0.0001 | - |
| S3 | 24→26 | 5.51 | 0.1157 | - |
| S4 | 23→26 | 5.54 | 0.0000 | - |
| S5 | 25→28 | 6.25 | 0.0071 | - |
| S6 | 22→26 | 6.31 | 0.0997 | - |
Publisher’s Note: MDPI stays neutral with regard to jurisdictional claims in published maps and institutional affiliations. |
© 2022 by the authors. Licensee MDPI, Basel, Switzerland. This article is an open access article distributed under the terms and conditions of the Creative Commons Attribution (CC BY) license (https://creativecommons.org/licenses/by/4.0/).
Share and Cite
Wumaierjiang, N.; Abulimiti, B.; Ling, F.; Xiang, M.; Deng, X.; Wei, J.; Zhang, B. Intersystem Crossing of 2-Methlypyrazine Studied by Femtosecond Photoelectron Imaging. Molecules 2022, 27, 6245. https://0-doi-org.brum.beds.ac.uk/10.3390/molecules27196245
Wumaierjiang N, Abulimiti B, Ling F, Xiang M, Deng X, Wei J, Zhang B. Intersystem Crossing of 2-Methlypyrazine Studied by Femtosecond Photoelectron Imaging. Molecules. 2022; 27(19):6245. https://0-doi-org.brum.beds.ac.uk/10.3390/molecules27196245
Chicago/Turabian StyleWumaierjiang, Naipisai, Bumaliya Abulimiti, Fengzi Ling, Mei Xiang, Xulan Deng, Jie Wei, and Bing Zhang. 2022. "Intersystem Crossing of 2-Methlypyrazine Studied by Femtosecond Photoelectron Imaging" Molecules 27, no. 19: 6245. https://0-doi-org.brum.beds.ac.uk/10.3390/molecules27196245