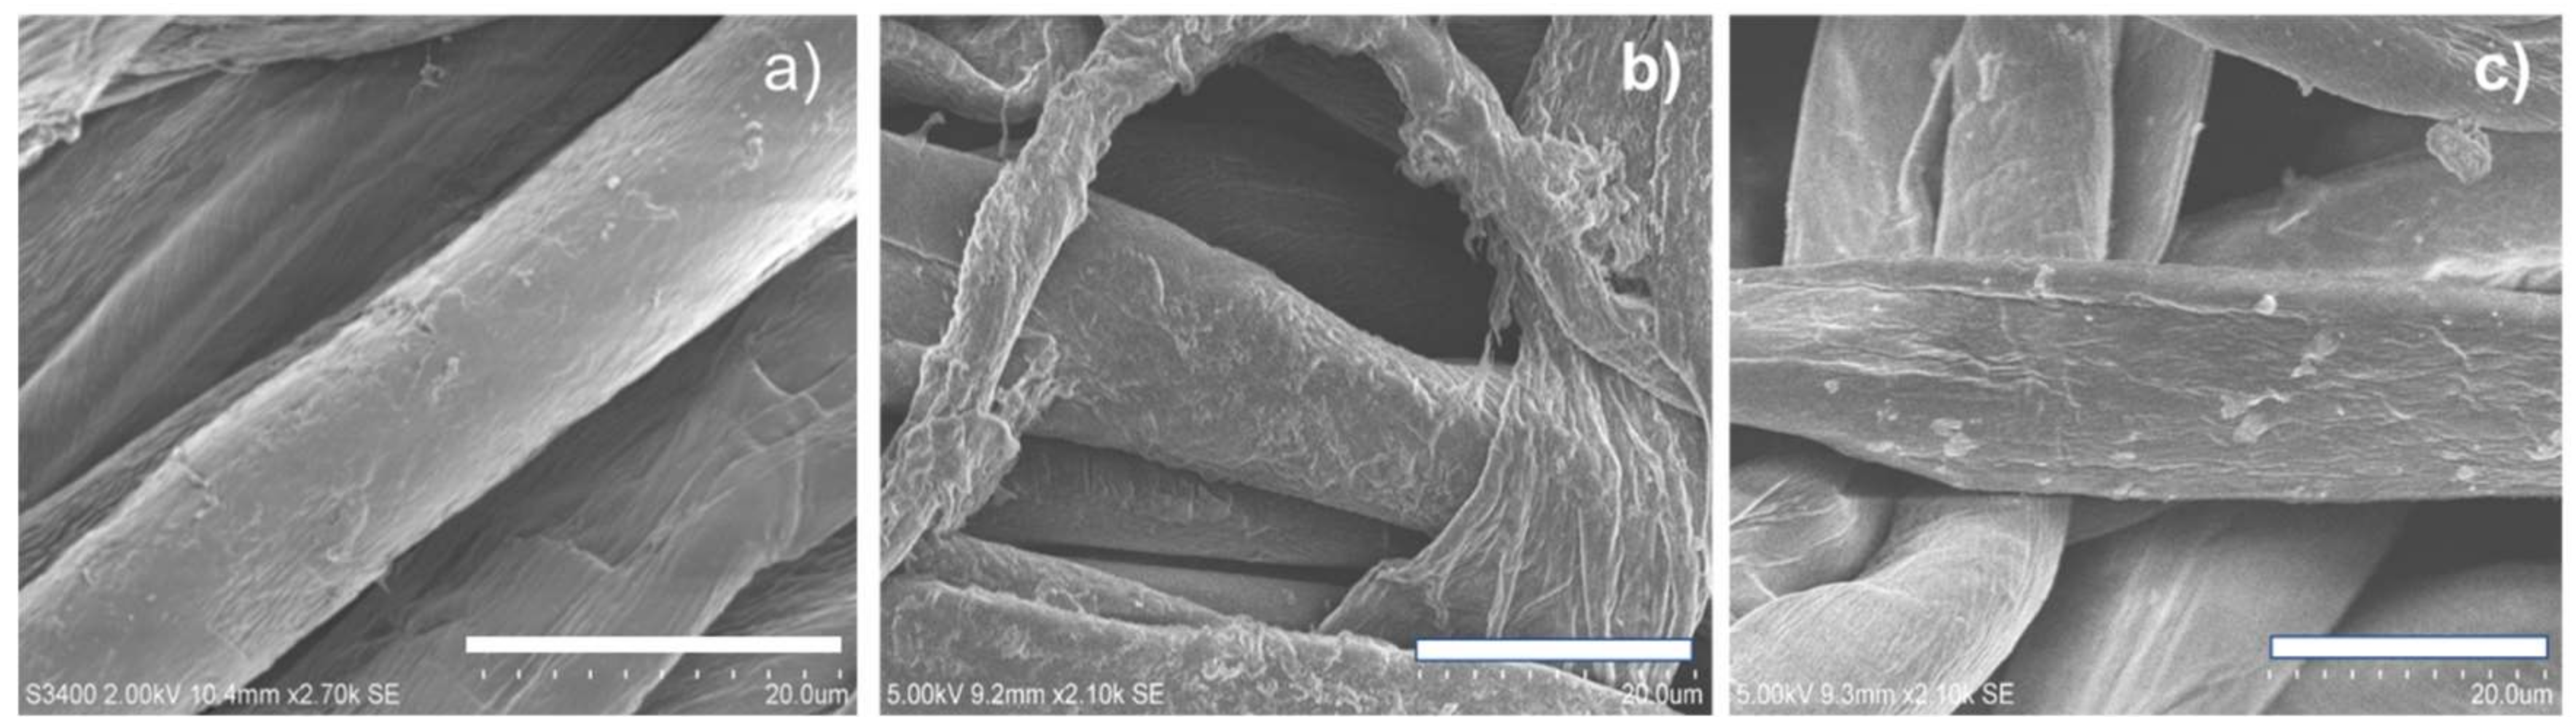
Figure 1.
SEM images of cotton samples before and after coating with GM (a) Pure cotton (Cot), (b) without plasma/UV treatment (Cot/GM), (c) after N2-O2 plasma/UV laser treatment (Cot/GM_ PL(N2/O2); all samples before water-soaking.
Figure 1.
SEM images of cotton samples before and after coating with GM (a) Pure cotton (Cot), (b) without plasma/UV treatment (Cot/GM), (c) after N2-O2 plasma/UV laser treatment (Cot/GM_ PL(N2/O2); all samples before water-soaking.
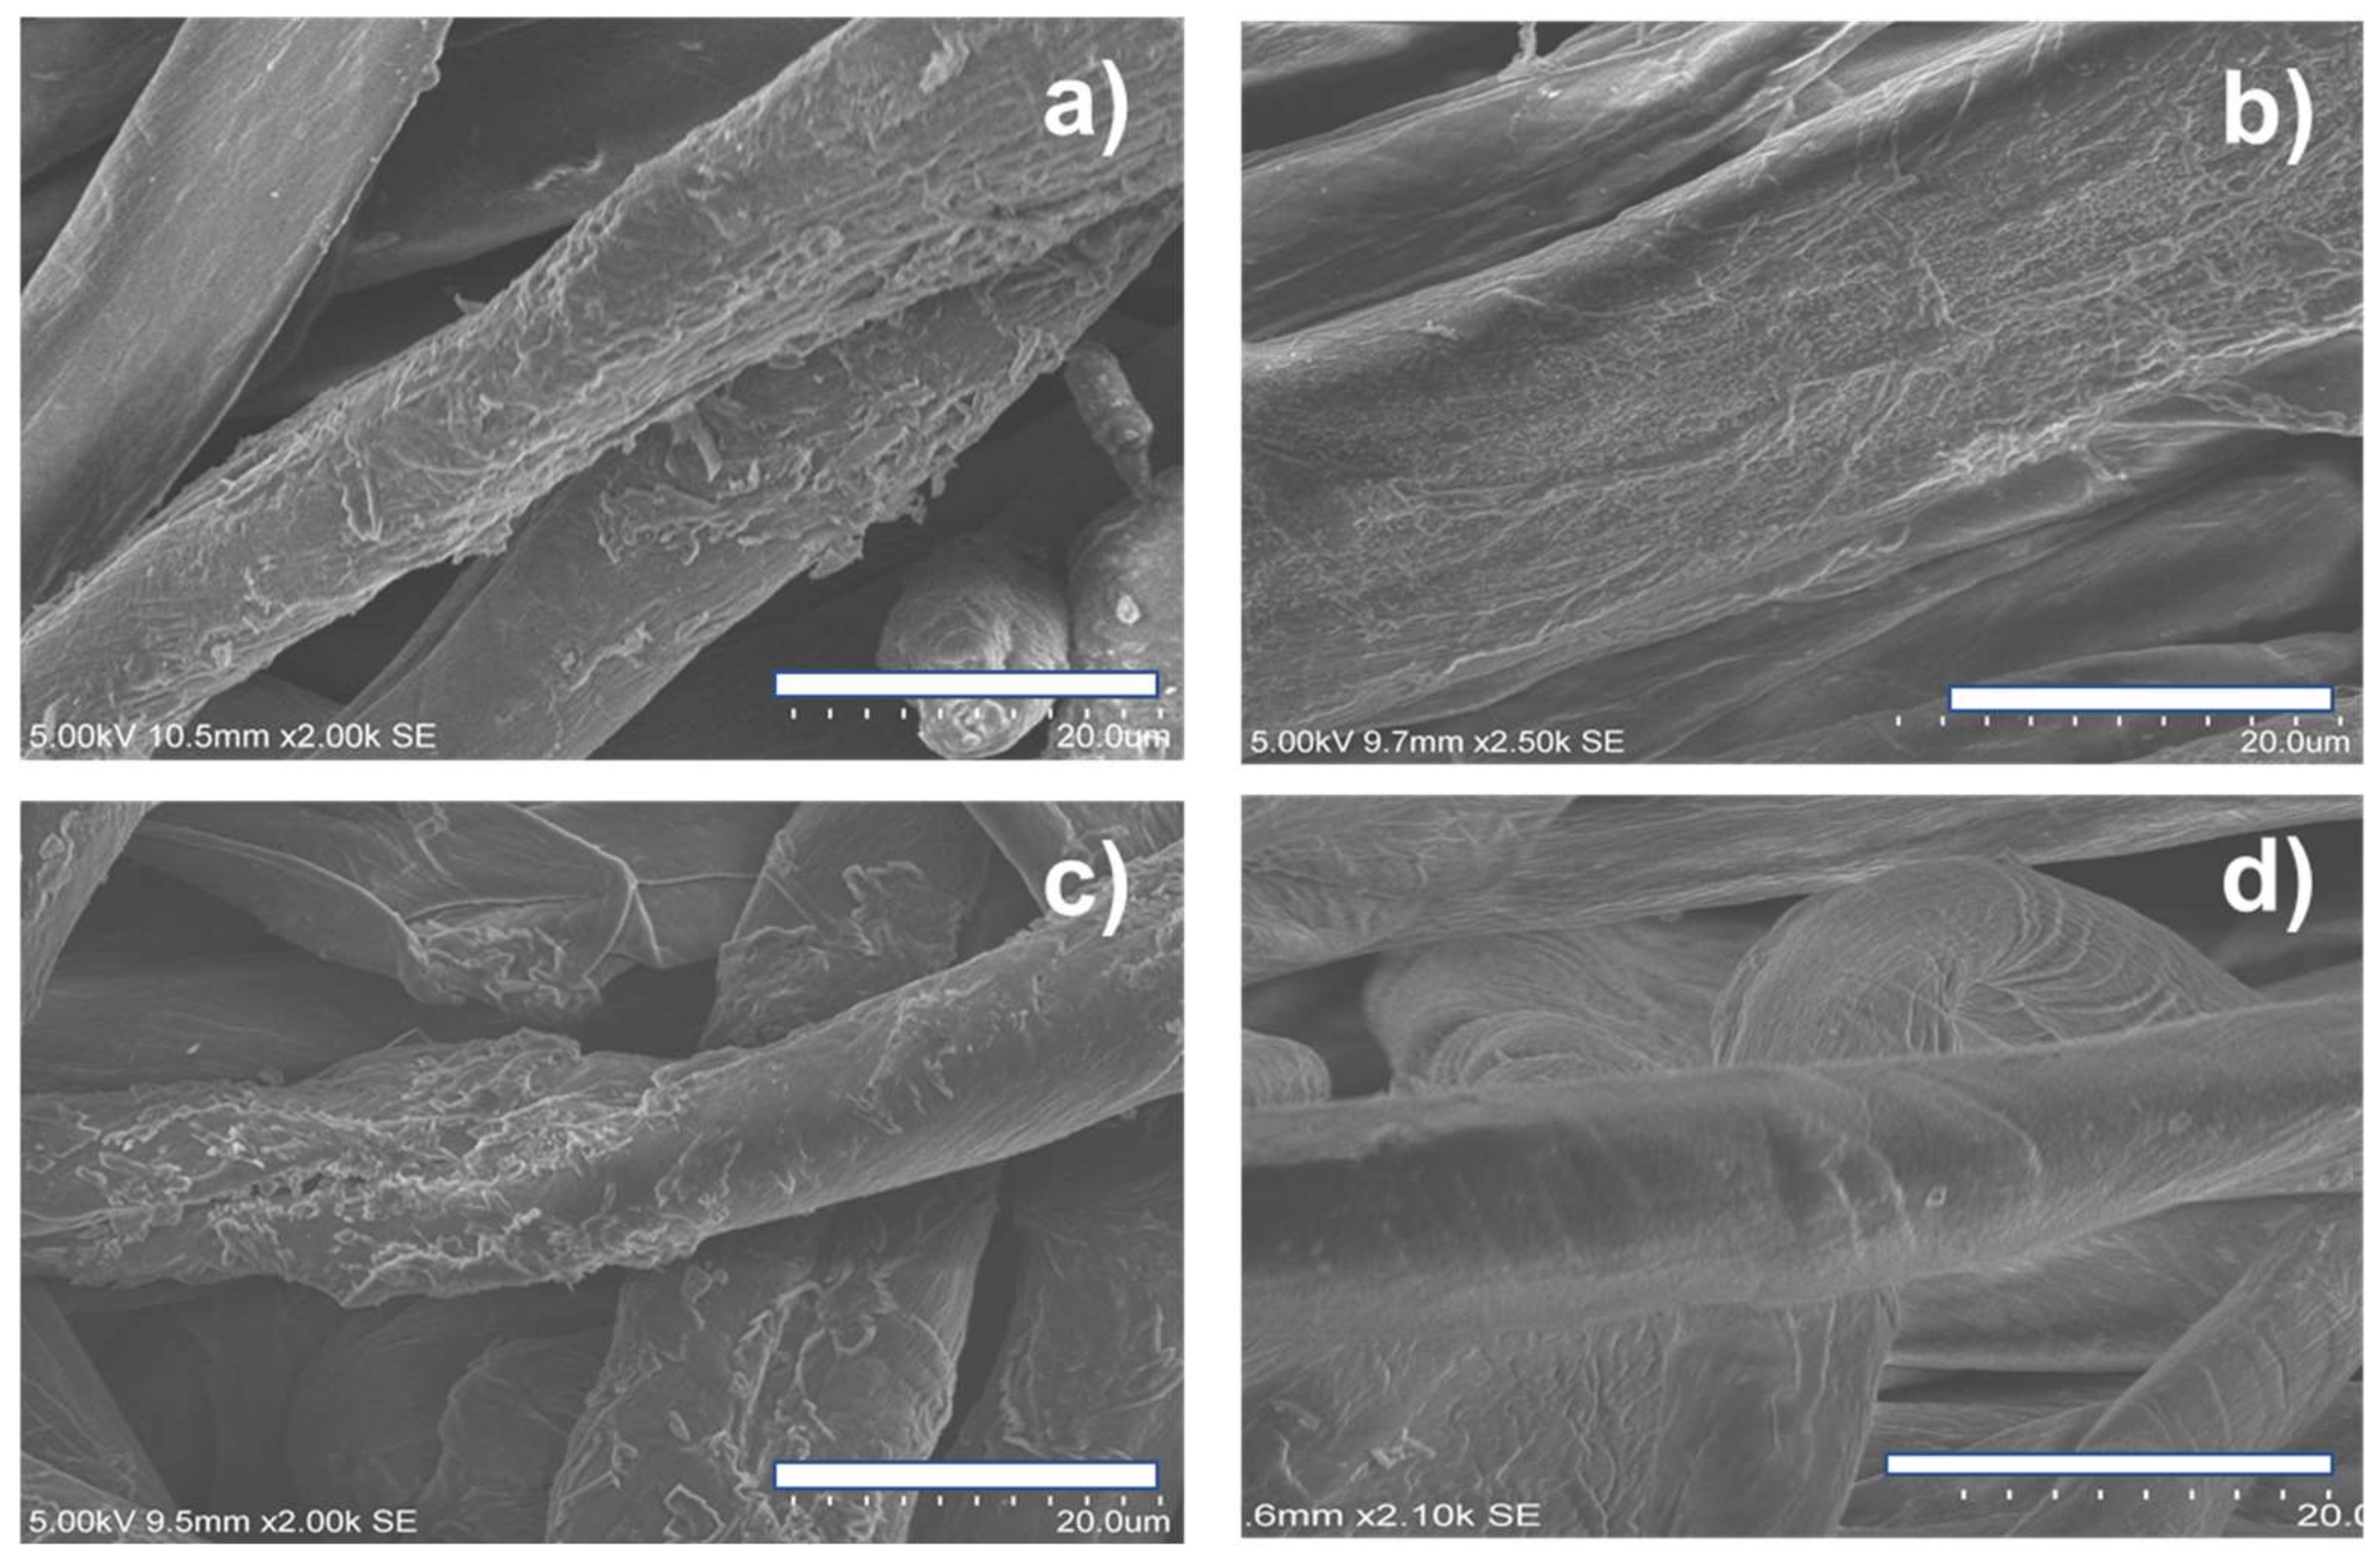
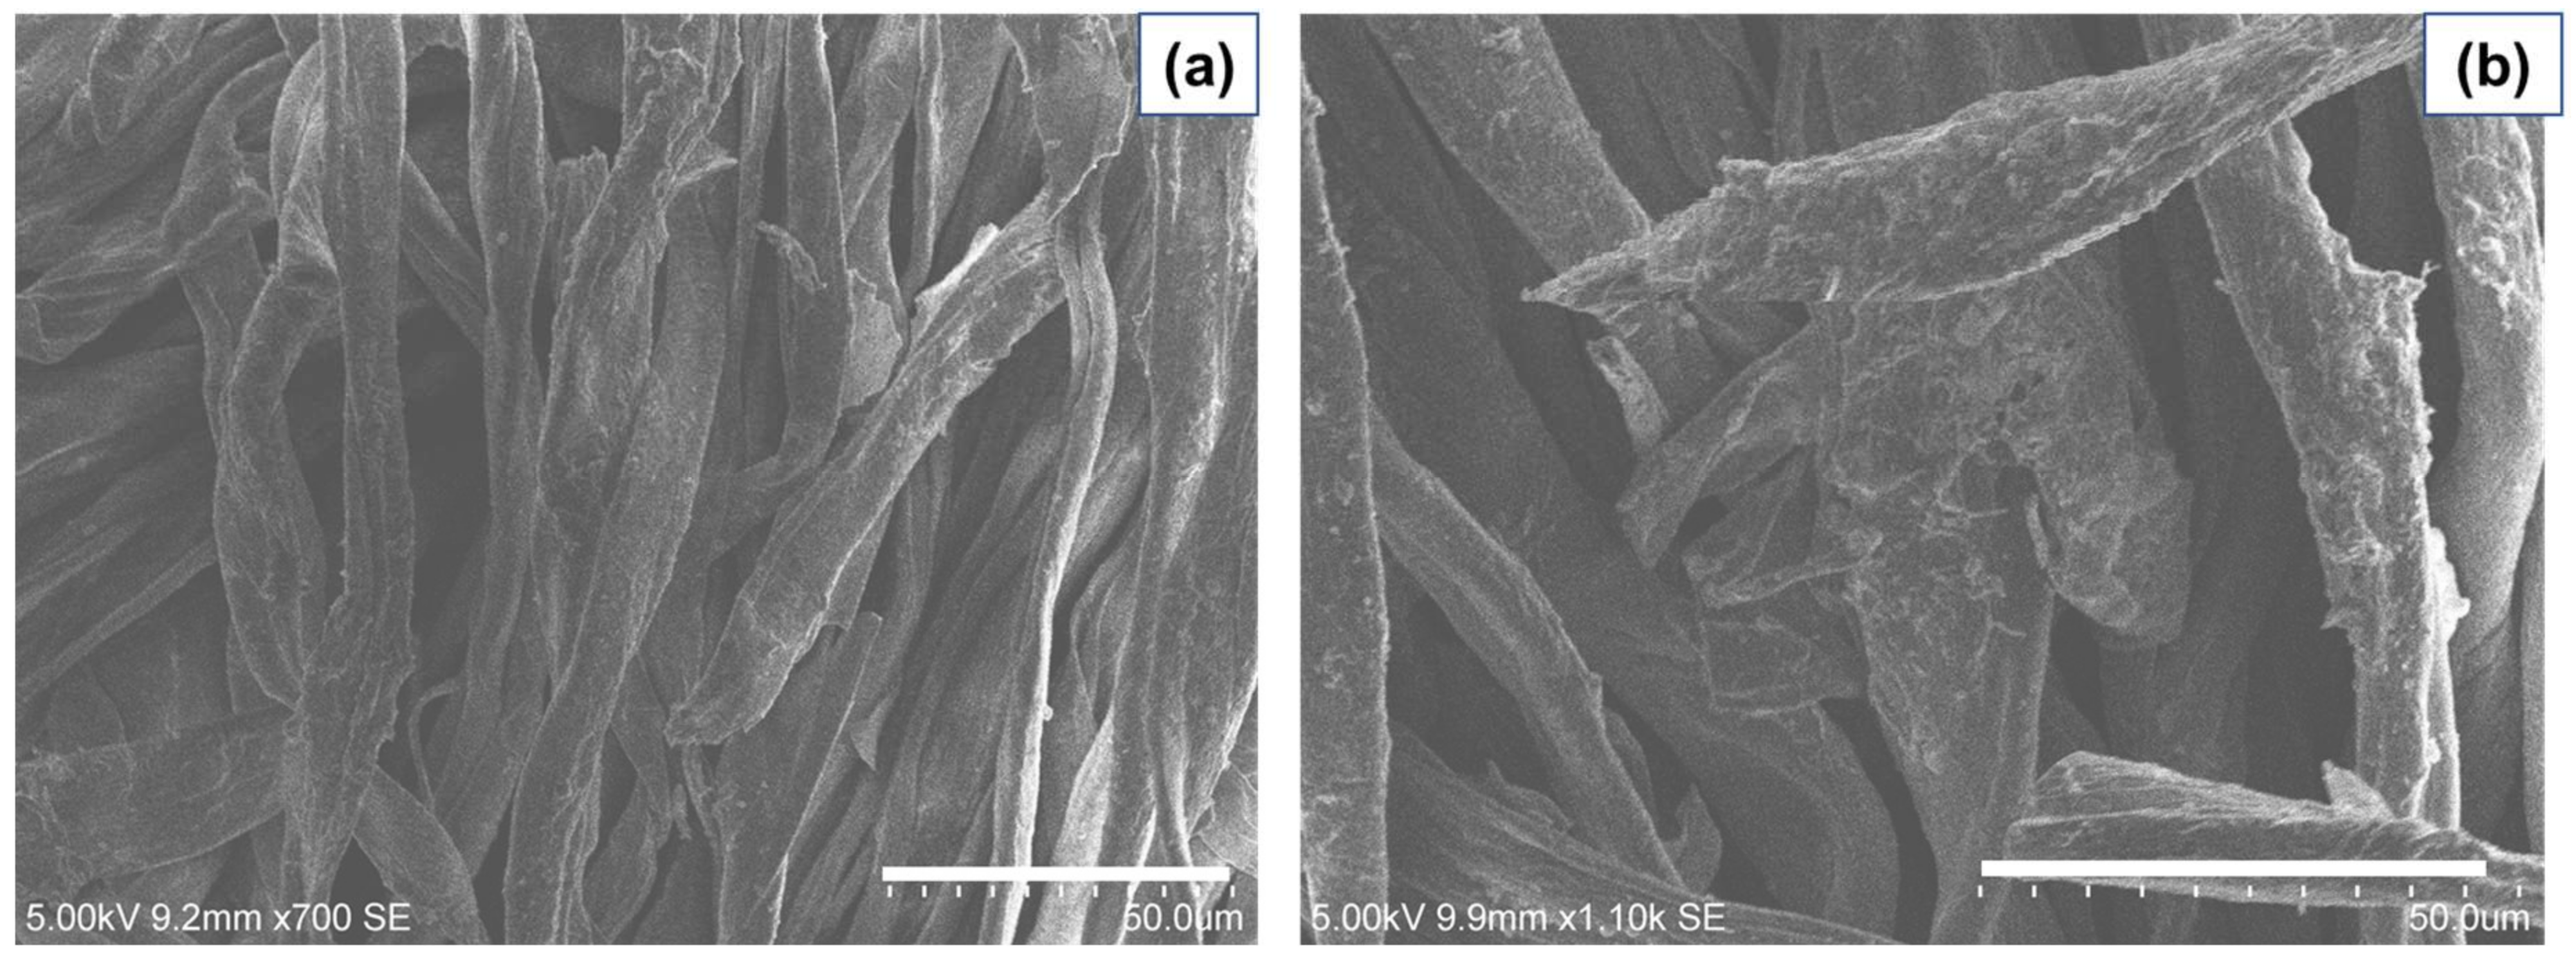
Figure 2.
SEM images of unexposed cotton samples coated with GM and APTS, Cot/GM-APTS, (a) before and (b) after water-soaking; plasma-treated (Cot/GM-APTS_PL(N2/O2)) samples (c) before and (d) after water-soaking. Horizontal scale bars equal 20µm.
Figure 2.
SEM images of unexposed cotton samples coated with GM and APTS, Cot/GM-APTS, (a) before and (b) after water-soaking; plasma-treated (Cot/GM-APTS_PL(N2/O2)) samples (c) before and (d) after water-soaking. Horizontal scale bars equal 20µm.
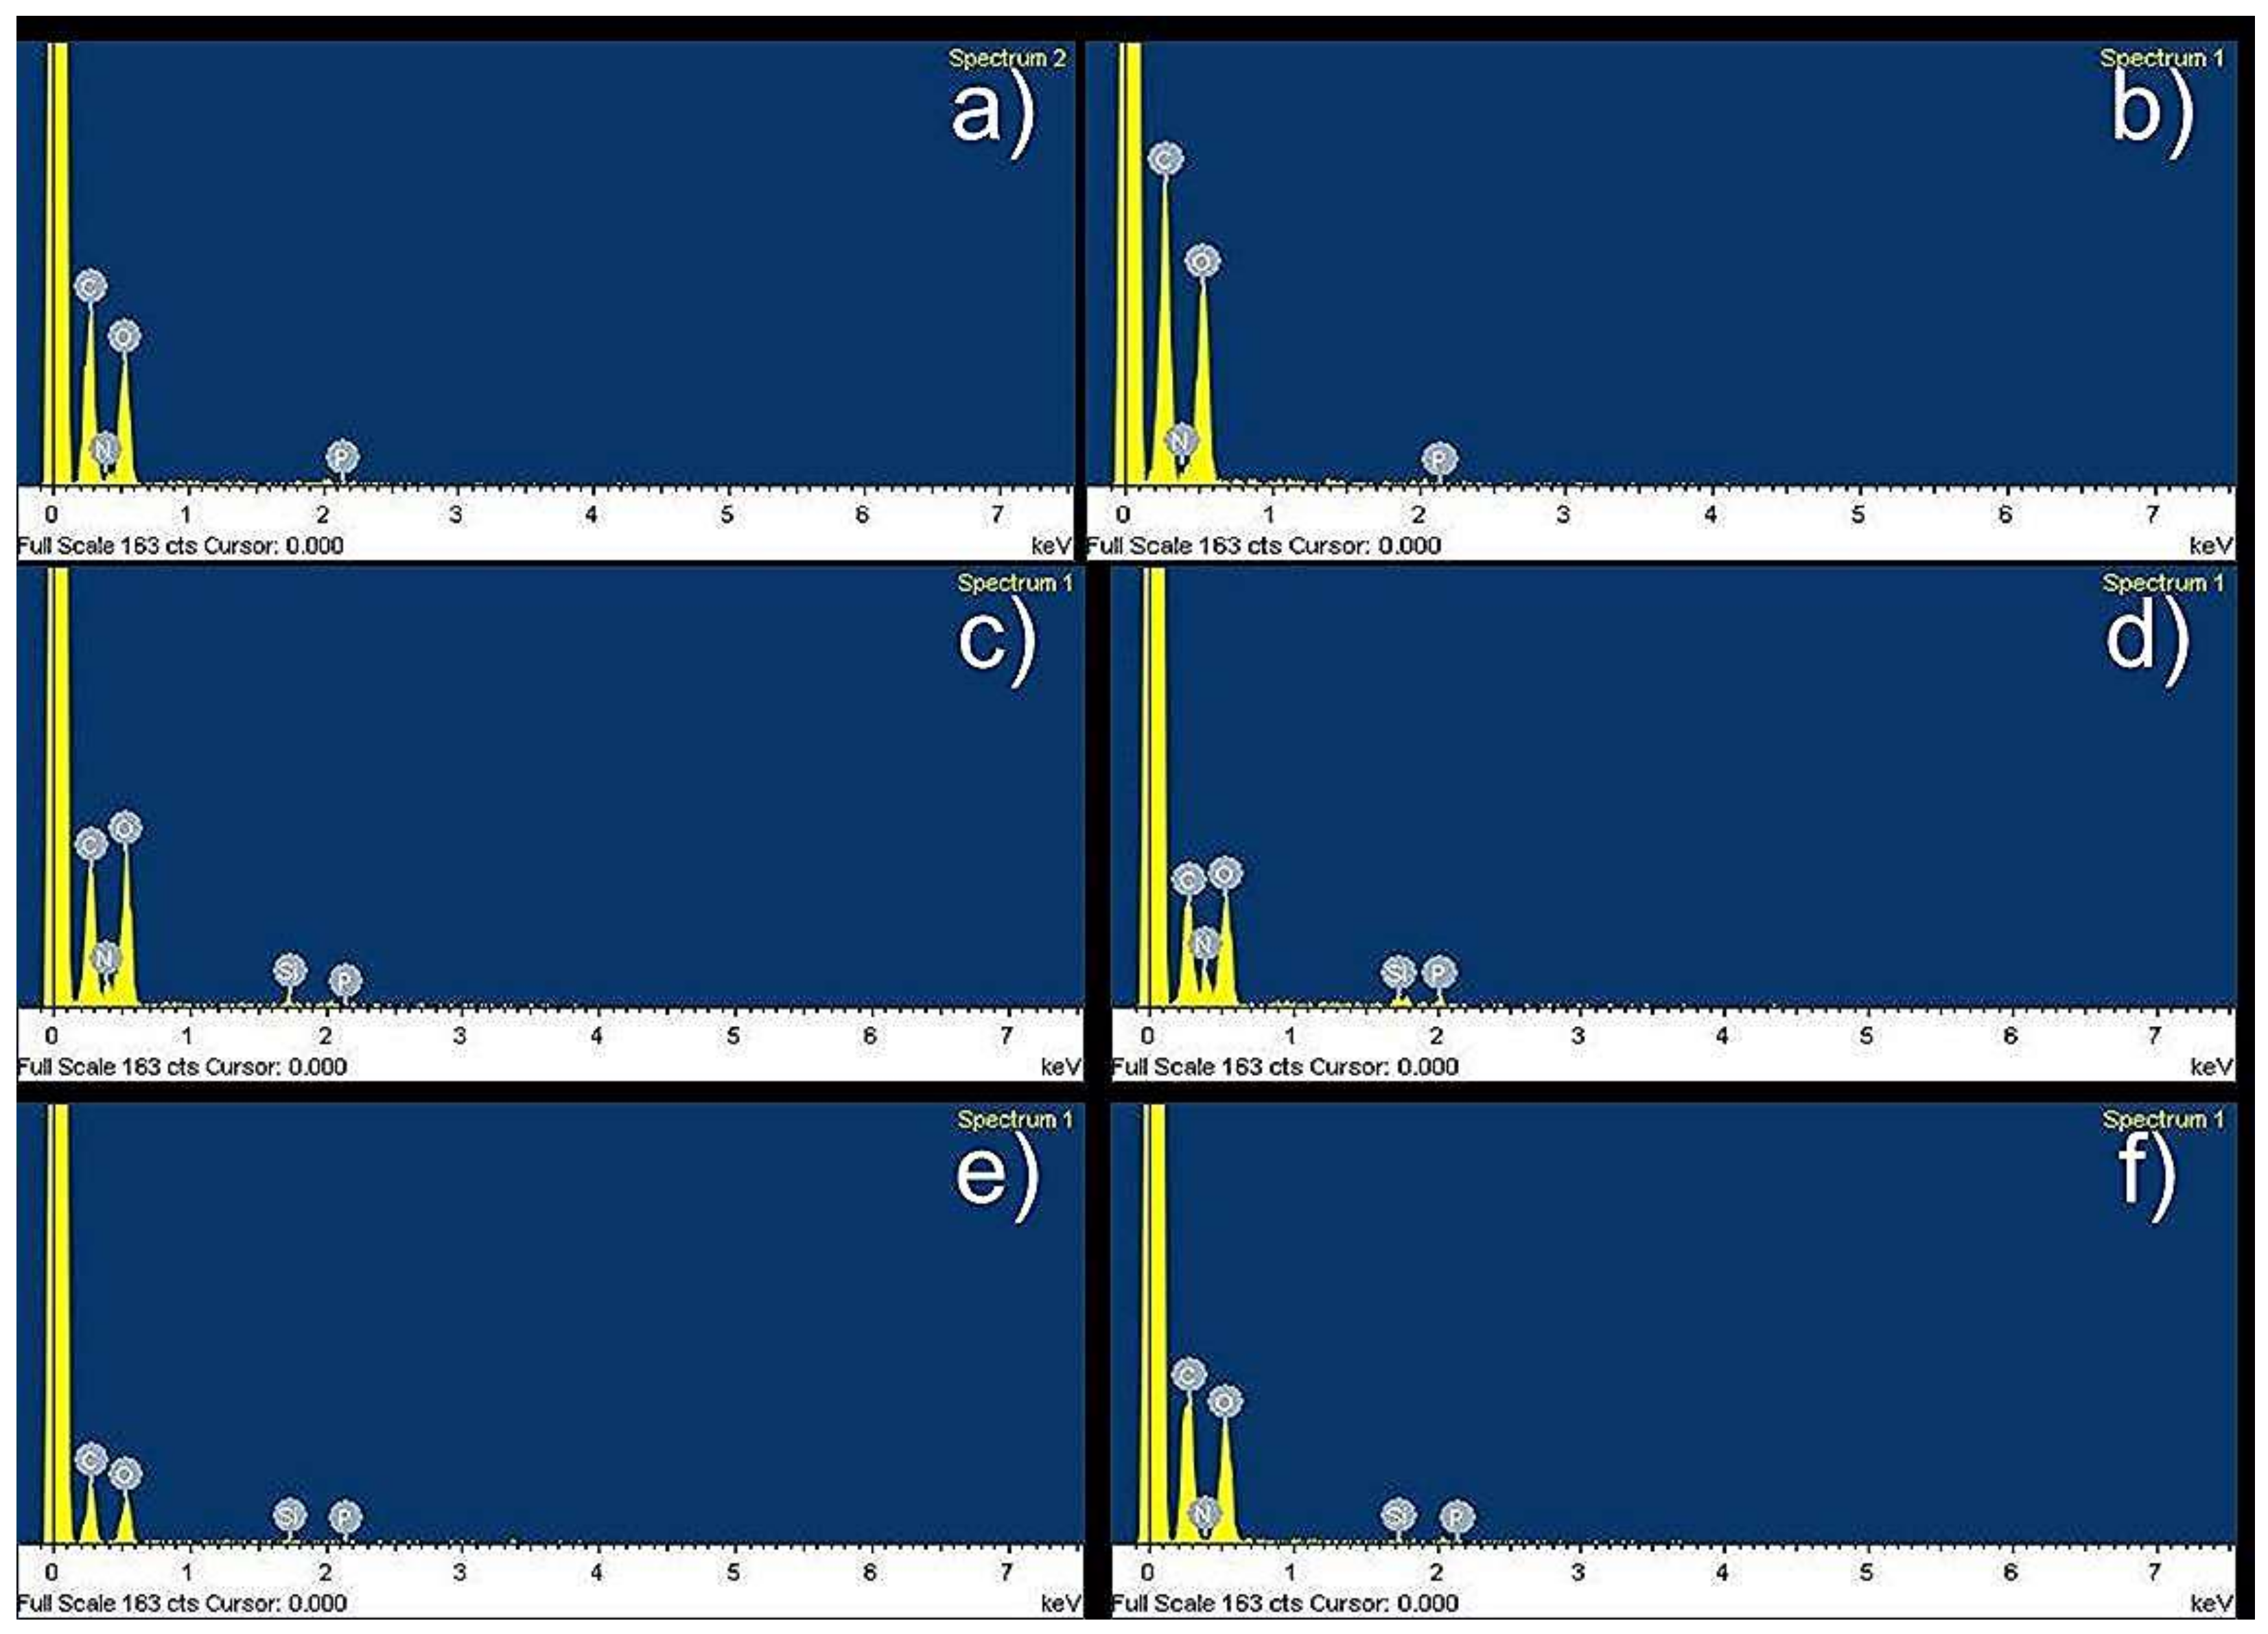
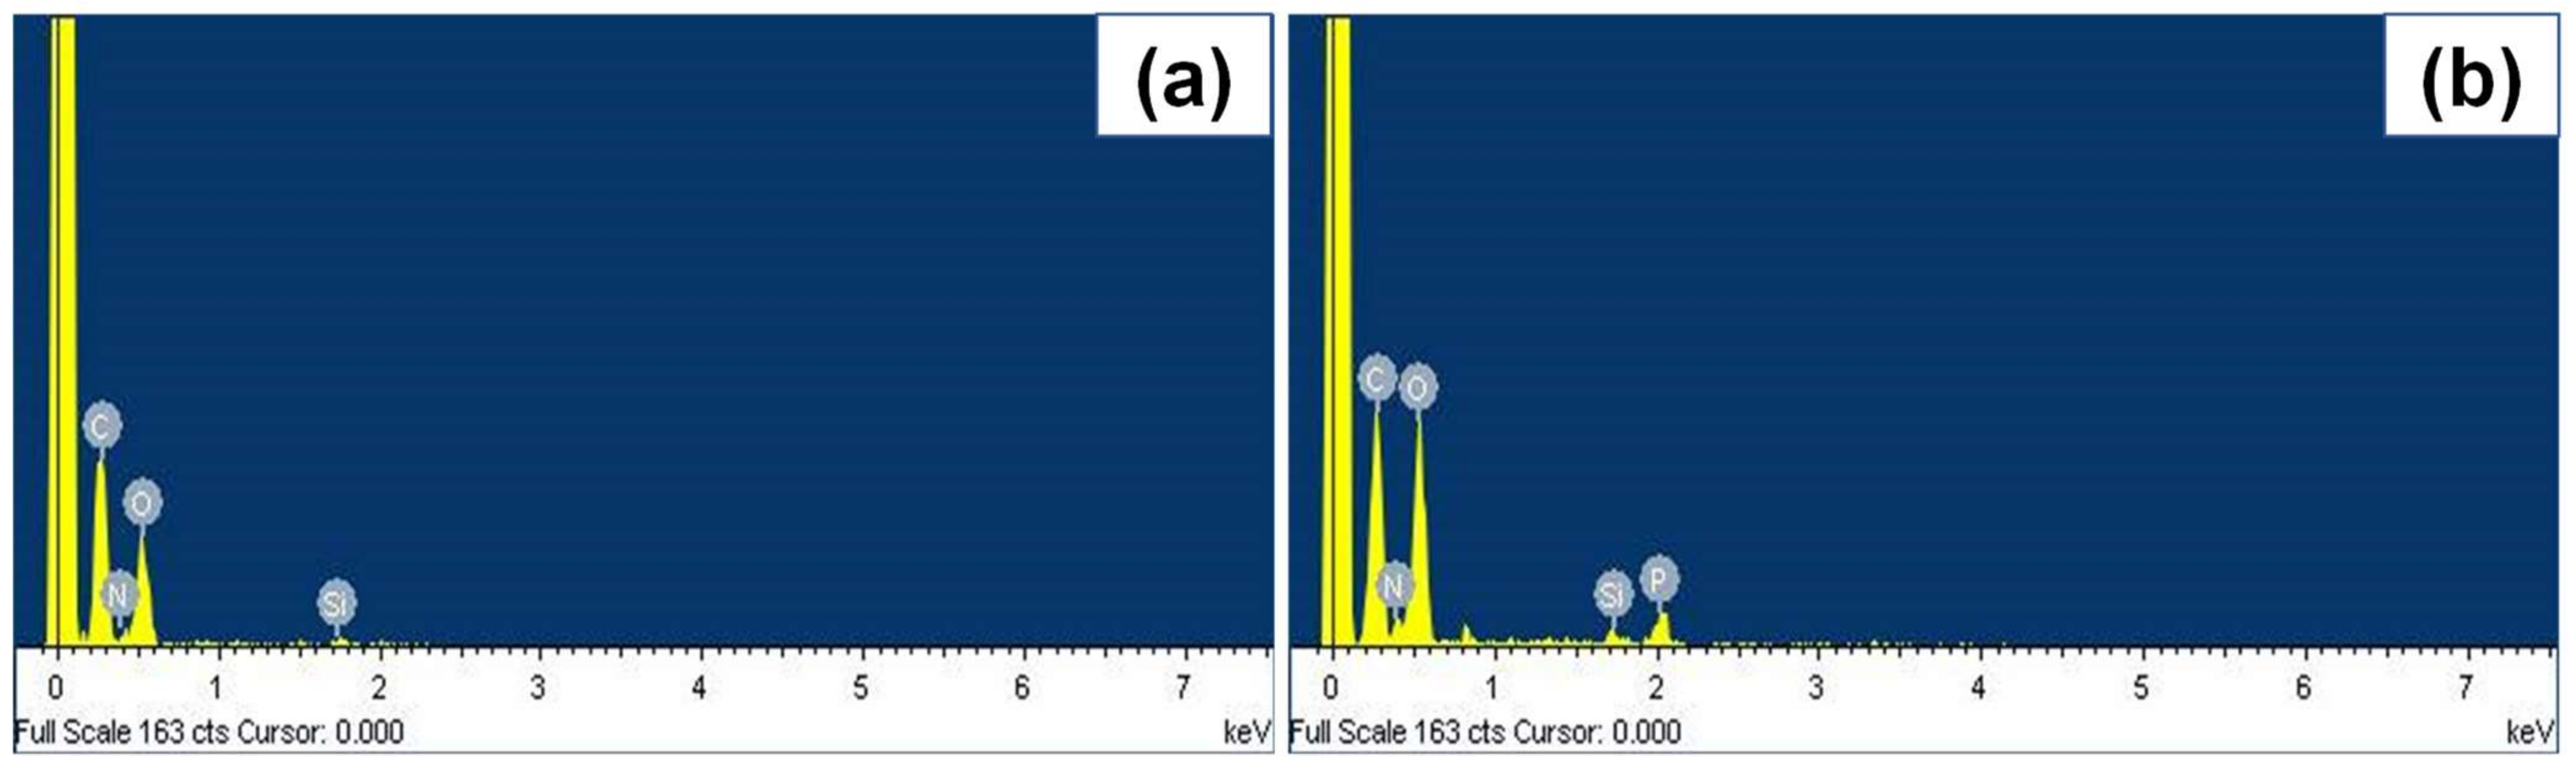
Figure 3.
EDX traces for cotton samples before water-soaking: (a) Cot/GM, (b) Cot/GM_PL(N2/O2), (c) Cot/GM-APTS,(d) Cot/GM-APTS_PL(N2/O2); and after water-soaking (e) Cot/GM-APTS-(ws), (f) Cot/GM-APTS _PL(N2/O2)-(ws). The peaks in order from the left are carbon, nitrogen, oxygen, silicon and phosphorus.
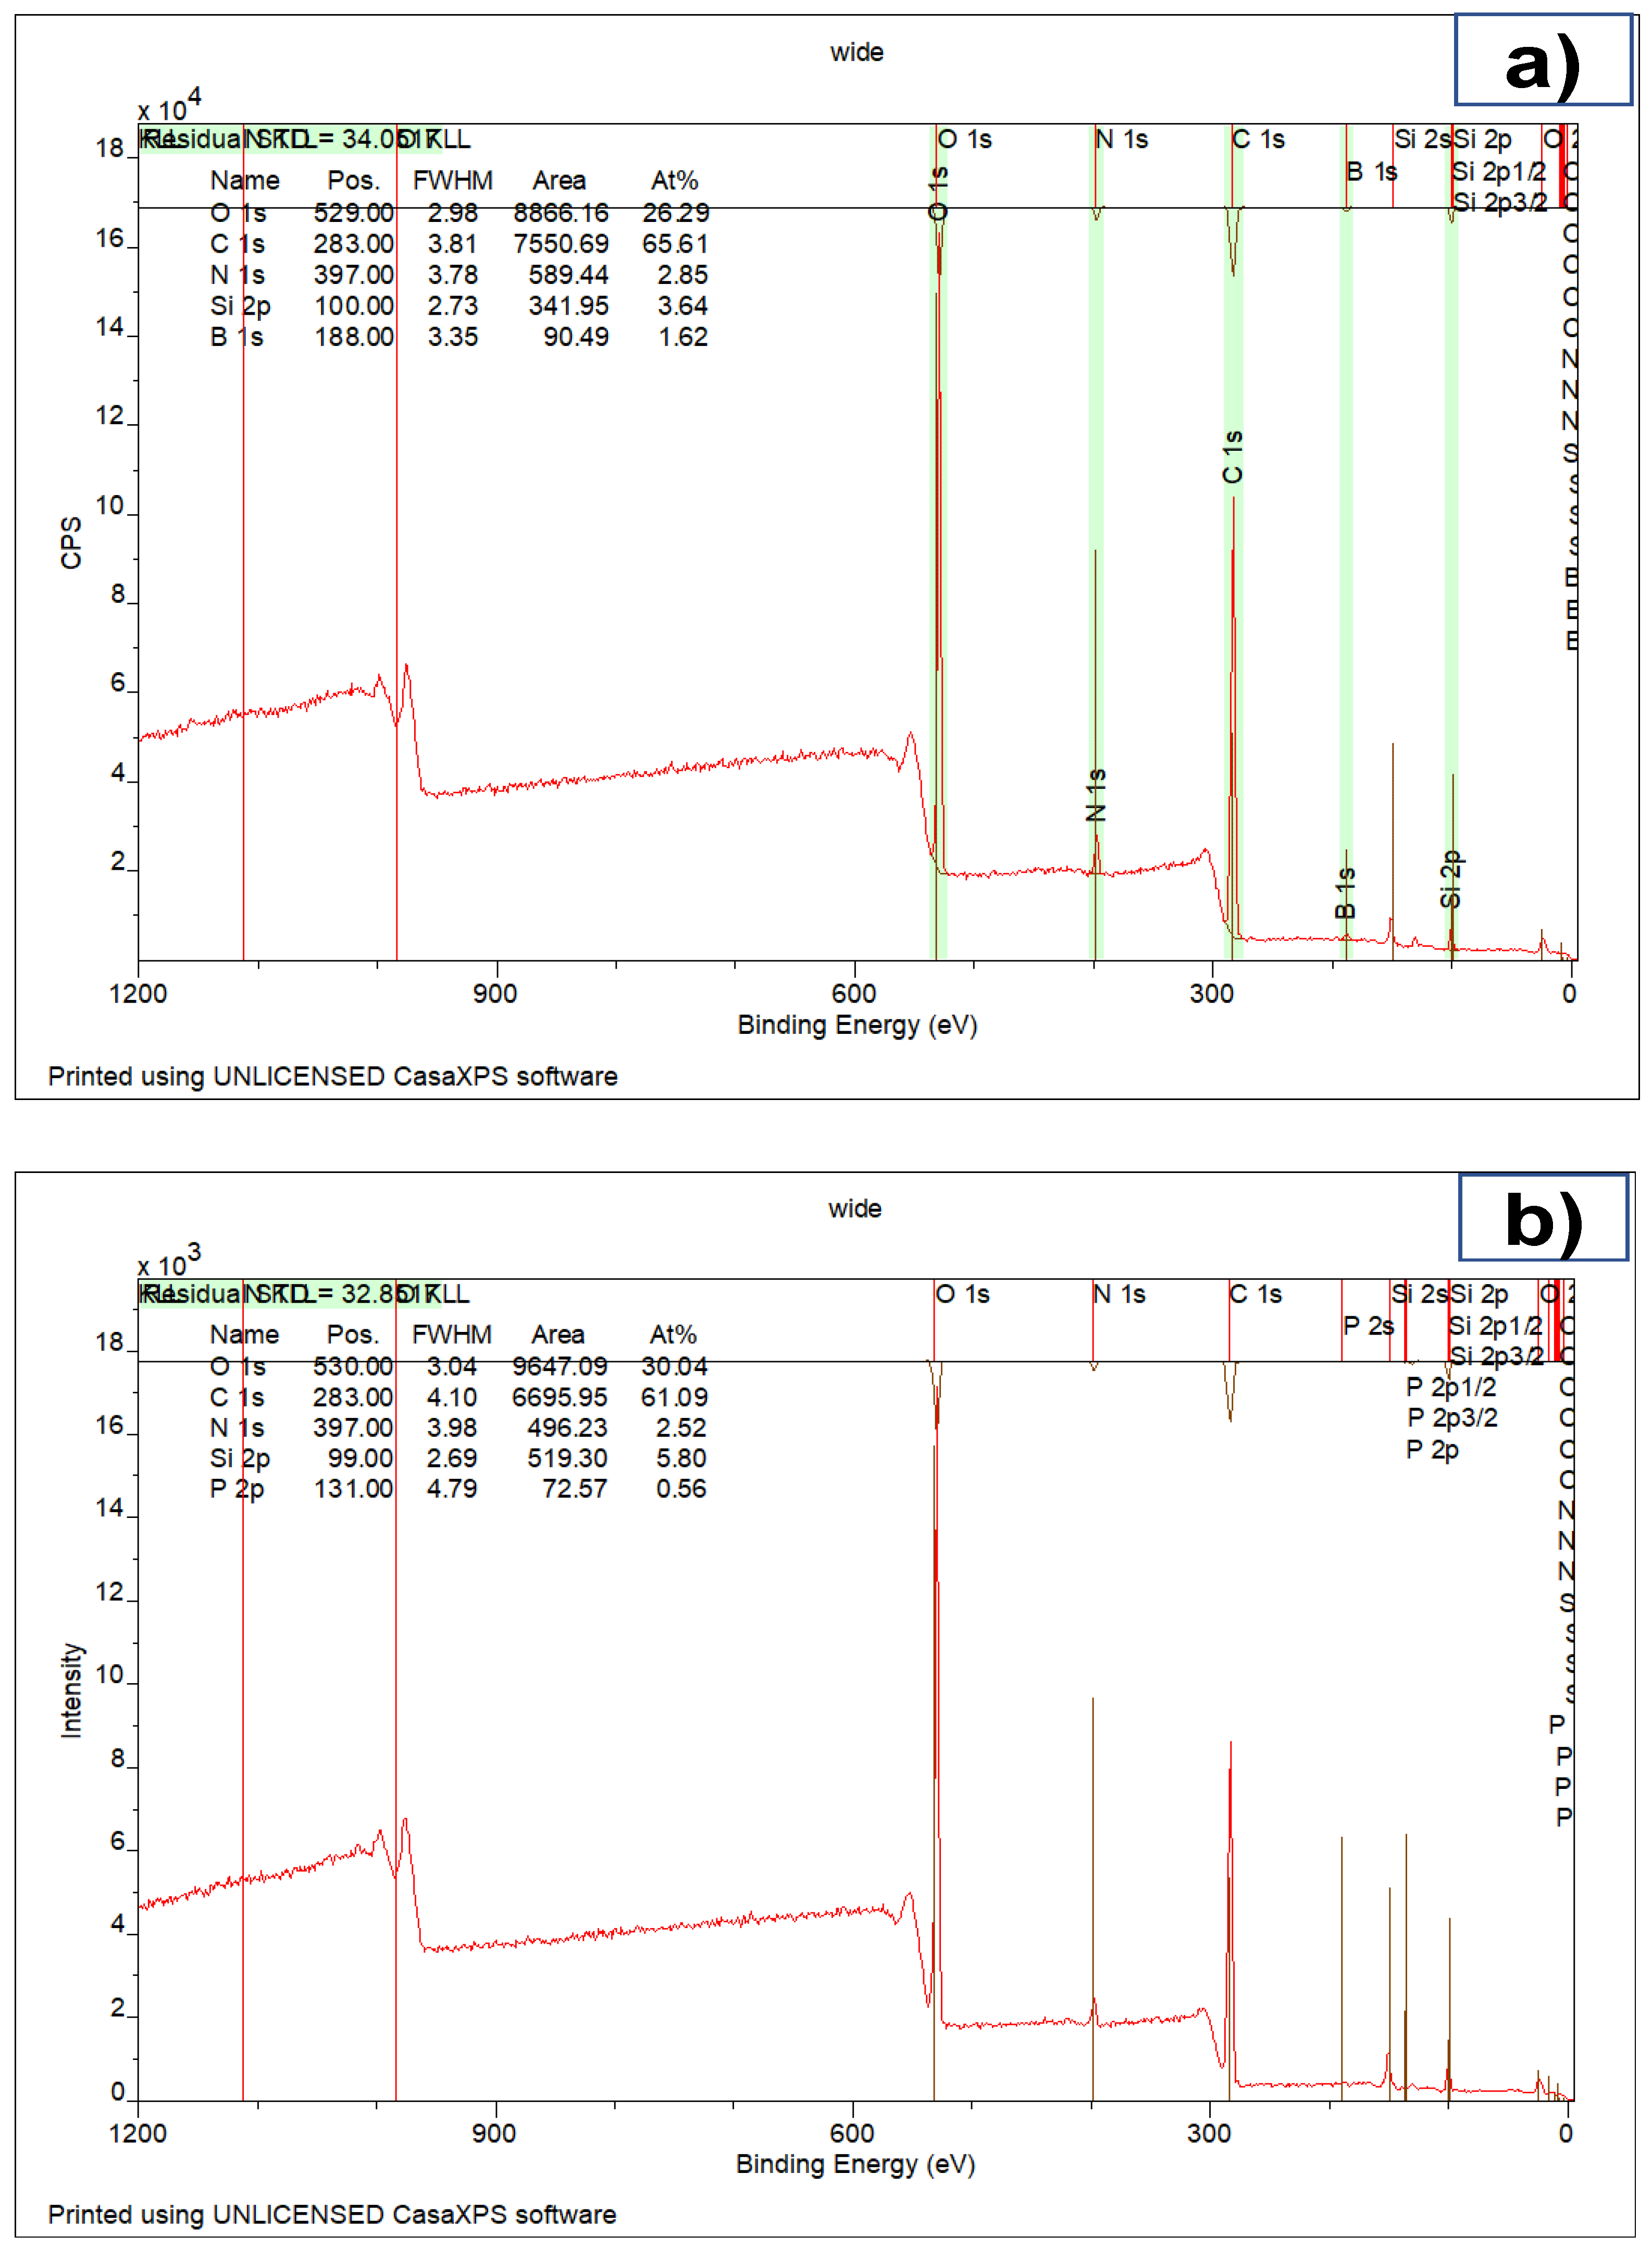
Figure 4.
XPS spectra for cotton fabric after water-soaking, (a) Cot/DAP-urea-APTS and (b) Cot/DAP-urea-APTS_PL(N2/O2) samples.
Figure 4.
XPS spectra for cotton fabric after water-soaking, (a) Cot/DAP-urea-APTS and (b) Cot/DAP-urea-APTS_PL(N2/O2) samples.
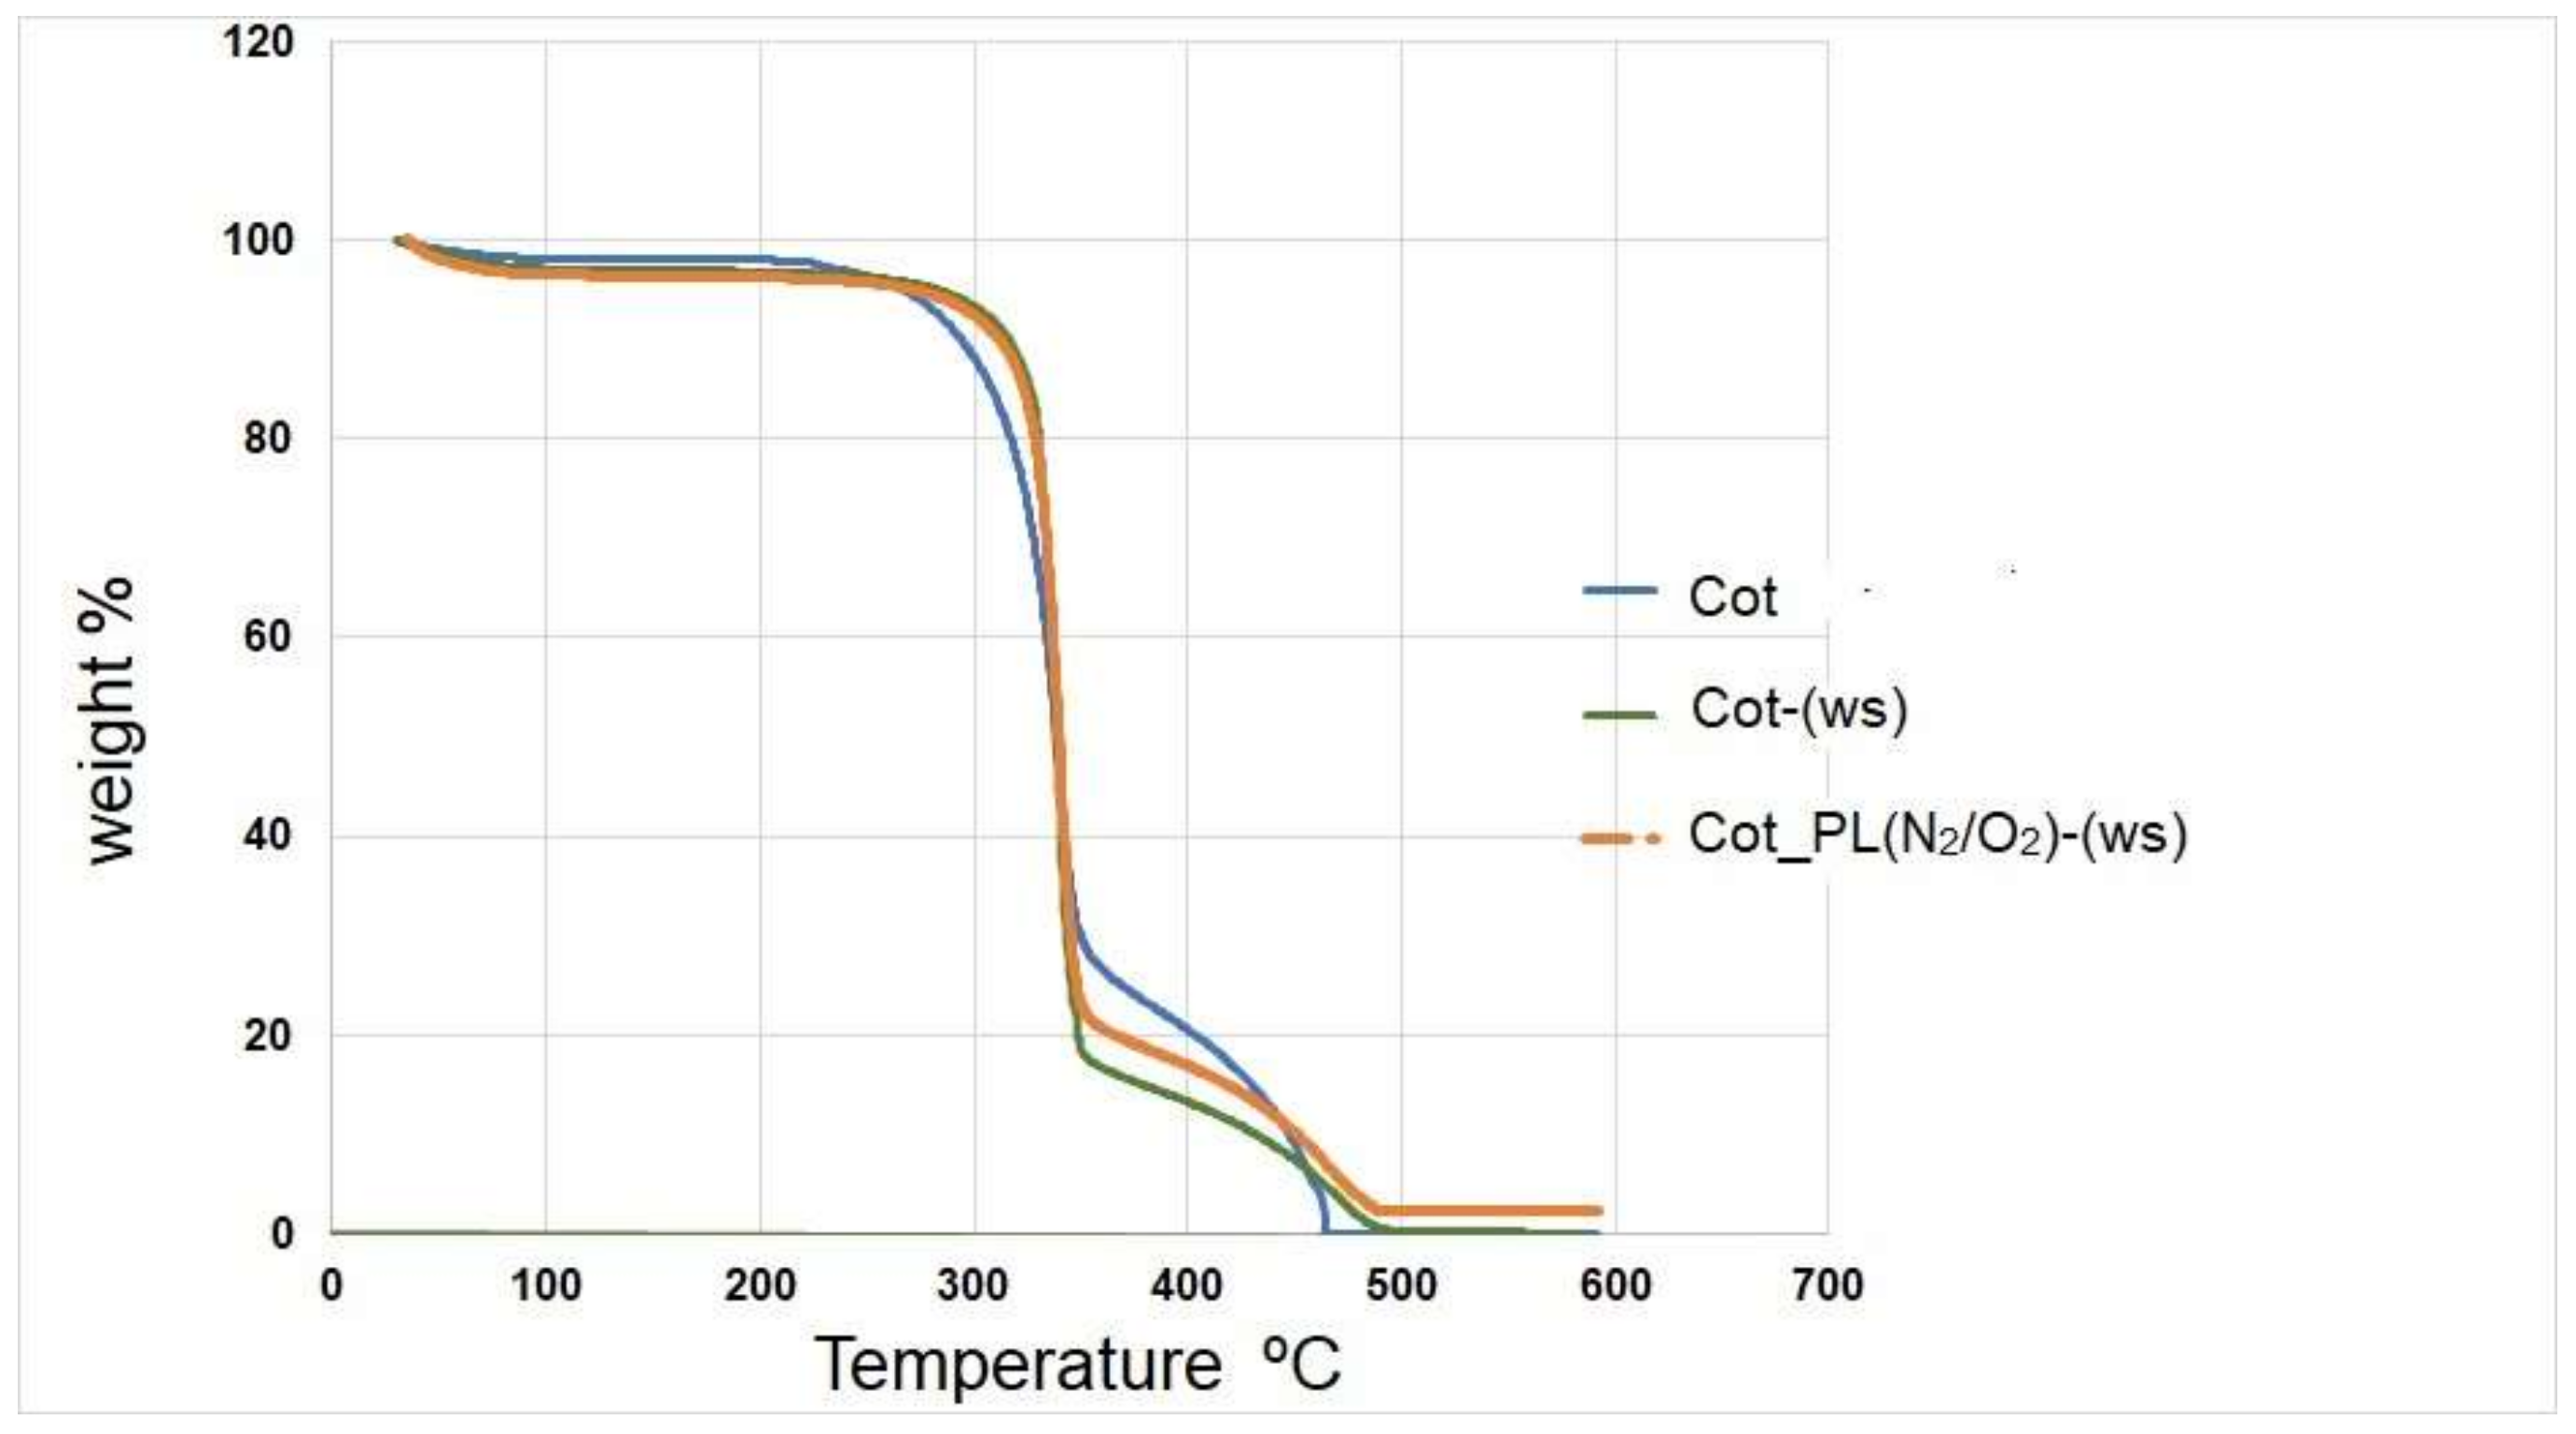
Figure 5.
TGA traces for pure cotton before (Cot) and after water-soaking (Cot)-(ws) and N2/O2 plasma gas treatment after water-soaking (Cot_PL(N2/O2)-(ws)).
Figure 5.
TGA traces for pure cotton before (Cot) and after water-soaking (Cot)-(ws) and N2/O2 plasma gas treatment after water-soaking (Cot_PL(N2/O2)-(ws)).
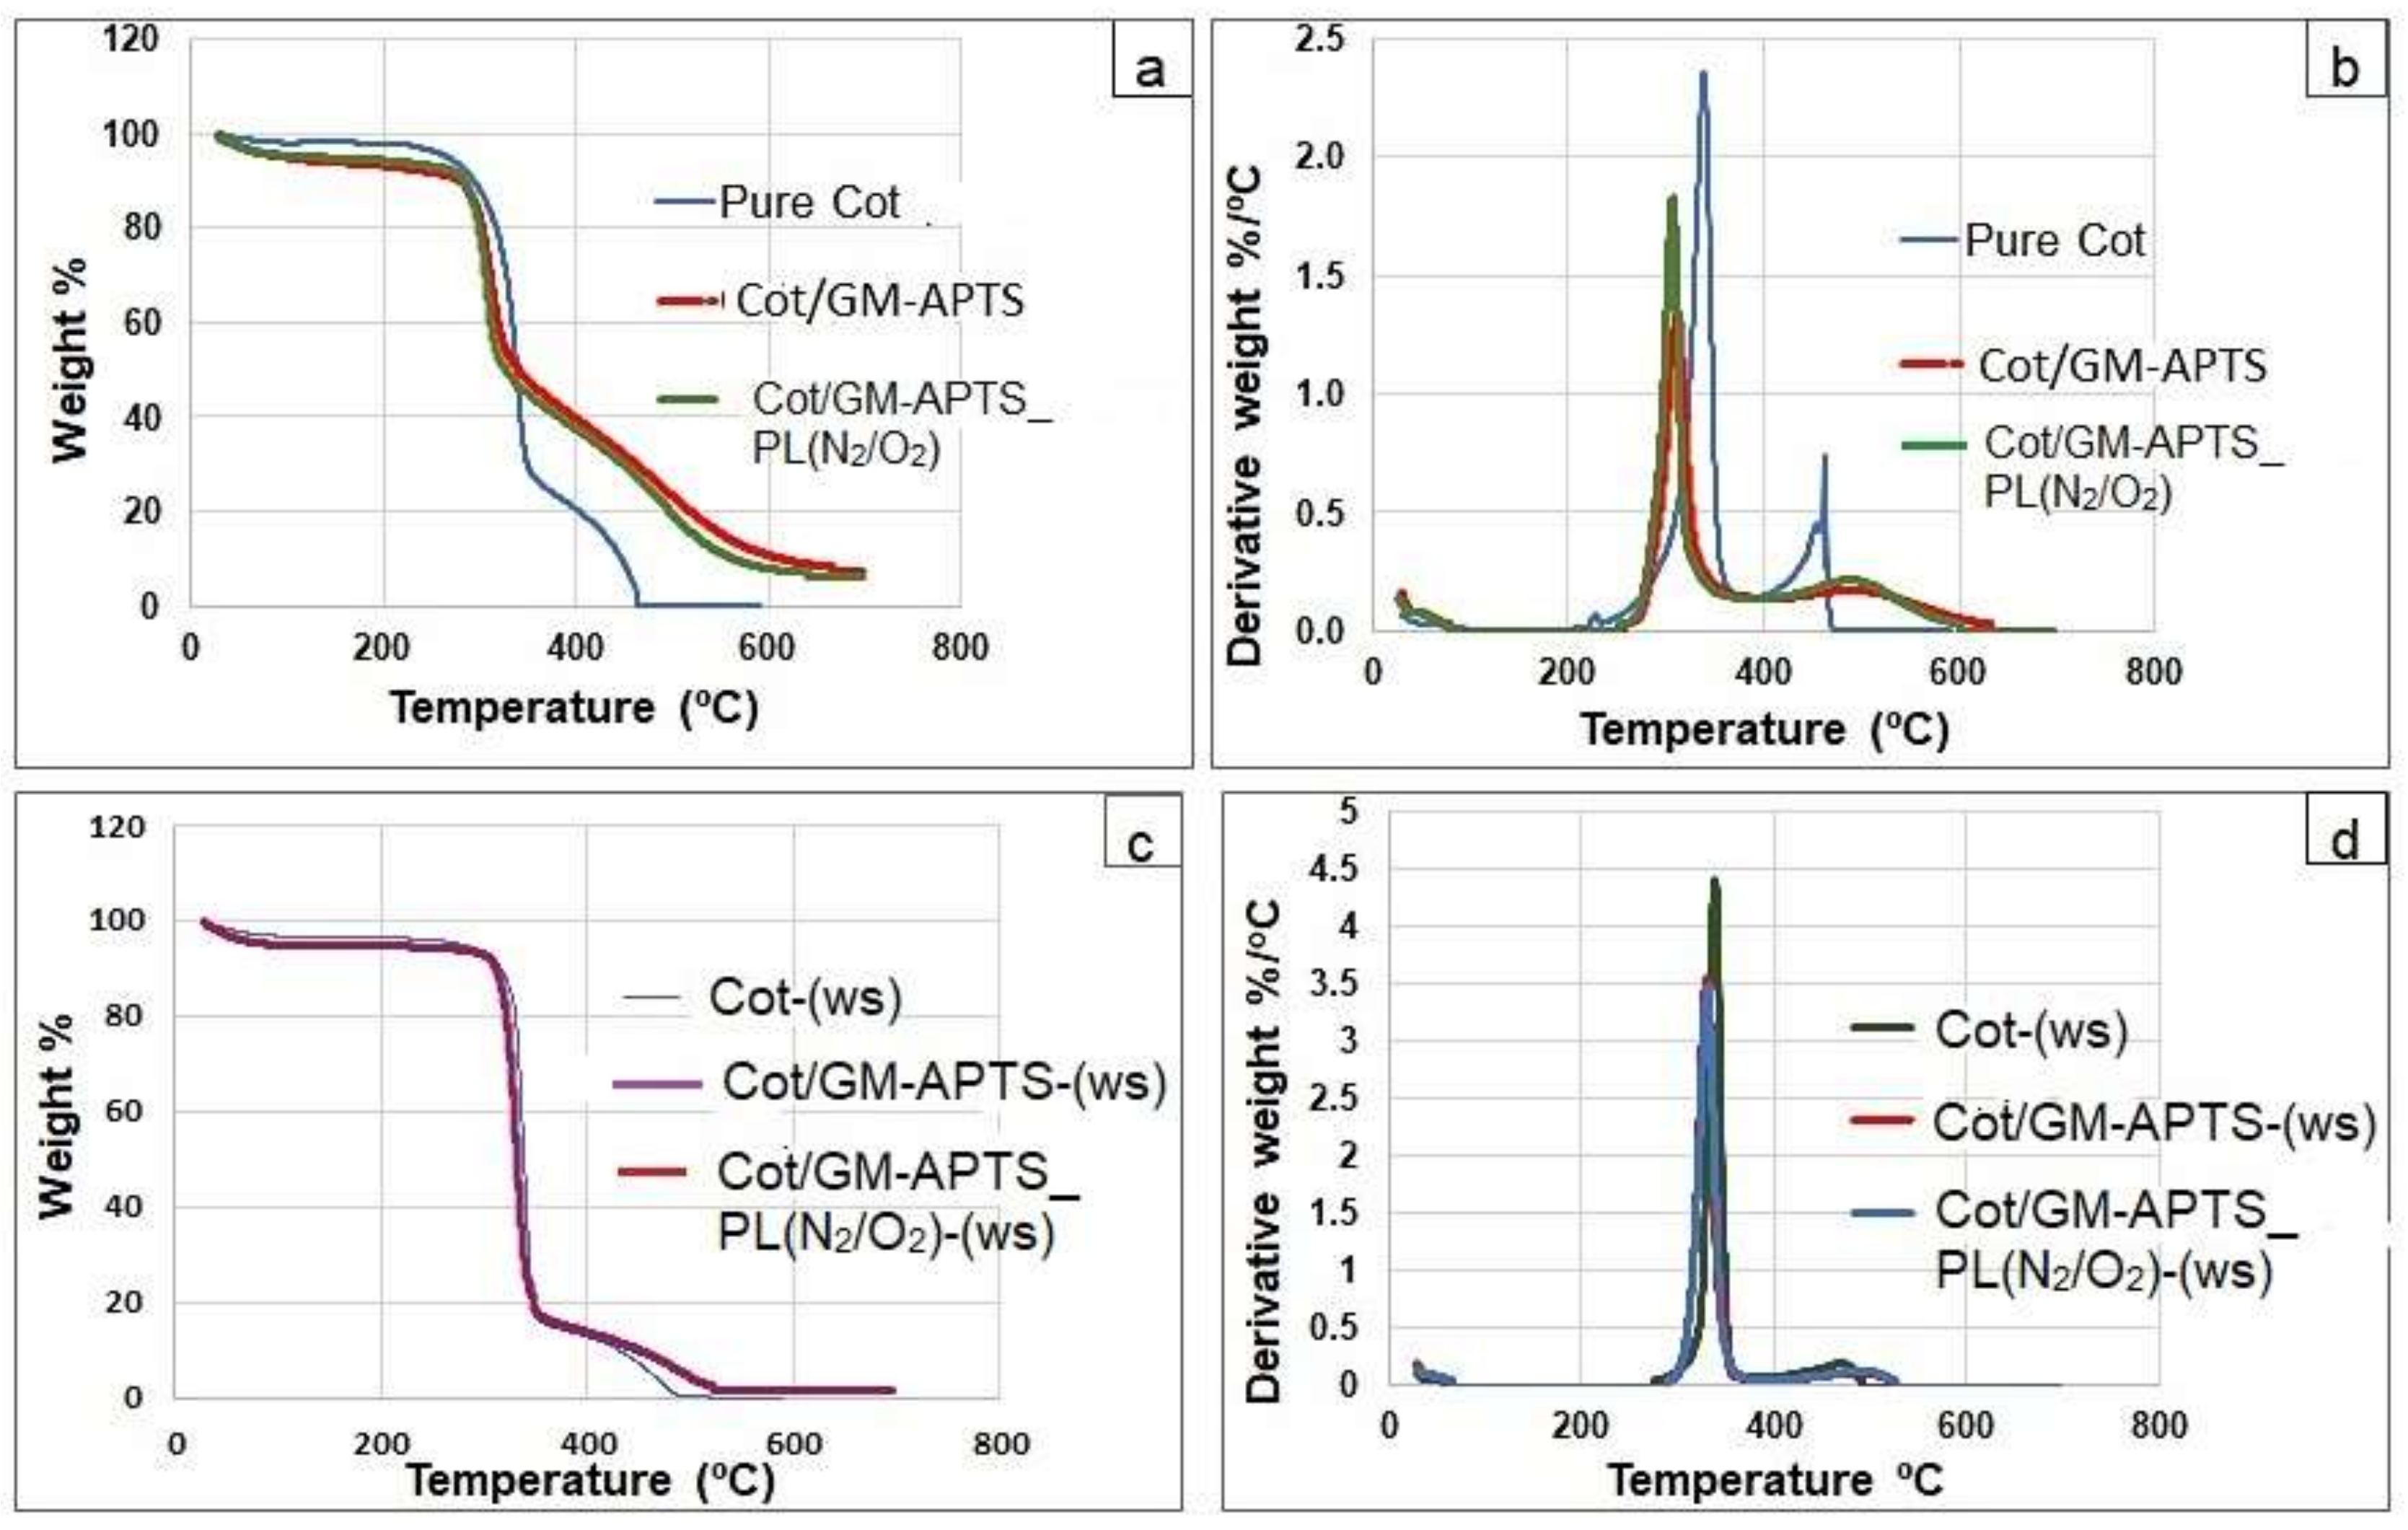
Figure 6.
Thermal analysis traces for Cot/GM-APTS, Cot/GM-APTS_PL(N2/O2) samples and cotton controls (Cot, Cot_PL(N2/O2) in air (a) TGA and (b) DTG before water-soaking and (c) TGA and (d) DTG after water-soaking (respective samples with suffix (ws)).
Figure 6.
Thermal analysis traces for Cot/GM-APTS, Cot/GM-APTS_PL(N2/O2) samples and cotton controls (Cot, Cot_PL(N2/O2) in air (a) TGA and (b) DTG before water-soaking and (c) TGA and (d) DTG after water-soaking (respective samples with suffix (ws)).
Figure 7.
DTG2 temperature versus char at 400 °C.
Figure 7.
DTG2 temperature versus char at 400 °C.
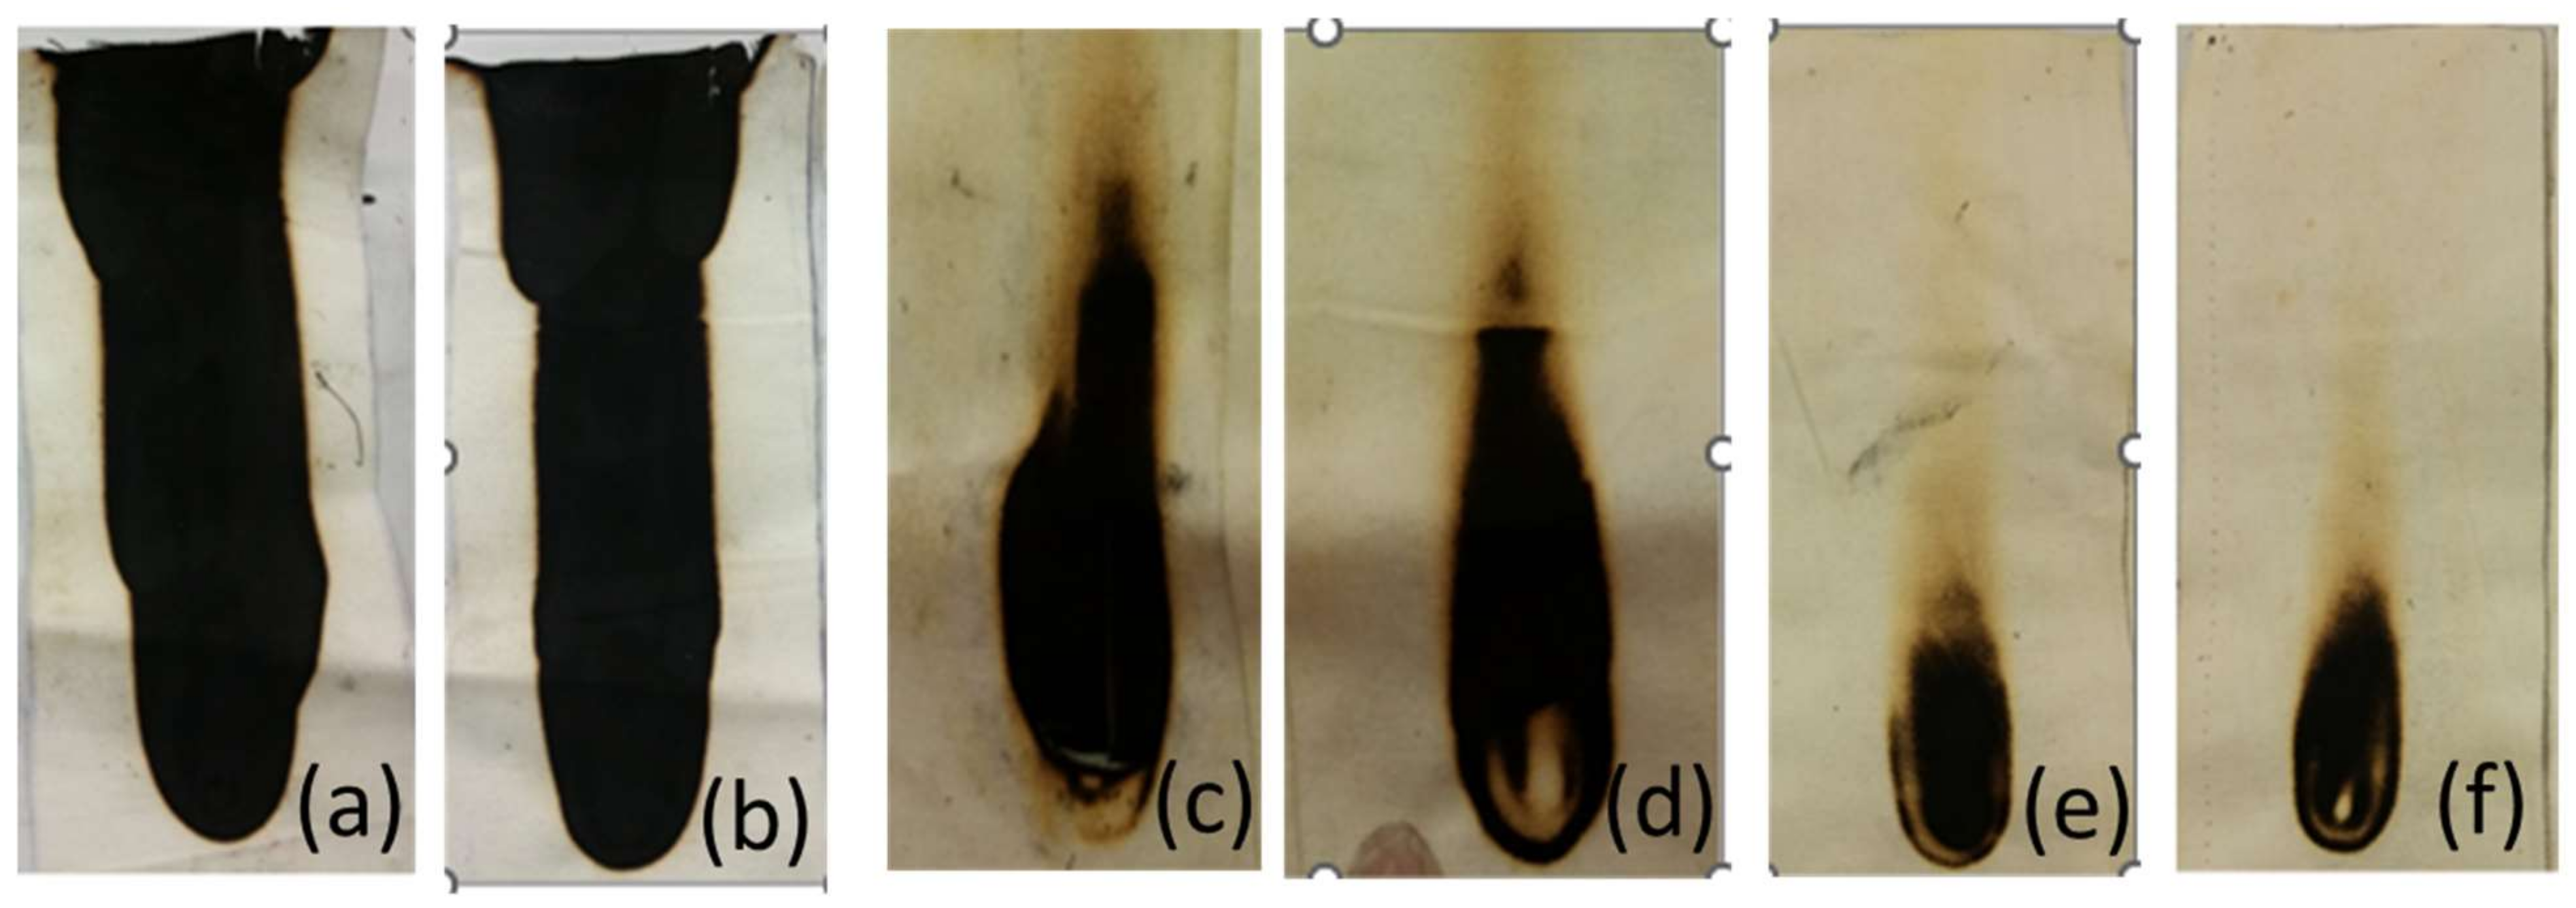
Figure 8.
The vertical strip flammability test results for cotton samples before water-soaking (a) Cot/GM, (b) Cot/GM_PL(N2/O2) (c) Cot/GM-APTS, (d) Cot/GM-APTS_PL(N2/O2), (e) Cot/DAP-urea-APTS, (f) Cot/DAP-urea-APTS_PL(N2/O2).
Figure 8.
The vertical strip flammability test results for cotton samples before water-soaking (a) Cot/GM, (b) Cot/GM_PL(N2/O2) (c) Cot/GM-APTS, (d) Cot/GM-APTS_PL(N2/O2), (e) Cot/DAP-urea-APTS, (f) Cot/DAP-urea-APTS_PL(N2/O2).
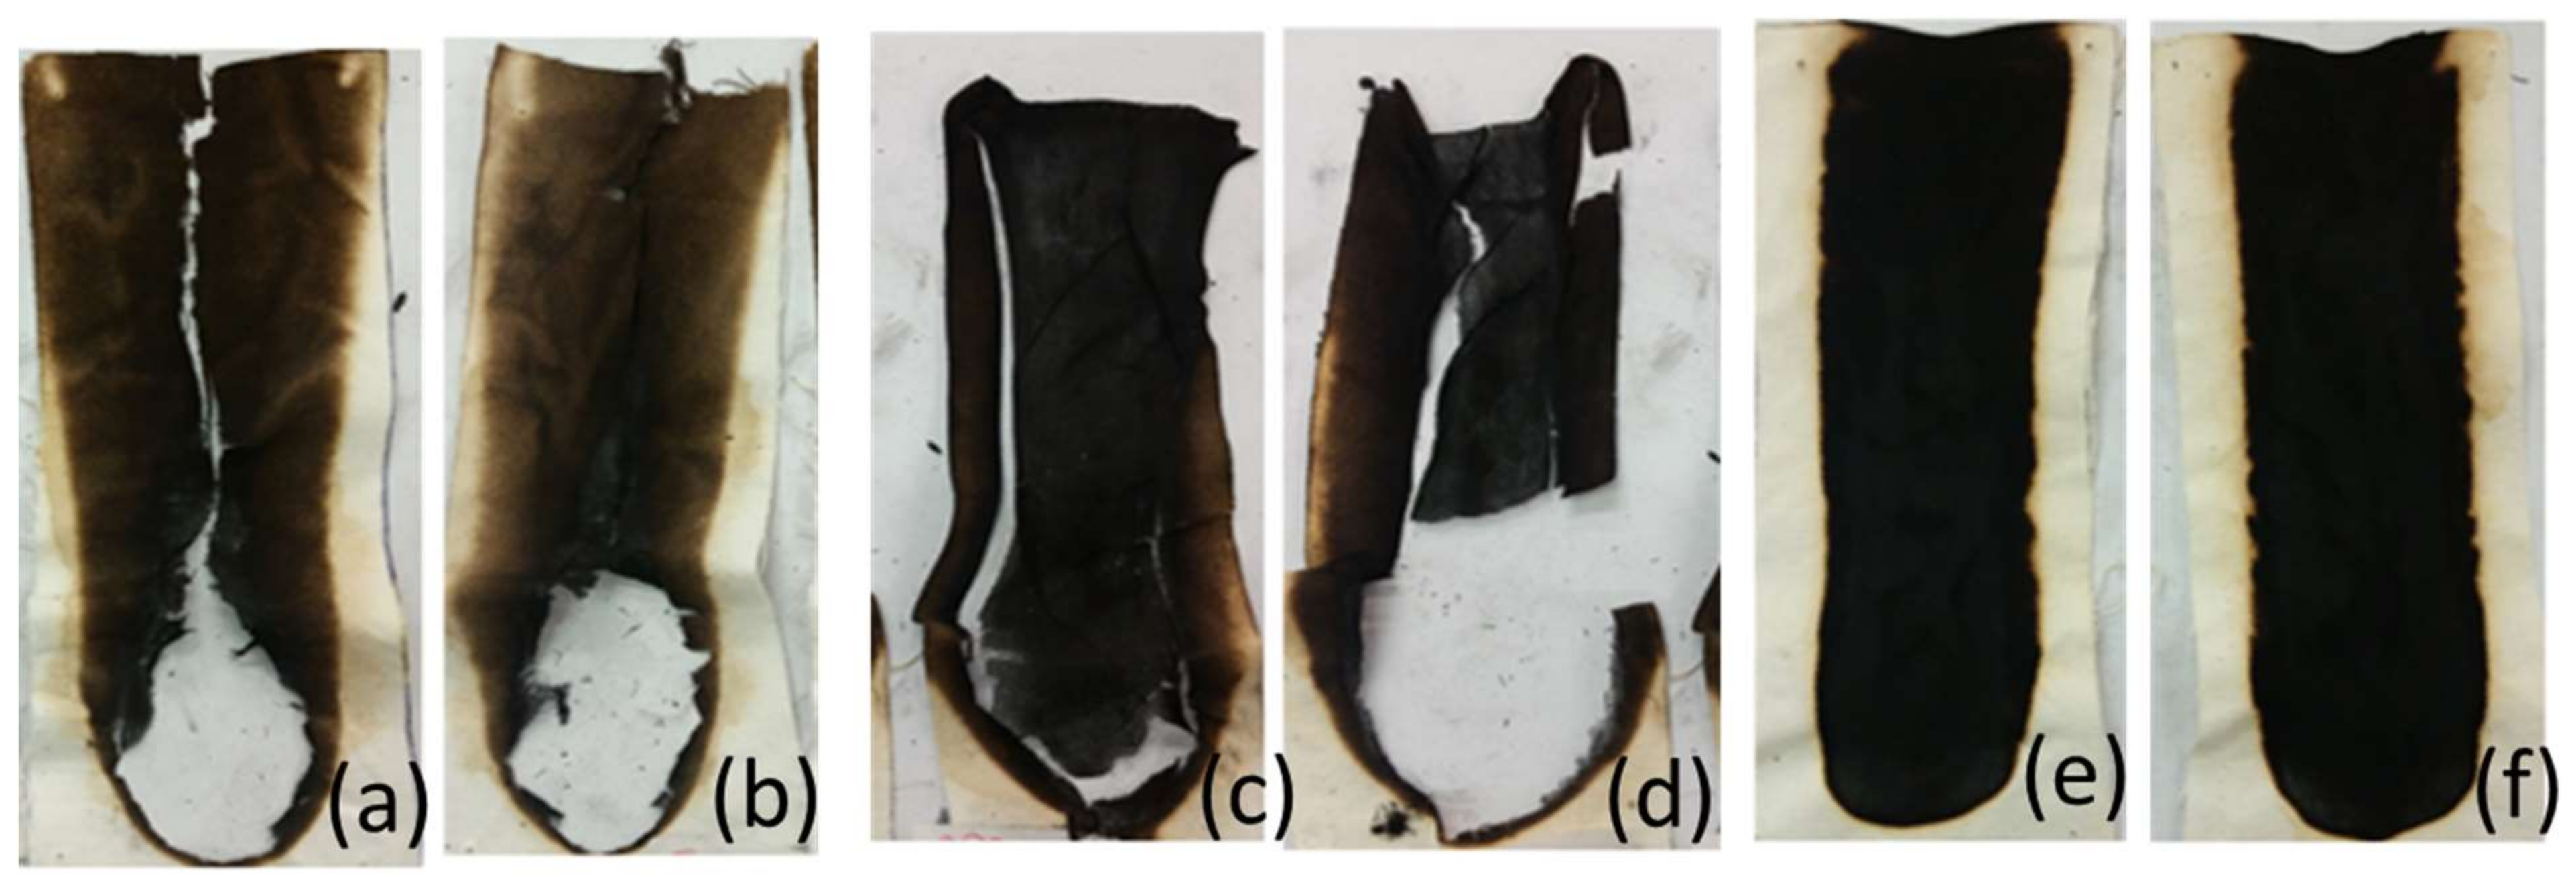
Figure 9.
The vertical strip flammability test results for cotton samples after water-soaking, (a) Cot/GM-(ws), (b) Cot/GM_PL(N2/O2)-(ws) (c) Cot/GM-APTS-(ws), (d) Cot/GM-APTS_ PL(N2/O2)-(ws), (e) Cot/DAP-urea-APTS-(ws), (f) Cot/DAP-urea-APTS- PL(N2/O2)-(ws).
Figure 9.
The vertical strip flammability test results for cotton samples after water-soaking, (a) Cot/GM-(ws), (b) Cot/GM_PL(N2/O2)-(ws) (c) Cot/GM-APTS-(ws), (d) Cot/GM-APTS_ PL(N2/O2)-(ws), (e) Cot/DAP-urea-APTS-(ws), (f) Cot/DAP-urea-APTS- PL(N2/O2)-(ws).
Figure 10.
SEM images for water-soaked cotton sample chars after vertical strip testing from (a) Cot/DAP-urea-APTS-(ws) and (b) Cot/DAP-urea-APTS_PL(N2/O2)-(ws).
Figure 10.
SEM images for water-soaked cotton sample chars after vertical strip testing from (a) Cot/DAP-urea-APTS-(ws) and (b) Cot/DAP-urea-APTS_PL(N2/O2)-(ws).
Figure 11.
EDX results for cotton chars formed after vertical strip testing of water-soaked samples: (a) Cot/DAP-urea-APTS-(ws), (b) Cot/DAP-urea-APTS_PL(N2/O2)-(ws). The peaks in order from the left are carbon, nitrogen, oxygen, silicon and phosphorus.
Figure 11.
EDX results for cotton chars formed after vertical strip testing of water-soaked samples: (a) Cot/DAP-urea-APTS-(ws), (b) Cot/DAP-urea-APTS_PL(N2/O2)-(ws). The peaks in order from the left are carbon, nitrogen, oxygen, silicon and phosphorus.
Scheme 1.
Possible reactions occurring during plasma exposure of DBAP-impregnated cellulose.
Scheme 1.
Possible reactions occurring during plasma exposure of DBAP-impregnated cellulose.
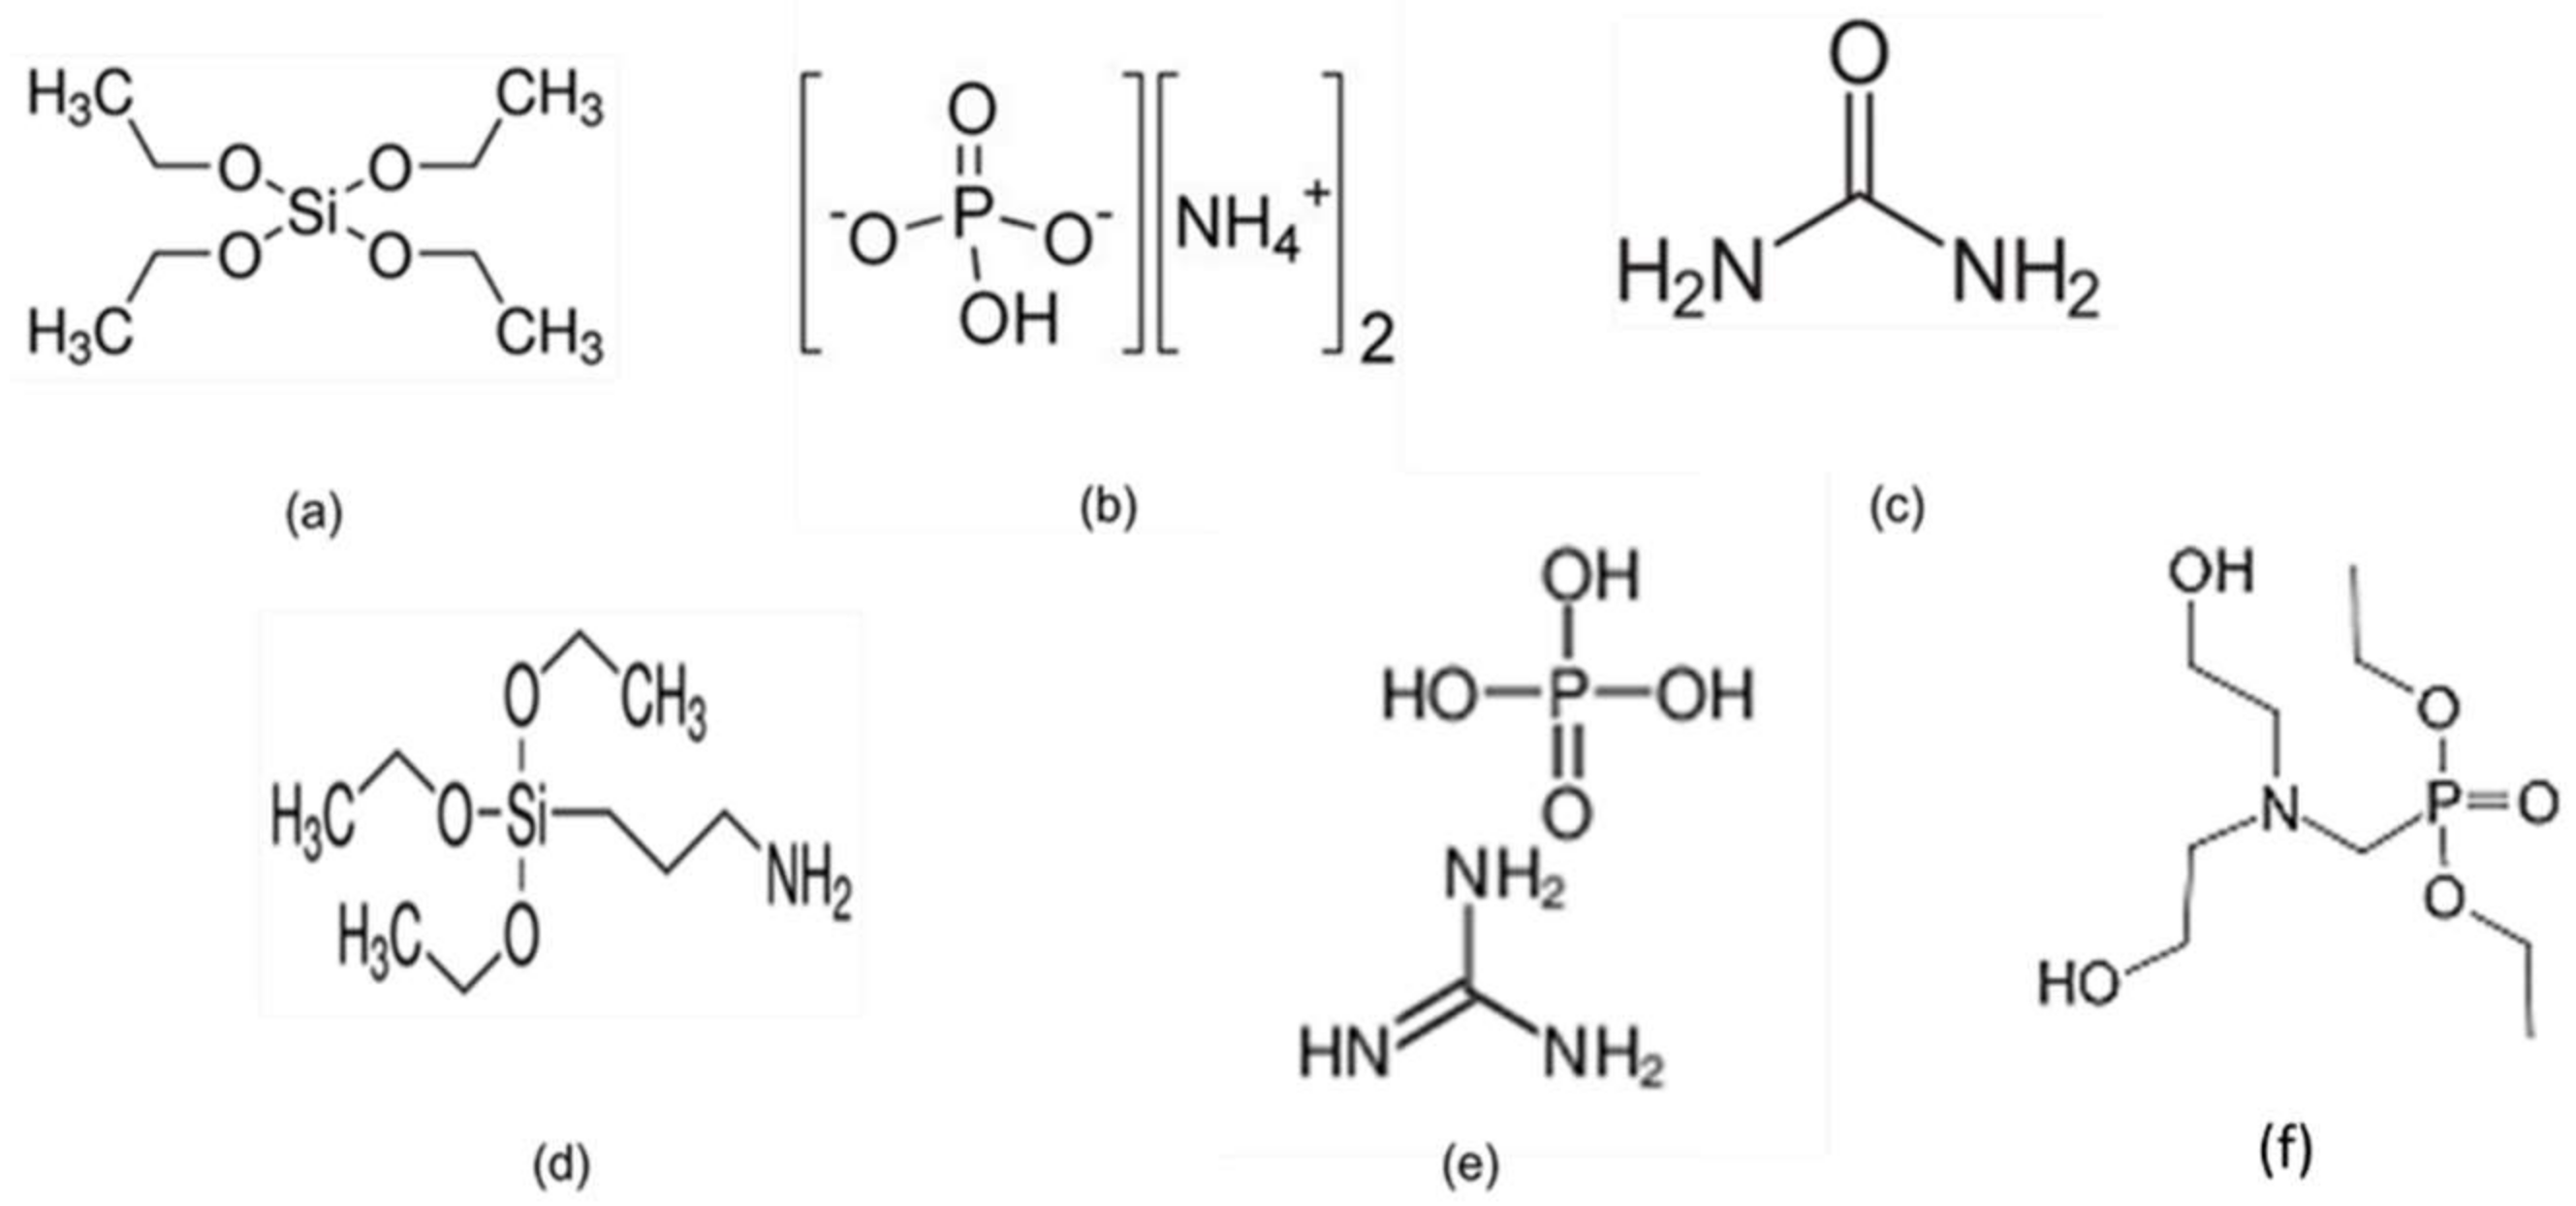
Scheme 2.
(a) Tetraethoxysilane (TEOS) 13% Si, (b) di ammonium phosphate (DAP) 23% P, (c) urea, (d) 3-aminopropyltriethoxy silane (APTS) 13%Si, (e) guanidine monophosphate (GM) 19% P and (f) Diethyl N, N bis (2-hydroxyethyl) aminomethylphosphonate (DBAP or Fyrol 6, 12%P).
Scheme 2.
(a) Tetraethoxysilane (TEOS) 13% Si, (b) di ammonium phosphate (DAP) 23% P, (c) urea, (d) 3-aminopropyltriethoxy silane (APTS) 13%Si, (e) guanidine monophosphate (GM) 19% P and (f) Diethyl N, N bis (2-hydroxyethyl) aminomethylphosphonate (DBAP or Fyrol 6, 12%P).
Table 1.
Cotton samples coated with nitrogen, silicon and organophosphorus flame retardants and followed by plasma/UV treatment; plasma power = 100W/m2·min.
Table 1.
Cotton samples coated with nitrogen, silicon and organophosphorus flame retardants and followed by plasma/UV treatment; plasma power = 100W/m2·min.
| Sample Code | Dry Add-On *, wt% | Nominal Phosphorus on the Fabric, wt% | Mass Loss after Water-Soaking **, % | FR Remaining after Water-Soaking ***, wt% |
|---|
| Cot | - | - | 4.0 | - |
| Cot_PL(N2/O2) | - | - | 6.0 | - |
| Cot/GM | 5.5 | 0.9 | 7.7 | 1.8 ± 1.0 |
| Cot/GM_PL(N2/O2) | 5.5 | 0.9 | 8.2 | 3.3 ± 0.9 |
| Cot/GM-TEOS | 6.2 | 1.2 | 8.0 | 2.2± 0.5 |
| Cot/GM-TEOS_PL(N2/O2) | 6.2 | 1.2 | 7.6 | 4.6 ± 0.3 |
| Cot/GM-APTS | 13.0 | 2.6 | 16.8 | 0.2 ± 1.0 |
| Cot/GM-APTS_PL(N2/O2) | 13.0 | 2.6 | 13.8 | 5.2± 1.0 |
| Cot/DAP-urea | 9.9 | 2.2 | 13.5 | 0.4 ± 1.0 |
| Cot/DAP-urea_PL(N2/O2) | 9.9 | 2.2 | 13.6 | 2.3 ± 0.8 |
| Cot/DAP-urea-TEOS | 9.5 | 2.2 | 11.3 | 2.2 ± 0.3 |
| Cot/DAP-urea-TEOS_PL(N2/O2) | 9.5 | 2.2 | 11.6 | 3.9 ± 0.7 |
| Cot/DAP-urea-APTS | 24.5 | 5.6 | 18.6 | 9.9 ± 1.0 |
| Cot/DAP-urea-APTS_PL(N2/O2) | 24.5 | 5.6 | 18.1 | 12.1 ± 1.0 |
Table 2.
Percent of mass loss for cotton fabric without flame retardant after various MLSE treatments with different plasma gases and without water-soaking; plasma power = 200W/m2·min.
Table 2.
Percent of mass loss for cotton fabric without flame retardant after various MLSE treatments with different plasma gases and without water-soaking; plasma power = 200W/m2·min.
| Sample Code | UV Laser, 228 W | Mass Loss after Plasma Treatment, % |
|---|
| Cot_P(N2/CO2) | - | 27.9 |
| Cot_PL(N2/CO2) | √ | 10.8 |
| Cot_P(Ar/CO2) | - | 25.4 |
| Cot_PL(Ar/CO2) | √ | 15.2 |
| Cot_P(Ar) | - | 12.7 |
| Cot_P(Ar) | √ | 5.7 |
Table 3.
Dry add-on for cotton samples treated with various MLSE treatments and coated with DBAP.
Table 3.
Dry add-on for cotton samples treated with various MLSE treatments and coated with DBAP.
| Sample Code | UV-Laser Energy, 228 W | Dry Add-On, % | Mass Loss after Water-Soaking, % | FR Remaining after Water-Soaking, % |
|---|
| Cot | - | - | 4.0 | - |
| Cot/DBAP | - | 35.0 ± 2.0 | 37.8 | 2.1 ± 0.5 |
| Cot_P(Ar/CO2)_DBAP * | - | 30.0 ± 1.0 | 27.0 | 7.0 ± 1.0 |
| Cot_PL(Ar/CO2)_DBAP * | √ | 22.0 ± 1.0 | 15.0 | 11.0 ± 1.0 |
| Cot/DBAP/_P(N2/CO2) ** | - | 33.0 ± 1.0 | 27.7 | 10.0 ± 0.7 |
| Cot/DBAP_PL(N2/CO2) ** | √ | 33.0 ± 1.0 | 24.5 | 13.0 ± 1.0 |
| Cot_PL(Ar/CO2)_DBAP_PL(N2/O2) *** | √ | 22.0 ± 1.0 | 21.2 | 5.0 ± 1.0 |
Table 4.
EDX results show the average relative weight % of elements on the cotton fabric surfaces after the introduction of GM and APTS-GM with or without plasma/UV treatment. Note: Values rounded to the nearest whole number; * (ws) refers to after water-soaking.
Table 4.
EDX results show the average relative weight % of elements on the cotton fabric surfaces after the introduction of GM and APTS-GM with or without plasma/UV treatment. Note: Values rounded to the nearest whole number; * (ws) refers to after water-soaking.
| Wt% | Cot/GM | Cot/GM_PL(N2/O2) | Cot/GM-APTS | Cot/GM-APTS_PL(N2/O2) | Cot/GM-APTS (ws) * | Cot/GM-APTS_PL(N2/O2)
(ws) * |
|---|
| Carbon | 44.0 ± 3 | 46.0 ± 4.0 | 34 ± 3.0 | 31.0 ± 3.0 | 44 ± 1.0 | 44.0 ± 2.0 |
| Oxygen | 47.0 ± 2 | 48.0 ± 2.0 | 47 ± 3.0 | 48.0 ± 5.0 | 44 ± 6.0 | 47.0 ± 4.0 |
| Nitrogen | 5.0 ± 2 | 5.0 ± 2.0 | 13 ± 9.0 | 16.0 ± 6.0 | 4 ± 3.0 | 6.0 ± 5.0 |
| Silicon | 0 | 0 | 4.0 ± 3.0 | 4.0 ± 1.0 | 6.0 ± 3.0 | 1.0 ± 1.0 |
| Phosphorus | 4.0 ± 1.0 | 1.0 ± 1.0 | 5.0 ± 2.0 | 5.0 ± 1.0 | 2.0 ± 1.0 | 2.0 ± 1.0 |
Table 5.
XPS results expressed as apparent average atomic % concentration of elements on the cotton fabric surfaces after the introduction of APTS-DAP-urea as flame retardant with or without plasma/UV treatment after water-soaking.
Table 5.
XPS results expressed as apparent average atomic % concentration of elements on the cotton fabric surfaces after the introduction of APTS-DAP-urea as flame retardant with or without plasma/UV treatment after water-soaking.
| Element | Cot | Cot/DAP-urea-APTS-(ws) | Cot/DAP-urea-APTS_
PL(N2/O2)-(ws) |
|---|
| Carbon (1s) | 68.0 ± 0.6 | 67.0 ± 1.0 | 62.0 ± 1.0 |
| Oxygen (1s) | 31.0 ± 0.5 | 25.0 ± 1.0 | 29.0 ± 1.0 |
| Nitrogen (1s) | 1.0 ± 0.2 | 3.0 ± 0.1 | 3.0 ± 0.3 |
| Silicon (2p) | 0.0 | 4.0 ± 0.2 | 6.0 ± 0.3 |
| Phosphorus (2p) | 0.0 | 0.2 ± 0.3 | 0.4 ± 0.3 |
| Atomic ratios | | | |
| O/C | 0.45 | 0.37 | 0.46 |
| N/C | 0.01 | 0.04 | 0.05 |
| Si/C | 0.0 | 0.06 | 0.1 |
| P/C | 0.0 | 0.01 | 0.01 |
| P/Si | 0.0 | 0.05 | 0.07 |
Table 6.
XPS result analysis showings the concentration percentages of C(1s), O(1s), Si(2p) and N(1s) components on cotton fabric before and after plasma/UV treatments after water-soaking.
Table 6.
XPS result analysis showings the concentration percentages of C(1s), O(1s), Si(2p) and N(1s) components on cotton fabric before and after plasma/UV treatments after water-soaking.
| Sample Code | XPS Identified Groups and Respective Concentrations, % |
|---|
| | Concentration of C(1s) species | Concentration of O(1s) species |
| | All C-C, CH, N species, % | All C-O species, % | C-O-C, -O-P | C=O, P=O | Si-O |
| Cot | 31.0 | 69.0 | 100.0 | 0.0 | 0.0 |
| Cot/DAP-urea-APTS | 46.0 | 54.0 | 19.0 | 7.0 | 70.0 |
| Cot/DAP-urea-APTS_PL(N2/O2) | 39.0 | 61.0 | 18.0 | 7.0 | 75.0 |
| | Concentration Si(2p) species |
| | SiO2 | Si-N | Siloxane | Silicate (SiO3)2− | |
| Cot/DAP-urea-APTS | 17.0 | 48.0 | 35.0 | 0.0 | |
| Cot/DAP-urea-APTS_PL(N2/O2) | 13.0 | 21.0 | 50.0 | 15.0 | |
| | Concentration of N(1s) species |
| | Amide | Imine/Si-N | (NO2)− | Alkyl ammonium | Imide, -CO.N- | N-O |
| Cot/DAP-urea-APTS | 48.0 | 2.0 | 4.0 | 20.0 | - | 26.0 |
| Cot/DAP-urea-APTS_PL(N2/O2) | 6.0 | 3.0 | 1.0 | 13.0 | 45.0 | 32.0 |
Table 7.
XPS-derived atomic concentration percentages of elements and the percentages of C(1s) and O(1s) components present on cotton fibre surfaces after the introduction of DBAP with or without plasma/UV laser treatment after water-soaking.
Table 7.
XPS-derived atomic concentration percentages of elements and the percentages of C(1s) and O(1s) components present on cotton fibre surfaces after the introduction of DBAP with or without plasma/UV laser treatment after water-soaking.
| Sample Code | XPS Identified Groups and Respective Concentrations, % |
|---|
| | Concentration of C(1s) species | Concentration of O(1s) species |
| | All C-C, CH, N species *, % | All C-O species, % | C-O-C, C-O-P | C=O, P=O |
| Cot/DBAP | 34.0 | 66.0 | 95.0 | 5.0 |
| Cot_PL(Ar/CO2)_DBAP_PL(N2/O2) | 24.0 | 76.0 | 98.0 | 2.0 |
| Cot/DBAP_PL(N2/CO2) | 27.0 | 73.0 | 89.0 | 11.0 |
| | Element Concentrations, % |
| | Carbon | Oxygen | Nitrogen | Phosphorus | O/C |
| Cot/DBAP | 67.0 ± 1.0 | 29.0 ± 1.0 | 1.0 ± 0.4 | 0.7 ± 0.1 | 0.40 |
| Cot_PL(Ar/CO2)_DBAP_PL(N2/O2) | 66.0 ± 0.3 | 34.0 ± 0.4 | 0.6 ± 0.2 | 0.1 ± 0.2 | 0.50 |
| Cot/DBAP_PL(N2/CO2) | 63.0 ± 1.0 | 35.0 ± 1.0 | 1.0 ± 0.1 | 1.0 ±0.3 | 0.60 |
Table 8.
Thermal analysis data for impregnated and control cotton samples before and after water-soaking with and without specified plasma/UV laser treatments.
Table 8.
Thermal analysis data for impregnated and control cotton samples before and after water-soaking with and without specified plasma/UV laser treatments.
| Sample | Onset Decomposition Temperature after 10% Mass Loss, T10%, °C | DTG Peaks, °C | Residue at 400 °C, wt% |
|---|
| Peak1 (DTG1) | Peak2
(DTG2) |
|---|
| Cot | 290 | 339 | 461 | 21.0 ± 1.0 |
| Cot-(ws) * | 313 | 339 | 469 | 13.0 ± 1.0 |
| Cot/GM-APTS | 275 | 310 | 486 | 40.0 ± 1.0 |
| Cot/GM-APTS_PL(N2/O2) | 281 | 306 | 486 | 38.0 ± 1.0 |
| Cot/GM-APTS (ws) | 285 | 313 | 490 | 14.0 ± 1.0 |
| Cot/GM-APTS_PL(N2/O2)-(ws) | 287 | 313 | 489 | 15.0 ± 1.0 |
| Cot/DAP-urea-APTS | 270 | 313 | 524 | 49.0 ± 1.0 |
| Cot/DAP-urea-APTS_PL(N2/O2) | 291 | 312 | 511 | 50.0 ± 1.0 |
| Cot/DAP-urea-APTS (ws) | 287 | 313 | 489 | 33.0 ± 1.0 |
| Cot/DAP-urea-APTS_PL(N2/O2) (ws) | 285 | 313 | 490 | 31.0 ± 1.0 |
| Cot/DBAP | 189 | 291 | 504 | 35.0 ± 1.5 |
| Cot_PL(Ar/CO2)_DBAP | 196 | 293 | 497 | 32.6 ± 1.0 |
| Cot P(Ar/CO2)_DBAP | 188 | 293 | 495 | 30.5 ± 1.5 |
| Cot/DBAP-(ws) | 307 | 332 | 476 | 14.0 ± 0.3 |
| Cot_PL(Ar/CO2)_DBAP-(ws) | 300 | 330 | 490 | 16.4 ± 1.0 |
| Cot P(Ar/CO2)_DBAP (ws) | 303 | 330 | 472 | 12.0 ± 1.0 |
| Cot/DBAP_P(N2/CO2)-(ws) | 281 | 306 | 490 | 23.0 ± 1.0 |
| Cot/DBAP_ PL(N2/CO2) (ws) | 285 | 319 | 489 | 19.0 ± 1.0 |
| Cot_PL(Ar/CO2)_DBAP_PL(N2/O2)-(ws) | 292 | 322 | 489 | 15.0 ± 1.0 |
Table 9.
Vertical flammability strip test and LOI data for cotton samples.
Table 9.
Vertical flammability strip test and LOI data for cotton samples.
| Sample Code | Damaged Length, mm | Burning Rate, mm/s | Limiting Oxygen Index, vol% |
|---|
| | Before Water- Soaking | After Water- Soaking | Before Water- Soaking | After Water- Soaking | (Unsoaked/Water-Soaked Values) |
|---|
| Cotton control | Burnt | Burnt | 3.0 | 2.5 | 19.5/18.5 |
| Cot/GM | 180 * | BE/Char | 3.6 | 3.6 | - |
| Cot/GM_PL(N2/O2) | 180 * | BE/Char | 3.0 | 3.6 | - |
| Cot/GM-APTS | 85 | BE/Char | 2.1 | 3.6 | - |
| Cot/GM-APTS_PL(N2/O2) | 55 | BE/Char | 1.4 | 3.3 | - |
| Cot/DAP-urea-APTS | 60 | BE/Char | 1.5 | 3.0 | - |
| Cot/DAP-urea-APTS_PL(N2/O2) | 50 | BE/Char | 1.3 | 3.0 | - |
| Cot/DBAP | 70 | BE/Char | 7.0 | 3.8 | 27.4/19.5 |
| Cot_PL(Ar/CO2)_DBAP | 70 | BE/Char | 7.0 | 3.6 | 27.7/19.5 |
| Cot_P(Ar/CO2)_DBAP | 70 | BE/Char | 7.0 | 3.7 | 27.7/19.5 |
| Cot/DBAP_P(N2/CO2) | - | BE/Char | - | 3.1 | -/20.0 |
| Cot/DBAP_PL(N2/CO2) | 60 | BE/Char | 6.0 | 3.1 | 27.7/20.0 |
| Cot_PL(Ar/CO2)_DBAP_PL(N2/O2) | - | BE/Char | - | 3.2 | -/19.7 |
Table 10.
EDX results as average weight percent of elements in the char obtained from the vertical flammability strip test for Cot/APTS-DAP-Urea samples after water-soaking with and without plasma/UV treatment.
Table 10.
EDX results as average weight percent of elements in the char obtained from the vertical flammability strip test for Cot/APTS-DAP-Urea samples after water-soaking with and without plasma/UV treatment.
| Element | Cot/DAP-Urea-APTS-(ws) | Cot/DAP-Urea-APTS_PL(N2/O2)-(ws) |
|---|
| | Weight % | Weight % |
|---|
| C | 55.0 ± 2.0 | 50.0 ± 3.0 |
| N | 12.0 ± 1.0 | 10.0 ± 1.0 |
| O | 31.0 ± 1.0 | 30.0 ± 3.0 |
| Si | 2.0 ± 3.0 | 6.0 ± 2.0 |
| P | 0.0 | 5.0 ± 3.0 |
| Atomic ratios | | |
| O/C | 0.56 | 0.60 |
| N/C | 0.22 | 0.20 |
| Si/C | 0.04 | 1.20 |
| P/C | 0.0 | 1.00 |
| P/Si | 0.0 | 0.83 |
Table 11.
Cotton samples coated with combinations of phosphorus-, nitrogen- and silicon-containing flame retardants with plasma/UV laser post-treatment conditions.
Table 11.
Cotton samples coated with combinations of phosphorus-, nitrogen- and silicon-containing flame retardants with plasma/UV laser post-treatment conditions.
| Sample Code * | Plasma Gas | Power Dosage,
W/m2·min |
|---|
| Cot | - | - |
| Cot_PL(N2/O2) | N2-O2 | 100 |
| Cot/GM | - | - |
| Cot/GM_ PL(N2/O2) | N2-O2 | 100 |
| Cot/GM-TEOS | - | - |
| Cot/GM-TEOS_PL(N2/O2) | N2-O2 | 100 |
| Cot/GM-APTS | - | - |
| Cot/GM-APTS_PL(N2/O2) | N2-O2 | 100 |
| Cot/DAP-urea | - | - |
| Cot/DAP-urea_PL(N2/O2) | N2-O2 | 100 |
| Cot/DAP-urea-TEOS | - | - |
| Cot/DAP-urea-TEOS_PL(N2/O2) | N2-O2 | 100 |
| Cot/DAP-urea-APTS | - | - |
| Cot/DAP-urea-APTS_PL(N2/O2) | N2-O2 | 100 |
Table 12.
Cotton samples impregnated with DBAP and subjected to a variety of plasma/UV treatments with and without UV laser at 200 W/m2·min laser power.
Table 12.
Cotton samples impregnated with DBAP and subjected to a variety of plasma/UV treatments with and without UV laser at 200 W/m2·min laser power.
| Sample Code | Plasma Gas | Plasma Exposure Sequence * | UV-Laser Energy, 228 W |
|---|
| Cot | - | - | - |
| Cot_PL(N2/O2) | N2/O2 | Post-treatment | √ |
| Cot/DBAP | - | - | - |
| Cot_P(Ar/CO2)_DBAP | Ar/CO2 | Pre-treatment | - |
| Cot_PL(Ar/CO2)_DBAP | Ar/CO2 | Pre-treatment | √ |
| Cot/DBAP_P(N2/CO2) | N2/CO2 | Post-treatment | - |
| Cot/DBAP_PL(N2/CO2) | N2/CO2 | Post-treatment | √ |
| Cot_PL(Ar/CO2)_DBAP_PL(N2/O2) | Pre: Ar/CO2
Post: N2/O2 | Pre- and post- treatment | √ |


