
Protein Adsorption at Nanorough Titanium Oxide Surfaces: The Importance of Surface Statistical Parameters beyond Surface Roughness


Abstract
:
1. Introduction
2. Materials and Methods
2.1. Preparation of Titanium Oxide Model Surfaces
2.2. XPS Characterization of the Titanium Oxide Model Surfaces
2.3. AFM Characterization of the Titanium Oxide Model Surfaces
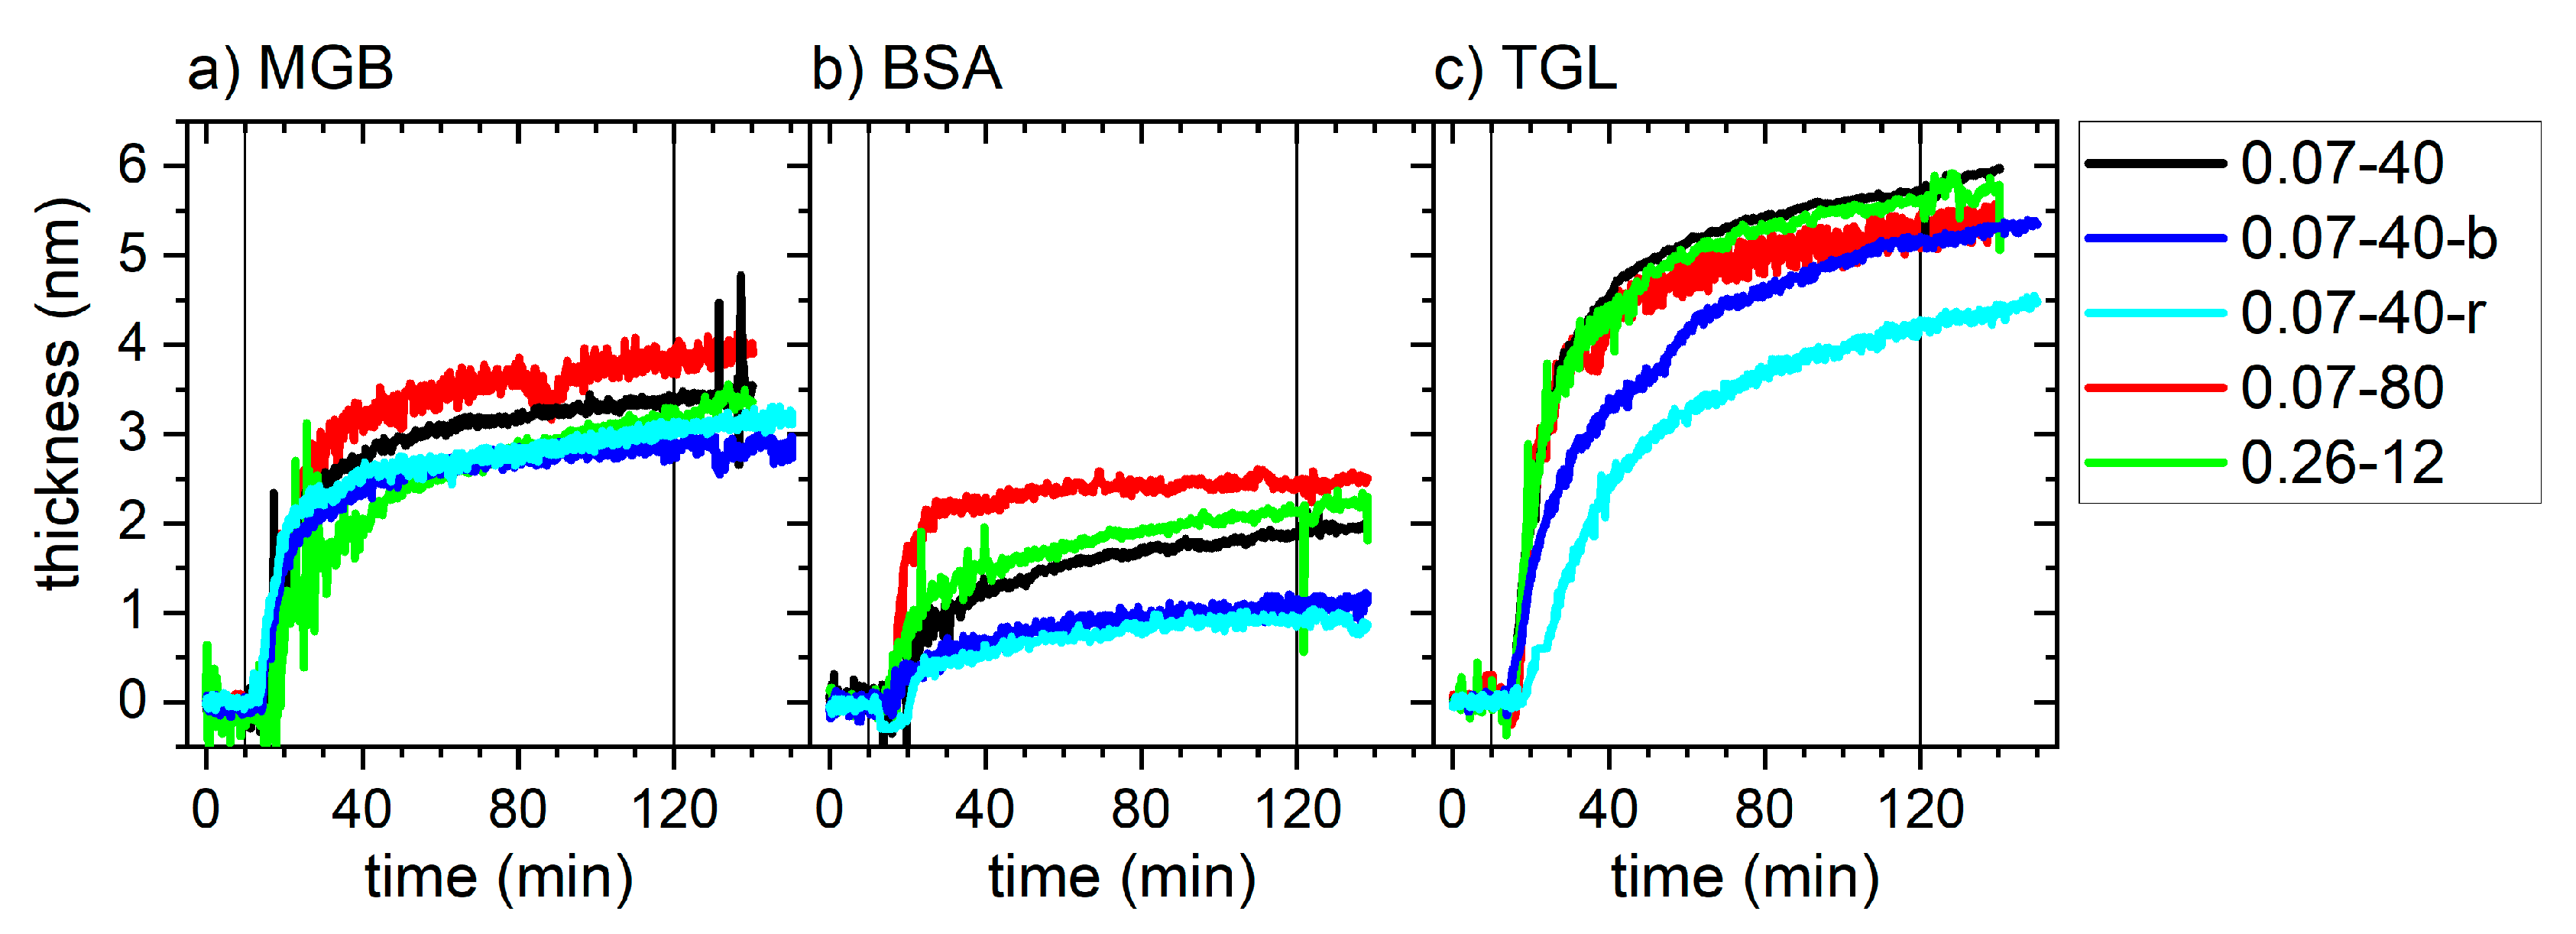
2.4. In Situ Ellipsometry Investigation of Protein Adsorption Kinetics
3. Results and Discussion
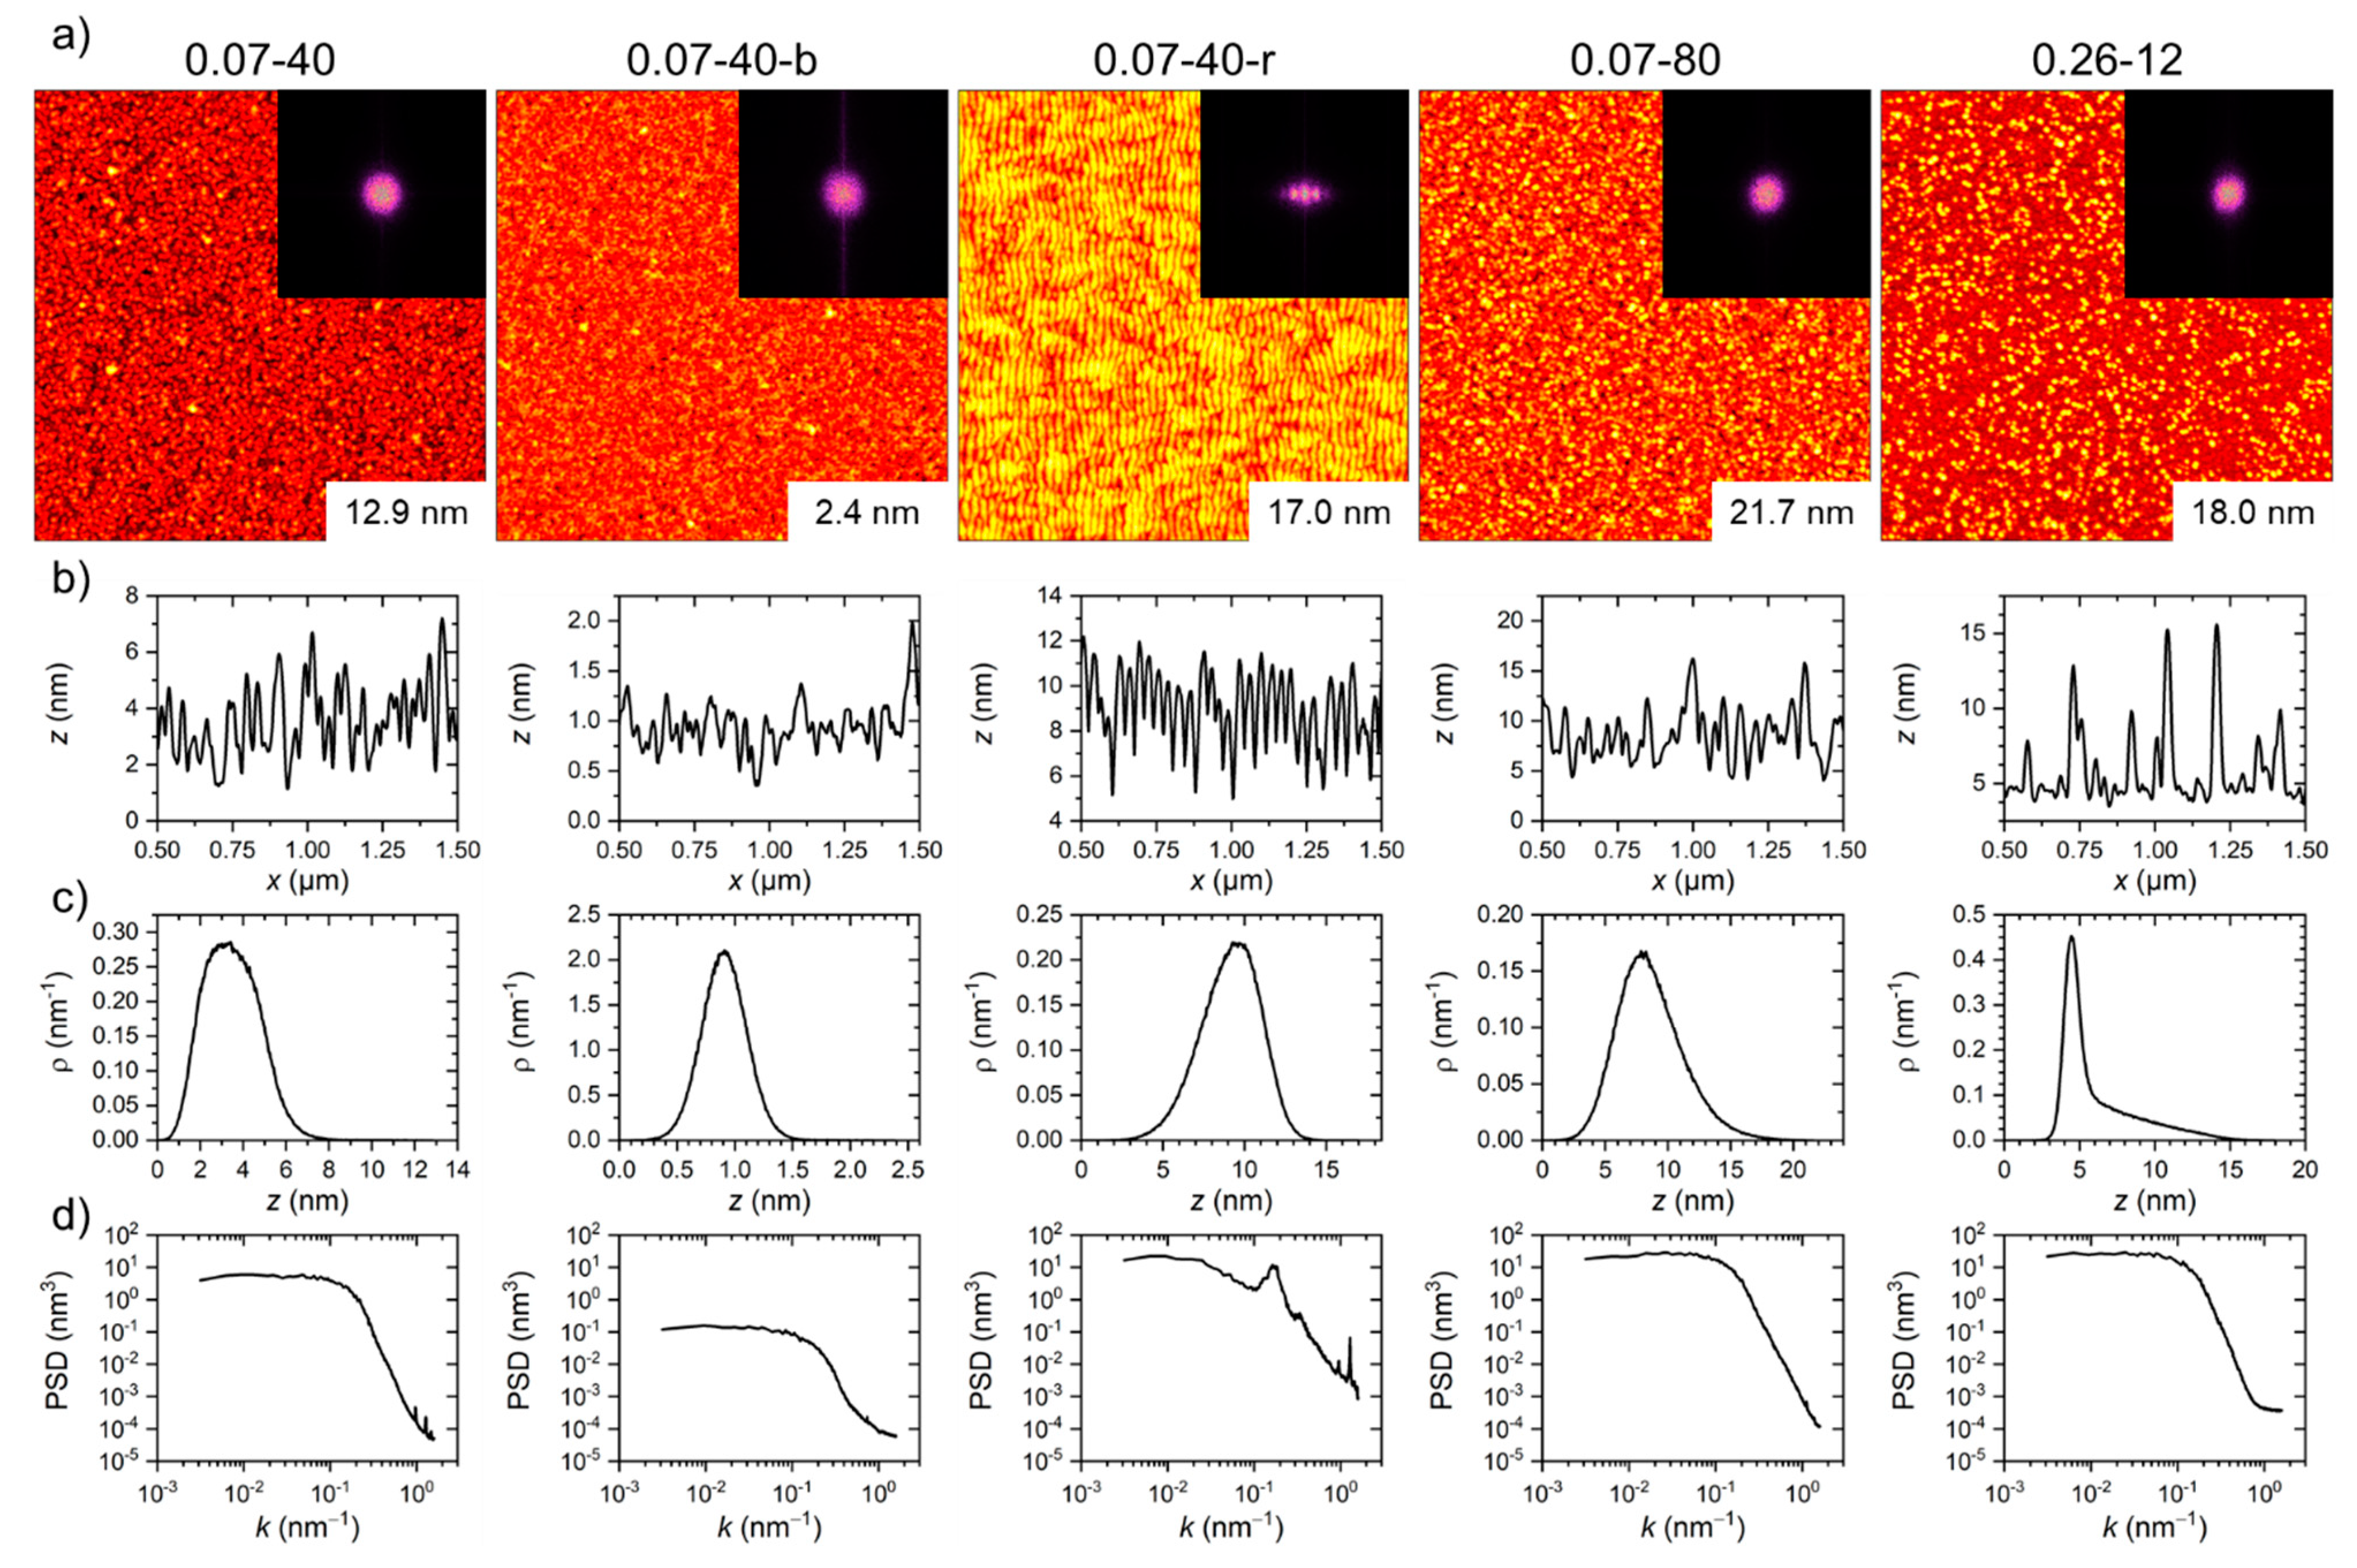
3.1. Characterization of the Titanium Oxide Model Surfaces
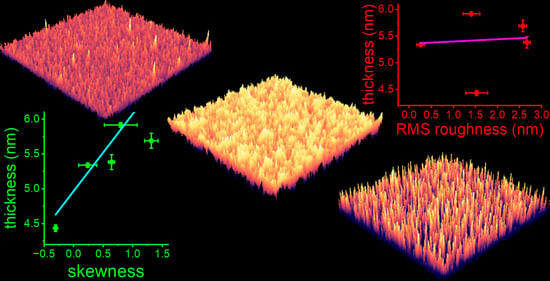
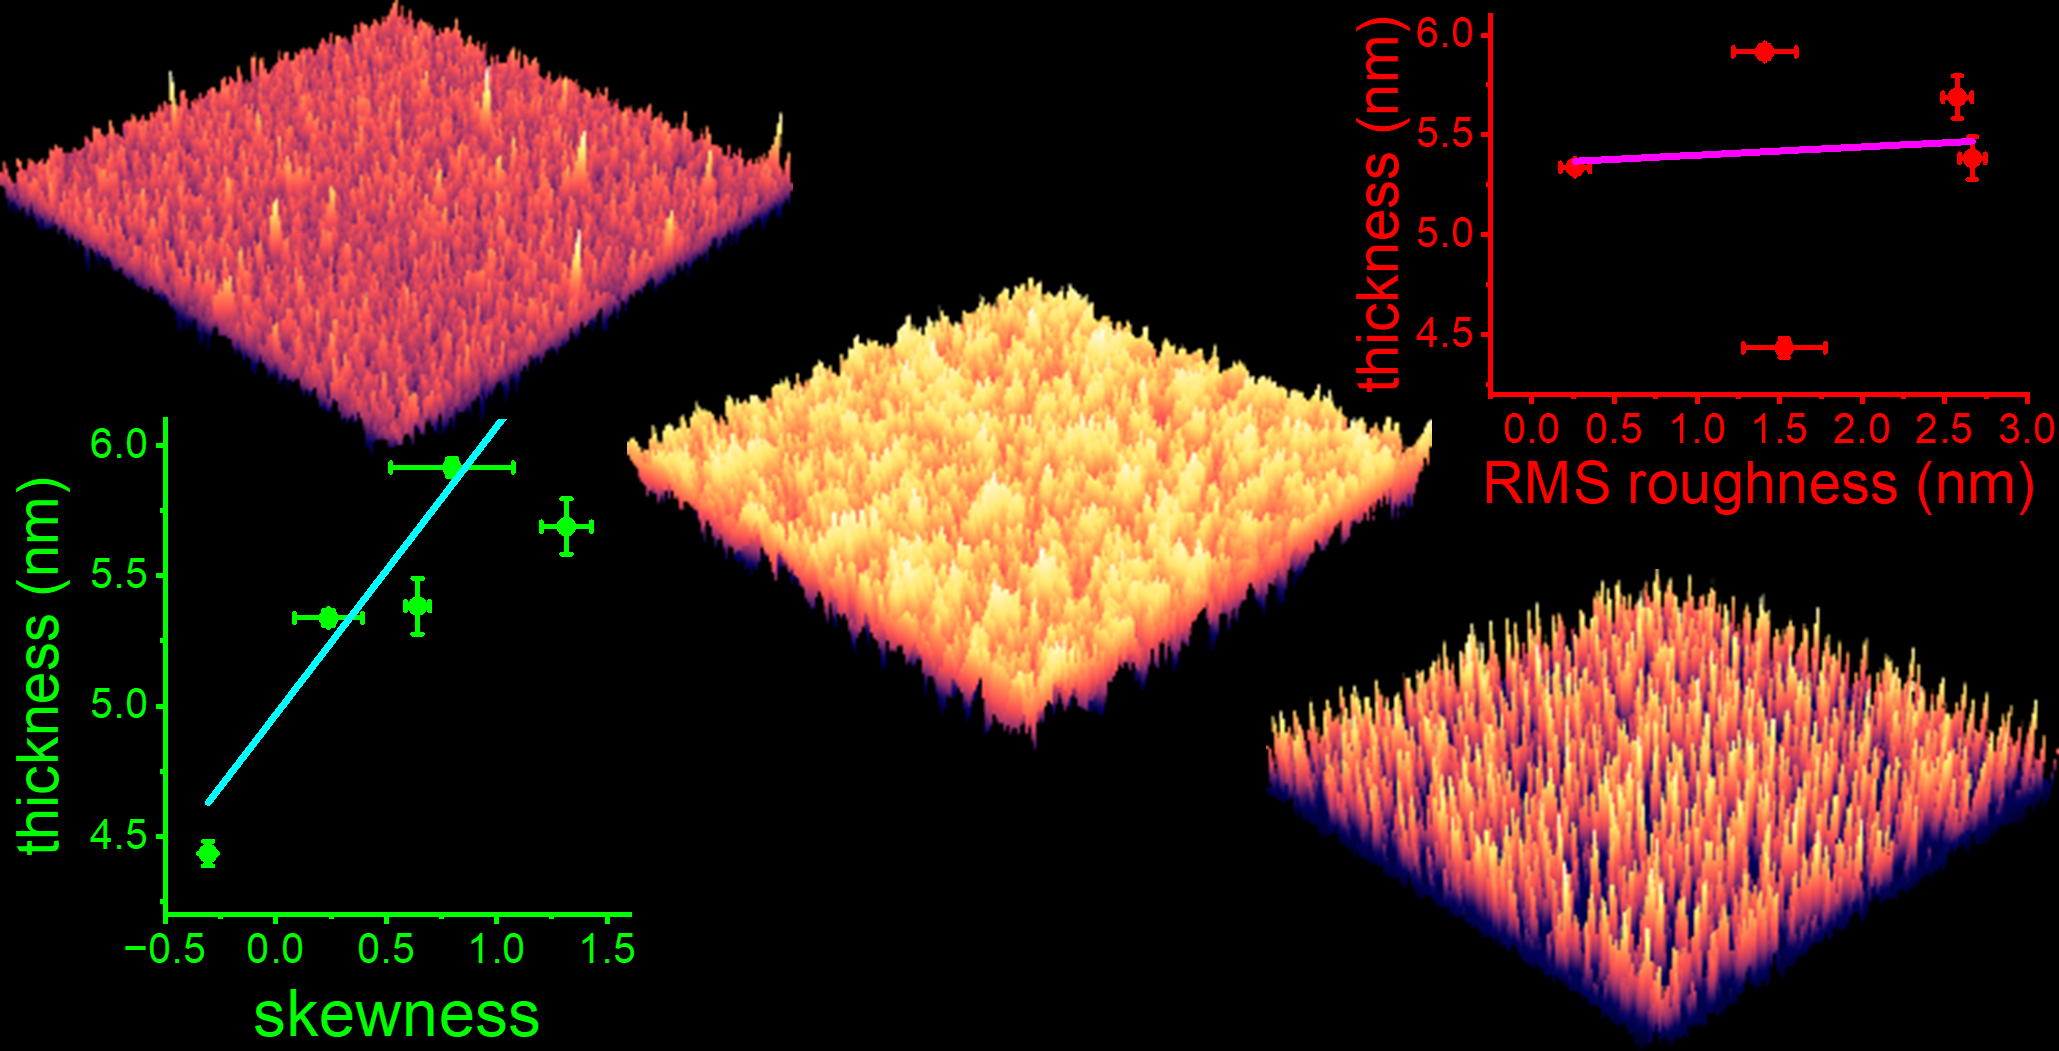
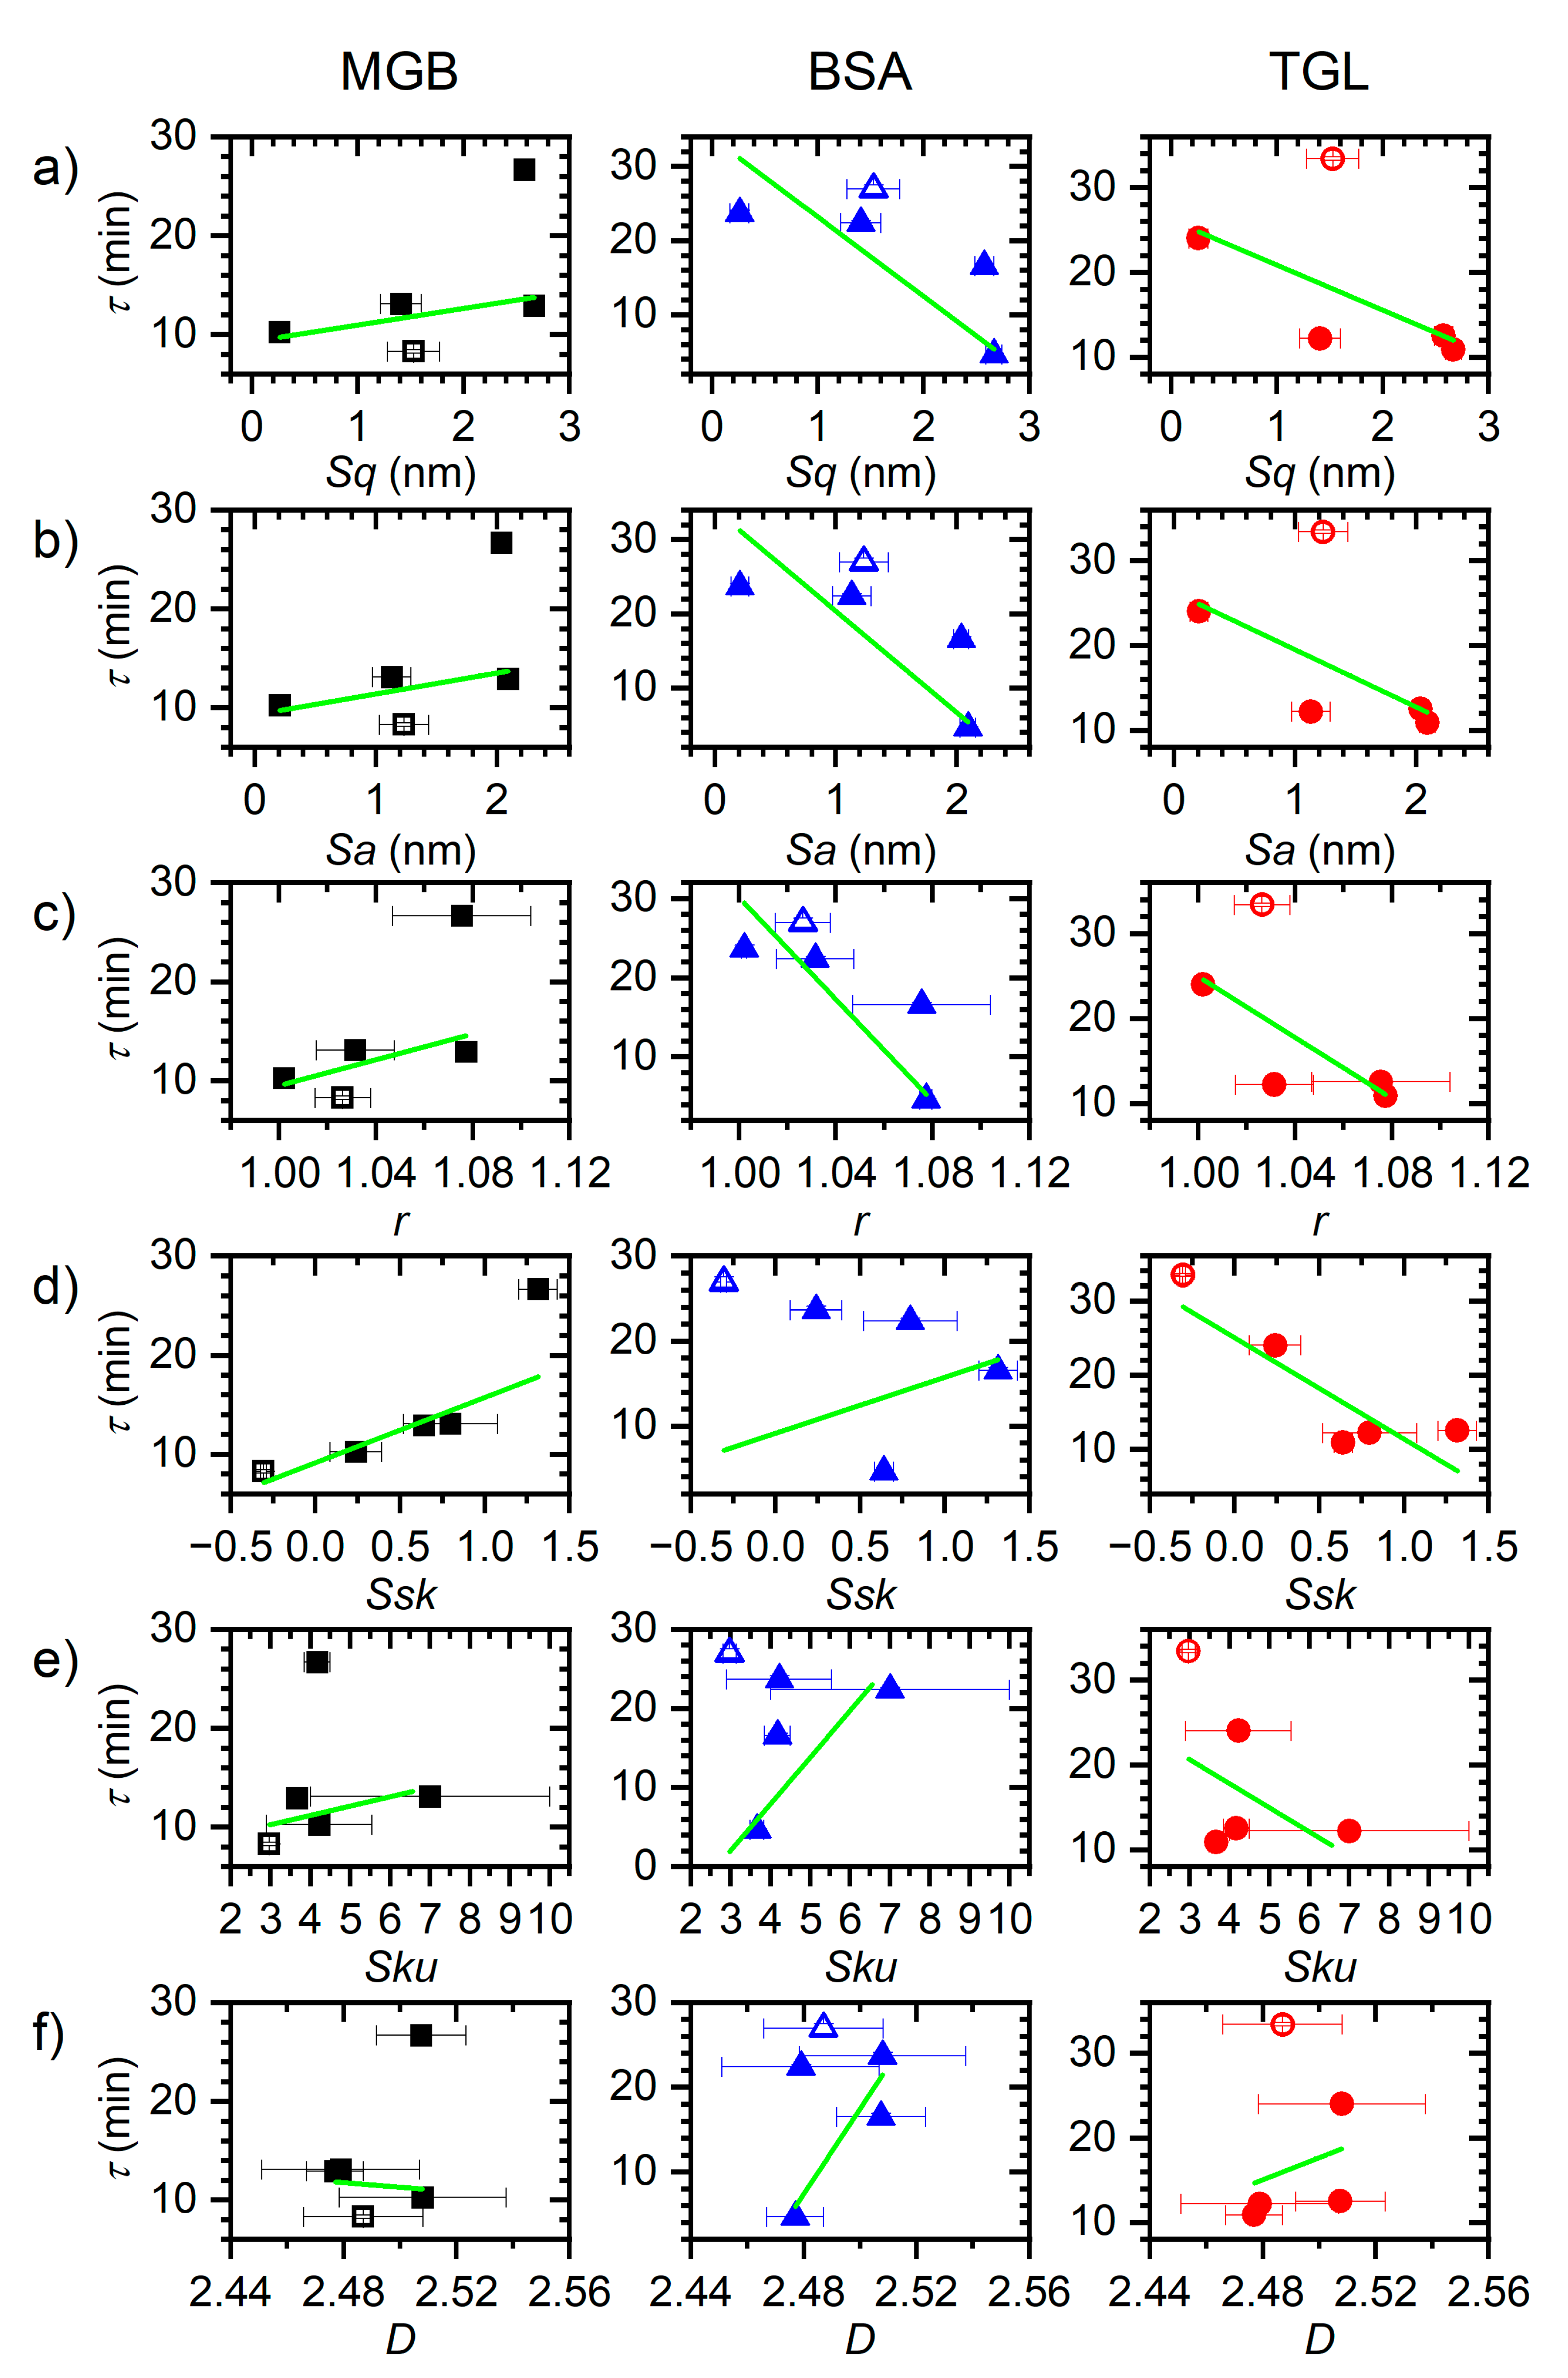
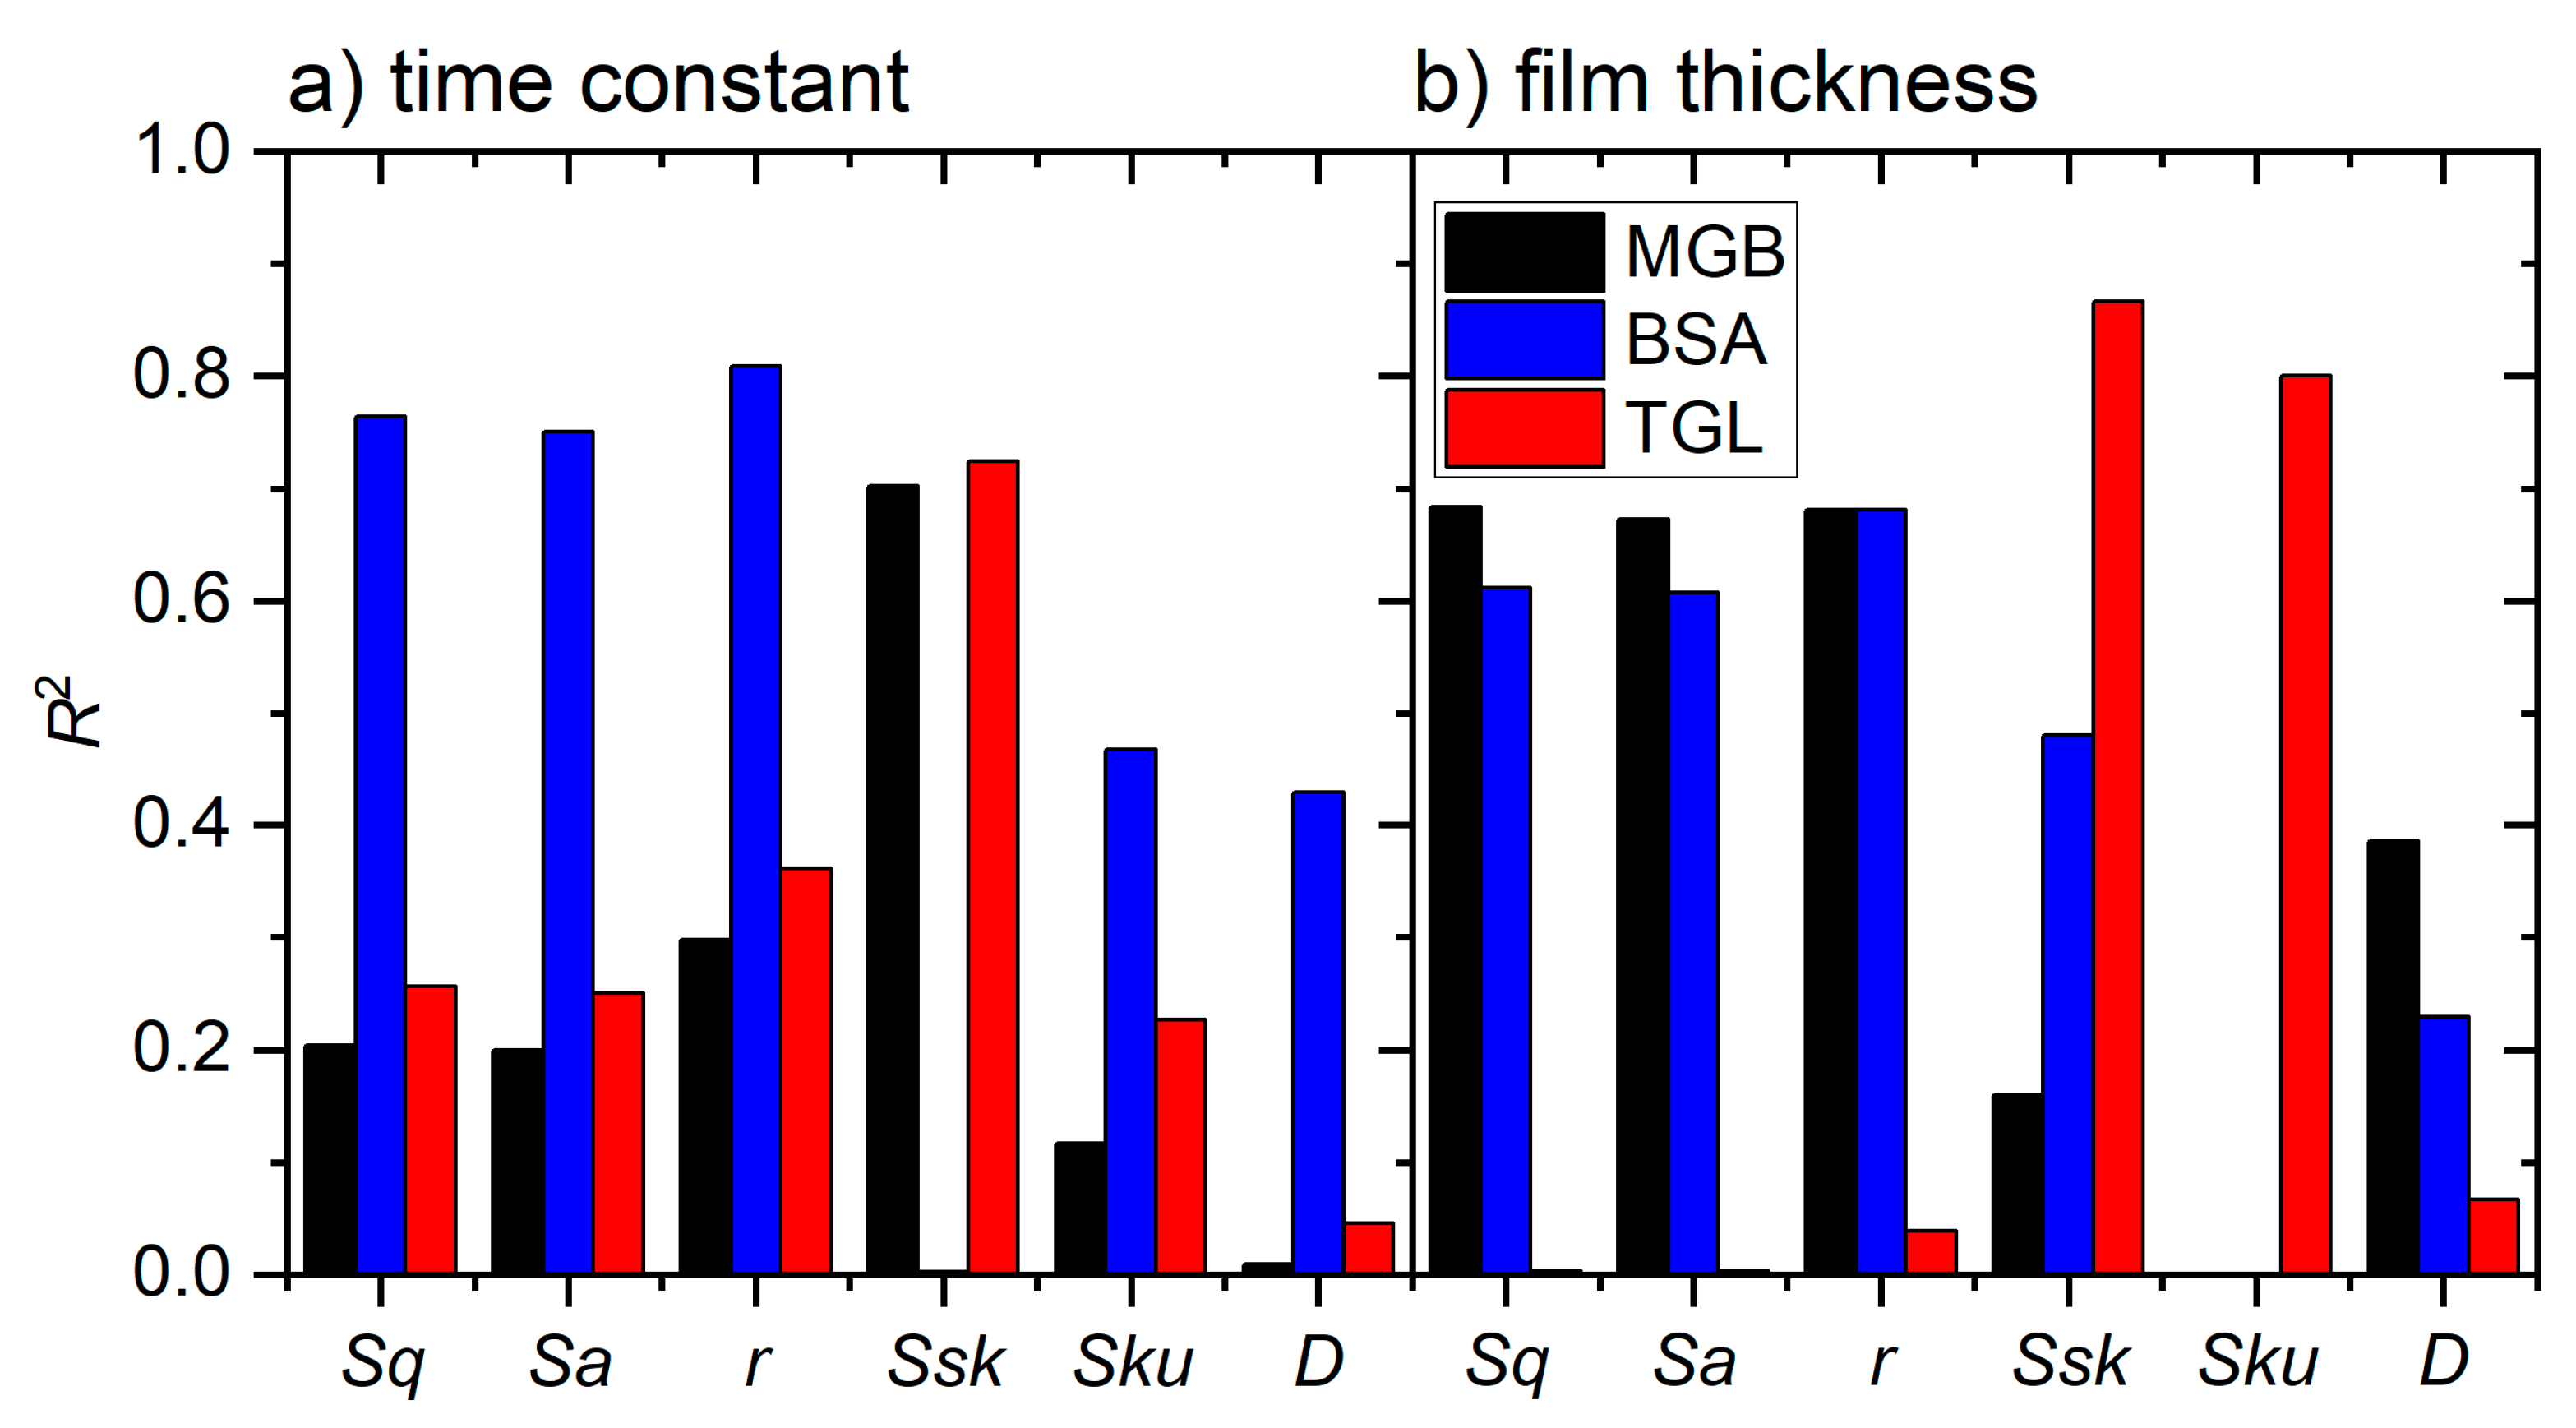
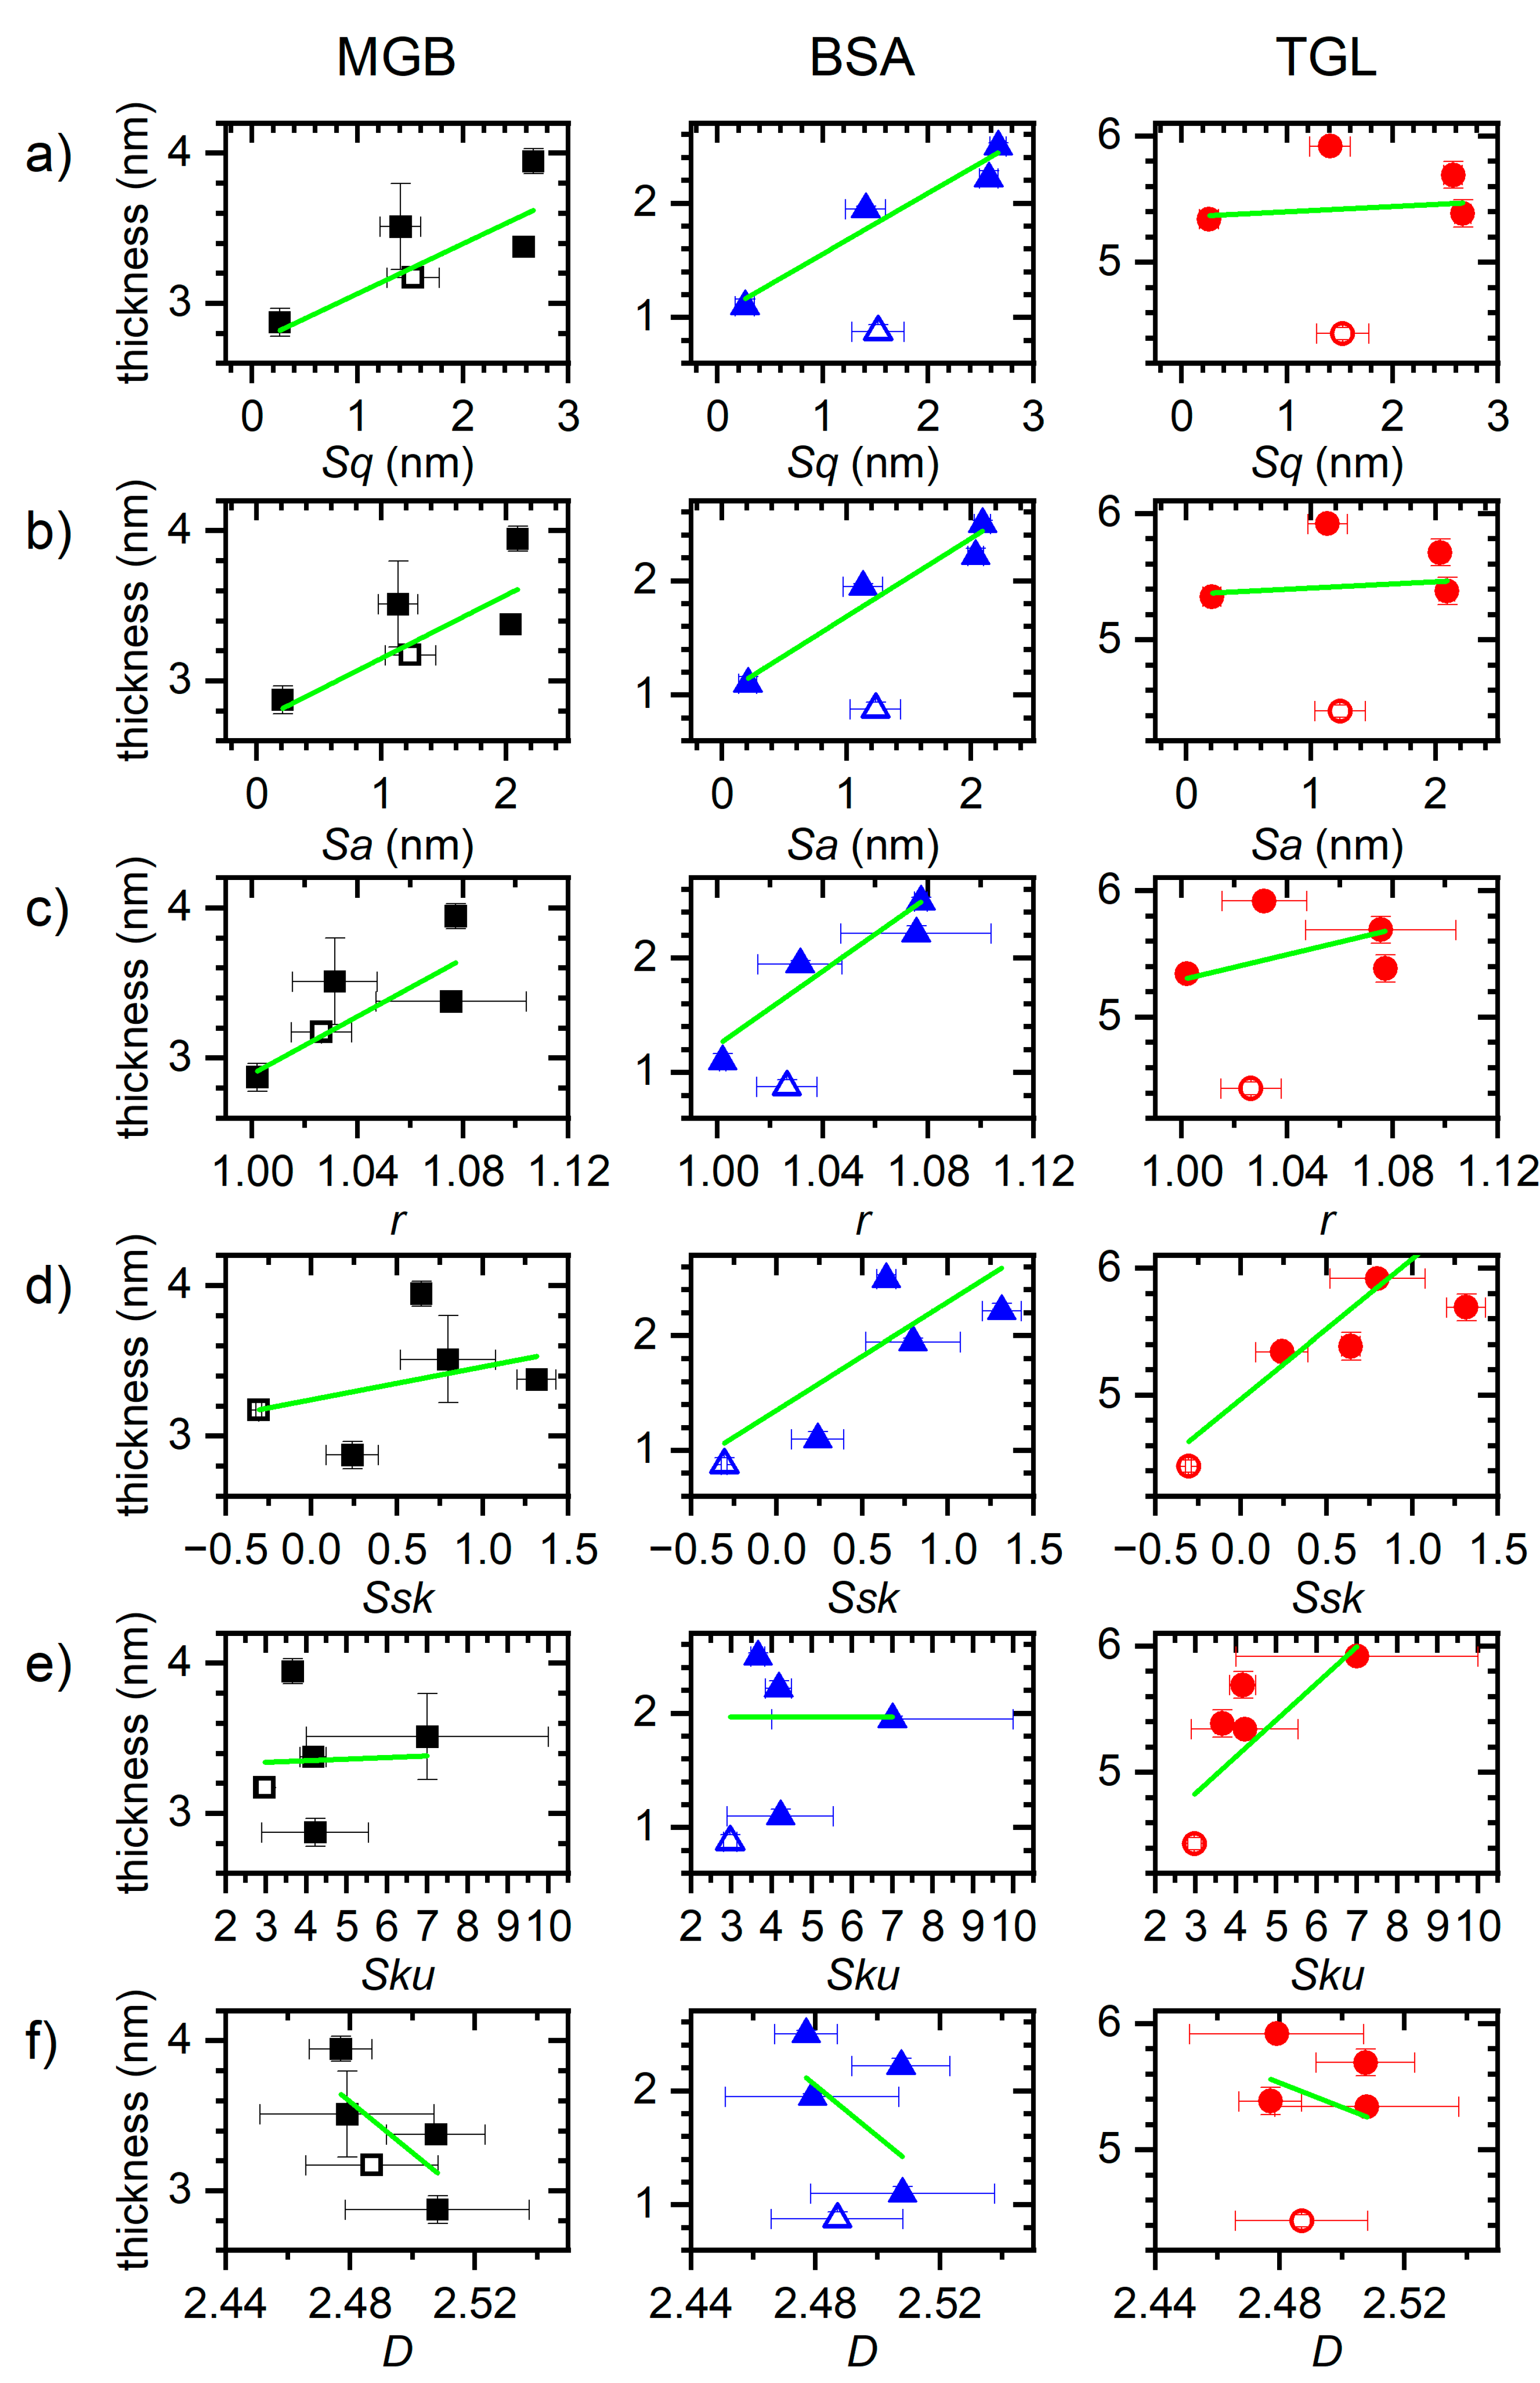
3.2. Effect of Titanium Oxide Surface Morphology on Protein Adsorption
4. Conclusions
Supplementary Materials
Author Contributions
Funding
Data Availability Statement
Conflicts of Interest
References
- Wilson, C.J.; Clegg, R.E.; Leavesley, D.I.; Pearcy, M.J. Mediation of biomaterial-cell interactions by adsorbed proteins: A review. Tissue Eng. 2005, 11, 1–18. [Google Scholar] [CrossRef] [PubMed]
- Kasemo, B.; Gold, J. Implant surfaces and interface processes. Adv. Dent. Res. 1999, 13, 8–20. [Google Scholar] [CrossRef] [PubMed]
- Anselme, K. Osteoblast adhesion on biomaterials. Biomaterials 2000, 21, 667–681. [Google Scholar] [CrossRef]
- Puleo, D.A.; Nanci, A. Understanding and controlling the bone–implant interface. Biomaterials 1999, 20, 2311–2321. [Google Scholar] [CrossRef]
- Norde, W. Adsorption of proteins from solution at the solid-liquid interface. Adv. Colloid Interface Sci. 1986, 25, 267–340. [Google Scholar] [CrossRef]
- Gray, J.J. The interaction of proteins with solid surfaces. Curr. Opin. Struct. Biol. 2004, 14, 110–115. [Google Scholar] [CrossRef]
- Rabe, M.; Verdes, D.; Seeger, S. Understanding protein adsorption phenomena at solid surfaces. Adv. Colloid Interface Sci. 2011, 162, 87–106. [Google Scholar] [CrossRef] [Green Version]
- Lee, W.-H.; Loo, C.-Y.; Rohanizadeh, R. A review of chemical surface modification of bioceramics: Effects on protein adsorption and cellular response. Colloids Surf. B Biointerfaces 2014, 122, 823–834. [Google Scholar] [CrossRef]
- Gittens, R.A.; Scheideler, L.; Rupp, F.; Hyzy, S.L.; Geis-Gerstorfer, J.; Schwartz, Z.; Boyan, B.D. A review on the wettability of dental implant surfaces II: Biological and clinical aspects. Acta Biomater. 2014, 10, 2907–2918. [Google Scholar] [CrossRef] [Green Version]
- Thevenot, P.; Hu, W.; Tang, L. Surface chemistry influences implant biocompatibility. Curr. Top. Med. Chem. 2008, 8, 270–280. [Google Scholar] [CrossRef]
- Lord, M.S.; Foss, M.; Besenbacher, F. Influence of nanoscale surface topography on protein adsorption and cellular response. Nano Today 2010, 5, 66–78. [Google Scholar] [CrossRef]
- Firkowska-Boden, I.; Zhang, X.; Jandt, K.D. Controlling Protein Adsorption through Nanostructured Polymeric Surfaces. Adv. Healthcare Mater. 2018, 7. [Google Scholar] [CrossRef] [PubMed]
- Manzi, B.M.; Werner, M.; Ivanova, E.P.; Crawford, R.J.; Baulin, V.A. Simulations of Protein Adsorption on Nanostructured Surfaces. Sci. Rep. 2019, 9, 4694. [Google Scholar] [CrossRef] [PubMed]
- Tebbe, M.; Kuttner, C.; Männel, M.; Fery, A.; Chanana, M. Colloidally stable and surfactant-free protein-coated gold nanorods in biological media. ACS Appl. Mater. Interfaces 2015, 7, 5984–5991. [Google Scholar] [CrossRef]
- Höller, R.P.M.; Jahn, I.J.; Cialla-May, D.; Chanana, M.; Popp, J.; Fery, A.; Kuttner, C. Biomacromolecular-Assembled Nanoclusters: Key Aspects for Robust Colloidal SERS Sensing. ACS Appl. Mater. Interfaces 2020, 12, 57302–57313. [Google Scholar] [CrossRef]
- Shezad, K.; Zhang, K.; Hussain, M.; Dong, H.; He, C.; Gong, X.; Xie, X.; Zhu, J.; Shen, L. Surface Roughness Modulates Diffusion and Fibrillation of Amyloid-β Peptide. Langmuir 2016, 32, 8238–8244. [Google Scholar] [CrossRef]
- Yang, Y.; Yu, M.; Böke, F.; Qin, Q.; Hübner, R.; Knust, S.; Schwiderek, S.; Grundmeier, G.; Fischer, H.; Keller, A. Effect of nanoscale surface topography on the adsorption of globular proteins. Appl. Surf. Sci. 2021, 535, 147671. [Google Scholar] [CrossRef]
- Sedel, L. Evolution of alumina-on-alumina implants: A review. Clin. Orthop. Relat. Res. 2000, 48–54. [Google Scholar] [CrossRef]
- Özkurt, Z.; Kazazoğlu, E. Zirconia dental implants: A literature review. J. Oral Implantol. 2011, 37, 367–376. [Google Scholar] [CrossRef]
- Özcan, M.; Hämmerle, C. Titanium as a Reconstruction and Implant Material in Dentistry: Advantages and Pitfalls. Materials 2012, 5, 1528–1545. [Google Scholar] [CrossRef] [Green Version]
- Levine, B.R.; Sporer, S.; Poggie, R.A.; Della Valle, C.J.; Jacobs, J.J. Experimental and clinical performance of porous tantalum in orthopedic surgery. Biomaterials 2006, 27, 4671–4681. [Google Scholar] [CrossRef] [PubMed]
- Rechendorff, K.; Hovgaard, M.B.; Foss, M.; Zhdanov, V.P.; Besenbacher, F. Enhancement of Protein Adsorption Induced by Surface Roughness. Langmuir 2006, 22, 10885–10888. [Google Scholar] [CrossRef] [PubMed]
- Cai, K.; Bossert, J.; Jandt, K.D. Does the nanometre scale topography of titanium influence protein adsorption and cell proliferation? Colloids Surf. B Biointerfaces 2006, 49, 136–144. [Google Scholar] [CrossRef] [PubMed]
- Dolatshahi-Pirouz, A.; Jensen, T.; Kraft, D.C.; Foss, M.; Kingshott, P.; Hansen, J.L.; Larsen, A.N.; Chevallier, J.; Besenbacher, F. Fibronectin adsorption, cell adhesion, and proliferation on nanostructured tantalum surfaces. ACS Nano 2010, 4, 2874–2882. [Google Scholar] [CrossRef] [PubMed]
- Rockwell, G.P.; Lohstreter, L.B.; Dahn, J.R. Fibrinogen and albumin adsorption on titanium nanoroughness gradients. Colloids Surf. B Biointerfaces 2012, 91, 90–96. [Google Scholar] [CrossRef] [PubMed]
- Hovgaard, M.B.; Rechendorff, K.; Chevallier, J.; Foss, M.; Besenbacher, F. Fibronectin adsorption on tantalum: The influence of nanoroughness. J. Phys. Chem. B 2008, 112, 8241–8249. [Google Scholar] [CrossRef] [PubMed]
- Nishimoto, S.K.; Nishimoto, M.; Park, S.-W.; Lee, K.-M.; Kim, H.-S.; Koh, J.-T.; Ong, J.L.; Liu, Y.; Yang, Y. The effect of titanium surface roughening on protein absorption, cell attachment, and cell spreading. Int. J. Oral Maxillofac. Implant. 2008, 23, 675–680. [Google Scholar]
- Nagassa, M.E.; Daw, A.E.; Rowe, W.G.; Carley, A.; Thomas, D.W.; Moseley, R. Optimisation of the hydrogen peroxide pre-treatment of titanium: Surface characterisation and protein adsorption. Clin. Oral Implants Res. 2008, 19, 1317–1326. [Google Scholar] [CrossRef]
- Richert, L.; Variola, F.; Rosei, F.; Wuest, J.D.; Nanci, A. Adsorption of proteins on nanoporous Ti surfaces. Surf. Sci. 2010, 604, 1445–1451. [Google Scholar] [CrossRef]
- Sela, M.N.; Badihi, L.; Rosen, G.; Steinberg, D.; Kohavi, D. Adsorption of human plasma proteins to modified titanium surfaces. Clin. Oral Implants Res. 2007, 18, 630–638. [Google Scholar] [CrossRef]
- Sabirianov, R.F.; Rubinstein, A.; Namavar, F. Enhanced initial protein adsorption on engineered nanostructured cubic zirconia. Phys. Chem. Chem. Phys. 2011, 13, 6597–6609. [Google Scholar] [CrossRef] [PubMed] [Green Version]
- Sommerfeld, J.; Richter, J.; Niepelt, R.; Kosan, S.; Keller, T.F.; Jandt, K.D.; Ronning, C. Protein adsorption on nano-scaled, rippled TiO2 and Si surfaces. Biointerphases 2012, 7, 55. [Google Scholar] [CrossRef] [PubMed] [Green Version]
- Zhao, Y.; Wang, G.; Lu, T. Characterization of Amorphous and Crystalline Rough Surface. Principles and Applications; Academic Press: San Diego, CA, USA, 2001; ISBN 9780080531380. [Google Scholar]
- Takeuchi, K.A. An appetizer to modern developments on the Kardar–Parisi–Zhang universality class. Phys. A 2018, 504, 77–105. [Google Scholar] [CrossRef] [Green Version]
- Orrillo, P.A.; Santalla, S.N.; Cuerno, R.; Vázquez, L.; Ribotta, S.B.; Gassa, L.M.; Mompean, F.J.; Salvarezza, R.C.; Vela, M.E. Morphological stabilization and KPZ scaling by electrochemically induced co-deposition of nanostructured NiW alloy films. Sci. Rep. 2017, 7, 17997. [Google Scholar] [CrossRef] [Green Version]
- Almeida, R.A.L.; Ferreira, S.O.; Oliveira, T.J.; Reis, F.D.A.A. Universal fluctuations in the growth of semiconductor thin films. Phys. Rev. B 2014, 89. [Google Scholar] [CrossRef] [Green Version]
- Nečas, D.; Klapetek, P. Gwyddion: An open-source software for SPM data analysis. Open Phys. 2012, 10, 99. [Google Scholar] [CrossRef]
- Available online: http://gwyddion.net/documentation/user-guide-en/ (accessed on 20 January 2021).
- Latour, R. Biomaterials: Protein–Surface Interactions. In Encyclopedia of Biomaterials and Biomedical Engineering, Second Edition-Four Volume Set; Wnek, G., Bowlin, G., Eds.; CRC Press: Boca Raton, FL, USA, 2008; pp. 270–284. ISBN 978-1-4200-7802-2. [Google Scholar]
- Fujiwara, H. Spectroscopic Ellipsometry. Principles and Applications / Hiroyuki Fujiwara; John Wiley: Chichester, UK, 2007; ISBN 0470016086. [Google Scholar]
- Tsargorodskaya, A.; Nabok, A.V.; Ray, A.K. Ellipsometric study of the adsorption of bovine serum albumin into porous silicon. Nanotechnology 2004, 15, 703–709. [Google Scholar] [CrossRef]
- Keller, A.; Facsko, S.; Möller, W. Minimization of topological defects in ion-induced ripple patterns on silicon. New J. Phys. 2008, 10, 63004. [Google Scholar] [CrossRef]
- López, J.M.; Rodríguez, M.A.; Cuerno, R. Power spectrum scaling in anomalous kinetic roughening of surfaces. Phys. A 1997, 246, 329–347. [Google Scholar] [CrossRef] [Green Version]
- Auger, M.A.; Vázquez, L.; Cuerno, R.; Castro, M.; Jergel, M.; Sánchez, O. Intrinsic anomalous surface roughening of TiN films deposited by reactive sputtering. Phys. Rev. B 2006, 73, 117. [Google Scholar] [CrossRef] [Green Version]
- Ojeda, F.; Cuerno, R.; Salvarezza, R.; Vazquez, L. Dynamics of rough interfaces in chemical vapor deposition: Experiments and a model for silica films. Phys. Rev. Lett. 2000, 84, 3125–3128. [Google Scholar] [CrossRef] [PubMed] [Green Version]
- Jacobs, T.D.B.; Junge, T.; Pastewka, L. Quantitative characterization of surface topography using spectral analysis. Surf. Topogr.: Metrol. Prop. 2017, 5, 13001. [Google Scholar] [CrossRef]
- Muñoz-García, J.; Castro, M.; Cuerno, R. Nonlinear ripple dynamics on amorphous surfaces patterned by ion beam sputtering. Phys. Rev. Lett. 2006, 96, 86101. [Google Scholar] [CrossRef] [PubMed] [Green Version]
- Barabási, A.-L.; Stanley, H.E. Fractal Concepts in Surface Growth; Cambridge University Press: Cambridge, UK, 2009; ISBN 9780521483087. [Google Scholar]
- Risović, D.; Pavlović, Z. Performance assessment of methods for estimation of fractal dimension from scanning electron microscope images. Scanning 2013, 35, 402–411. [Google Scholar] [CrossRef] [PubMed]
- Xin, Y.; Grundmeier, G.; Keller, A. Adsorption of SARS-CoV-2 Spike Protein S1 at Oxide Surfaces Studied by High-Speed Atomic Force Microscopy. Adv. NanoBiomed Res. 2021, 2000024. [Google Scholar] [CrossRef]
- Latour, R.A. The Langmuir isotherm: A commonly applied but misleading approach for the analysis of protein adsorption behavior. J. Biomed. Mater. Res. A 2015, 103, 949–958. [Google Scholar] [CrossRef]
- Dolatshahi-Pirouz, A.; Skeldal, S.; Hovgaard, M.B.; Jensen, T.; Foss, M.; Chevallier, J.; Besenbacher, F. Influence of Nanoroughness and Detailed Surface Morphology on Structural Properties and Water-Coupling Capabilities of Surface-Bound Fibrinogen Films. J. Phys. Chem. C 2009, 113, 4406–4412. [Google Scholar] [CrossRef]
- Dolatshahi-Pirouz, A.; Rechendorff, K.; Hovgaard, M.B.; Foss, M.; Chevallier, J.; Besenbacher, F. Bovine serum albumin adsorption on nano-rough platinum surfaces studied by QCM-D. Colloids Surf. B Biointerfaces 2008, 66, 53–59. [Google Scholar] [CrossRef]
- Dolatshahi-Pirouz, A.; Pennisi, C.P.; Skeldal, S.; Foss, M.; Chevallier, J.; Zachar, V.; Andreasen, P.; Yoshida, K.; Besenbacher, F. The influence of glancing angle deposited nano-rough platinum surfaces on the adsorption of fibrinogen and the proliferation of primary human fibroblasts. Nanotechnology 2009, 20, 95101. [Google Scholar] [CrossRef]


| Sample ID | 0.07-40 | 0.07-40-b | 0.07-40-r | 0.07-80 | 0.26-12 |
|---|---|---|---|---|---|
| Substrate | flat | flat | rippled | flat | flat |
| Deposition rate (Å/s) | 0.07 | 0.07 | 0.07 | 0.07 | 0.26 |
| Deposition time (min) | 40.0 | 40.0 | 40.0 | 80.0 | 12.2 |
| Applied bias potential (V) | 0 | −10 | −10 | 0 | 0 |
| Sample ID | 0.07-40 | 0.07-40-b | 0.07-40-r | 0.07-80 | 0.26-12 |
|---|---|---|---|---|---|
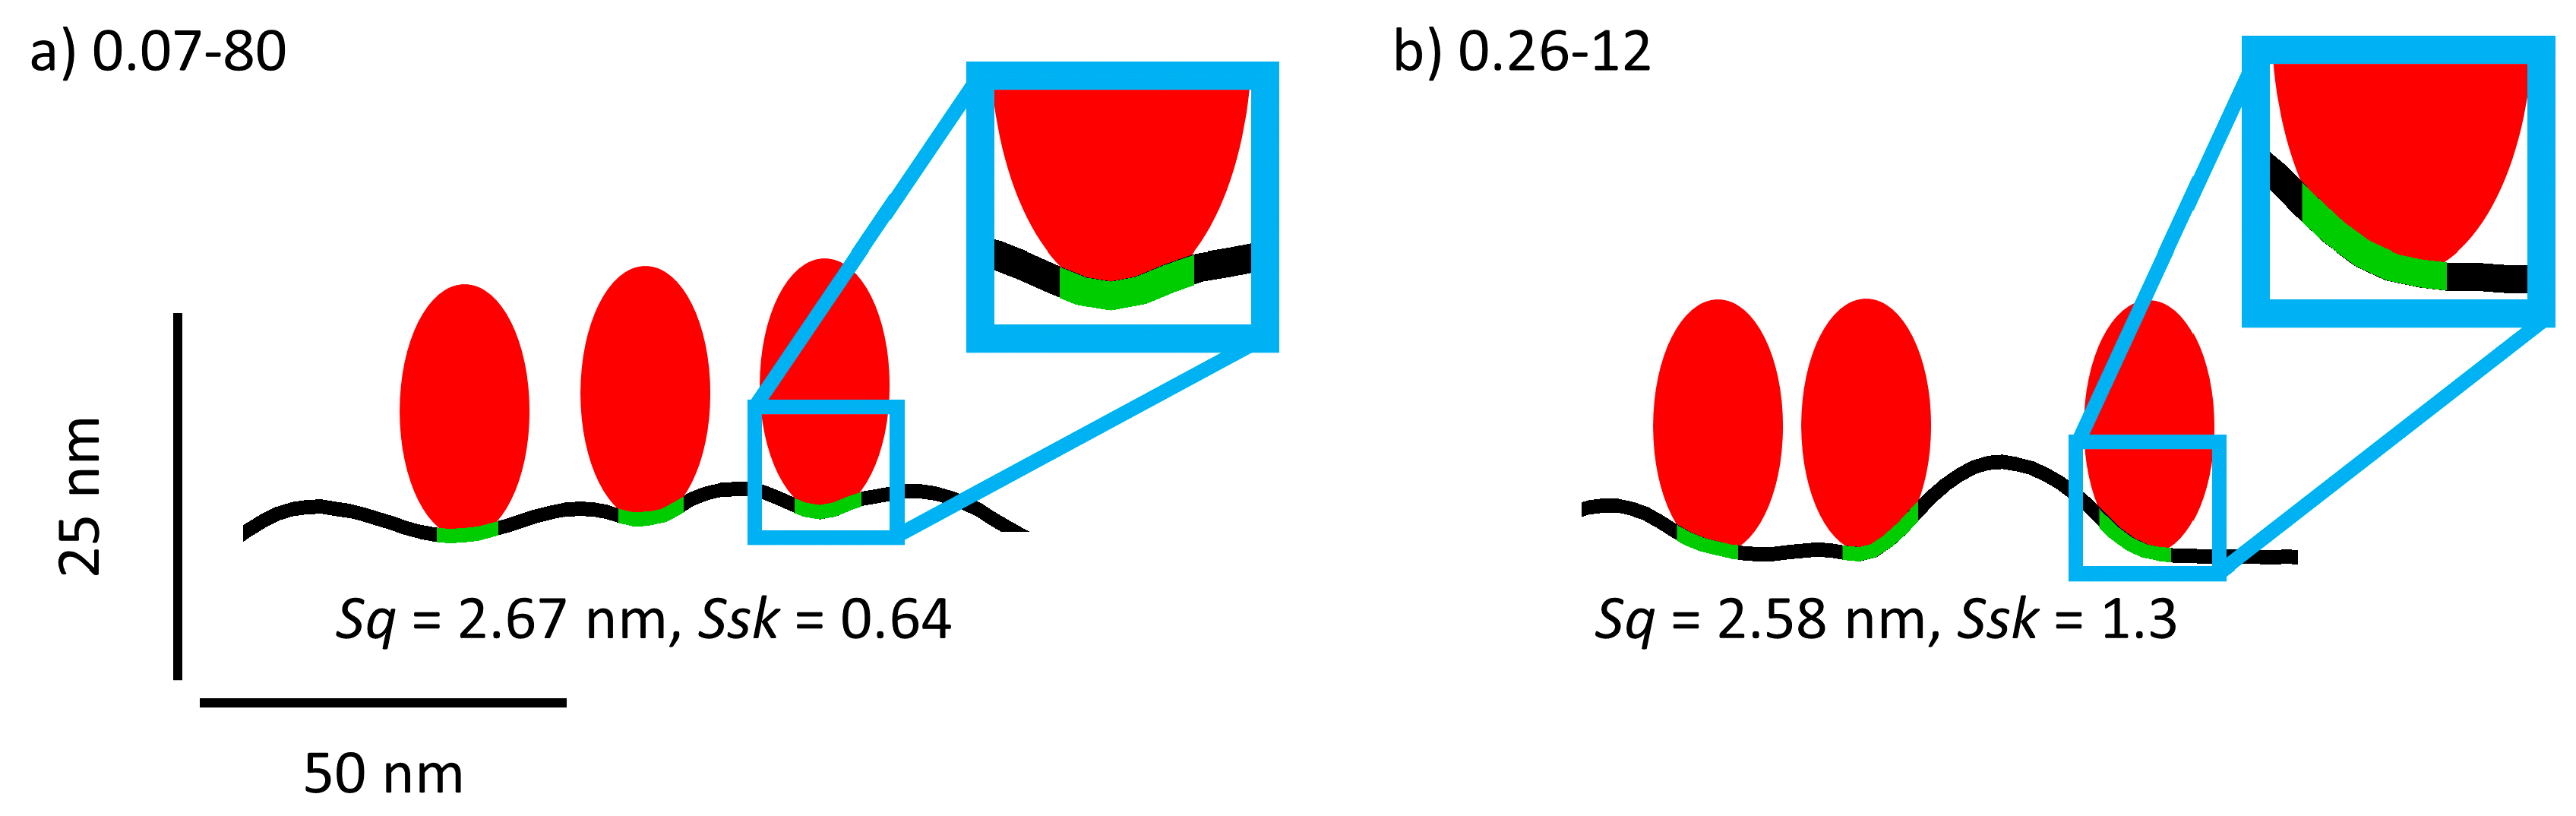
| Sq (nm) | 1.4 ± 0.2 | 0.26 ± 0.09 | 1.5 ± 0.3 | 2.67 ± 0.08 | 2.58 ± 0.09 |
| Sa (nm) | 1.1 ± 0.2 | 0.21 ± 0.07 | 1.2 ± 0.2 | 2.09 ± 0.06 | 2.04 ± 0.06 |
| r | 1.03 ± 0.02 | 1.00 ± 0.01 | 1.03 ± 0.01 | 1.08 ± 0.01 | 1.08 ± 0.03 |
| Ssk | 0.8 ± 0.3 | 0.24 ± 0.15 | −0.31 ± 0.02 | 0.64 ± 0.06 | 1.3 ± 0.1 |
| Sku | 7 ± 3 | 4.2 ± 1.3 | 3.0 ± 0.2 | 3.7 ± 0.2 | 4.2 ± 0.3 |
| D | 2.48 ± 0.03 | 2.51 ± 0.03 | 2.49 ± 0.02 | 2.48 ± 0.01 | 2.51 ± 0.02 |
Publisher’s Note: MDPI stays neutral with regard to jurisdictional claims in published maps and institutional affiliations. |
© 2021 by the authors. Licensee MDPI, Basel, Switzerland. This article is an open access article distributed under the terms and conditions of the Creative Commons Attribution (CC BY) license (http://creativecommons.org/licenses/by/4.0/).
Share and Cite
Yang, Y.; Knust, S.; Schwiderek, S.; Qin, Q.; Yun, Q.; Grundmeier, G.; Keller, A. Protein Adsorption at Nanorough Titanium Oxide Surfaces: The Importance of Surface Statistical Parameters beyond Surface Roughness. Nanomaterials 2021, 11, 357. https://0-doi-org.brum.beds.ac.uk/10.3390/nano11020357
Yang Y, Knust S, Schwiderek S, Qin Q, Yun Q, Grundmeier G, Keller A. Protein Adsorption at Nanorough Titanium Oxide Surfaces: The Importance of Surface Statistical Parameters beyond Surface Roughness. Nanomaterials. 2021; 11(2):357. https://0-doi-org.brum.beds.ac.uk/10.3390/nano11020357
Chicago/Turabian StyleYang, Yu, Steffen Knust, Sabrina Schwiderek, Qin Qin, Qing Yun, Guido Grundmeier, and Adrian Keller. 2021. "Protein Adsorption at Nanorough Titanium Oxide Surfaces: The Importance of Surface Statistical Parameters beyond Surface Roughness" Nanomaterials 11, no. 2: 357. https://0-doi-org.brum.beds.ac.uk/10.3390/nano11020357