Functionalized Reduced Graphene Oxide Thin Films for Ultrahigh CO2 Gas Sensing Performance at Room Temperature

 , ,
, ,  ,
,
Abstract
:1. Introduction
2. Materials and Methods
2.1. Materials and Reagents
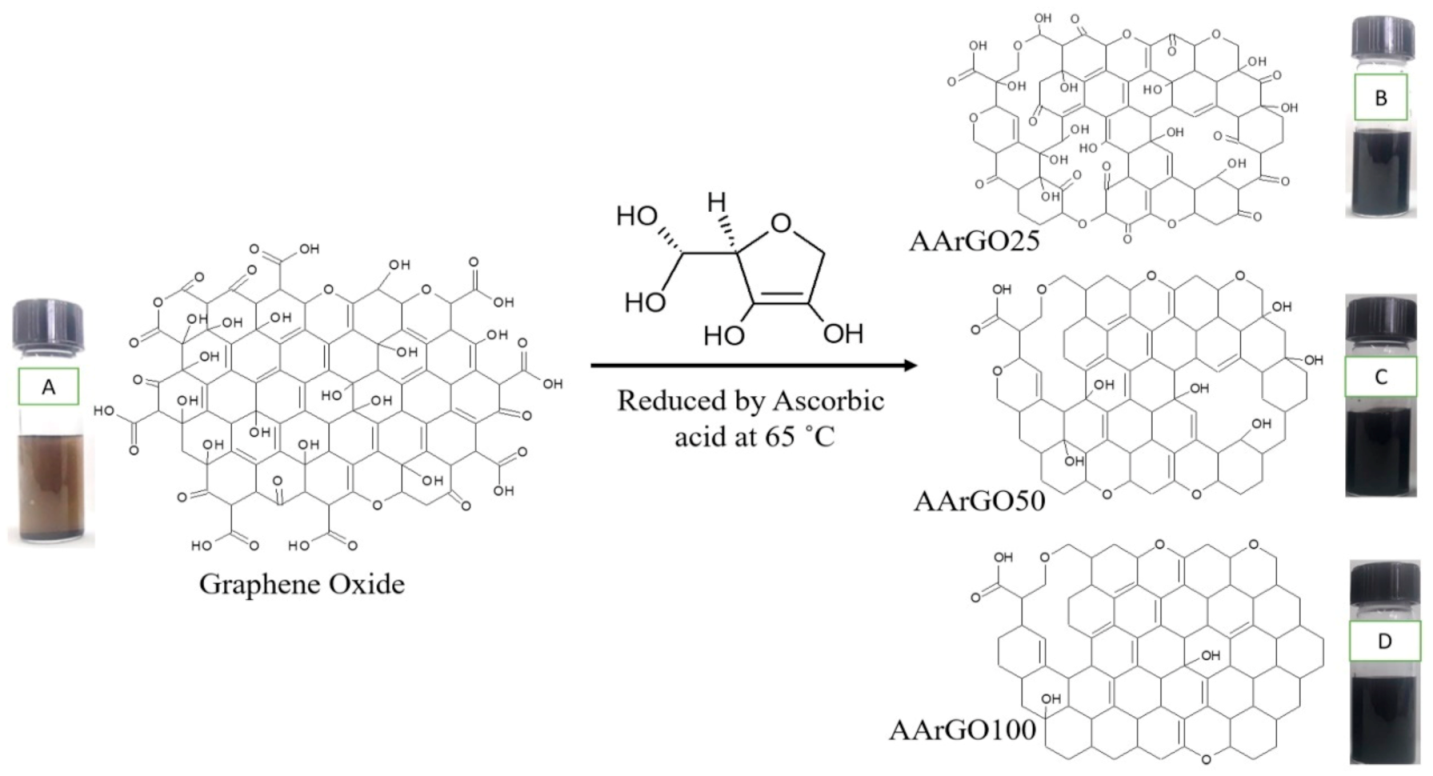
2.2. Synthesis of Reduced Graphene Oxide and Thin-Film Development
2.3. Structural, Elemental, Morphological, and Electrical Characterizations
2.4. Sensor Fabrication and Device Performance
3. Results and Discussion
3.1. FTIR Analysis
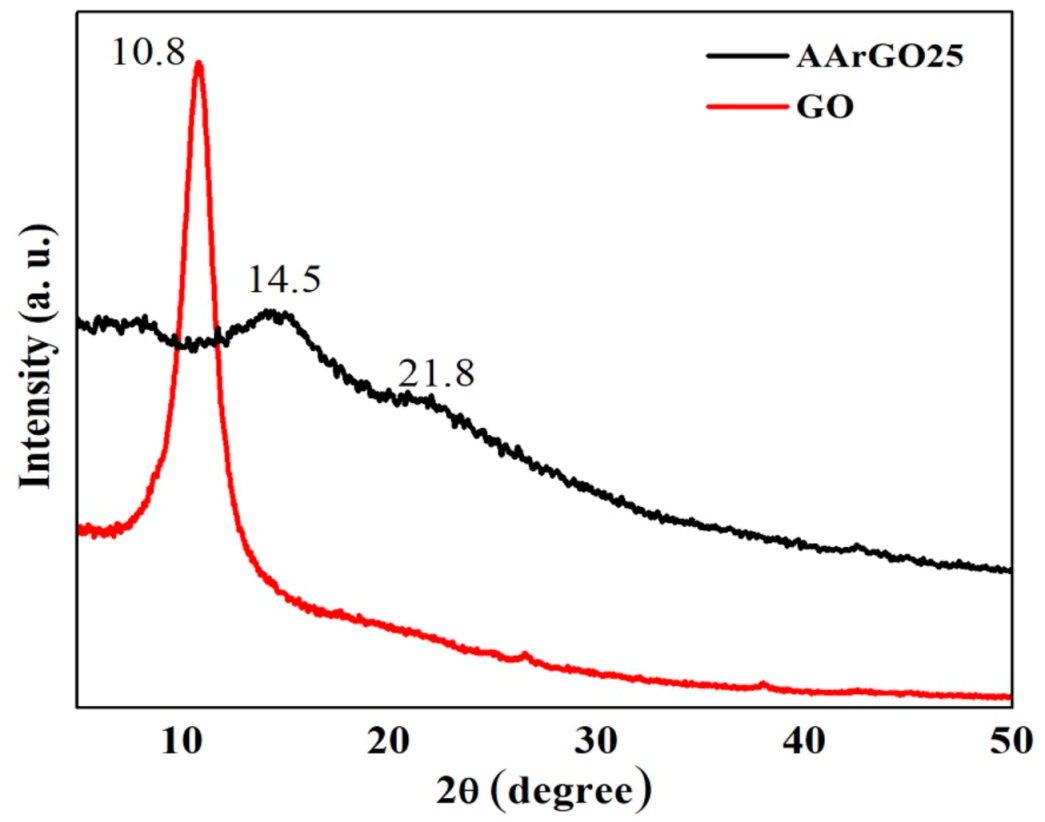
3.2. XRD Analysis
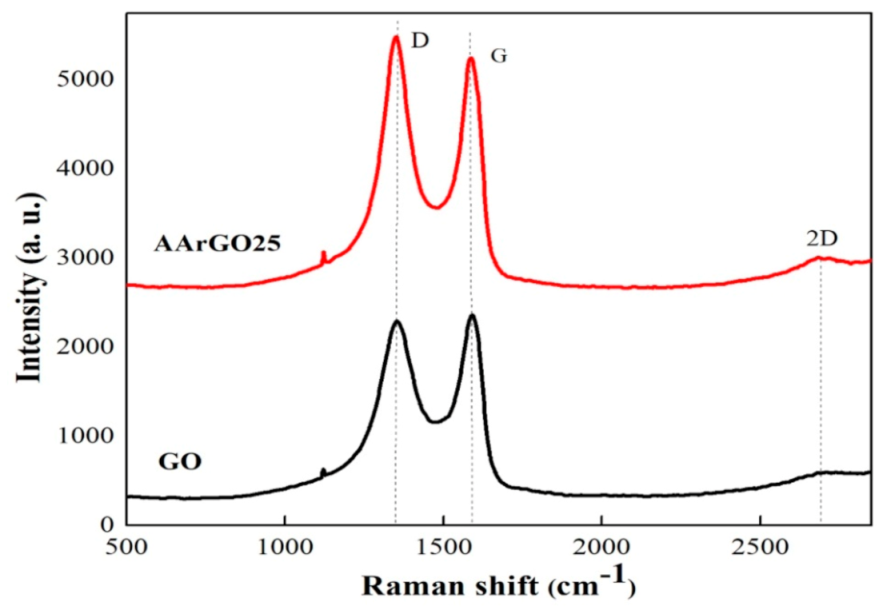
3.3. Raman Analysis
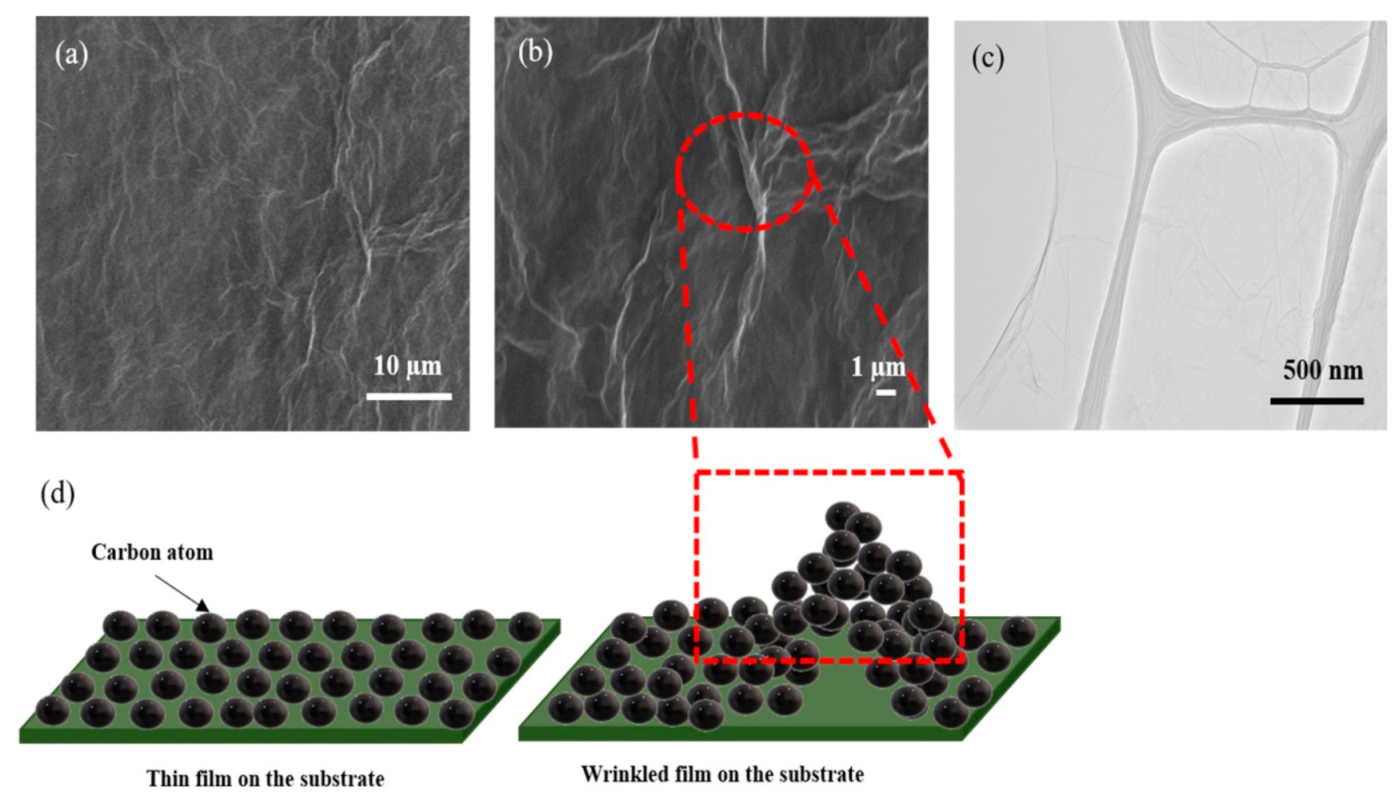
3.4. Surface Morphology
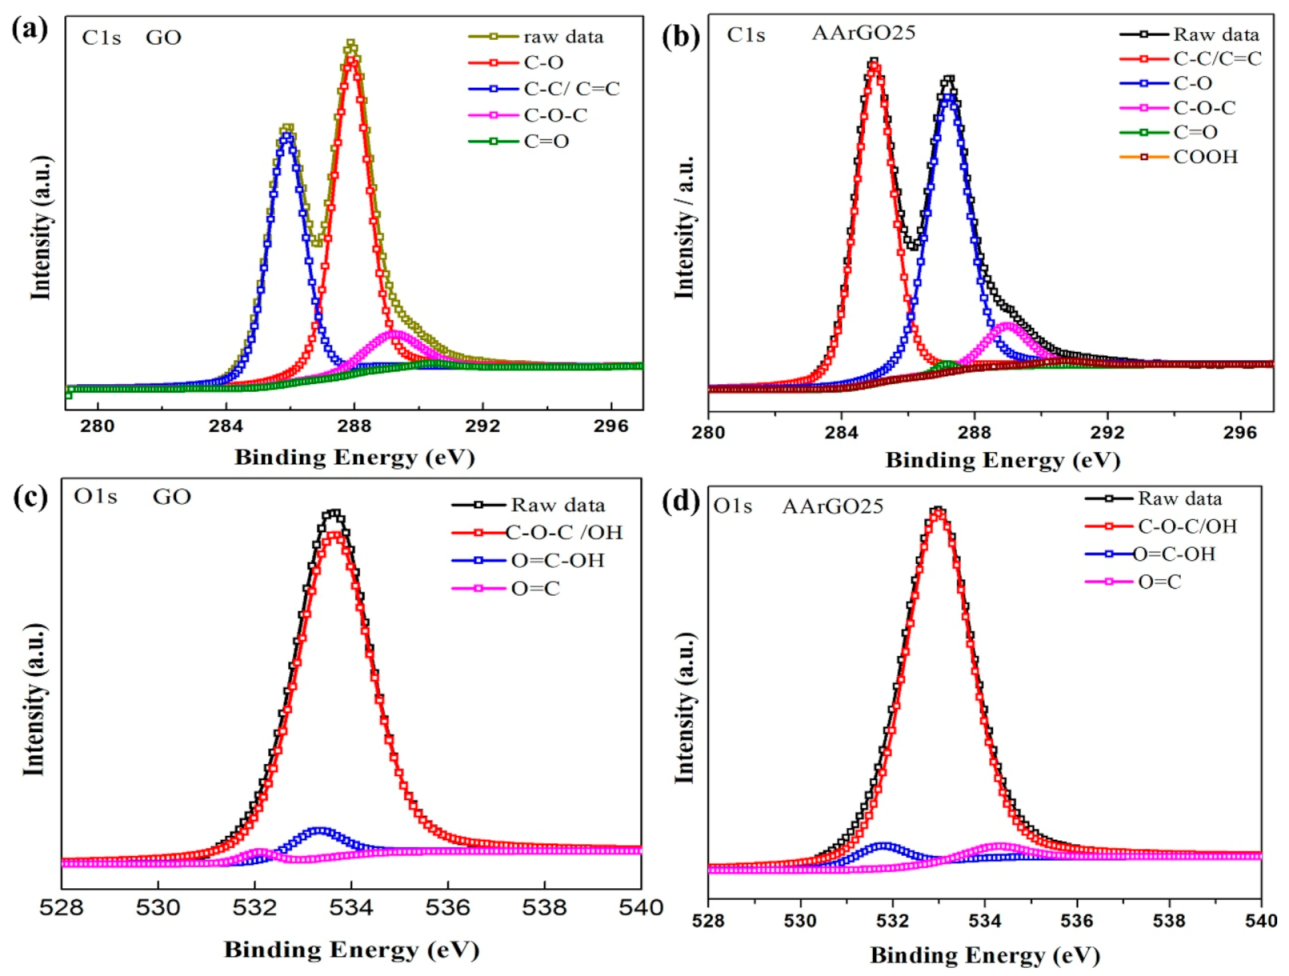
3.5. XPS Analysis
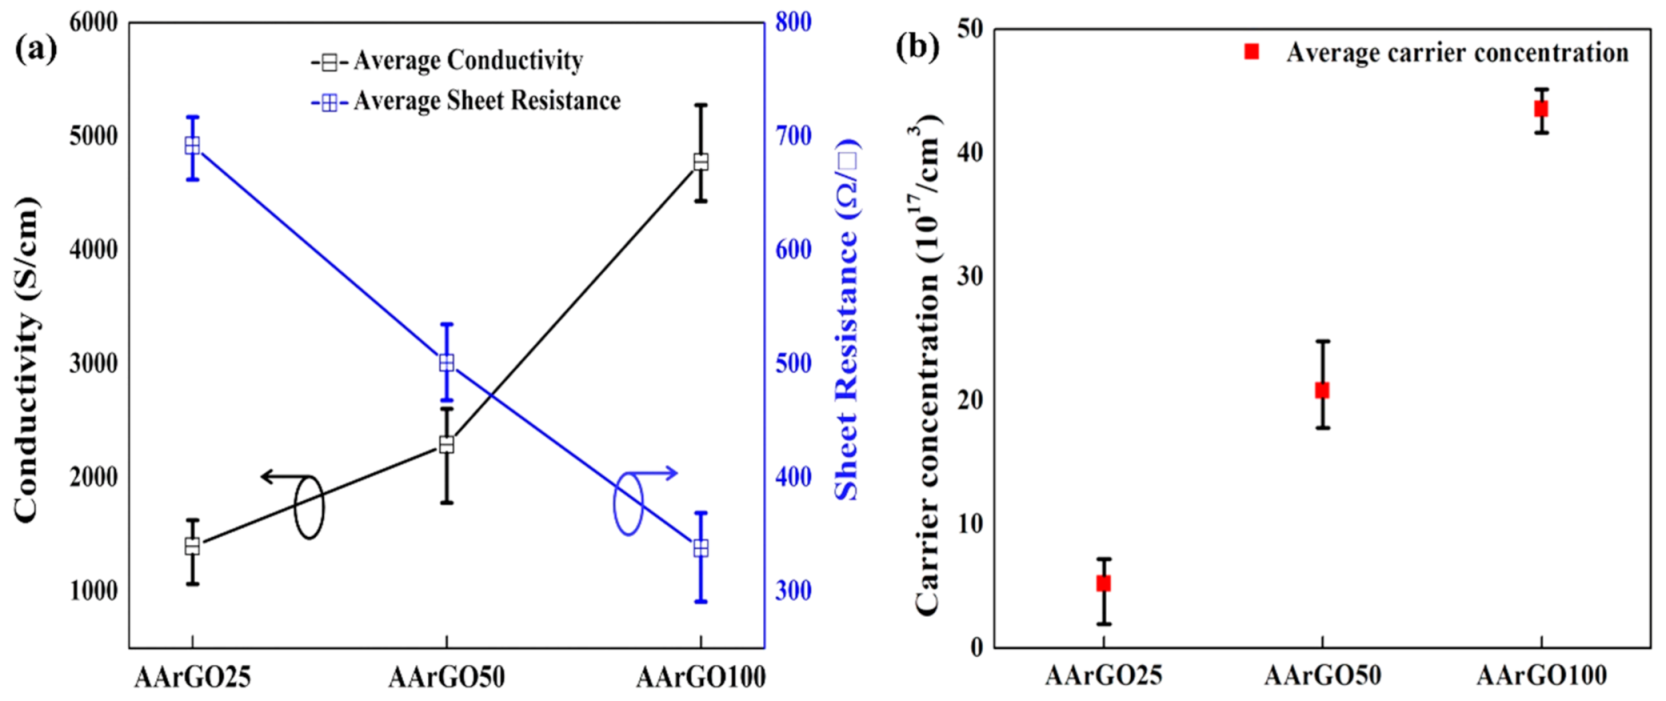
3.6. Electrical Analysis
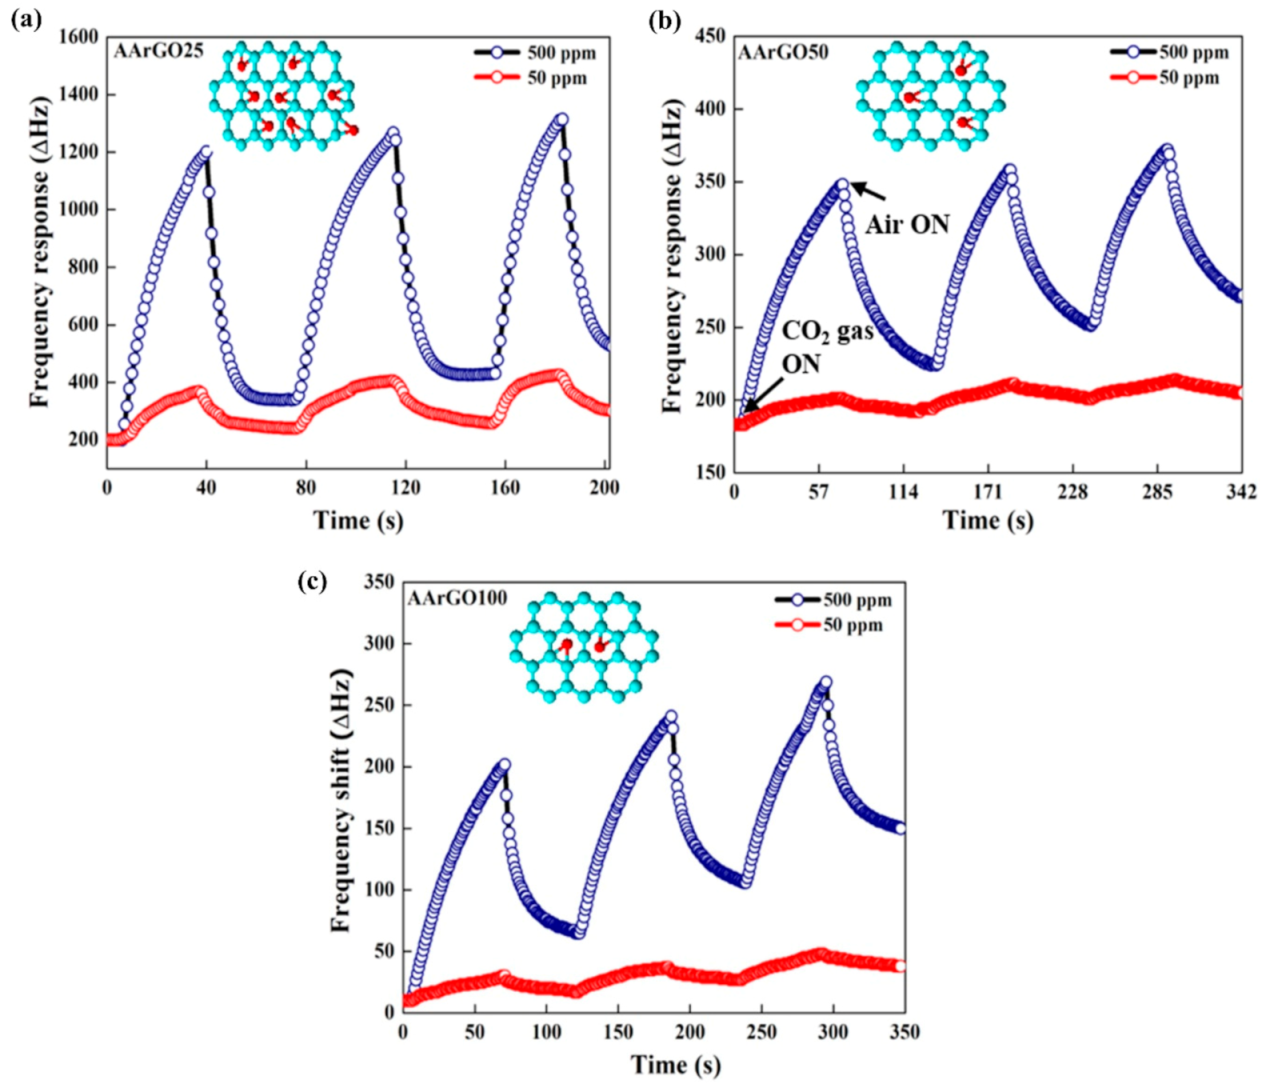
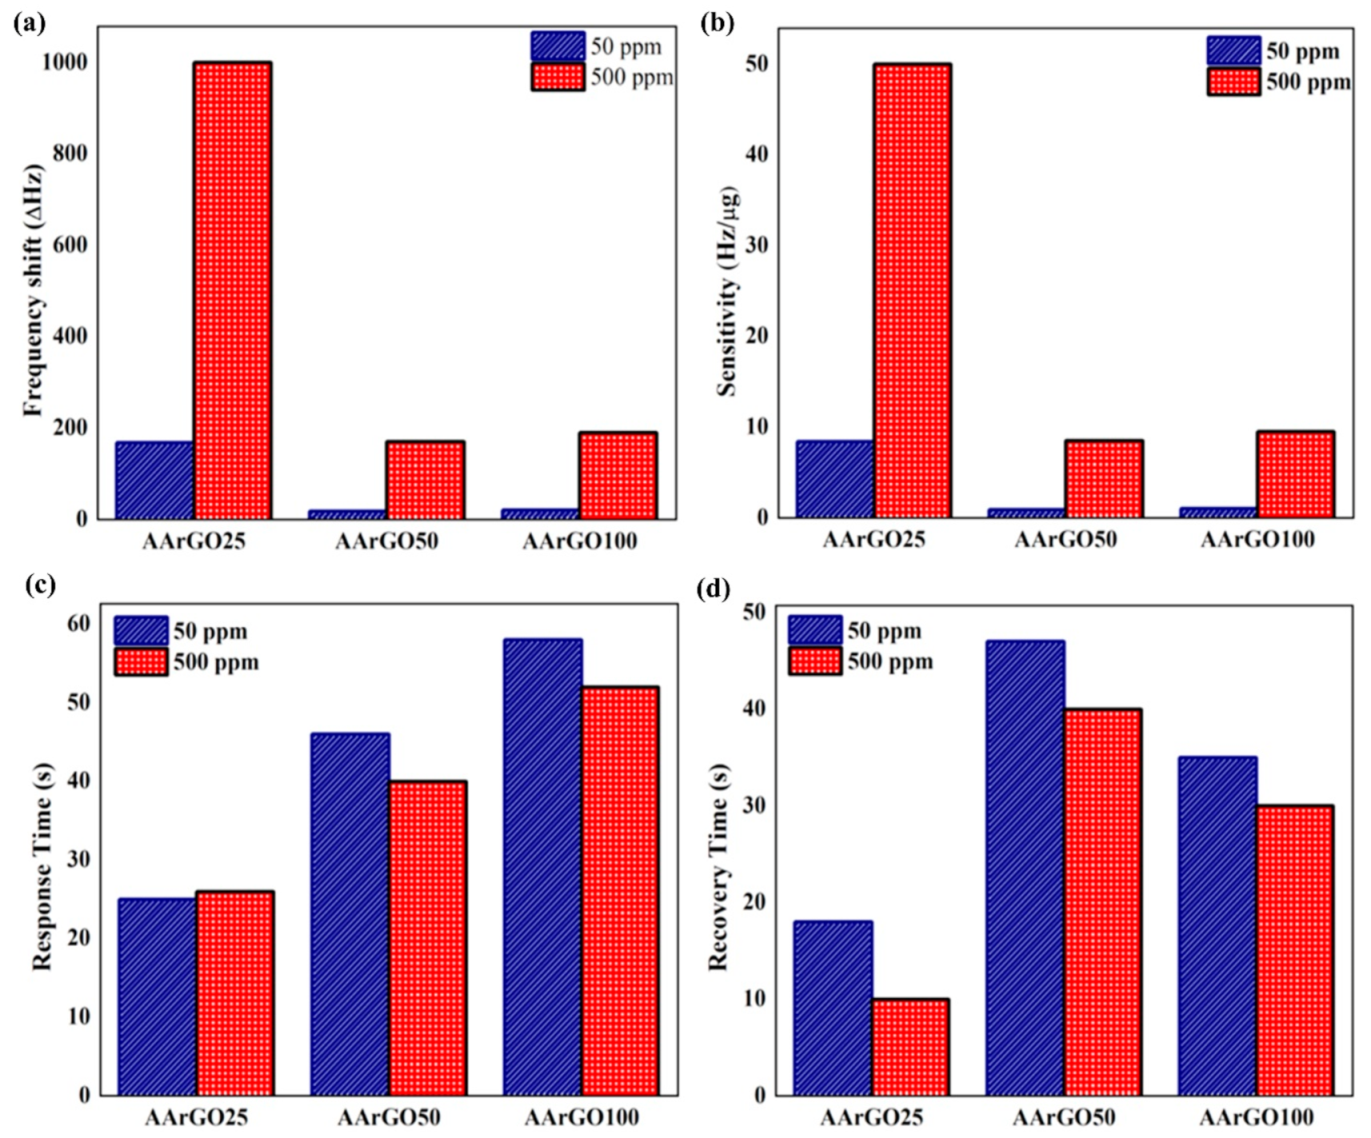
3.7. Gas Sensing
4. Conclusions
Supplementary Materials
Author Contributions
Funding
Data Availability Statement
Acknowledgments
Conflicts of Interest
References
- Azuma, K.; Kagi, N.; Yanagi, U.; Osawa, H. Effects of low-level inhalation exposure to carbon dioxide in indoor environments: A short review on human health and psychomotor performance. Environ. Int. 2018, 121, 51–56. [Google Scholar] [CrossRef]
- Daud, A.I.; Wahid, K.A.A.; Khairul, W.M. Room-temperature operated cyano-terminated ethynylated-thiourea as a resistive-type carbon dioxide (CO2) gas sensor. Org. Electron. 2019, 70, 32–41. [Google Scholar] [CrossRef]
- Kumar, V.; Roy, D.R. Single-layer stanane as potential gas sensor for NO2, SO2, CO2 and NH3 under DFT investigation. Phys. E Low-Dimens. Syst. Nanostructures 2019, 110, 100–106. [Google Scholar] [CrossRef]
- Triyana, K.; Rianjanu, A.; Nugroho, D.B.; As’ari, A.H.; Kusumaatmaja, A.; Roto, R.; Suryana, R.; Wasisto, H.S. A highly sensitive safrole sensor based on polyvinyl acetate (PVAc) nanofiber-coated QCM. Sci. Rep. 2019, 9, 1–12. [Google Scholar] [CrossRef] [Green Version]
- Muckley, E.S.; Aytug, T.; Mayes, R.; Lupini, A.R.; Carrillo, J.Y.; Goswami, M.; Sumpter, B.G.; Ivanov, I.N. Hierarchical TiO2:Cu2O Nanostructures for Gas/Vapor Sensing and CO2 Sequestration. ACS Appl. Mater. Interfaces 2019, 11, 48466–48475. [Google Scholar] [CrossRef]
- Tchalala, M.R.; Belmabkhout, Y.; Adil, K.; Chappanda, K.N.; Cadiau, A.; Bhatt, P.M.; Salama, K.N.; Eddaoudi, M. Concurrent Sensing of CO2 and H2O from Air Using Ultramicroporous Fluorinated Metal-Organic Frameworks: Effect of Transduction Mechanism on the Sensing Performance. ACS Appl. Mater. Interfaces 2019, 11, 1706–1712. [Google Scholar] [CrossRef]
- Wang, D.; Chen, Y.; Liu, Z.; Li, L.; Shi, C.; Qin, H.; Hu, J. CO2-sensing properties and mechanism of nano-SnO2 thick-film sensor. Sens. Actuators B Chem. 2016, 227, 73–84. [Google Scholar] [CrossRef]
- Hsu, K.C.; Fang, T.H.; Hsiao, Y.J.; Chan, C.A. Highly response CO2 gas sensor based on Au-La2O3 doped SnO2 nanofibers. Mater. Lett. 2020, 261, 127144. [Google Scholar] [CrossRef]
- Kanaparthi, S.; Singh, S.G. Chemiresistive Sensor Based on Zinc Oxide Nanoflakes for CO2 Detection. ACS Appl. Nano Mater. 2019, 2, 700–706. [Google Scholar] [CrossRef]
- Tanvir, N.B.; Yurchenko, O.; Laubender, E.; Pohle, R.; Sicard, O.V.; Urban, G. Zinc peroxide combustion promoter in preparation of CuO layers for conductometric CO2 sensing. Sens. Actuators B Chem. 2018, 257, 1027–1034. [Google Scholar] [CrossRef]
- Mandayo, G.G.; González, F.; Rivas, I.; Ayerdi, I.; Herrán, J. BaTiO3-CuO sputtered thin film for carbon dioxide detection. Sens. Actuators B Chem. 2006, 118, 305–310. [Google Scholar] [CrossRef]
- Basyooni, M.A.; Zaki, S.E.; Ertugrul, S.; Yilmaz, M.; Eker, Y.R. Fast response of CO2 room temperature gas sensor based on Mixed-Valence Phases in Molybdenum and Tungsten Oxide nanostructured thin films. Ceram. Int. 2020, 46, 9839–9853. [Google Scholar] [CrossRef]
- Mandal, B. π-Conjugated Amine−ZnO Nanohybrids for the Selective Detection. ACS Appl. Nano Mater. 2018, 1, 6912–6921. [Google Scholar] [CrossRef]
- Rathi, K.; Pal, K. Ruthenium decorated tungsten disulfide quantum dots for CO2 gas sensor. Nanotechnology 2019, 31, 135502. [Google Scholar] [CrossRef] [PubMed]
- Zaki, S.E.; Basyooni, M.A.; Shaban, M.; Rabia, M.; Eker, Y.R.; Attia, G.F.; Yilmaz, M.; Ahmed, A.M. Role of oxygen vacancies in vanadium oxide and oxygen functional groups in graphene oxide for room temperature CO2 gas sensors. Sens. Actuators A Phys. 2019, 294, 17–24. [Google Scholar] [CrossRef]
- Varga, M.; Laposa, A.; Kulha, P.; Kroutil, J.; Husak, M.; Kromka, A. Quartz crystal microbalance gas sensor with nanocrystalline diamond sensitive layer. Phys. Status Solidi Basic Res. 2015, 252, 2591–2597. [Google Scholar] [CrossRef]
- Alwan, A.M.; Hashim, D.A.; Jawad, M.F. CO2 gas sensor based on macro porous silicon modified with trimetallic nanoparticles. J. Mater. Sci. Mater. Electron. 2019, 30, 7301–7313. [Google Scholar] [CrossRef]
- Young, S.-J.; Lin, Z.-D. Sensing Performance of Carbon Dioxide Gas Sensors with Carbon Nanotubes on Plastic Substrate. ECS J. Solid State Sci. Technol. 2017, 6, 72–74. [Google Scholar] [CrossRef]
- Nemade, K.R.; Waghuley, S.A. Role of defects concentration on optical and carbon dioxide gas sensing properties of Sb2O3/graphene composites. Opt. Mater. (Amst.) 2014, 36, 712–716. [Google Scholar] [CrossRef]
- Kim, J.H.; Mirzaei, A.; Zheng, Y.; Lee, J.H.; Kim, J.Y.; Kim, H.W.; Kim, S.S. Enhancement of H2S sensing performance of p-CuO nanofibers by loading p-reduced graphene oxide nanosheets. Sens. Actuators B Chem. 2019, 281, 453–461. [Google Scholar] [CrossRef]
- Seekaew, Y.; Wongchoosuk, C. A novel graphene-based electroluminescent gas sensor for carbon dioxide detection. Appl. Surf. Sci. 2019, 479, 525–531. [Google Scholar] [CrossRef]
- Jin, Y.; Zheng, Y.; Podkolzin, S.G.; Lee, W. Band gap of reduced graphene oxide tuned by controlling functional groups. J. Mater. Chem. C 2020, 8, 4885–4894. [Google Scholar] [CrossRef]
- Guo, L.; Hao, Y.W.; Li, P.L.; Song, J.F.; Yang, R.Z.; Fu, X.Y.; Xie, S.Y.; Zhao, J.; Zhang, Y.L. Improved NO2 Gas Sensing Properties of Graphene Oxide Reduced by Two-beam-laser Interference. Sci. Rep. 2018, 8, 1–7. [Google Scholar] [CrossRef] [PubMed]
- Van Quang, V.; Hung, V.N.; Tuan, L.A.; Phan, V.N.; Huy, T.Q.; Van Quy, N. Graphene-coated quartz crystal microbalance for detection of volatile organic compounds at room temperature. Thin Solid Films 2014, 568, 6–12. [Google Scholar] [CrossRef]
- Singh, P.; Nath, P.; Arun, R.K.; Mandal, S.; Chanda, N. Novel synthesis of a mixed Cu/CuO-reduced graphene oxide nanocomposite with enhanced peroxidase-like catalytic activity for easy detection of glutathione in solution and using a paper strip. RSC Adv. 2016, 6, 92729–92738. [Google Scholar] [CrossRef]
- Georgakilas, V.; Tiwari, J.N.; Kemp, K.C.; Perman, J.A.; Bourlinos, A.B.; Kim, K.S.; Zboril, R. Noncovalent Functionalization of Graphene and Graphene Oxide for Energy Materials, Biosensing, Catalytic, and Biomedical Applications. Chem. Rev. 2016, 116, 5464–5519. [Google Scholar] [CrossRef] [Green Version]
- Manna, B.; Raha, H.; Chakrabarti, I.; Guha, P.K. Selective reduction of oxygen functional groups to improve the response characteristics of graphene oxide-based formaldehyde sensor device: A first principle study. IEEE Trans. Electron Devices 2018, 65, 5045–5052. [Google Scholar] [CrossRef]
- Kumar, P.; Lin, K.; Seng, W.; Shuaib, M.; Saheed, M. Hybrid film of single-layer graphene and carbon nanotube as transparent conductive electrode for organic light emitting diode. Synth. Met. 2019, 257, 116186. [Google Scholar] [CrossRef]
- Mishra, A.K.; Ramaprabhu, S. Carbon dioxide adsorption in graphene sheets. AIP Adv. 2011, 1, 032152. [Google Scholar] [CrossRef]
- Shaban, M.; Ali, S.; Rabia, M. Design and application of nanoporous graphene oxide film for CO2, H2, and C2H2 gases sensing. J. Mater. Res. Technol. 2019, 8, 4510–4520. [Google Scholar] [CrossRef]
- Muhammad Hafiz, S.; Ritikos, R.; Whitcher, T.J.; Razib, N.M.; Bien, D.C.S.; Chanlek, N.; Nakajima, H.; Saisopa, T.; Songsiriritthigul, P.; Huang, N.M.; et al. A practical carbon dioxide gas sensor using room-temperature hydrogen plasma reduced graphene oxide. Sens. Actuators B Chem. 2014, 193, 692–700. [Google Scholar] [CrossRef]
- Hou, D.; Liu, Q.; Cheng, H.; Li, K. Graphene synthesis via chemical reduction of graphene oxide using lemon extract. J. Nanosci. Nanotechnol. 2017, 17, 6518–6523. [Google Scholar] [CrossRef]
- Yang, H.; Li, J.S.; Zeng, X. Correlation between molecular structure and interfacial properties of edge or basal plane modified graphene oxide. ACS Appl. Nano Mater. 2018, 1, 2763–2773. [Google Scholar] [CrossRef]
- Yamamoto, S.; Takeuchi, K.; Hamamoto, Y.; Liu, R.-Y.; Shiozawa, Y.; Koitaya, T.; Someya, T.; Tashima, K.; Fukidome, H.; Mukai, O.; et al. Enhancement of CO2 adsorption on oxygen-functionalized epitaxial graphene surface at near-ambient conditions. Phys. Chem. Chem. Phys. 2018, 20, 19532–19538. [Google Scholar] [CrossRef]
- Cooper, D.R.; D’Anjou, B.; Ghattamaneni, N.; Harack, B.; Hilke, M.; Horth, A.; Majlis, N.; Massicotte, M.; Vandsburger, L.; Whiteway, E.; et al. Experimental Review of Graphene. ISRN Condens. Matter Phys. 2012, 2012, 501686. [Google Scholar] [CrossRef] [Green Version]
- Sundaram, R.S.; Kwan, Y.C.G.; Ng, G.M.; Huan, C.H.A.; Huang, H.H.; De Silva, K.K.H.; Kumara, G.R.A.; Yoshimura, M.; He, L.; Zhao, Y.; et al. Identification of functional groups and determination of carboxyl formation temperature in graphene oxide using the XPS O1s spectrum. Sci. Rep. 2018, 8, 12053–12061. [Google Scholar]
- Bhaumik, A.; Haque, A.; Taufique, M.; Karnati, P.; Patel, R.; Nath, M.; Ghosh, K. Reduced Graphene Oxide Thin Films with Very Large Charge Carrier Mobility Using Pulsed Laser Deposition. J. Mater. Sci. Eng. 2017, 6, 1–11. [Google Scholar] [CrossRef]
- Haneef, H.F.; Zeidell, A.M.; Jurchescu, O.D. Charge carrier traps in organic semiconductors: A review on the underlying physics and impact on electronic devices. J. Mater. Chem. C 2020, 8, 759–787. [Google Scholar] [CrossRef]
- Zhang, Z.; Zhang, X.; Luo, W.; Yang, H.; He, Y.; Liu, Y.; Zhang, X.; Peng, G. Study on adsorption and desorption of ammonia on graphene. Nanoscale Res. Lett. 2015, 10, 359. [Google Scholar] [CrossRef] [PubMed] [Green Version]
- Chen, C.; Chen, Y.C.; Hong, Y.T.; Lee, T.W.; Huang, J.F. Facile fabrication of ascorbic acid reduced graphene oxide-modified electrodes toward electroanalytical determination of sulfamethoxazole in aqueous environments. Chem. Eng. J. 2018, 352, 188–197. [Google Scholar] [CrossRef]
- Aunkor, M.T.H.; Mahbubul, I.M.; Saidur, R.; Metselaar, H.S.C. The green reduction of graphene oxide. RSC Adv. 2016, 6, 27807–27825. [Google Scholar] [CrossRef]
- Zhang, J.; Yang, H.; Shen, G.; Cheng, P. Reduction of graphene oxide via L-ascorbic acid. Chem. Commun. 2010, 46, 1112–1114. [Google Scholar] [CrossRef] [PubMed]
- Wang, F.; Jia, Z.; Su, W.; Shang, Y.; Wang, Z.L. Adsorption of phenanthrene and 1-naphthol to graphene oxide and L -ascorbic-acid-reduced graphene oxide: Effects of pH and surfactants. Environ. Sci. Pollut. Res. 2019, 26, 11062–11073. [Google Scholar] [CrossRef] [PubMed]
- Rabchinskii, M.K.; Dideikin, A.T.; Kirilenko, D.A.; Baidakova, M.V.; Shnitov, V.V.; Roth, F.; Konyakhin, S.V.; Besedina, N.A.; Pavlov, S.I.; Kuricyn, R.A.; et al. Facile reduction of graphene oxide suspensions and films using glass wafers. Sci. Rep. 2018, 8, 1–11. [Google Scholar] [CrossRef] [PubMed] [Green Version]
- Eigler, S.; Hirsch, A. Controlled Functionalization of Graphene by Oxo-addends. Phys. Sci. Rev. 2019, 2, 1–24. [Google Scholar]
- Shih, C.J.; Lin, S.; Sharma, R.; Strano, M.S.; Blankschtein, D. Understanding the pH-dependent behavior of graphene oxide aqueous solutions: A comparative experimental and molecular dynamics simulation study. Langmuir 2012, 28, 235–241. [Google Scholar] [CrossRef]
- Sundaram, R.S. Chemically derived graphene. In Graphene: Properties, Preparation, Characterisation and Devices; Woodhead Publishing Limited: Cambridge, UK, 2014; pp. 50–80. [Google Scholar]
- Huang, X.; Liu, L.; Zhou, S.; Zhao, J. Physical Properties and Device Applications of Graphene Oxide. Front. Phys. 2019, 15, 33301. [Google Scholar] [CrossRef] [Green Version]
- Pimenta, M.A.; Dresselhaus, G.; Dresselhaus, M.S.; Cançado, L.G.; Jorio, A.; Saito, R. Studying disorder in graphite-based systems by Raman spectroscopy. Phys. Chem. Chem. Phys. 2007, 9, 1276–1291. [Google Scholar] [CrossRef]
- Gayathri, S.; Jayabal, P.; Kottaisamy, M.; Ramakrishnan, V. Synthesis of few layer graphene by direct exfoliation of graphite and a Raman spectroscopic study. AIP Adv. 2014, 4, 027116. [Google Scholar] [CrossRef]
- Ma, B.; Rodriguez, R.D.; Ruban, A.; Pavlov, S.; Sheremet, E. The correlation between electrical conductivity and second-order Raman modes of laser-reduced graphene oxide. Phys. Chem. Chem. Phys. 2019, 21, 10125–10134. [Google Scholar] [CrossRef]
- Kaniyoor, A.; Ramaprabhu, S. A Raman spectroscopic investigation of graphite oxide derived graphene. AIP Adv. 2012, 2, 032183. [Google Scholar] [CrossRef] [Green Version]
- Lee, W.K.; Kang, J.; Chen, K.S.; Engel, C.J.; Jung, W.B.; Rhee, D.; Hersam, M.C.; Odom, T.W. Multiscale, Hierarchical Patterning of Graphene by Conformal Wrinkling. Nano Lett. 2016, 16, 7121–7127. [Google Scholar] [CrossRef]
- Huang, H.H.; De Silva, K.K.H.; Kumara, G.R.A.; Yoshimura, M. Structural Evolution of Hydrothermally Derived Reduced Graphene Oxide. Sci. Rep. 2018, 8, 2–10. [Google Scholar] [CrossRef]
- Bagri, A.; Grantab, R.; Medhekar, N.V.; Shenoy, V.B. Stability and formation mechanisms of carbonyl- and hydroxyl-decorated holes in graphene oxide. J. Phys. Chem. C 2010, 114, 12053–12061. [Google Scholar] [CrossRef]
- Wang, Y.; Chen, Y.; Lacey, S.D.; Xu, L.; Xie, H.; Li, T.; Danner, V.A.; Hu, L. Reduced graphene oxide film with record-high conductivity and mobility. Mater. Today 2018, 21, 186–192. [Google Scholar] [CrossRef]
- Savchak, M.; Borodinov, N.; Burtovyy, R.; Anayee, M.; Hu, K.; Ma, R.; Grant, A.; Li, H.; Cutshall, D.B.; Wen, Y.; et al. Highly Conductive and Transparent Reduced Graphene Oxide Nanoscale Films via Thermal Conversion of Polymer-Encapsulated Graphene Oxide Sheets. ACS Appl. Mater. Interfaces 2018, 10, 3975–3985. [Google Scholar] [CrossRef] [PubMed]
- Ren, J.; Wang, C.; Zhang, X.; Carey, T.; Chen, K.; Yin, Y.; Torrisi, F. Environmentally-friendly conductive cotton fabric as flexible strain sensor based on hot press reduced graphene oxide. Carbon N. Y. 2017, 111, 622–630. [Google Scholar] [CrossRef] [Green Version]
- Makumi, S.W. Determination of Electrical and Gas sensitivity Properties of Graphene Sheets; Uppsala Universitet: Uppsala, Sweden, 2015. [Google Scholar]
- Minitha, C.R.; Anithaa, V.S.; Subramaniam, V.; Rajendra Kumar, R.T. Impact of Oxygen Functional Groups on Reduced Graphene Oxide-Based Sensors for Ammonia and Toluene Detection at Room Temperature. ACS Omega 2018, 3, 4105–4112. [Google Scholar] [CrossRef]
- Vashist, S.K.; Vashist, P. Recent advances in quartz crystal microbalance-based sensors. J. Sens. 2011, 2011, 571405. [Google Scholar] [CrossRef]
- Lu, G.; Ocola, L.E.; Chen, J. Reduced graphene oxide for room-temperature gas sensors. Nanotechnology 2009, 20, 445502. [Google Scholar] [CrossRef]
- Li, R.; Zhou, Y.; Sun, M.; Gong, Z.; Guo, Y.; Wu, F.; Li, W.; Ding, W. Influence of Charge Carriers Concentration and Mobility on the Gas Sensing Behavior of Tin Dioxide Thin Films. Coatings 2019, 9, 591. [Google Scholar] [CrossRef] [Green Version]
- Rodríguez-García, S.; Santiago, R.; López-Díaz, D.; Merchán, M.D.; Velázquez, M.M.; Fierro, J.L.G.; Palomar, J. Role of the Structure of Graphene Oxide Sheets on the CO2 Adsorption Properties of Nanocomposites Based on Graphene Oxide and Polyaniline or Fe3O4-Nanoparticles. ACS Sustain. Chem. Eng. 2019, 7, 12464–12473. [Google Scholar] [CrossRef]
- Berouaken, M.; Talbi, L.; Alkama, R.; Sam, S.; Menari, H.; Chebout, K.; Manseri, A.; Boucheham, A.; Gabouze, N. Quartz Crystal Microbalance Coated with Vanadium Oxide Thin Film for CO2 Gas Sensor at Room Temperature. Arab. J. Sci. Eng. 2018, 43, 5957–5963. [Google Scholar] [CrossRef]
- Ahmad, Z.; Naseem; Manzoor, S.; Talib, M.; Islam, S.S.; Mishra, P. Self-standing MWCNTs based gas sensor for detection of environmental limit of CO2. Mater. Sci. Eng. B Solid-State Mater. Adv. Technol. 2020, 255, 114528. [Google Scholar] [CrossRef]


| Assignments | Absorption Frequencies (cm−1) | |||
|---|---|---|---|---|
| GO | AArGO25 | AArGO50 | AArGO100 | |
| O–H vibration | 3272 | - | - | - |
| C–H vibration | 2941 | 2323 | - | - |
| C=O stretching | 1786 | 1731 | 1713 | 1724 |
| aromatic C=C vibration | 1596 | 1580 | 1565 | - |
| –COOH stretching | - | 1623 | 1630 | 1683 |
| C–OH bending | 1338 | 1370 | 1394 | - |
| C–O–C bending | 1228 | 1228 | 1224 | - |
| C–O stretching | 1044 | 1027 | 1015 | 1015 |
| Sample | D | G | 2D | ID/IG | I2D/IG |
|---|---|---|---|---|---|
| GO | 1352 | 1592 | 2683 | 0.9716 | 0.2512 |
| AArGO25 | 1350 | 1587 | 2701 | 1.085 | 0.218 |
| C1s XPS Spectra | |||||||
|---|---|---|---|---|---|---|---|
| Sample | C–C/C=C (%) | C–O (%) | C–O–C (%) | C=O (%) | COOH (%) | C/O Ratio | FWHM of C1s |
| GO | 27.92 | 34.33 | 5.75 | 0.53 | - | 2.17 | 1.52 |
| AArGO25 | 33.35 | 31.58 | 4.99 | 0.44 | 0.56 | 2.44 | 1.33 |
| O1s XPS Spectra | |||||||
| Sample | C–O–C (%) | C=O (%) | COOH (%) | FWHM of O1s | |||
| GO | 29.23 | 0.44 | 1.8 | 1.29 | |||
| AArGO25 | 26.91 | 0.76 | 1.41 | 1.2 | |||
| Materials | Synthesis/Fabrication Method | CO2 Concentration (ppm) | Response Time | Recovery Time | Reference |
|---|---|---|---|---|---|
| Amino−ZnO nanohybrids | in situ hydrothermal | 500 | 206 s | 354 s | [13] |
| Reduced graphene oxide | Hydrogen plasma reduction | 1500 | 4 min | 4 min | [31] |
| Self-standing MWCNTs/alumina composite film | Hydrolysis | 50–450 | 53.7 s | 14.15 s | [66] |
| Carbon nanotube on a polyimide substrate | Chemical vapor deposition | 50 | 12 s | 56 s | [18] |
| Ru-decorated WS2 quantum dots | Two-step synthesis process | 500–5000 | 52 s | 138 s | [14] |
| Cyano-terminated ethynylated-thiourea | Chemical synthesis | 10–1000 | 1 min | 3 min | [2] |
| Al/maPsi/n-Si/Al | Laser assisted etching (LAE) | - | 2.9 min | 4.1 min | [17] |
| Graphene oxide | Spray pyrolysis on fluorine tin oxide | - | 125 s | 110 s | [15] |
| Nanocrystalline diamond | Microwave Plasma CVD process | 2500 | 120 s | 400 s | [16] |
| Vanadium Oxide | Vacuum thermal evaporation | - | 50 s | 125 s | [65] |
| AArGO | Chemical reduction | 500 | 26 s | 10 s | This work |
Publisher’s Note: MDPI stays neutral with regard to jurisdictional claims in published maps and institutional affiliations. |
© 2021 by the authors. Licensee MDPI, Basel, Switzerland. This article is an open access article distributed under the terms and conditions of the Creative Commons Attribution (CC BY) license (http://creativecommons.org/licenses/by/4.0/).
Share and Cite
Gupta, M.; Hawari, H.F.; Kumar, P.; Burhanudin, Z.A.; Tansu, N. Functionalized Reduced Graphene Oxide Thin Films for Ultrahigh CO2 Gas Sensing Performance at Room Temperature. Nanomaterials 2021, 11, 623. https://0-doi-org.brum.beds.ac.uk/10.3390/nano11030623
Gupta M, Hawari HF, Kumar P, Burhanudin ZA, Tansu N. Functionalized Reduced Graphene Oxide Thin Films for Ultrahigh CO2 Gas Sensing Performance at Room Temperature. Nanomaterials. 2021; 11(3):623. https://0-doi-org.brum.beds.ac.uk/10.3390/nano11030623
Chicago/Turabian StyleGupta, Monika, Huzein Fahmi Hawari, Pradeep Kumar, Zainal Arif Burhanudin, and Nelson Tansu. 2021. "Functionalized Reduced Graphene Oxide Thin Films for Ultrahigh CO2 Gas Sensing Performance at Room Temperature" Nanomaterials 11, no. 3: 623. https://0-doi-org.brum.beds.ac.uk/10.3390/nano11030623