1. Introduction
Tungsten bronze is a kind of solid solution formed by other cations filling in the lattice structure of WO
3. Its chemical formula can be written as M
xWO
3, in which M is dopant cation and the
x value can vary in a certain range (0 <
x < 1, M is typically electropositive metals such as alkali, alkaline earth or rare-earth metals), which are non-stoichiometric compounds. The dopant M cation can contribute a number of electrons to reduce part of the hexavalent tungsten to pentavalent, which makes tungsten bronzes have special physical and chemical properties such as superconductivity [
1], photochromism [
2], electrochromism [
3], photothermal conversion [
4] and transparent heat-shielding properties [
5], etc. Among these properties, the transparent heat-shielding properties have been studied extensively in recent years because the tungsten bronze exhibits low absorption of visible light and high absorption of near-infrared light (NIR), which meets the demand of smart windows with high visible transmittance and heat-shielding performance. The free electrons in tungsten bronzes can be regarded as the electron gas moving under the background of uniform positive charge (actually a kind of plasma). The plasma may resonate when it meets the incident light, while the plasma resonance frequency increases with the increase of carrier concentration and moves to the short-wave direction.
Tungsten bronzes have three types of cubic, tetragonal and hexagonal phases [
5], and the tunnels formed by the WO
6 octahedra with different phases are also different. The cubic phase contains only one type of cubic cavity, while the tetragonal phase contains not only tetragonal, but also tripartite and pentagonal channels. The hexagonal structure, which has been widely studied, contains tripartite and hexagonal channels. The size of dopant cation M determines the content and position of M in the structure of tungsten bronze. H
+ and smaller alkali metal ions (such as Li
+) can locate in the narrow tripartite channel, while larger alkali metal ions (such as K
+, Cs
+) or NH
4+ can only locate in the hexagonal channel. If the dopant cation occupies all the hexagonal channels, then
x = 0.33. Among the various M
xWO
3, many studies indicate that Na
xWO
3 is the only compound which is possible to be synthesized in the wide range of 0 <
x < 1 [
6,
7,
8], so it has become the most studied tungsten bronze. The electrical and optical properties of Na
xWO
3 can substantially change with varying Na content. When
x < ∼0.2, Na
xWO
3 exhibits semiconductor properties, and the electrical conductivity increases with increasing
x and thus Na
xWO
3 shows metallic properties at high
x [
9]. Moreover, the changing electrical conductivity also leads to changing color in Na
xWO
3. As the
x increases from 0 to 1, the color of Na
xWO
3 gradually changes from lime green to dark blue, violet, pink, orange and yellow [
10]. This change in color can be attributed to increase of bulk plasma frequency (
ωp) [
6]. Unlike other metals, the
ωp of Na
xWO
3 can be tuned by Na content in WO
3 [
11,
12].
In our previous work, we found that extinction behavior in visible and NIR region of rare-earth hexaboride (RB
6) is directly correlated with its
ωp, and nanocrystalline RB
6 shows tunable optical characteristic as an excellent transparent heat-shielding material [
13]. Like RB
6, nanocrystalline M
xWO
3 is also an excellent transparent heat-shielding material, and even has a wider absorption range in the NIR region than LaB
6 [
14]. Because of the tunable
ωp characteristic of Na
xWO
3, we infer that the extinction in the visible and NIR region of nanocrystalline Na
xWO
3 is also tunable by different Na content. However, the current research on tungsten bronzes mainly focuses on its preparation methods or co-doping effect [
5,
15,
16,
17,
18]; the tunable absorption behavior of nanocrystalline tungsten bronzes has very rarely been reported in the literature. In this paper, nanocrystalline Na
xWO
3 powders with different
x were synthesized by a solvothermal method and their optical properties were discussed. In order to more systematically study the optical properties of nanocrystalline Na
xWO
3, the discrete dipole approximation (DDA) method was also used to investigate the influence of different x, particle size and particle shape on its optical properties.
3. Results and Discussion
To obtain a nanocrystalline Na
xWO
3 with different
x value, we mixed precursor solutions with different molar ratio of Na/W, as shown in
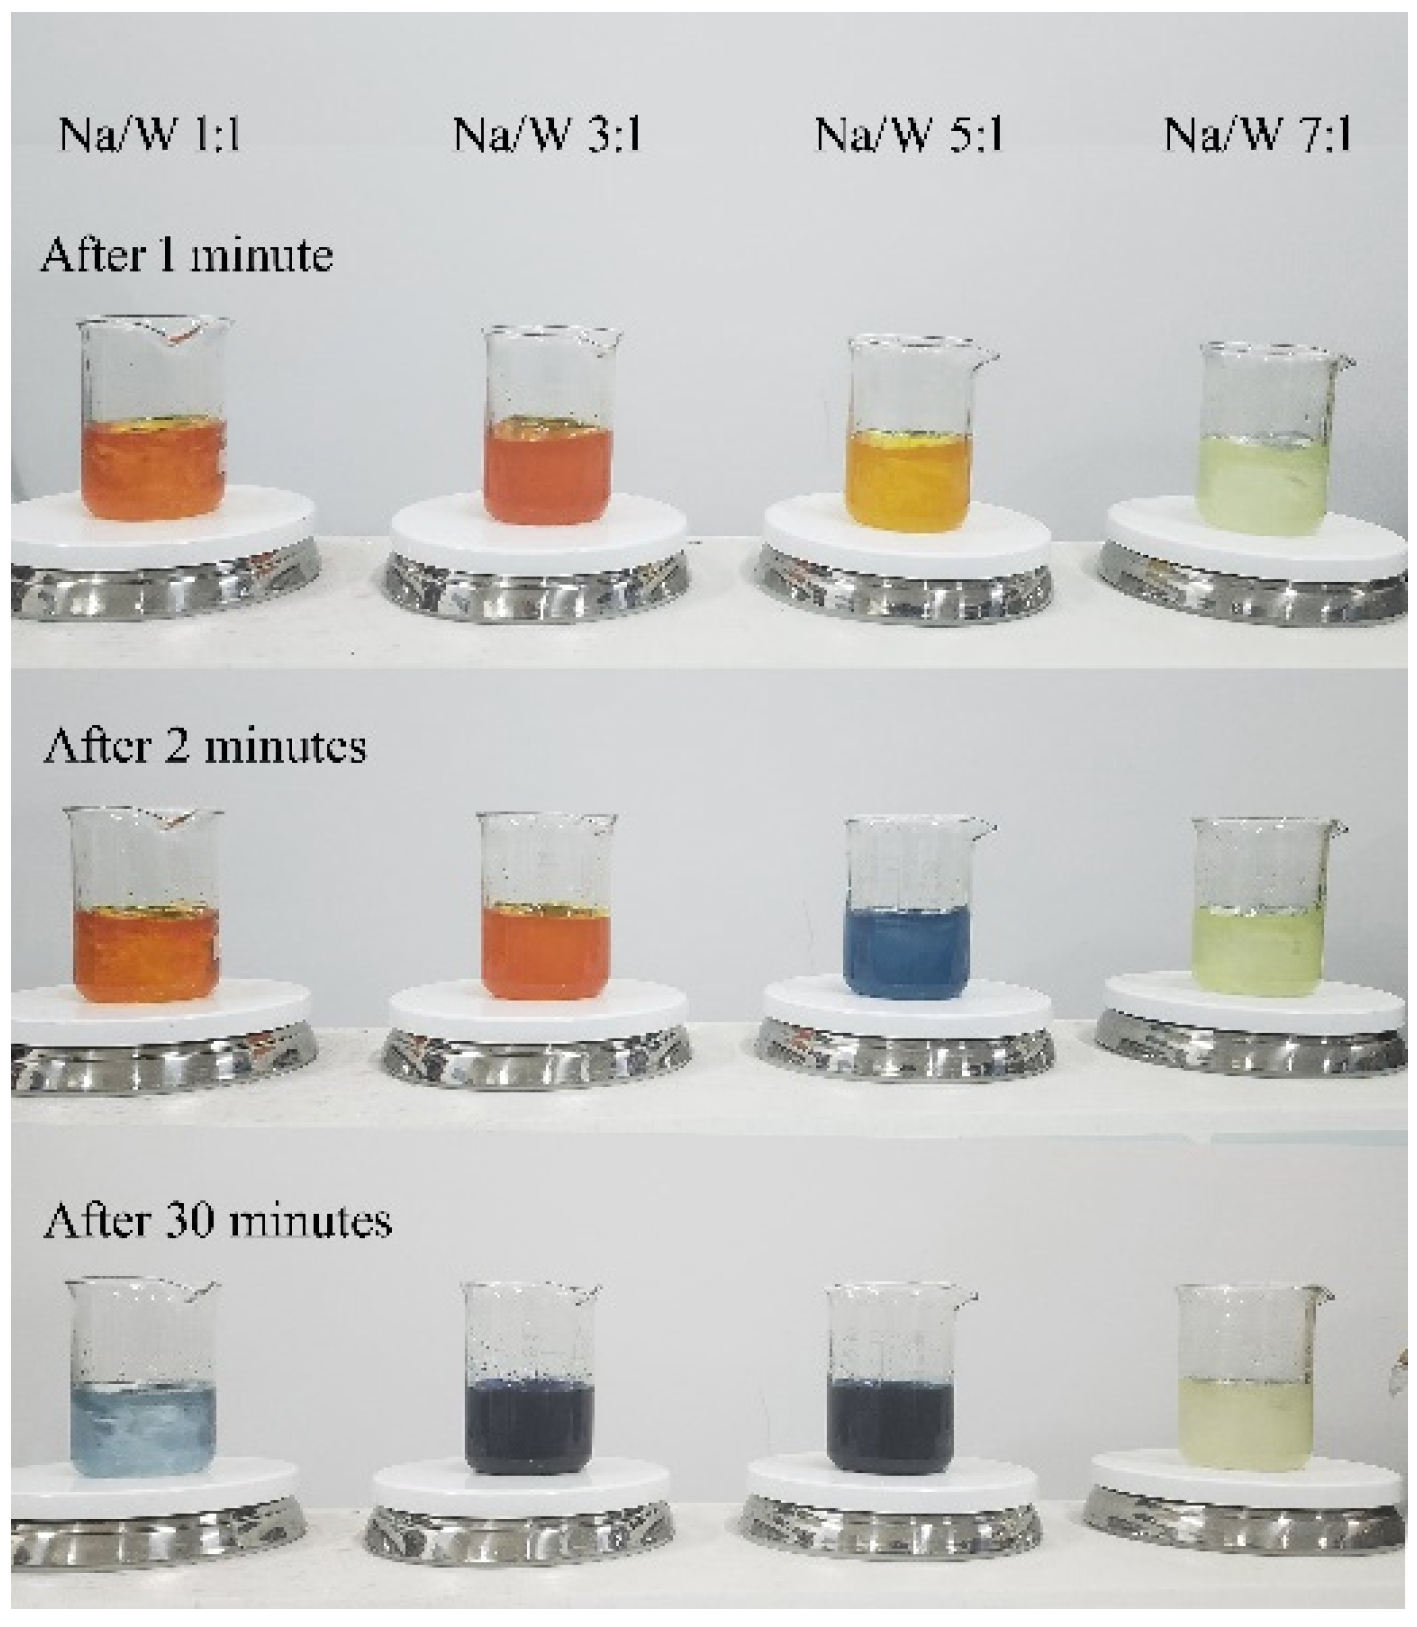
Figure 1. After magnetic stirring at 30 min, the solution with Na/W molar ratio of 1:1, 3:1 and 5:1 turned dark blue, but the solution with molar ratio of 7:1 was always kept at yellowish. After treatment in the reactor, blue powder was obtained from the solution with Na/W molar ratio of 1:1, 3:1 and 5:1, but no solid precipitate was formed in the solution with Na/W molar ratio of 7:1. We infer that tungsten trioxide reacted with NaOH and formed sodium tungstate when NaOH was excessive, so other methods are needed to obtain nanosized Na
xWO
3 with high
x value.
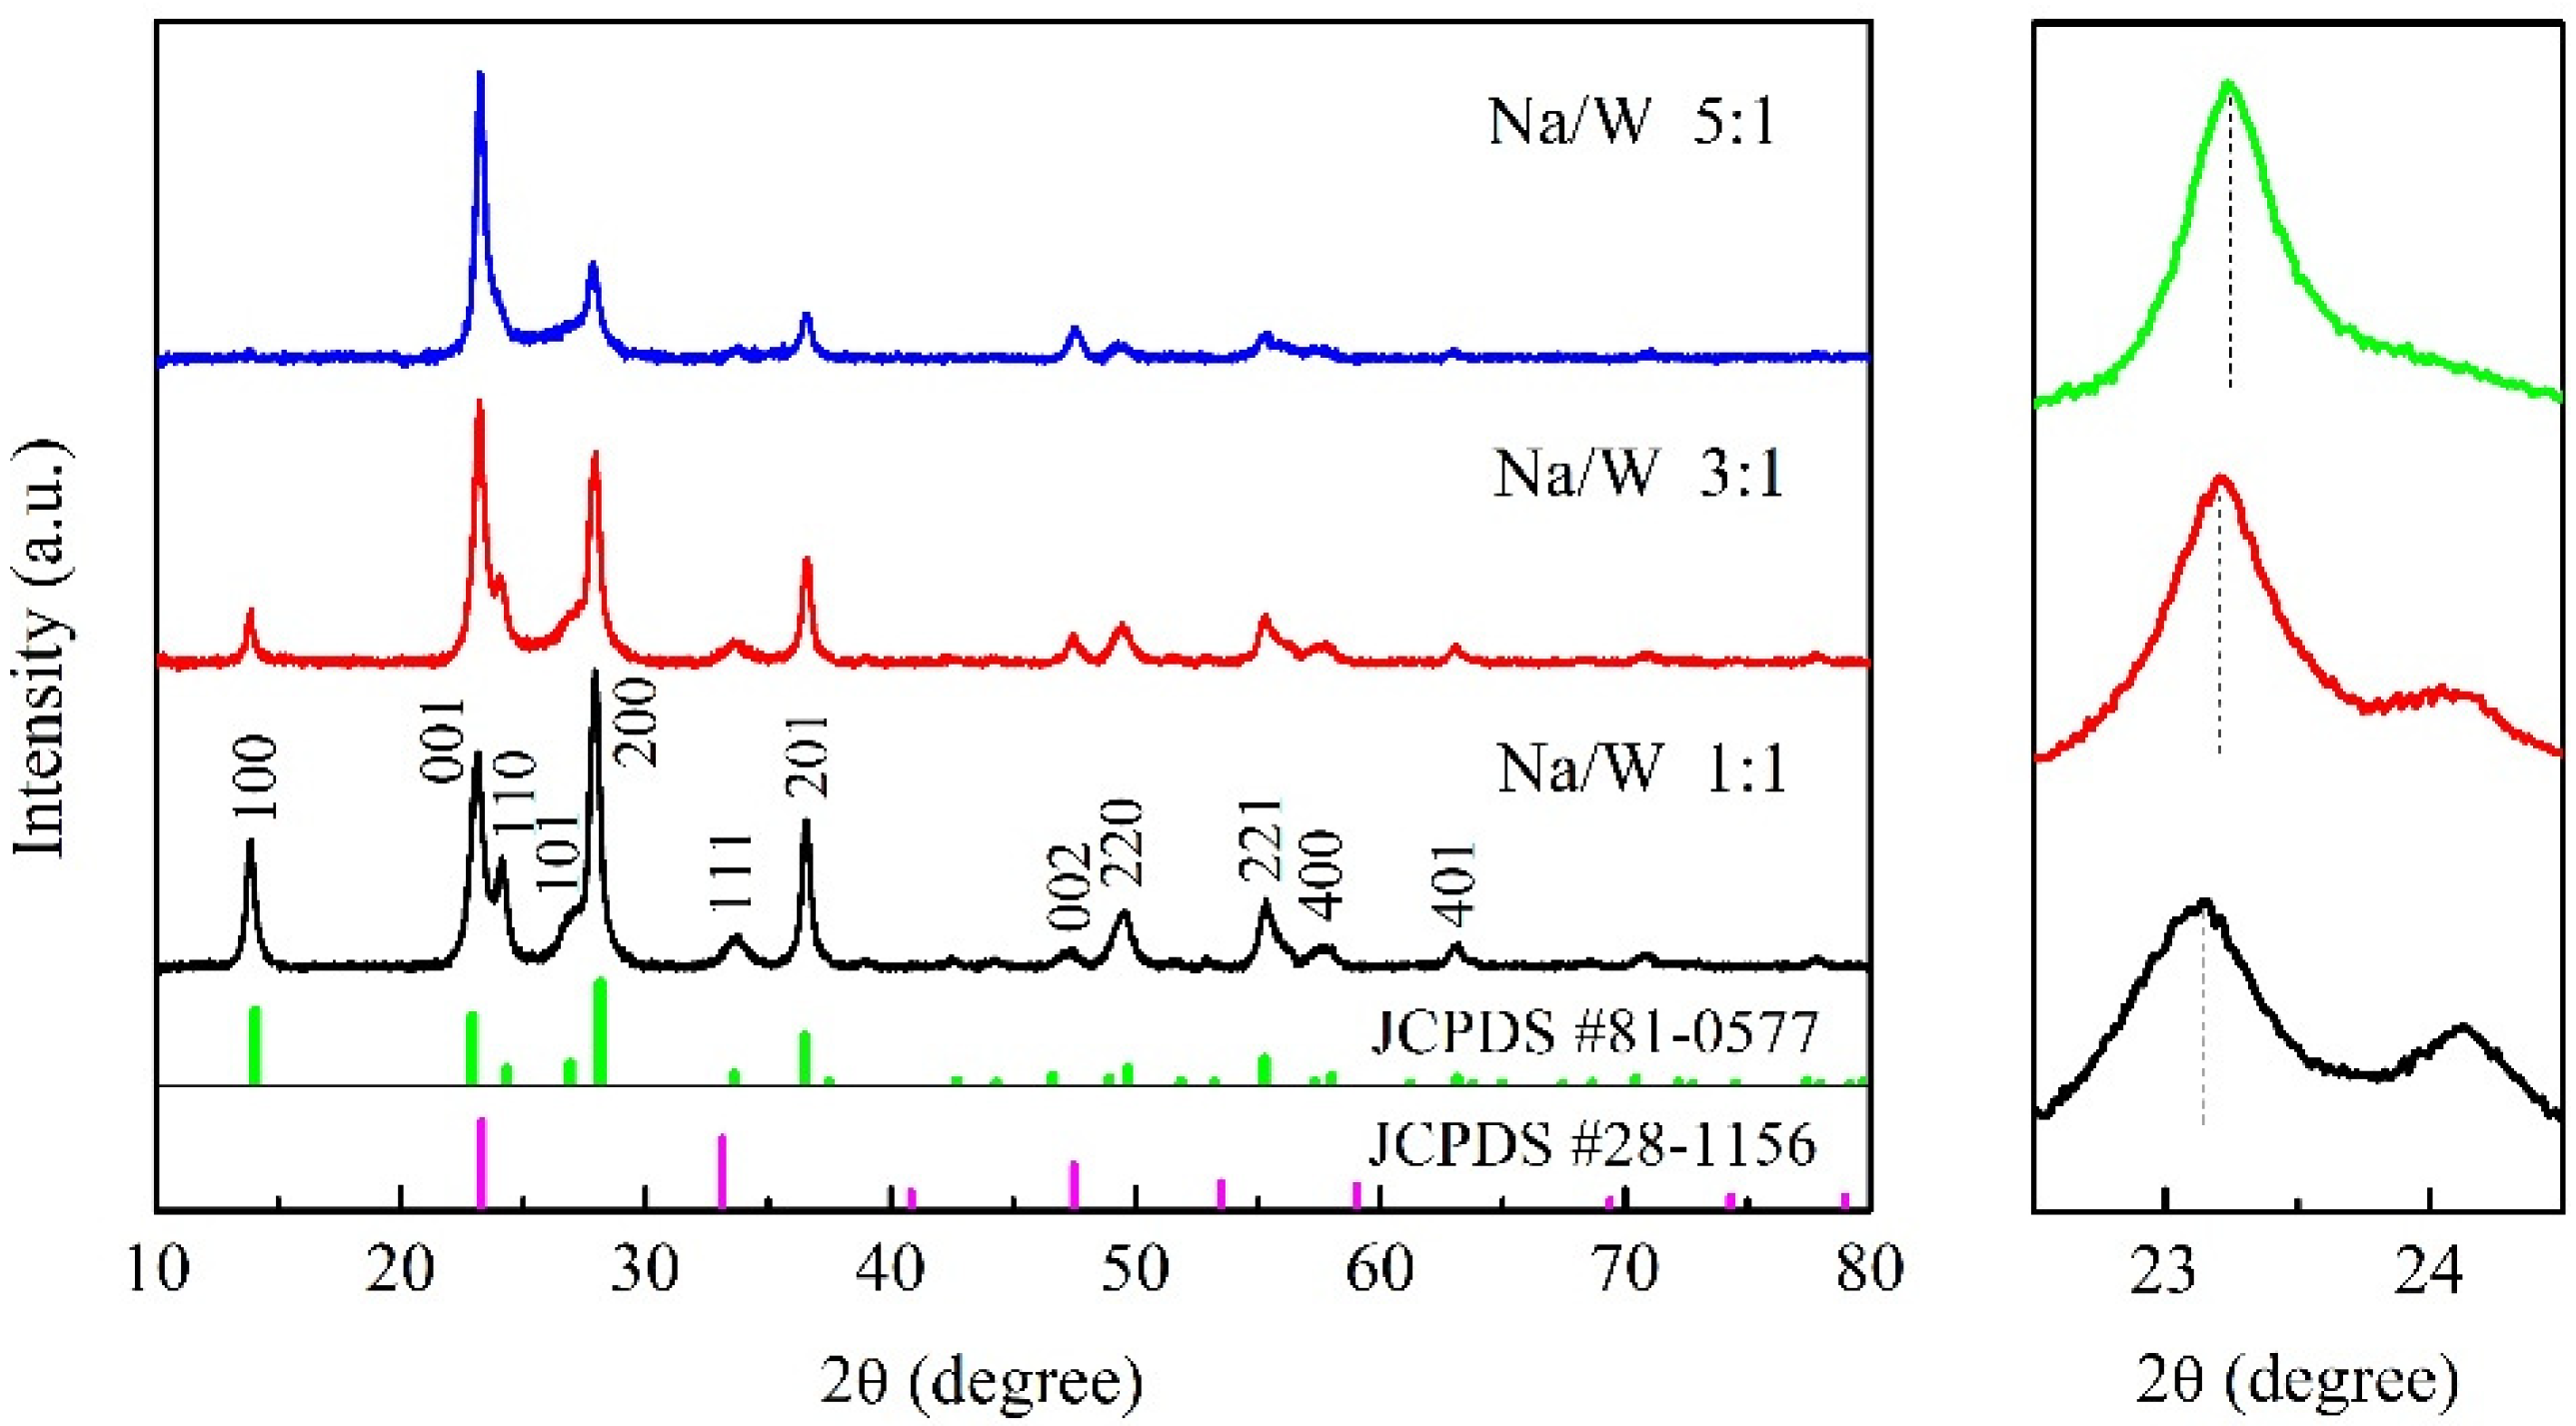
Figure 2 shows the XRD results of three kinds of Na
xWO
3 nanopowders obtained from the solvothermal reaction. The sharp and intensive XRD reflections indicate the well-crystallized character of the samples. The XRD pattern of sample with Na/W molar ratio of 1:1 can be indexed on the basis of a hexagonal phase of Na-WO
3 (JCPDS 81-0577). With increasing Na content, the peaks of (001) and (002) become stronger and all other peaks become weaker. The peaks of (001) and (002) also correspond to a cubic phase of Na-WO
3 (JCPDS 28-1156). In addition, it can be seen from the partial enlarged view that the (001) peak slightly moves to higher angle with the increase of Na content, which corresponds to the position of the peak near 23° on the JCPDS 81-0577 and JCPDS 28-1156. Therefore, we infer that the sample exhibits a tendency to change to cubic phase with increasing Na content. According to literature, the Na
xWO
3 shows a perovskite-type crystal structure with cubic symmetry at
x > ~0.4 [
6,
7], which is consistent with our XRD results.
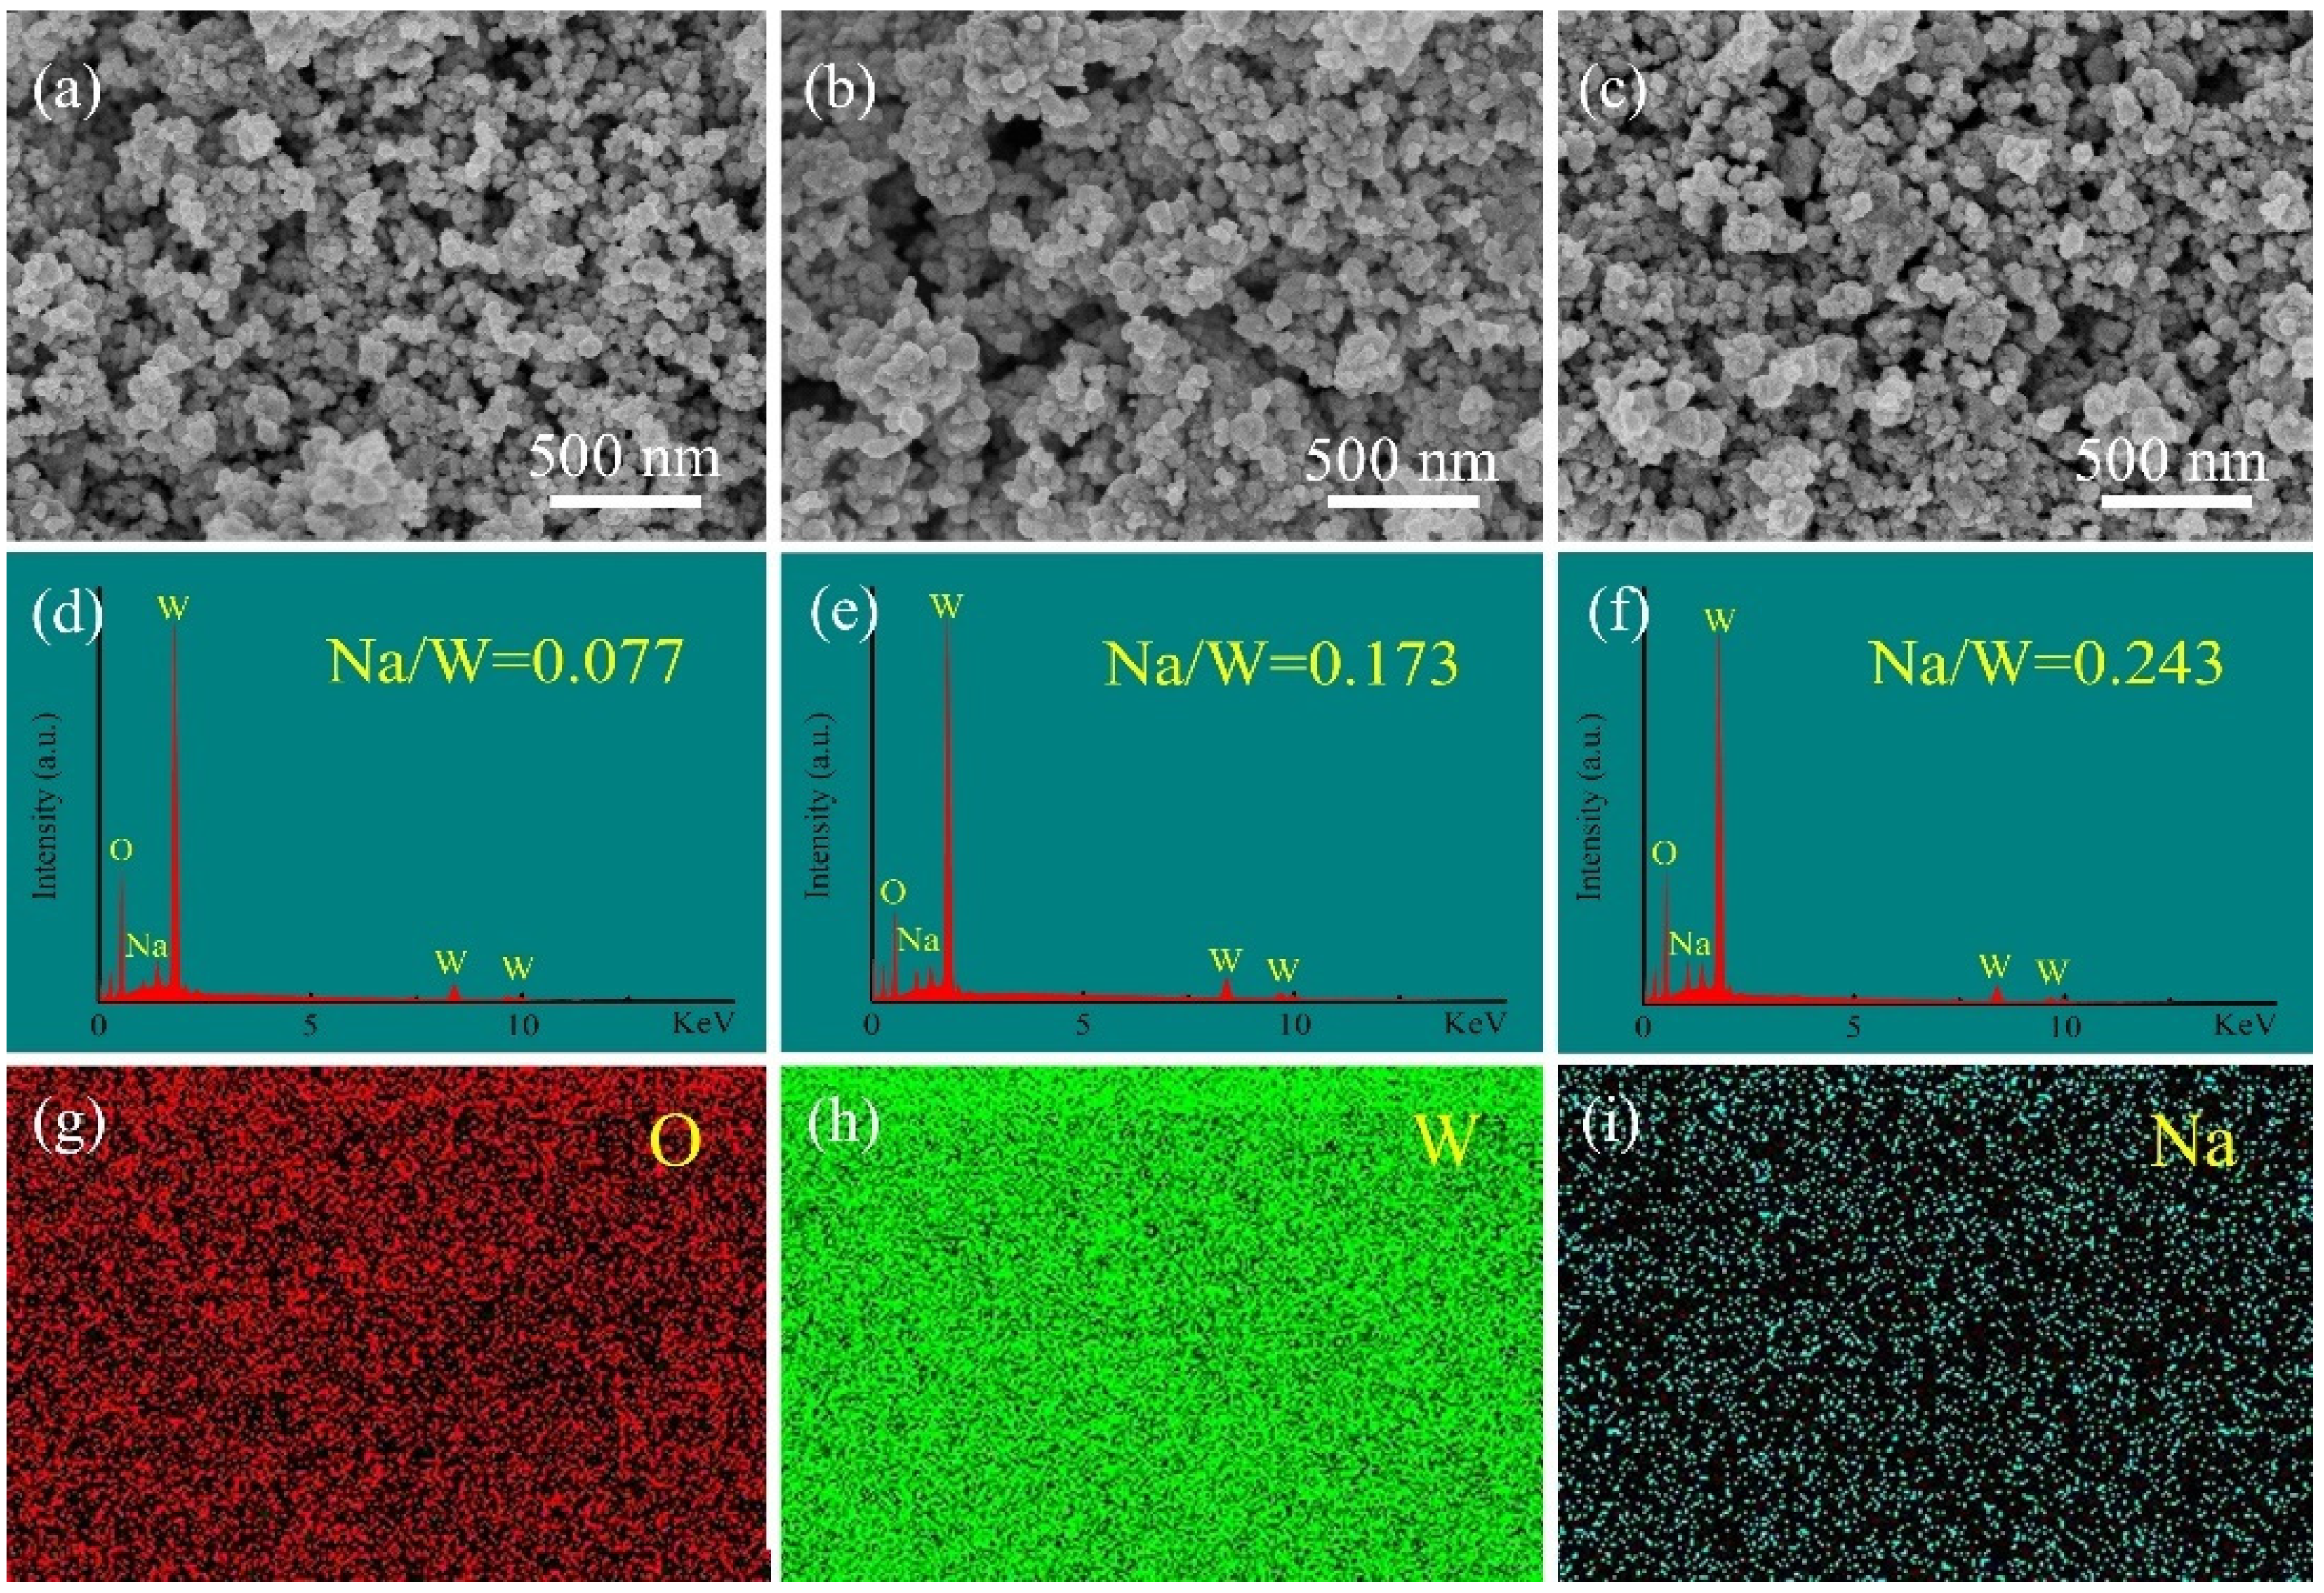
The SEM images of the synthesized Na
xWO
3 powders with different Na/W ratios are shown in
Figure 3. It can be seen from
Figure 3a–c that all three samples are mainly composed of homogeneous and well-dispersed nanoparticles with sizes of several tens of nanometers. The EDS images in
Figure 3d–f gives that the atomic ratios of Na/W for three samples are 0.077, 0.173 and 0.243, respectively.
Figure 3g–i show the element mapping of sample with Na/W ratio of 1:1, which confirms the presence and uniform distribution of O, W and Na in selected area.
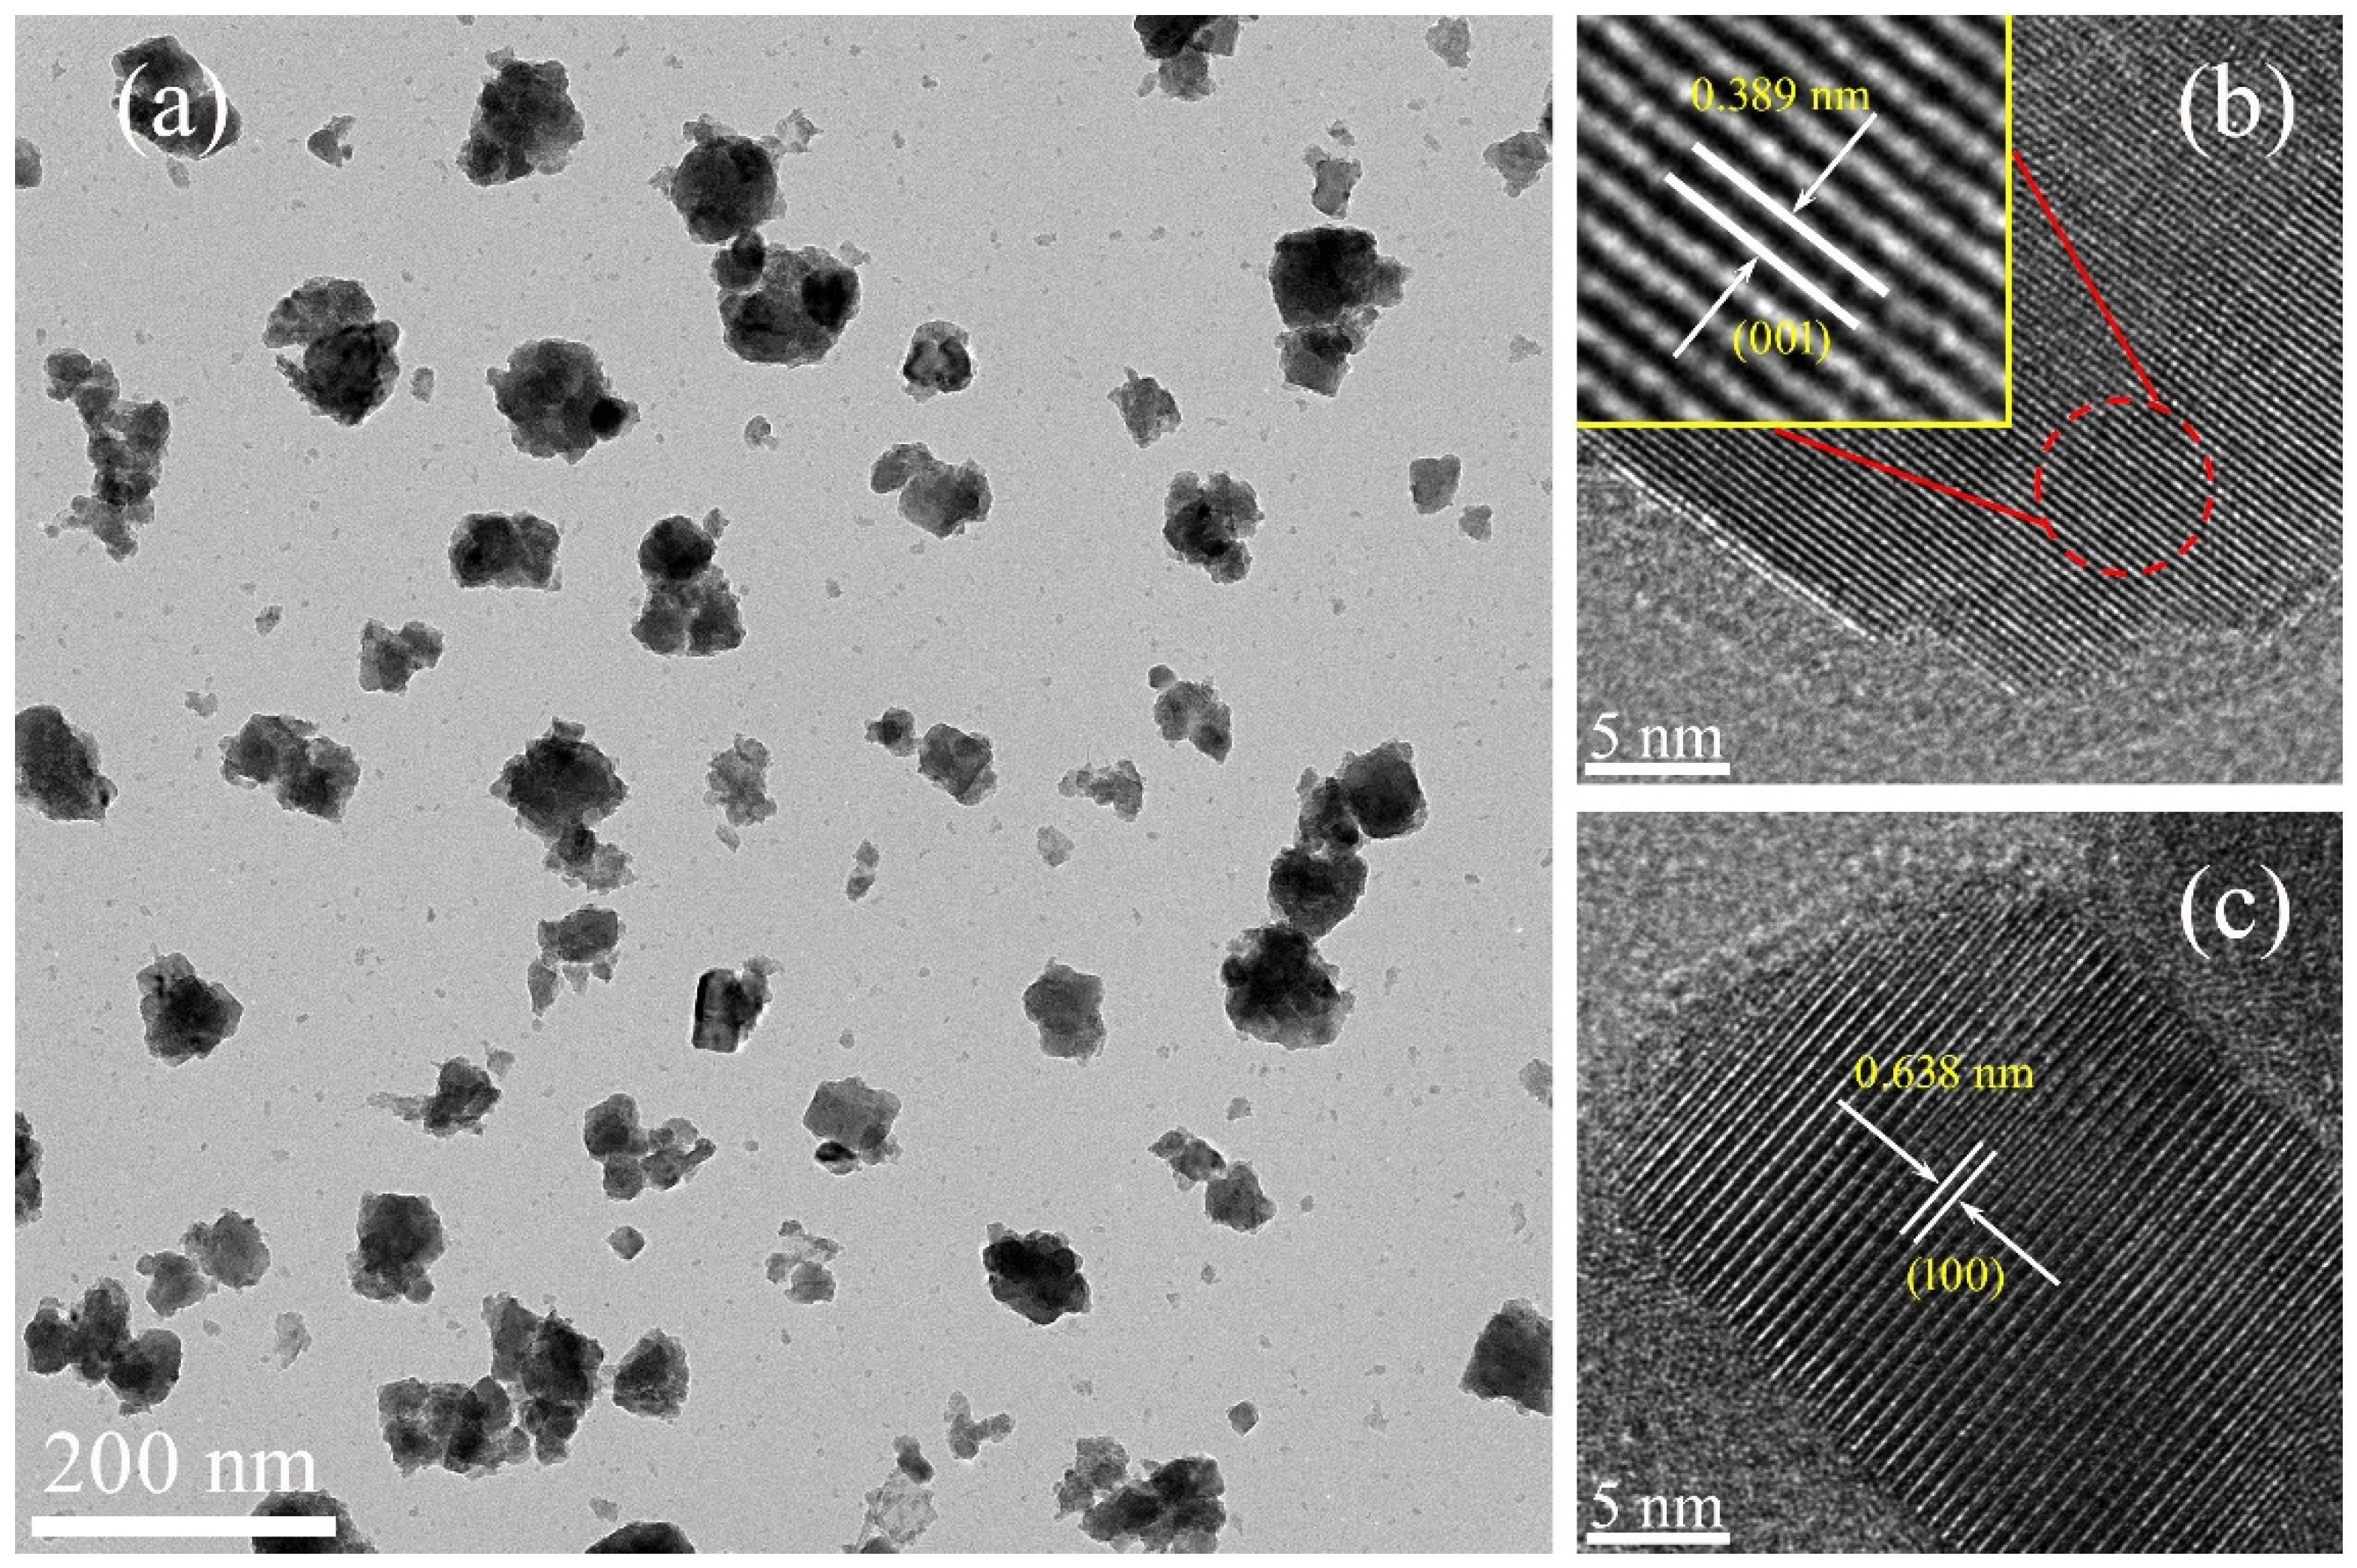
To further study the detailed microstructure of obtained products, TEM was used to observe the grain morphology and crystallinity of the sample with Na/W molar ratio of 1:1, and results are given in
Figure 4. It can be seen from the TEM image that the sample is composed of nanoparticles with sizes of several tens of nanometers, which is consistent with the results of SEM. Moreover, two kinds of crystalline lattice constant in the HRTEM images were calculated as 0.389 and 0.638 nm, which agrees well with the interplanar spacing (0 0 1) and (100) of the hexagonal phase of Na-WO
3 (JCPDS 81–0577), respectively.
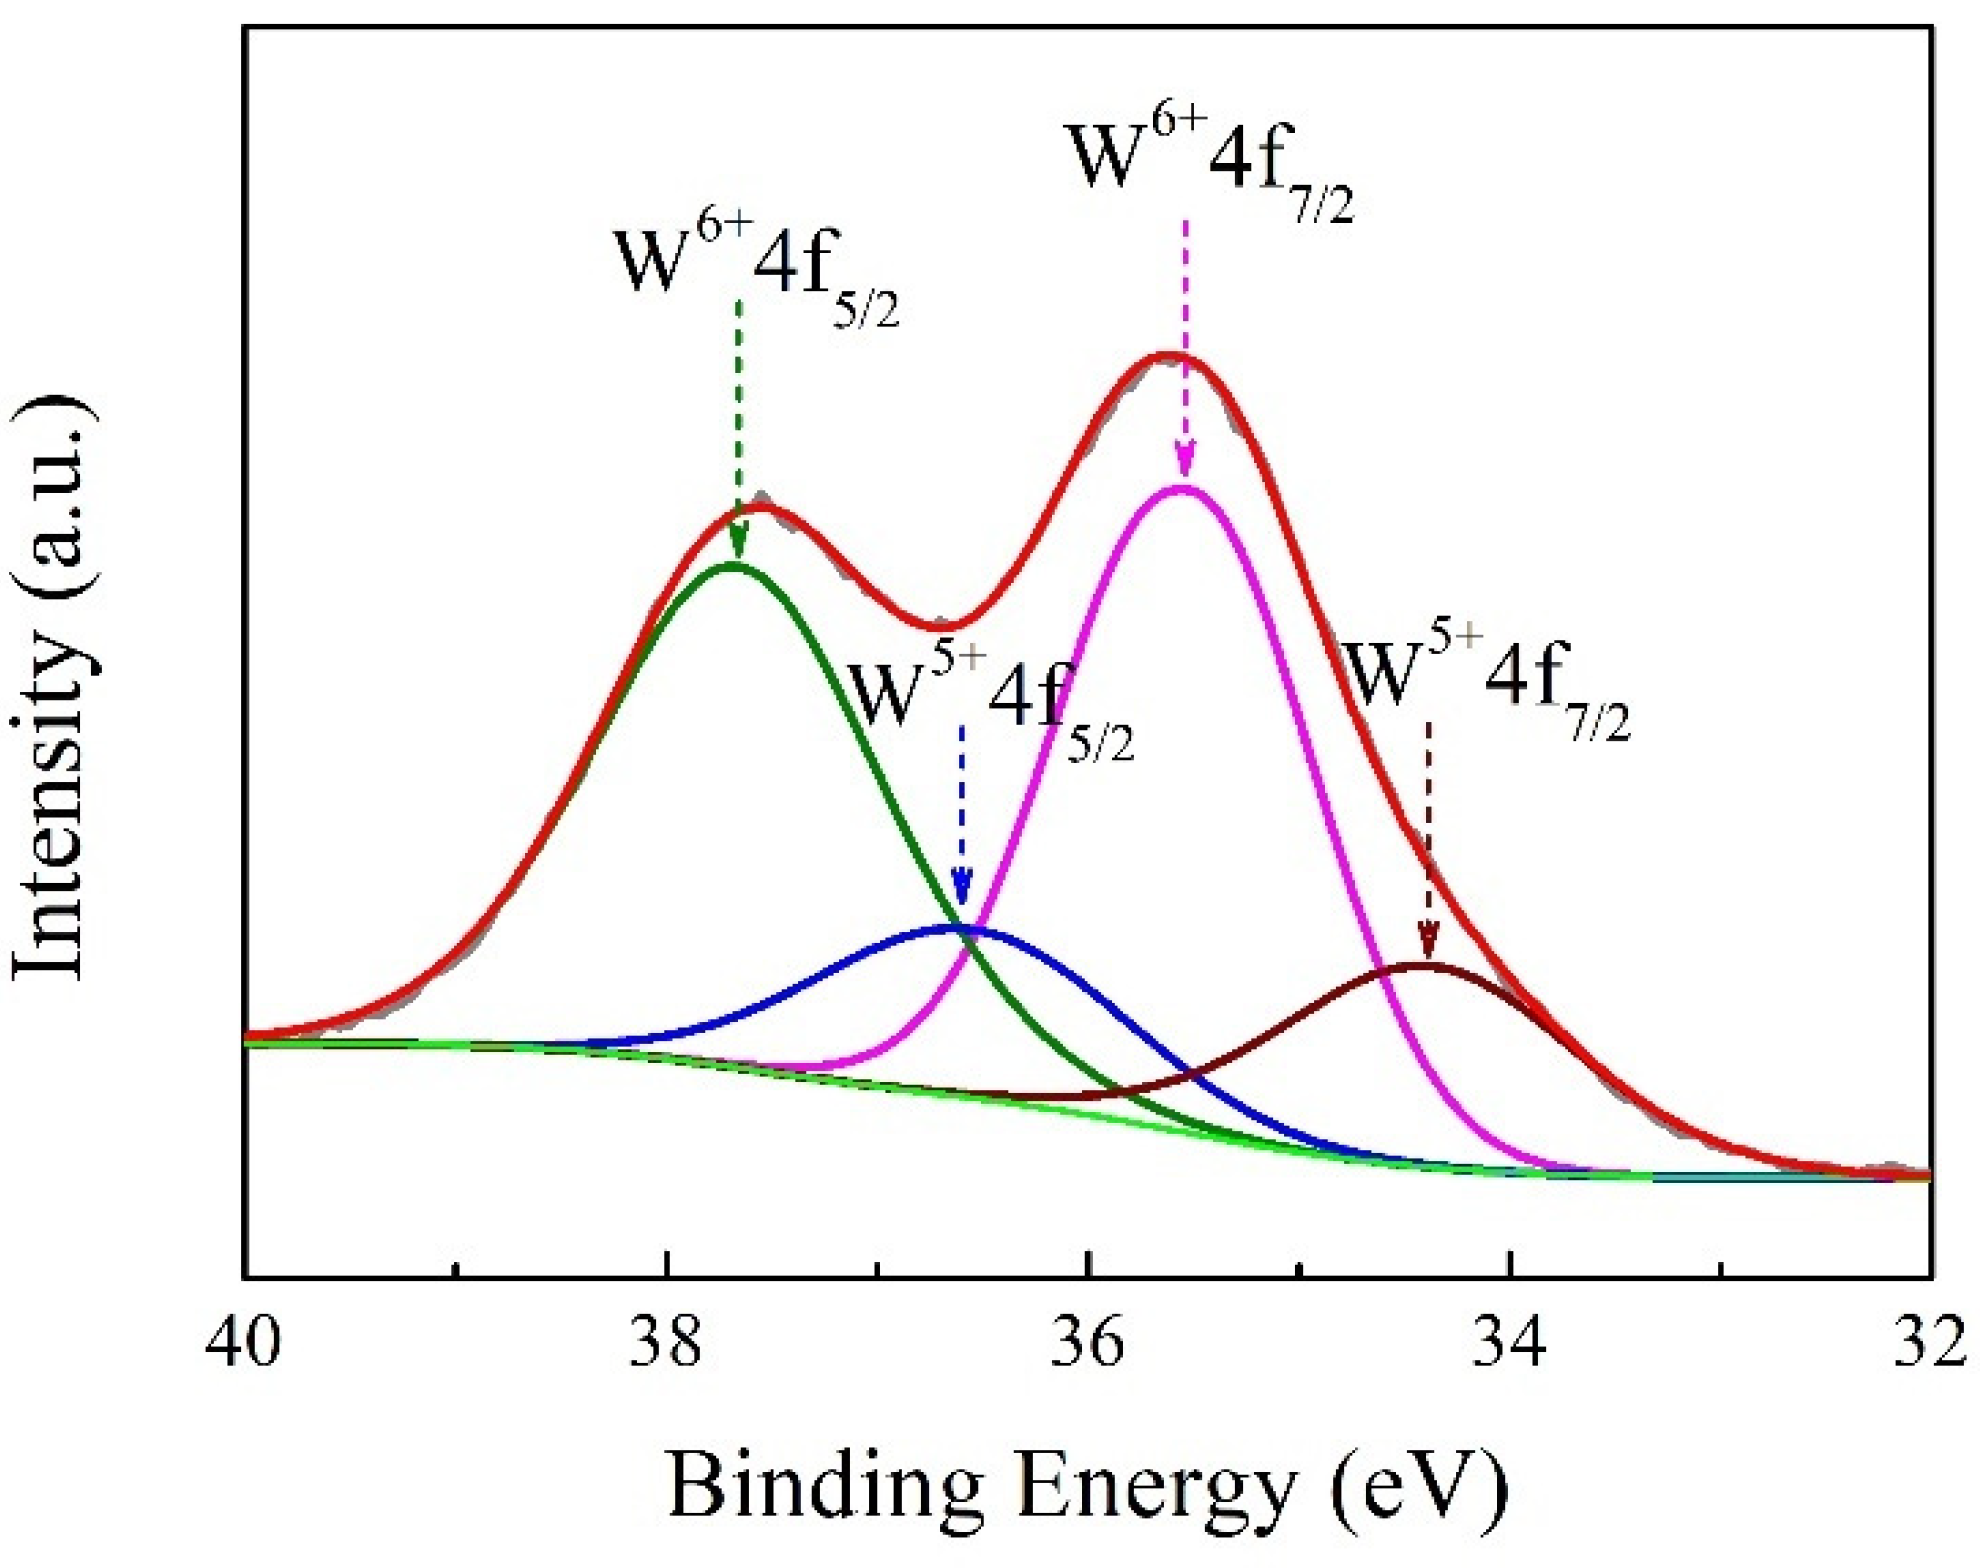
The chemical state of the Na
xWO
3 nanoparticles was carefully determined by XPS.
Figure 5 shows the typical XPS of the tungsten core level (W
4f) in the Na
xWO
3 nanoparticles with Na/W ratio of 1:1. The spectrum can be fitted to two groups of spin-orbit doublets of W
4f7/2 and W
4f5/2 with a separation distance of 2.1 eV, indicating two different oxidation states of W element. The peaks at 37.6 and 35.5 eV can be attributed to the W element being in a 6+ oxidation state, while 36.5 and 34.4 eV can be assigned to the W element being in a 5+ oxidation state. It is suggested that the typical nature of non-stoichiometric tungsten bronzes can be expressed as the formula of M
xW
6+1-xW
5+xWO
3; our XPS results are in good agreement with this reduced feature. Na atoms can contribute a number of free electrons when they are doped into the structure of WO
3, and part of the W
6+ will be reduced to W
5+. The transparent heat-shielding properties of tungsten bronzes are closely related to the plasmon resonance of free electrons, and the concentration of free electrons has a great influence on the
ωp. Therefore, the transparent heat-shielding properties of tungsten bronzes could be tuned by controlling the concentration of free electrons in its microstructure.
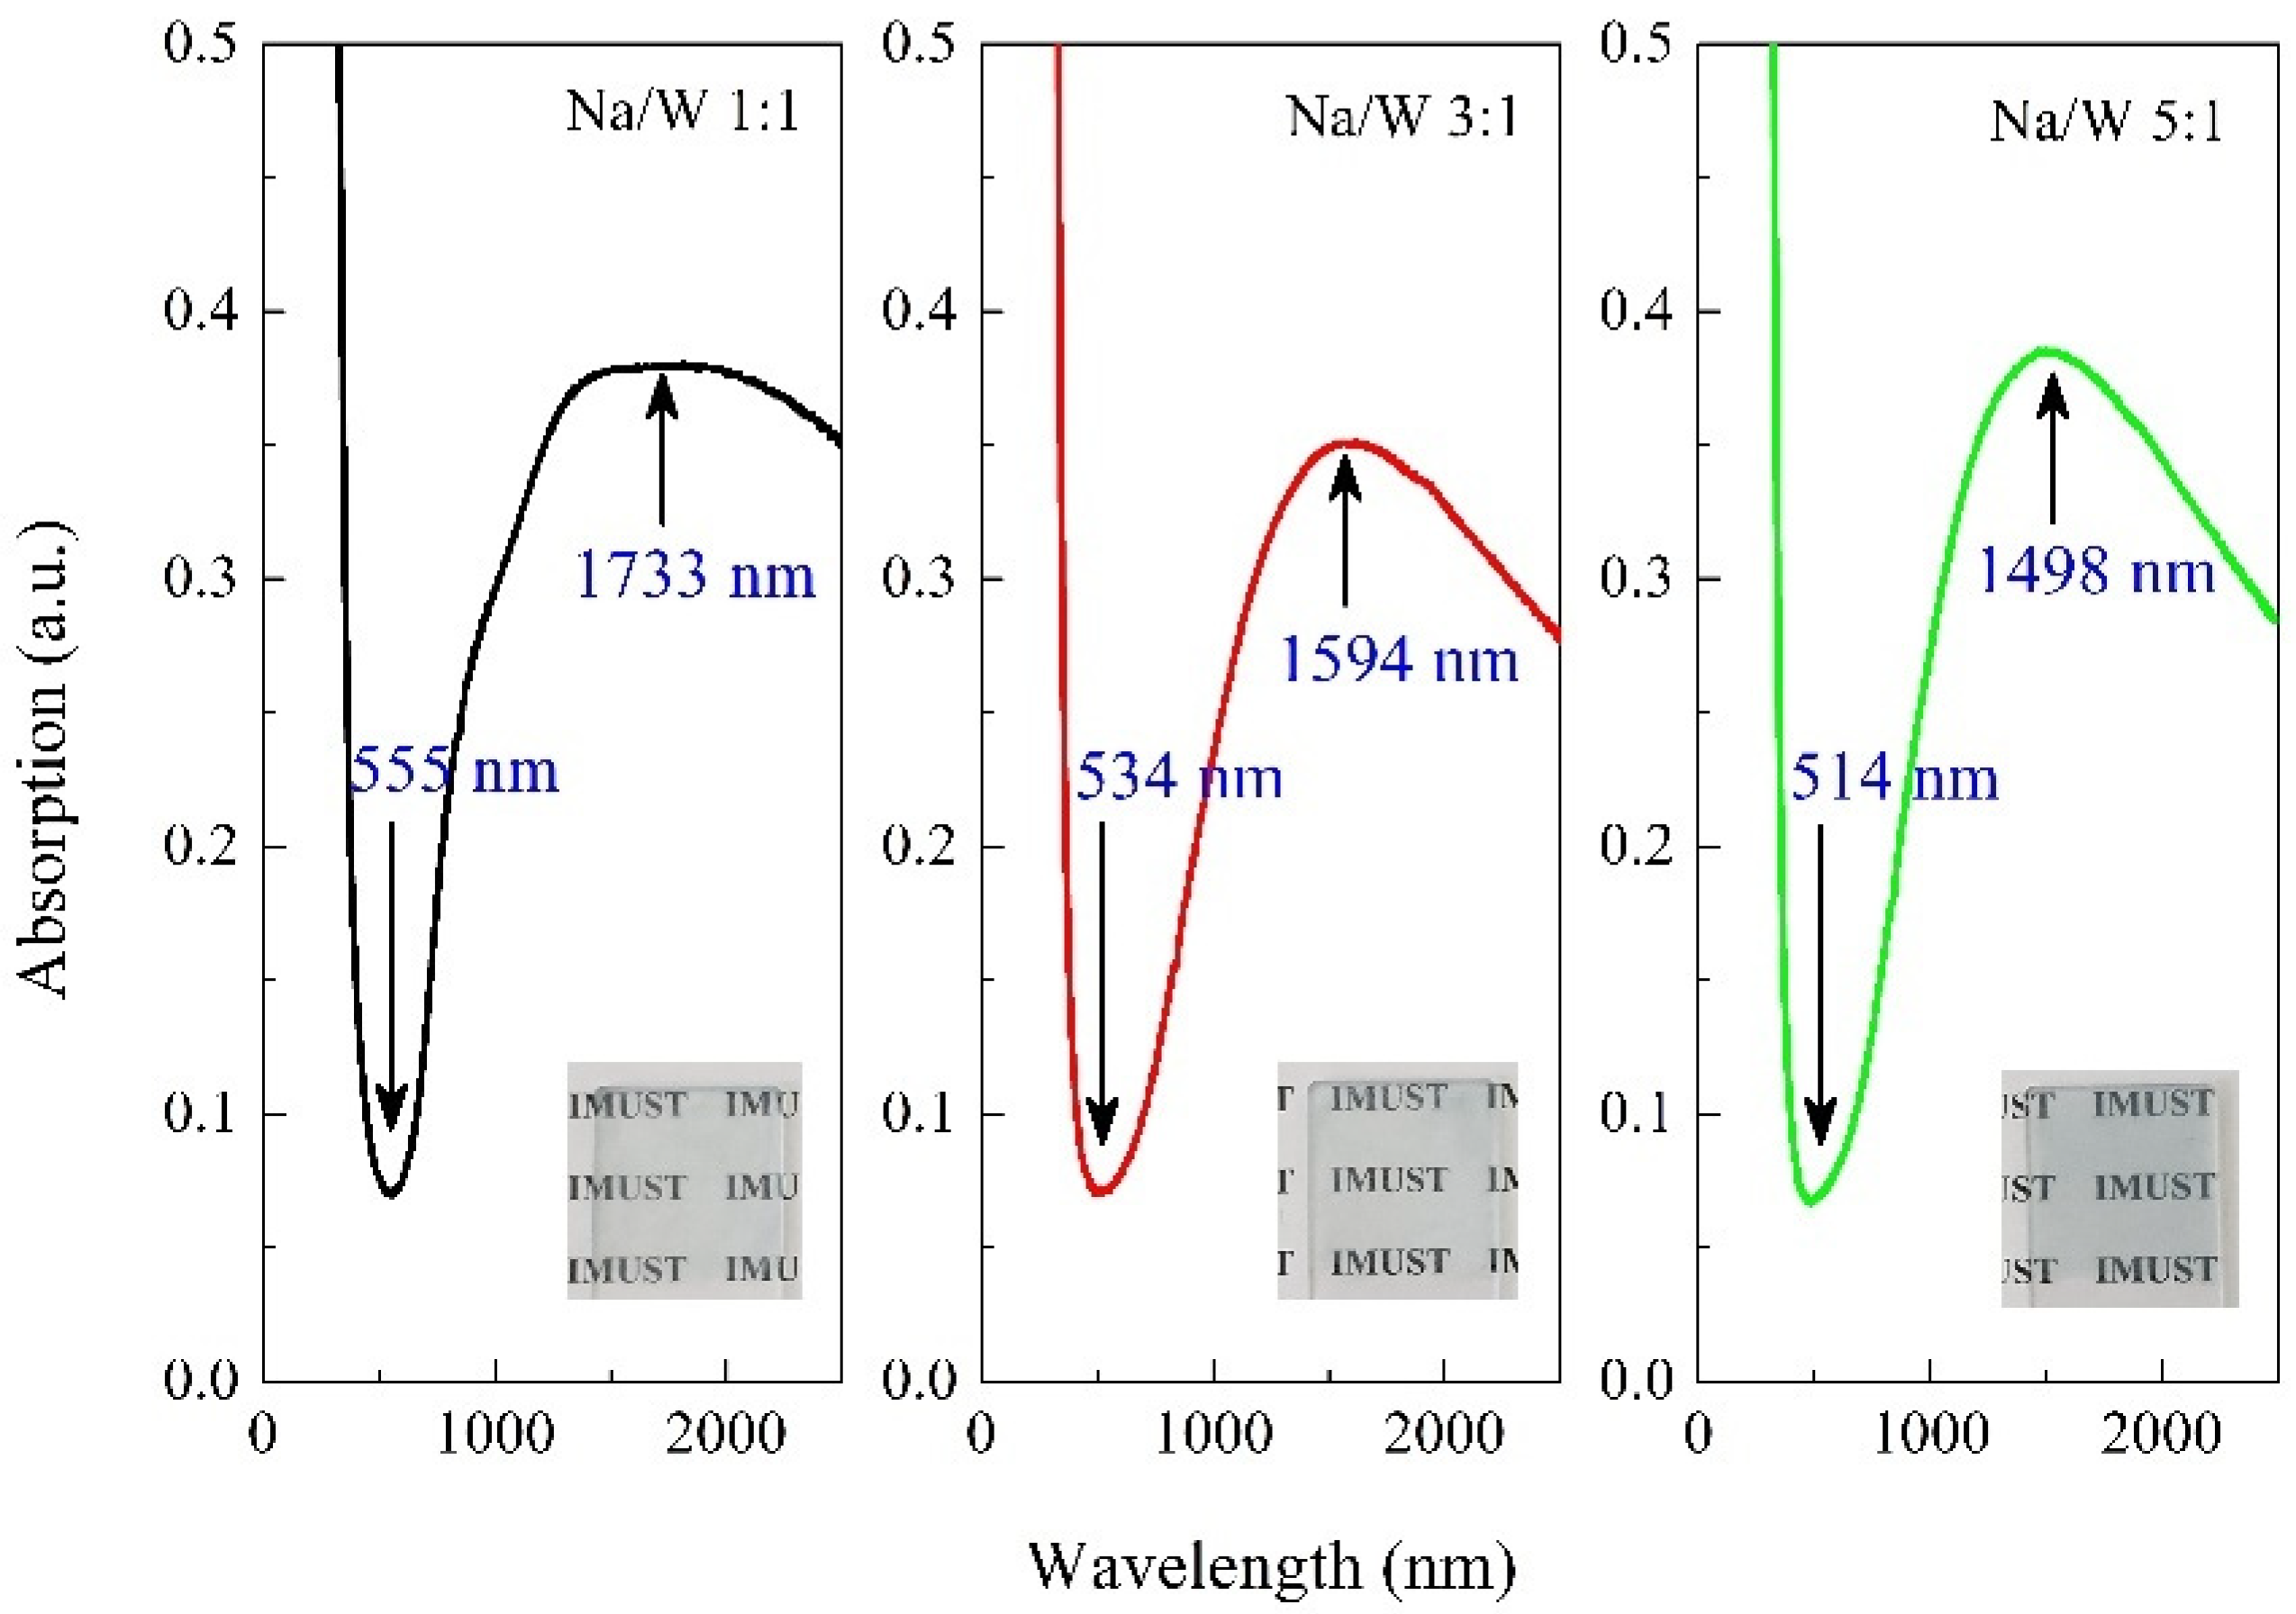
To investigate the optical properties of Na
xWO
3, the same amount of obtained powder sample was uniformly dispersed and coated on the glass slide, and the absorption spectra are shown in
Figure 6. All three samples exhibit low and high absorption characteristics in the visible and NIR region, respectively. The absorption valley occurs at 555 nm for the sample with Na/W ratio of 1:1, and shifts to shorter wavelength of 514 nm for the sample with Na/W ratio of 5:1. The corresponding absorption peak in NIR region shows the same trend as the absorption valley, with shifts from 1733 nm to 1498 nm. These results illustrate that the transparency in visible and NIR region of nanocrystalline Na
xWO
3 can be effectively tuned by
x content. Generally, the low optical absorption in visible region can be ascribed to the
ωp, which corresponds to the peak in low energy region of energy loss spectra. The electron energy loss spectra for Na
xWO
3 with different
x value have been measured by Tegg et al. [
12], and results showed that the position of peak in low energy region shifts to higher energy as
x increases, which is consistent with our results in
Figure 6.
However, the nanoparticulated Na
xWO
3 with higher
x values could not be synthesized in our experiment. Therefore, the optical properties of nanosized Na
xWO
3 with higher
x values in the visible and NIR region were calculated theoretically by using the DDA method. The DDA simulation gives the extinction efficiencies (
Qext) of single particle. In order to compare simulation results with the experiment, we plotted
Qext/
aeff [
23]. It should be noted that the absorption curve measured by UV-Vis spectrophotometer is converted from the transmittance of the sample, so the absorption spectrum from our measurement corresponds to the extinction curve from DDA calculations.
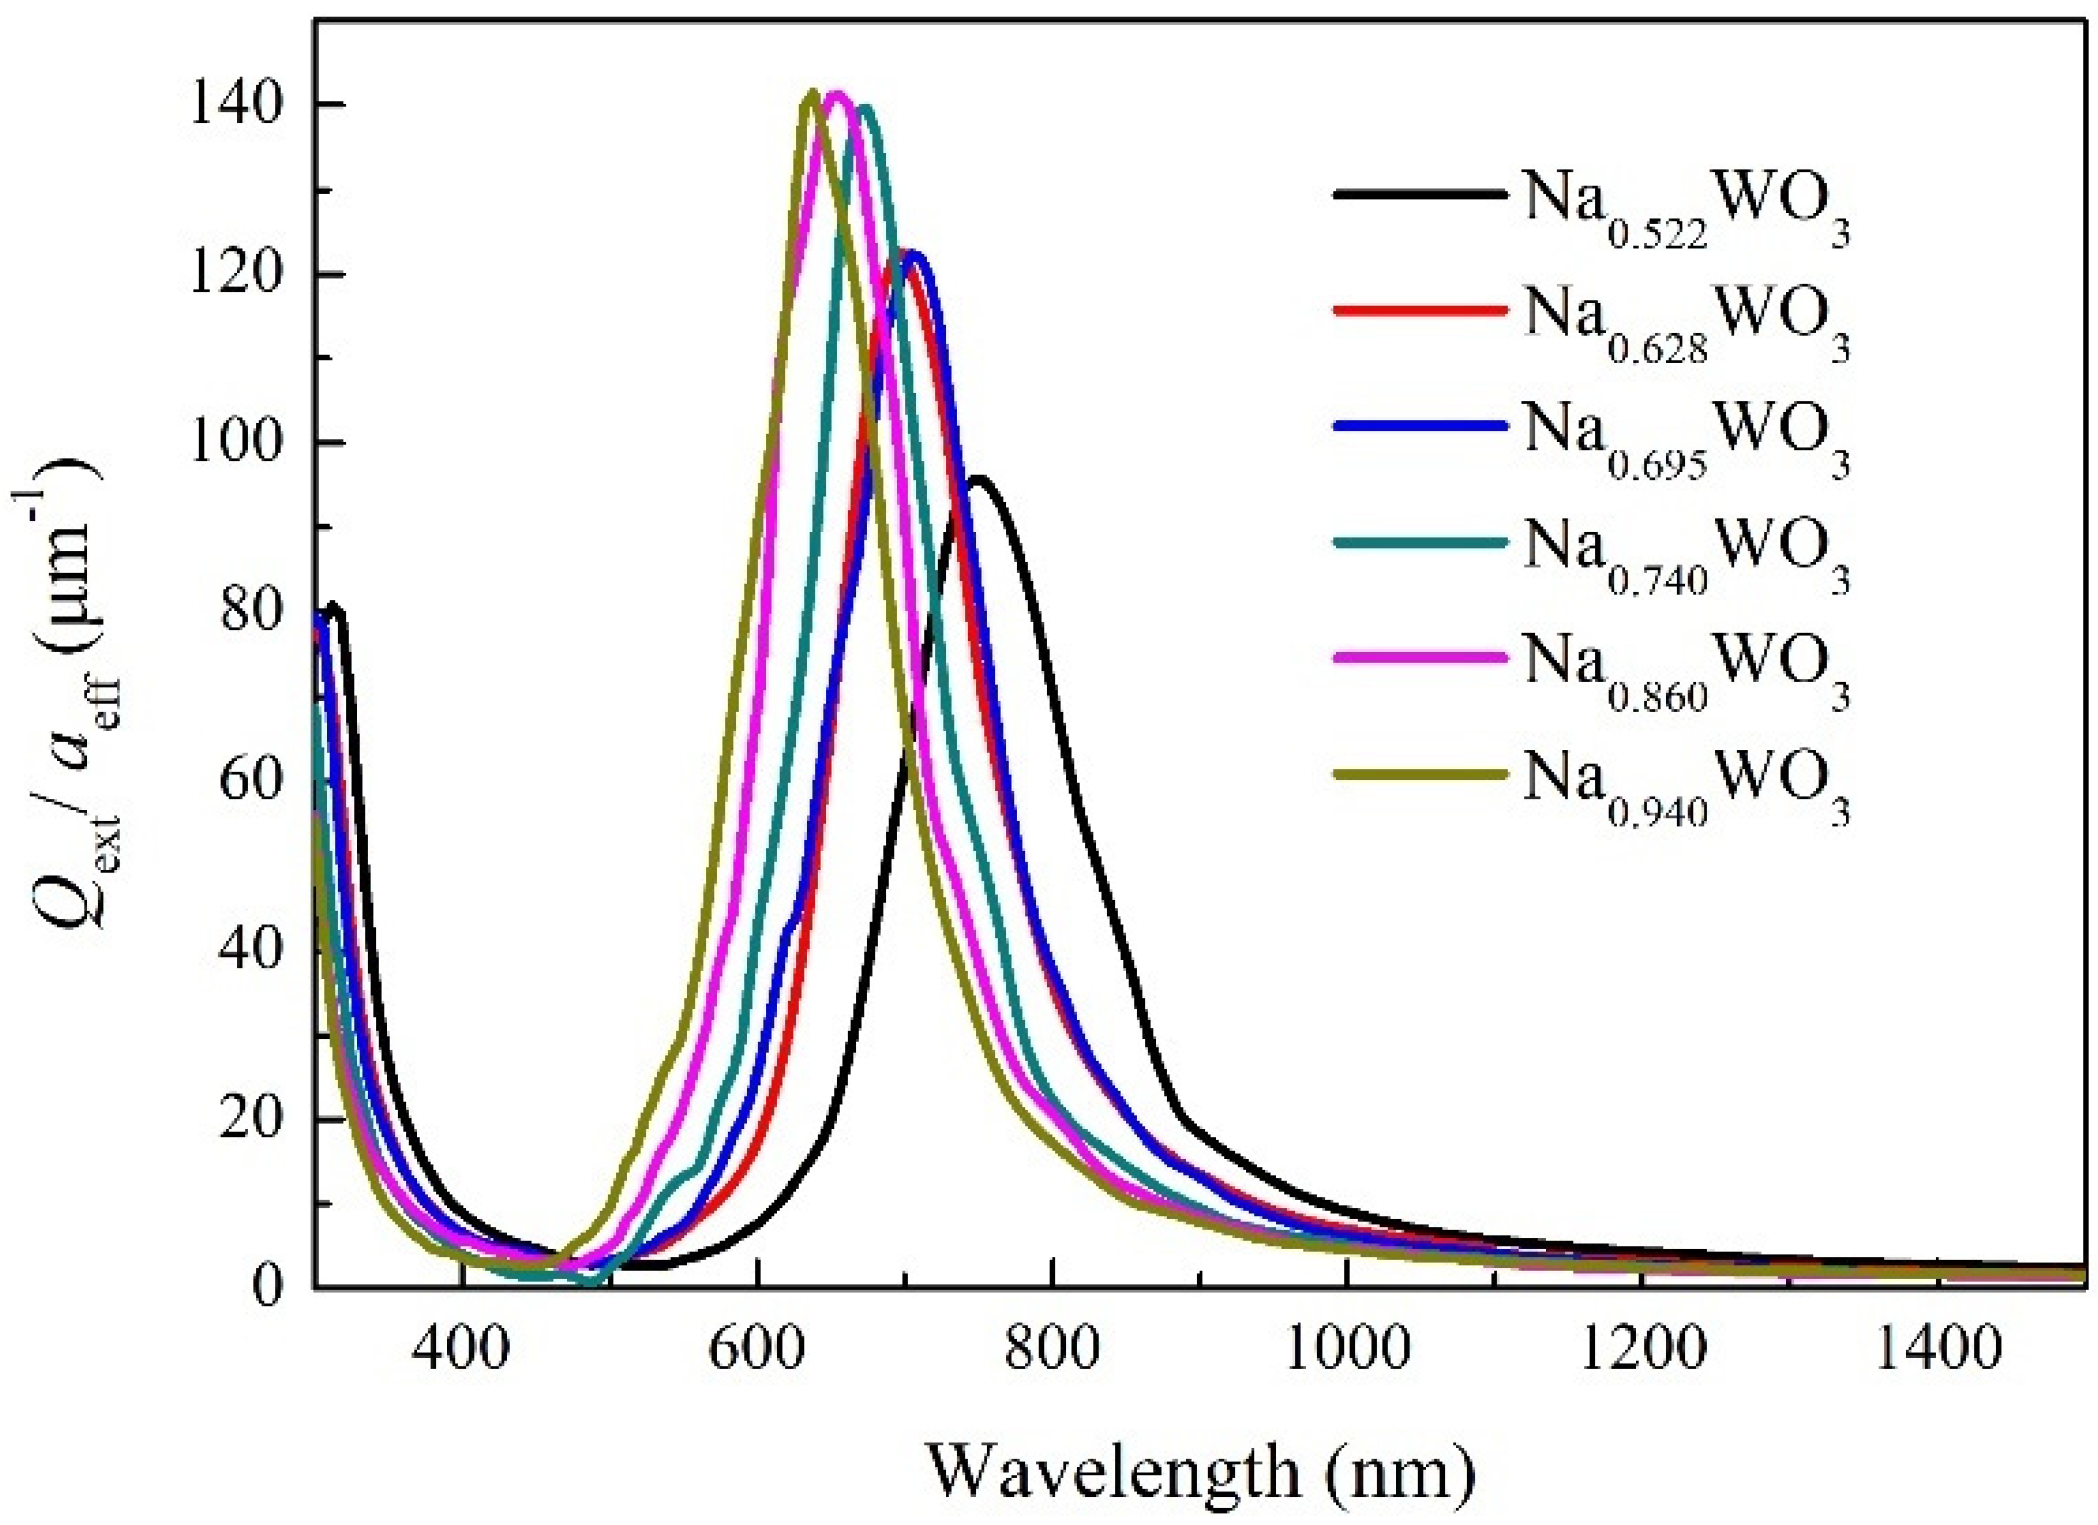
Figure 7 gives the extinction curves of sphere-shaped Na
xWO
3 particles with size of 50 nm and
x value of 0.522, 0.628, 0.695, 0.740, 0.860 and 0.940. For
x = 0.522, the extinction valley occurs at 501 nm and gradually shifts to 423 nm for
x = 0.94 with increasing x, which is in good agreement with our experimental results. Combining the experimental results with the DDA simulation results, it can be found that the position of the transmission peak of Na
xWO
3 in the visible region can be continuously adjusted by
x value in the whole range of 0 <
x < 1. In addition, the extinction peak position shifts from 749 nm to 640 nm when
x increases from 0.522 to 0.94. Although the shifting trend with
x value is the same as that in
Figure 6, the position of extinction peak is much smaller than that in
Figure 6. The reason for this difference should be related to the size and shape of nanoparticles. The experimental sample is composed of particles of various sizes and shapes, and the measured absorption spectrum is the comprehensive effect of all particles. However, what DDA calculates is particles with size of 50 nm and shape of ideal sphere. In order to verify this inference, we also calculated the extinction behavior of Na
xWO
3 particles of different sizes and shapes.
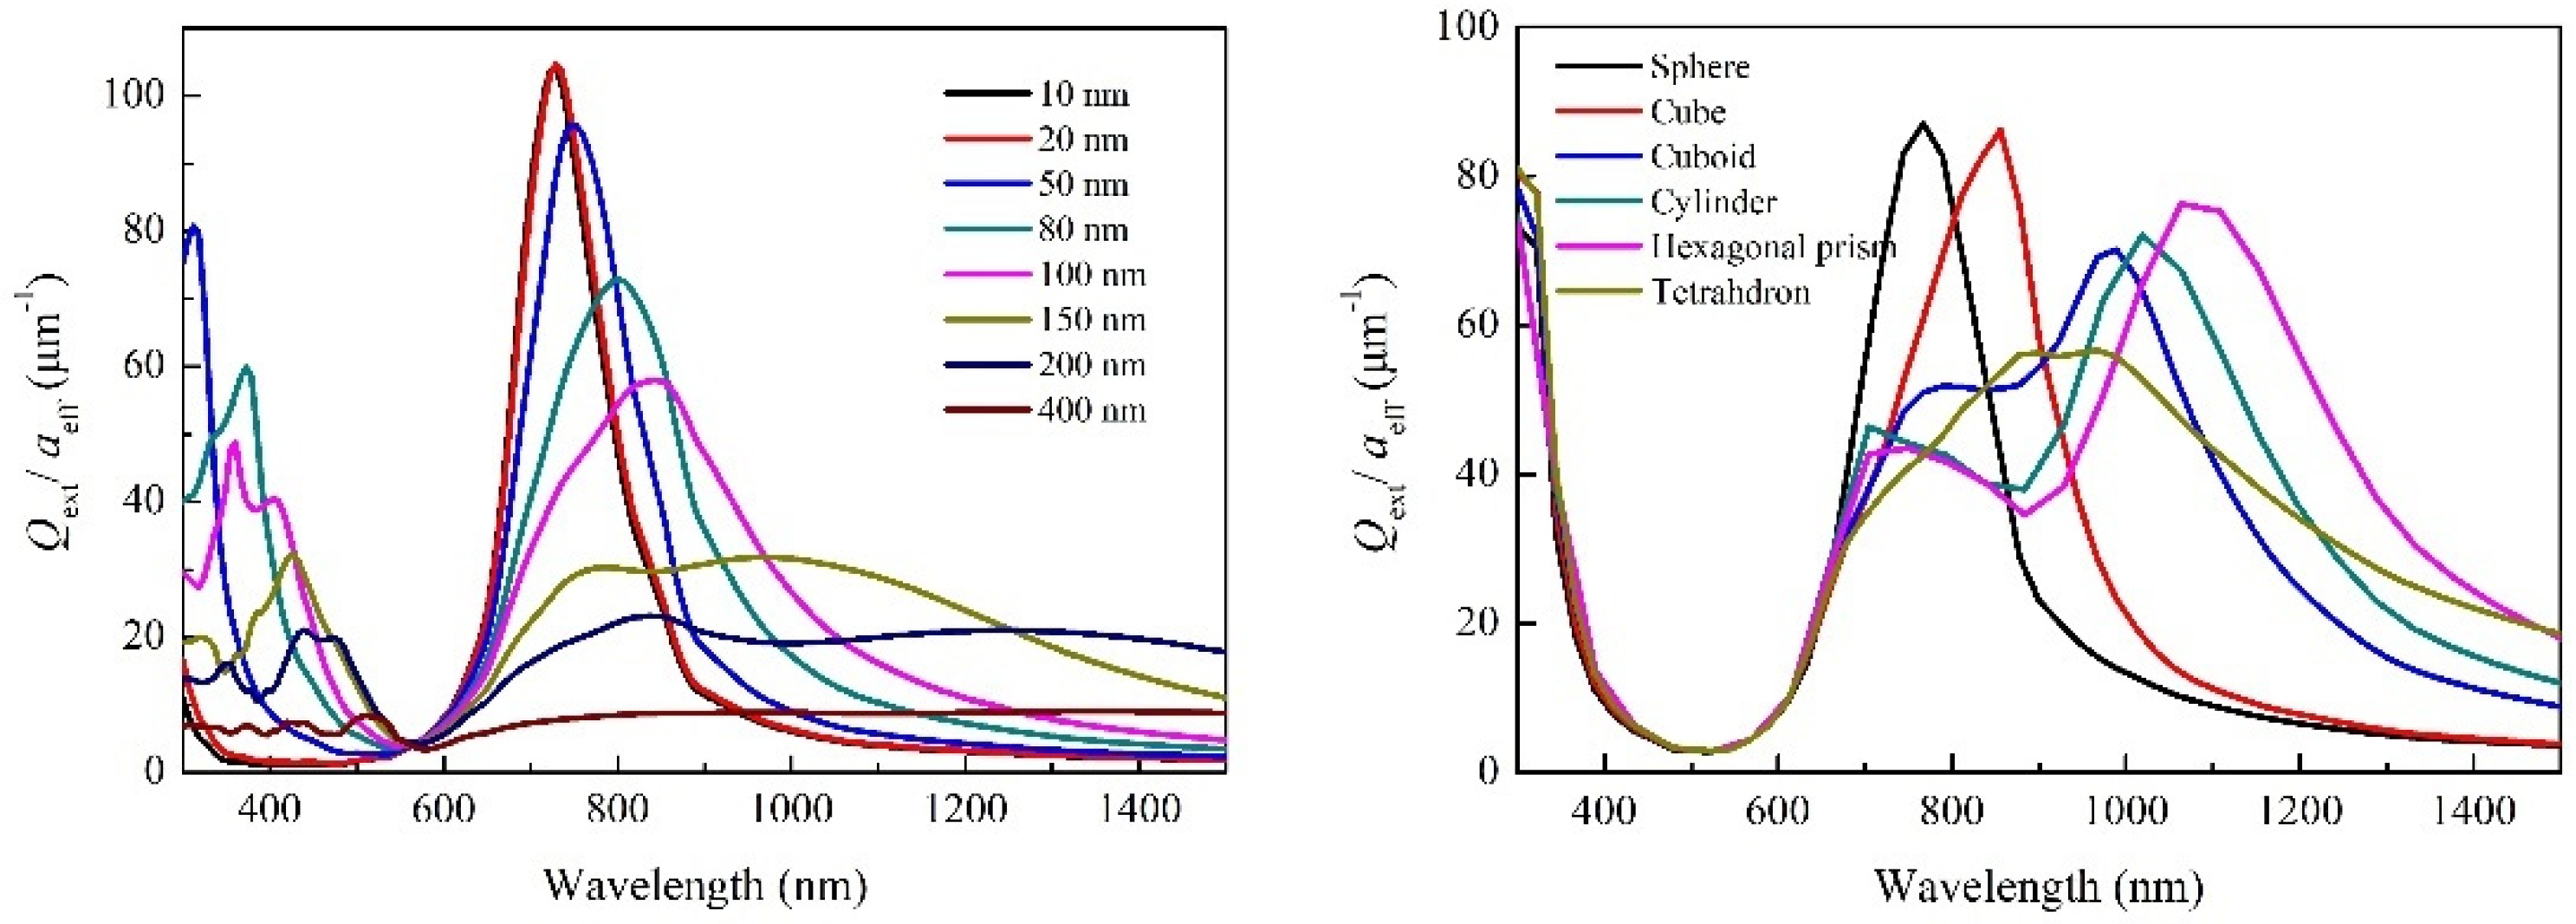
The calculated extinction curves of spherical-shaped Na
0.522WO
3 particles with different sizes and differently shaped Na
0.522WO
3 particles with size of 50 nm are given in
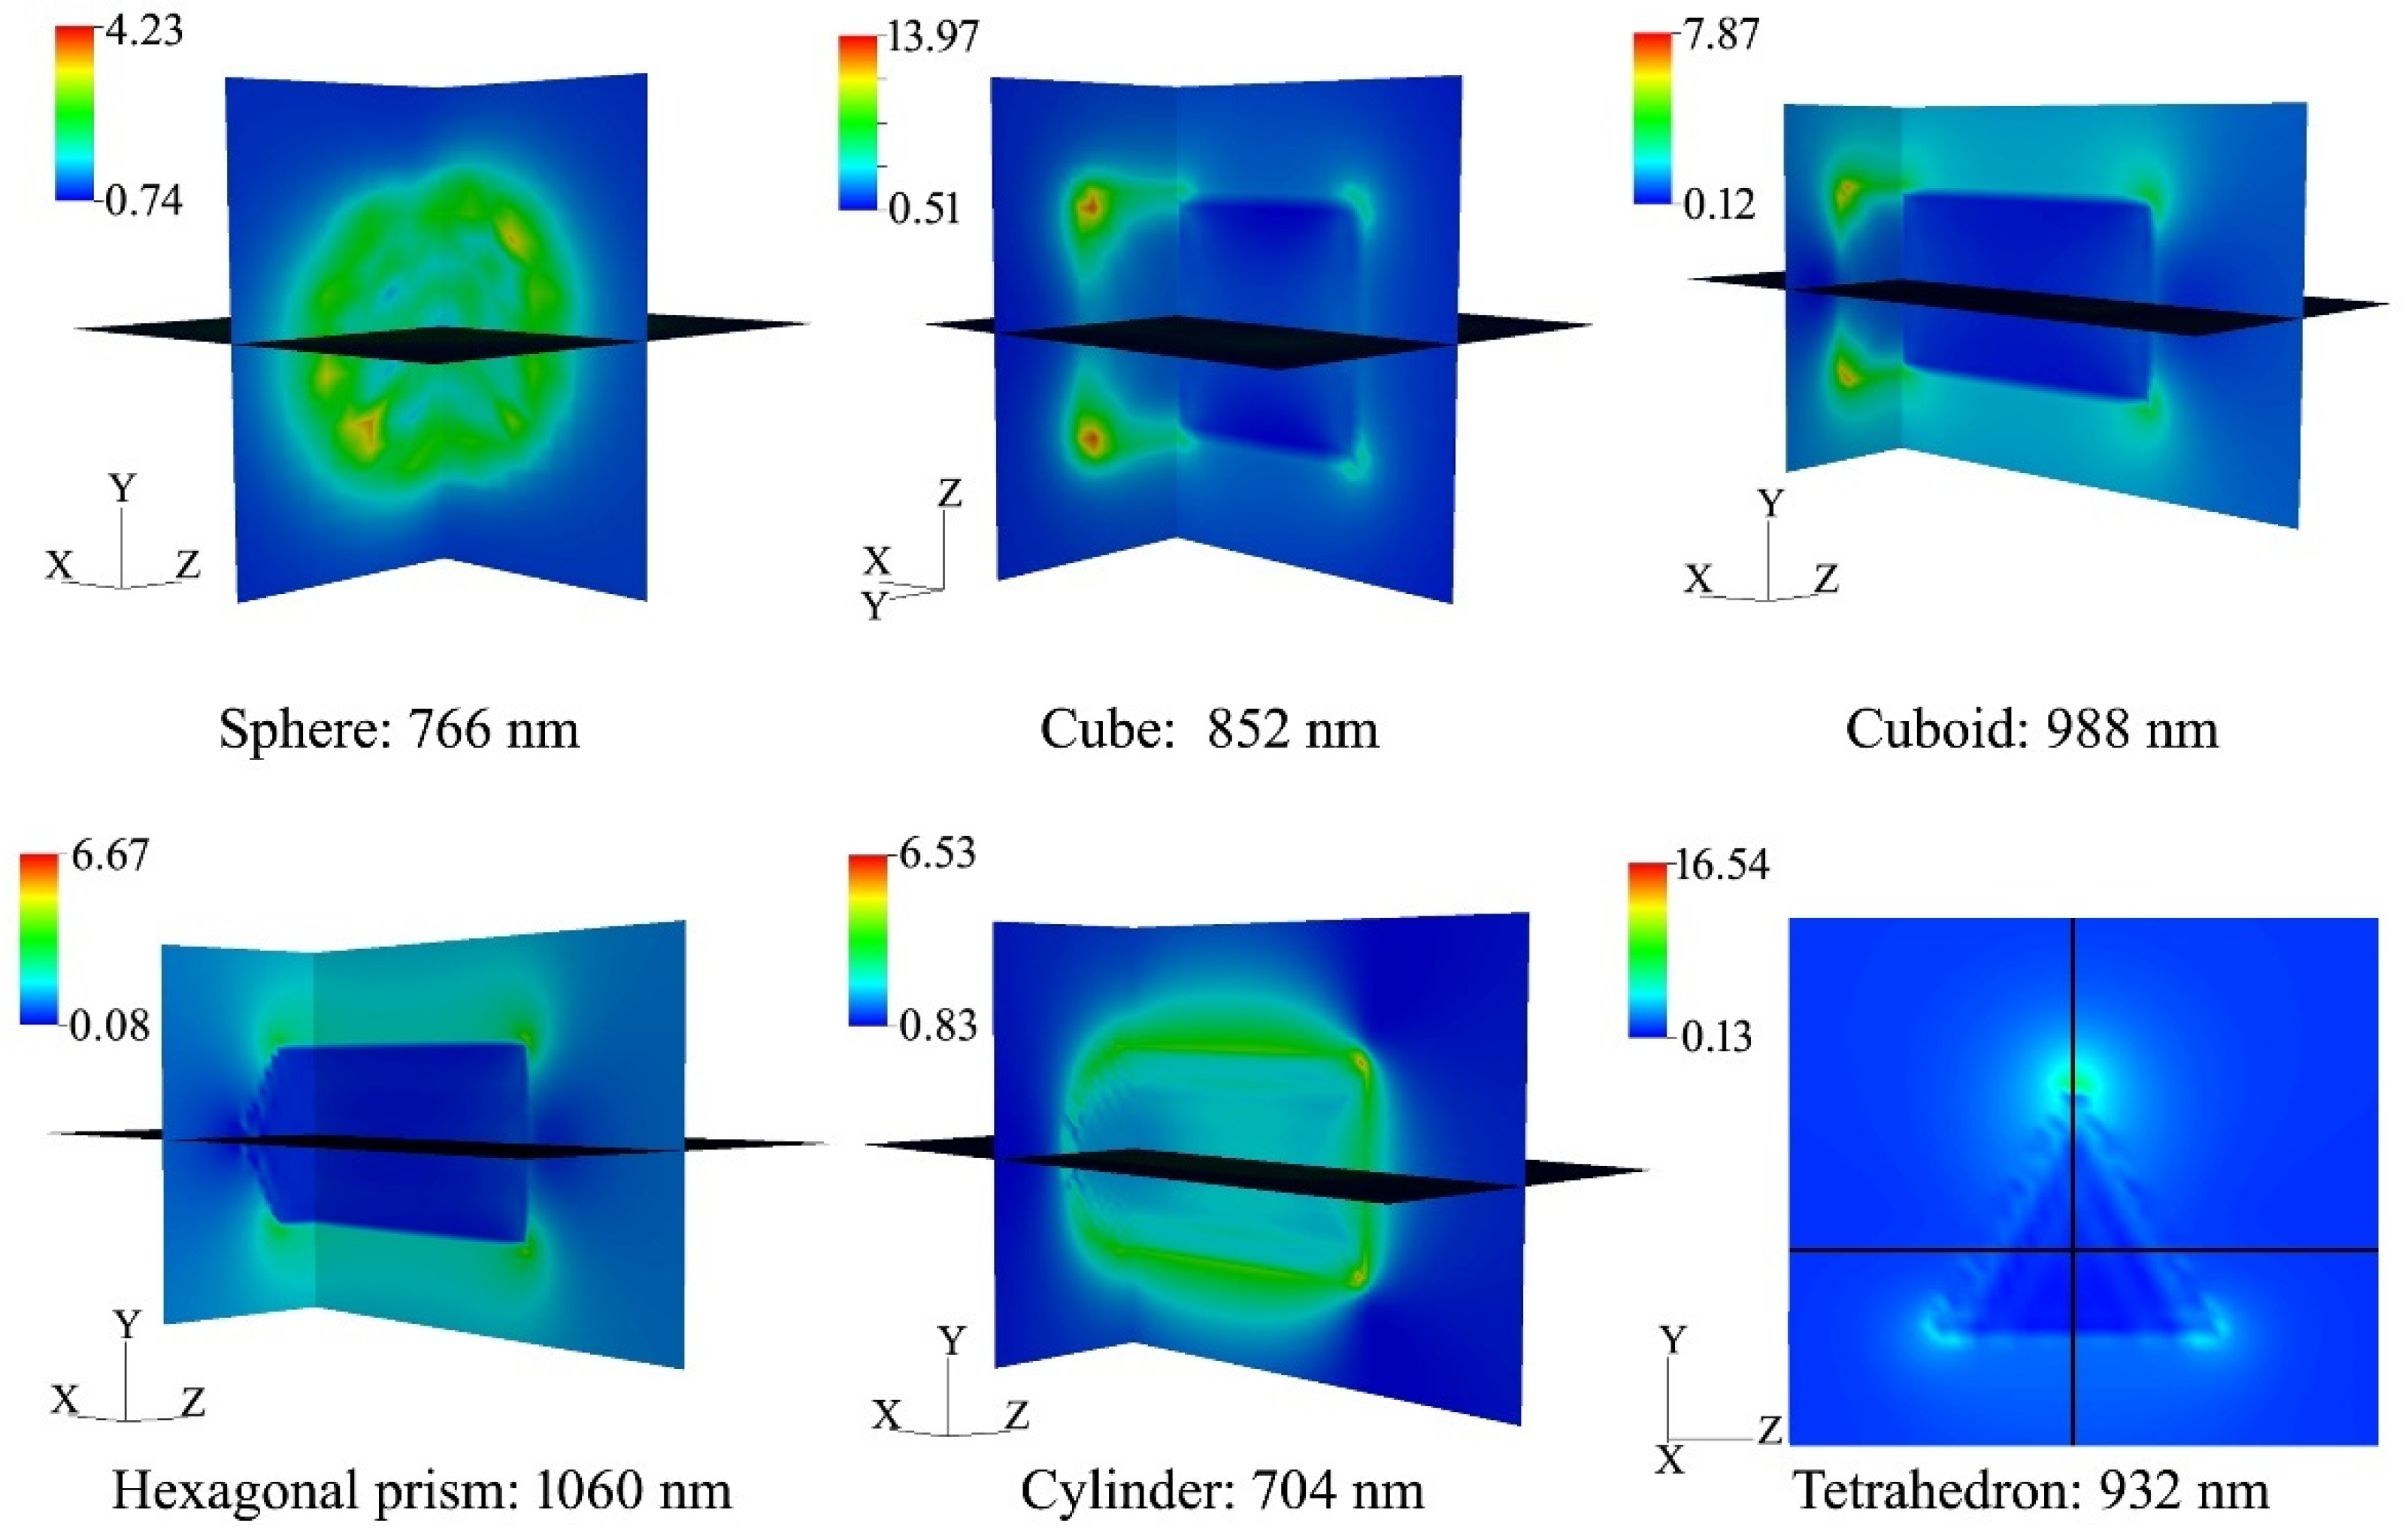
Figure 8. It can be found that there was significant difference between the extinction curves of different-sized particles. The extinction valley shifts toward short wavelength direction and broadens with the decreasing particle size. While the extinction peak broadens and shifts to long wavelength direction with the increasing particle size, the peak intensity weakens. For different shapes, there is little difference in the shape and position of the extinction valley, while the intensity, width and position of extinction peak are very different. Generally, a strong absorption or scattering effect occurs when the collective oscillation frequency of the conduction electrons is the same as that of the incident photons, which leads to an enhancement of the electromagnetic field in a very small area of the particle surface. On the other hand, the charge distribution produced by collective oscillation of particles with different shapes is also different; our calculated electric field distribution around the variously shaped Na
xWO
3 particles is shown in
Figure 9 (all simulations assume that the incident light propagates along the x-axis.). This suggests that the localized surface plasmon resonance (LSPR) is highly sensitive to different symmetries and angles. Therefore, the extinction behavior of particles with different shapes is quite different in the near infrared region. From the simulation results of particles with different sizes and shapes, it can be concluded that the wide range absorption in the NIR region in the experiment is a common effect of various sizes and shapes of Na
xWO
3 particles.


 ,
, 


