
Effects of Fe, Mn Individual Doping and (Fe, Mn) Co-Doping on Ferromagnetic Properties of Co2Si Powders


1
College of Big Data and Information Engineering, Guizhou University, Guiyang 550025, China
2
School of Physics and Electronic Science, Zunyi Normal College, Zunyi 563006, China
*
Author to whom correspondence should be addressed.
Nanomaterials 2022, 12(2), 293; https://0-doi-org.brum.beds.ac.uk/10.3390/nano12020293
Submission received: 25 November 2021
/
Revised: 10 January 2022
/
Accepted: 11 January 2022
/
Published: 17 January 2022
(This article belongs to the Special Issue Advances in Ferroelectric Nanoparticles)
Abstract
:Magnetic materials are crucial energy materials that are widely used in day-to-day life. Therefore, the development and study of high-performance magnetic materials are of great significance. In this study, the magnetic materials CoSi, CoXSi (X = Fe, Mn), and CoFeMnSi were prepared via the ball milling and sintering processes. Their crystal structures, electrical conductivity, and magnetic properties were investigated via the X-ray diffraction analysis and by using a resistivity tester, vibrating sample magnetometer, and vector network analyser. The X-ray diffraction analysis revealed that a single phase of CoSi and its doped alloy powders were successfully obtained. The electrical conductivities of MnCoSi and FeMnCoSi were measured using a resistivity tester. The results indicate that Mn doping and Fe and Mn Co-doping enhanced the electrical conductivity of CoSi. The magnetic properties of CoSi were determined using a vibrating sample magnetometer. We observed that the magnetic properties were enhanced after doping. CoFeMnSi exhibited excellent magnetic properties. Further, its permeability was determined using a vector network analyser. At a low frequency, the u’ and u” values of CoFeSi and CoFeMnSi were enhanced; whereas, at a high frequency, after doping, the u’ and u” values changed only slightly. This study can be used as a basis for future studies on magnetic functional materials.
1. Introduction
Magnetic materials are widely used in various fields of renewable energy, energy conservation and environmental protection, such as solar and wind power generation, new energy vehicles, rail transit, energy saving lighting, and new planar displays [1,2,3]. Presently, the intermetallic compound Co-Si is an important alloy widely used in the fields of electronics, power, and machinery [4,5]. It has good oxidation and corrosion resistances, stable physical and chemical properties, high temperature resistance, high strength, a large elastic modulus, and high structural stability [6]. It has the potential to be used as a high-temperature structural material.
Chuan et al. [7] prepared CoSi by mechanical alloying and performed thermodynamic analysis. They observed that metallic compounds were initially formed. PanzhiJun et al. [8] studied the thermoelectric properties of CoSi. Joa et al. investigated the magnetic properties of Co–Si alloy clusters. The electronic structure and magnetic properties of the Co–Si alloy clusters were investigated using ab initio spin-polarised density functional calculations. The magnetic moment primarily depended on the Co–Si bond lengths rather than the Co–Co bond lengths [9].
Velez and Valvidares conducted a study on the structural and magnetic properties of amorphous Co–Si alloy films. The results showed that the heterogeneity of the high Co content led to an essentially isotropic magnetic behaviour and the formation of highly coercive fields [10].
Geller synthesized single-phase CoSi by mechanical ball milling and heat treatment and determined its crystal structure and magnetic properties [11]. China-hong investigated the following three intermediate phases: CoSi, CoSi, and CoSi. The results showed that CoSi, CoSi, and CoSi were found in these couples when the bulks were annealed at temperatures of 800, 900, 1000, and 1050 °C [12]. Cristina Bormio-Nunes studied the magnetisation of the Co–Si-B system. The results of the study showed that CoSi is paramagnetic [13].
Tu et al. investigated the thermal stability and growth kinetics of CoSi and CoSi in thin-film reactions. The results showed that a sequential growth of CoSi and CoSi was observed in the reaction between the Si and Co films. First, CoSi was formed, and, subsequently, CoSi was formed when all of the Co was consumed [14]. Baldan et al. investigated the microstructural evidence of CoSi-phase stability in the Co–Si System. The stability of the CoSi phase in the Co–Si system was verified [15].
Vander Walls-Zeeman studied the atomically disordered nanocrystalline compound CoSi prepared via high-energy ball milling. The results indicated anti-site disorder. Moreover, the continuous increase in the rate of magnetisation confirmed the generation of the anti-site disorder in CoSi [16].
However, studies on enhancing the magnetic properties of CoSi by doping have not been reported thus far. In this study, CoSi was prepared by ball milling with Fe and Mn as dopants and, Fe and Mn as co-dopants. The improvements in its magnetic properties were investigated.
2. Experimental Details
CoSi, CoXSi (X = Fe, Mn), and CoFeMnSi were prepared using Co, Si, Fe, and Mn powders with purity of 99.9% according to their molar fractions [17]. This method can only be used for inactive metals at room temperature to prevent severe oxidation in a short time. The powders after accurate weighing were placed in a stainless steel tank for ball milling. An OECO-PBM-AD-6L omni-directional ball mill manufactured by Hunan Deke was used to mill the powder. The samples were added with a ball-to-powder weight ratio of 40:1, and milling was performed for a duration of 72 h.
The rotational speed of the ball milling machine was maintained at 360 rpm. To prevent oxidation during ball milling, the stainless-steel tank was evacuated insert and pressed into a pellet [18]. Furthermore, close attention had to be paid to the sealing of the steel tank to prevent air leakage. The alloy powder obtained by ball milling was annealed at 950 °C for 2 h in a GSL-1500X tube furnace (Hefei Kejing Material Technology Co, Ltd. He Fei, Anhui, China), which incorporates a double layer air cooling structure to sinter samples.
The maximum sintering temperature of GSL-1500X tube furnace was 1500 °C. The structure of the sintered samples was characterised by X-ray diffraction (XRD, BRUKER D8 ADVANCE (Zhongguancun, Beijing, China), which is produced by the technology company BRUKER [19] to detect the phase of the material. To ensure the accuracy of the diffraction data, first, the sample was ground into a powder suitable for the diffraction experiment; subsequently, sample powder was transformed into a flat test piece.
The hysteresis loop of each samples was measured using a vibrating sample magnetometer (VSM, Lakeshore7404, Baoshan District, Shanghai, China) [20]. When the hysteresis loop of a nanomagnetic material was being tested, as the material had a considerably small particle size and rich surface, the magnetisation of the surface magnetic moment of the magnetic particle was difficult to measure due to its high energy. This led to the hysteresis loop not being sufficiently stable in a high magnetic field.
Generally, the magnetisation corresponding to the maximum magnetic field is considered the saturation magnetisation of such materials. The permeability was determined using the vector network analyser (Agilent, Chaoyang District, Beijing, China) [21]. The coaxial method is the most suitable for powders and the waveguide method is primarily suitable for resins. In the course of measurement, a coaxial ring was made of powder and paraffin. The concentration ratio of sample to paraffin was 40:60. The conductivity of the samples was measured using a high-precision resistivity tester (YAOS, Guangzhou, GuangDong, China) [22].
The powder micrograph images were tested by transmission electron microscopy (TEM; Tecnai G2 F20, Fei Company, Hillsboro, OR, USA) [23]. The TEM test showed the micrograph images and grain size on the nanoscale. The sample comprised organic or magnetic matter; therefore, the turbulence under high pressure was more severe. Consequently, it was difficult to capture a good effect, leading to errors.
3. Results and Discussion
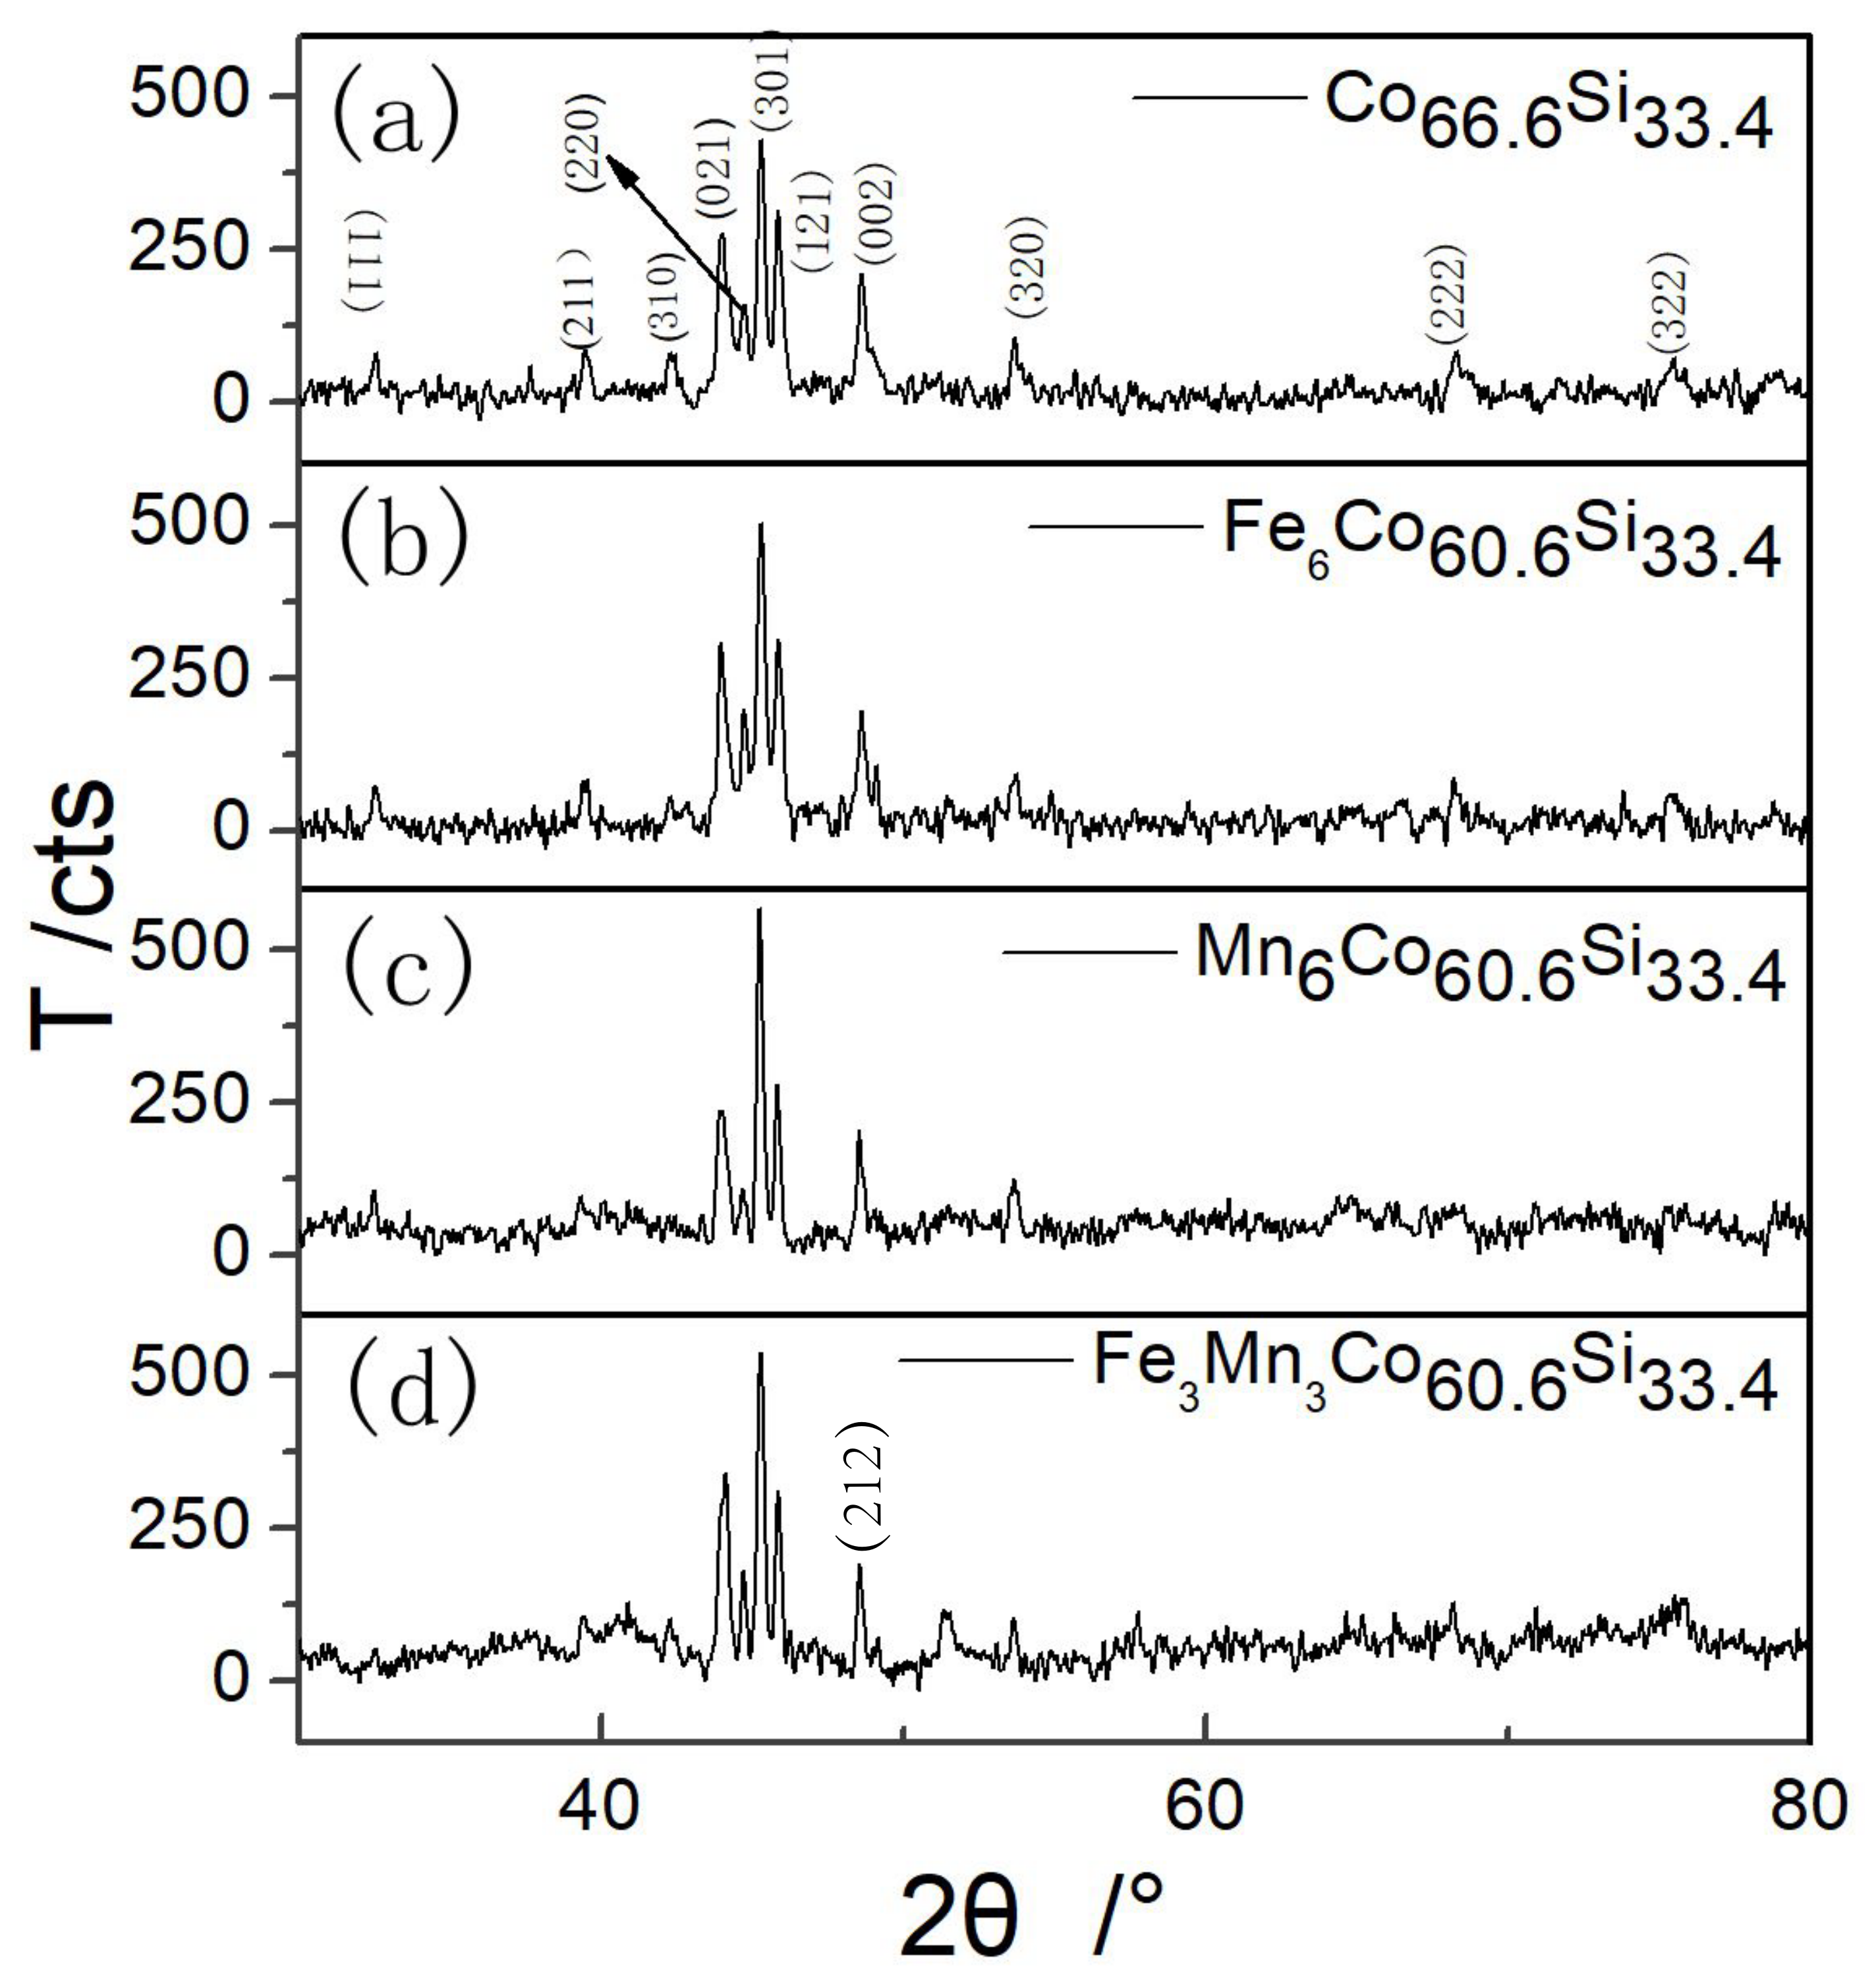
Figure 1 shows the XRD pattern of mechanically alloyed powder after sintering at 950 °C. All the highly intense peaks match those of the diffraction pattern of CoSi with the crystal system of orthorhombic (pdfcard98-005-2281).
As shown in Figure 1, highly intense diffraction peaks were observed corresponding to (021), (301) and (121) planes. From the XRD pattern of CoSi shown in Figure 1a, no diffraction peaks of Co and Si appeared after sintering the samples at 950 °C, indicating that the synthesized powder comprised a single CoSi phase after mechanical alloying and heat treatment. Figure 1b–d shows the XRD patterns of XCoSi, (X = Fe, Mn), and FeMnCoSi, respectively. The phase of CoSi was observed by XRD. The Fe–Mn phase was not observed in the doped samples, as shown in Figure 1b–d, indicating that doping did not form other phases except the phase of CoSi. The diffraction peaks of (111), (211), and (310) at 32.593°, 39.459°, and 42.303°, respectively, observed for CoSi, were not present for CoFeMnSi.
In contrast, the diffraction peaks of (212) and (122) appeared at 51.327° and 58.850° for CoFeMnSi. These observations indicated that the doping of Mn and Fe-Mn slightly changed the preferred orientation. Table 1 shows different values of 2°, the error between the measured and standard diffraction angle (B), the crystallographic inter-planar spacing (d), and the lattice constants of the corresponding crystal plane (a, b, and c). B and d were obtained by the XRD analysis.
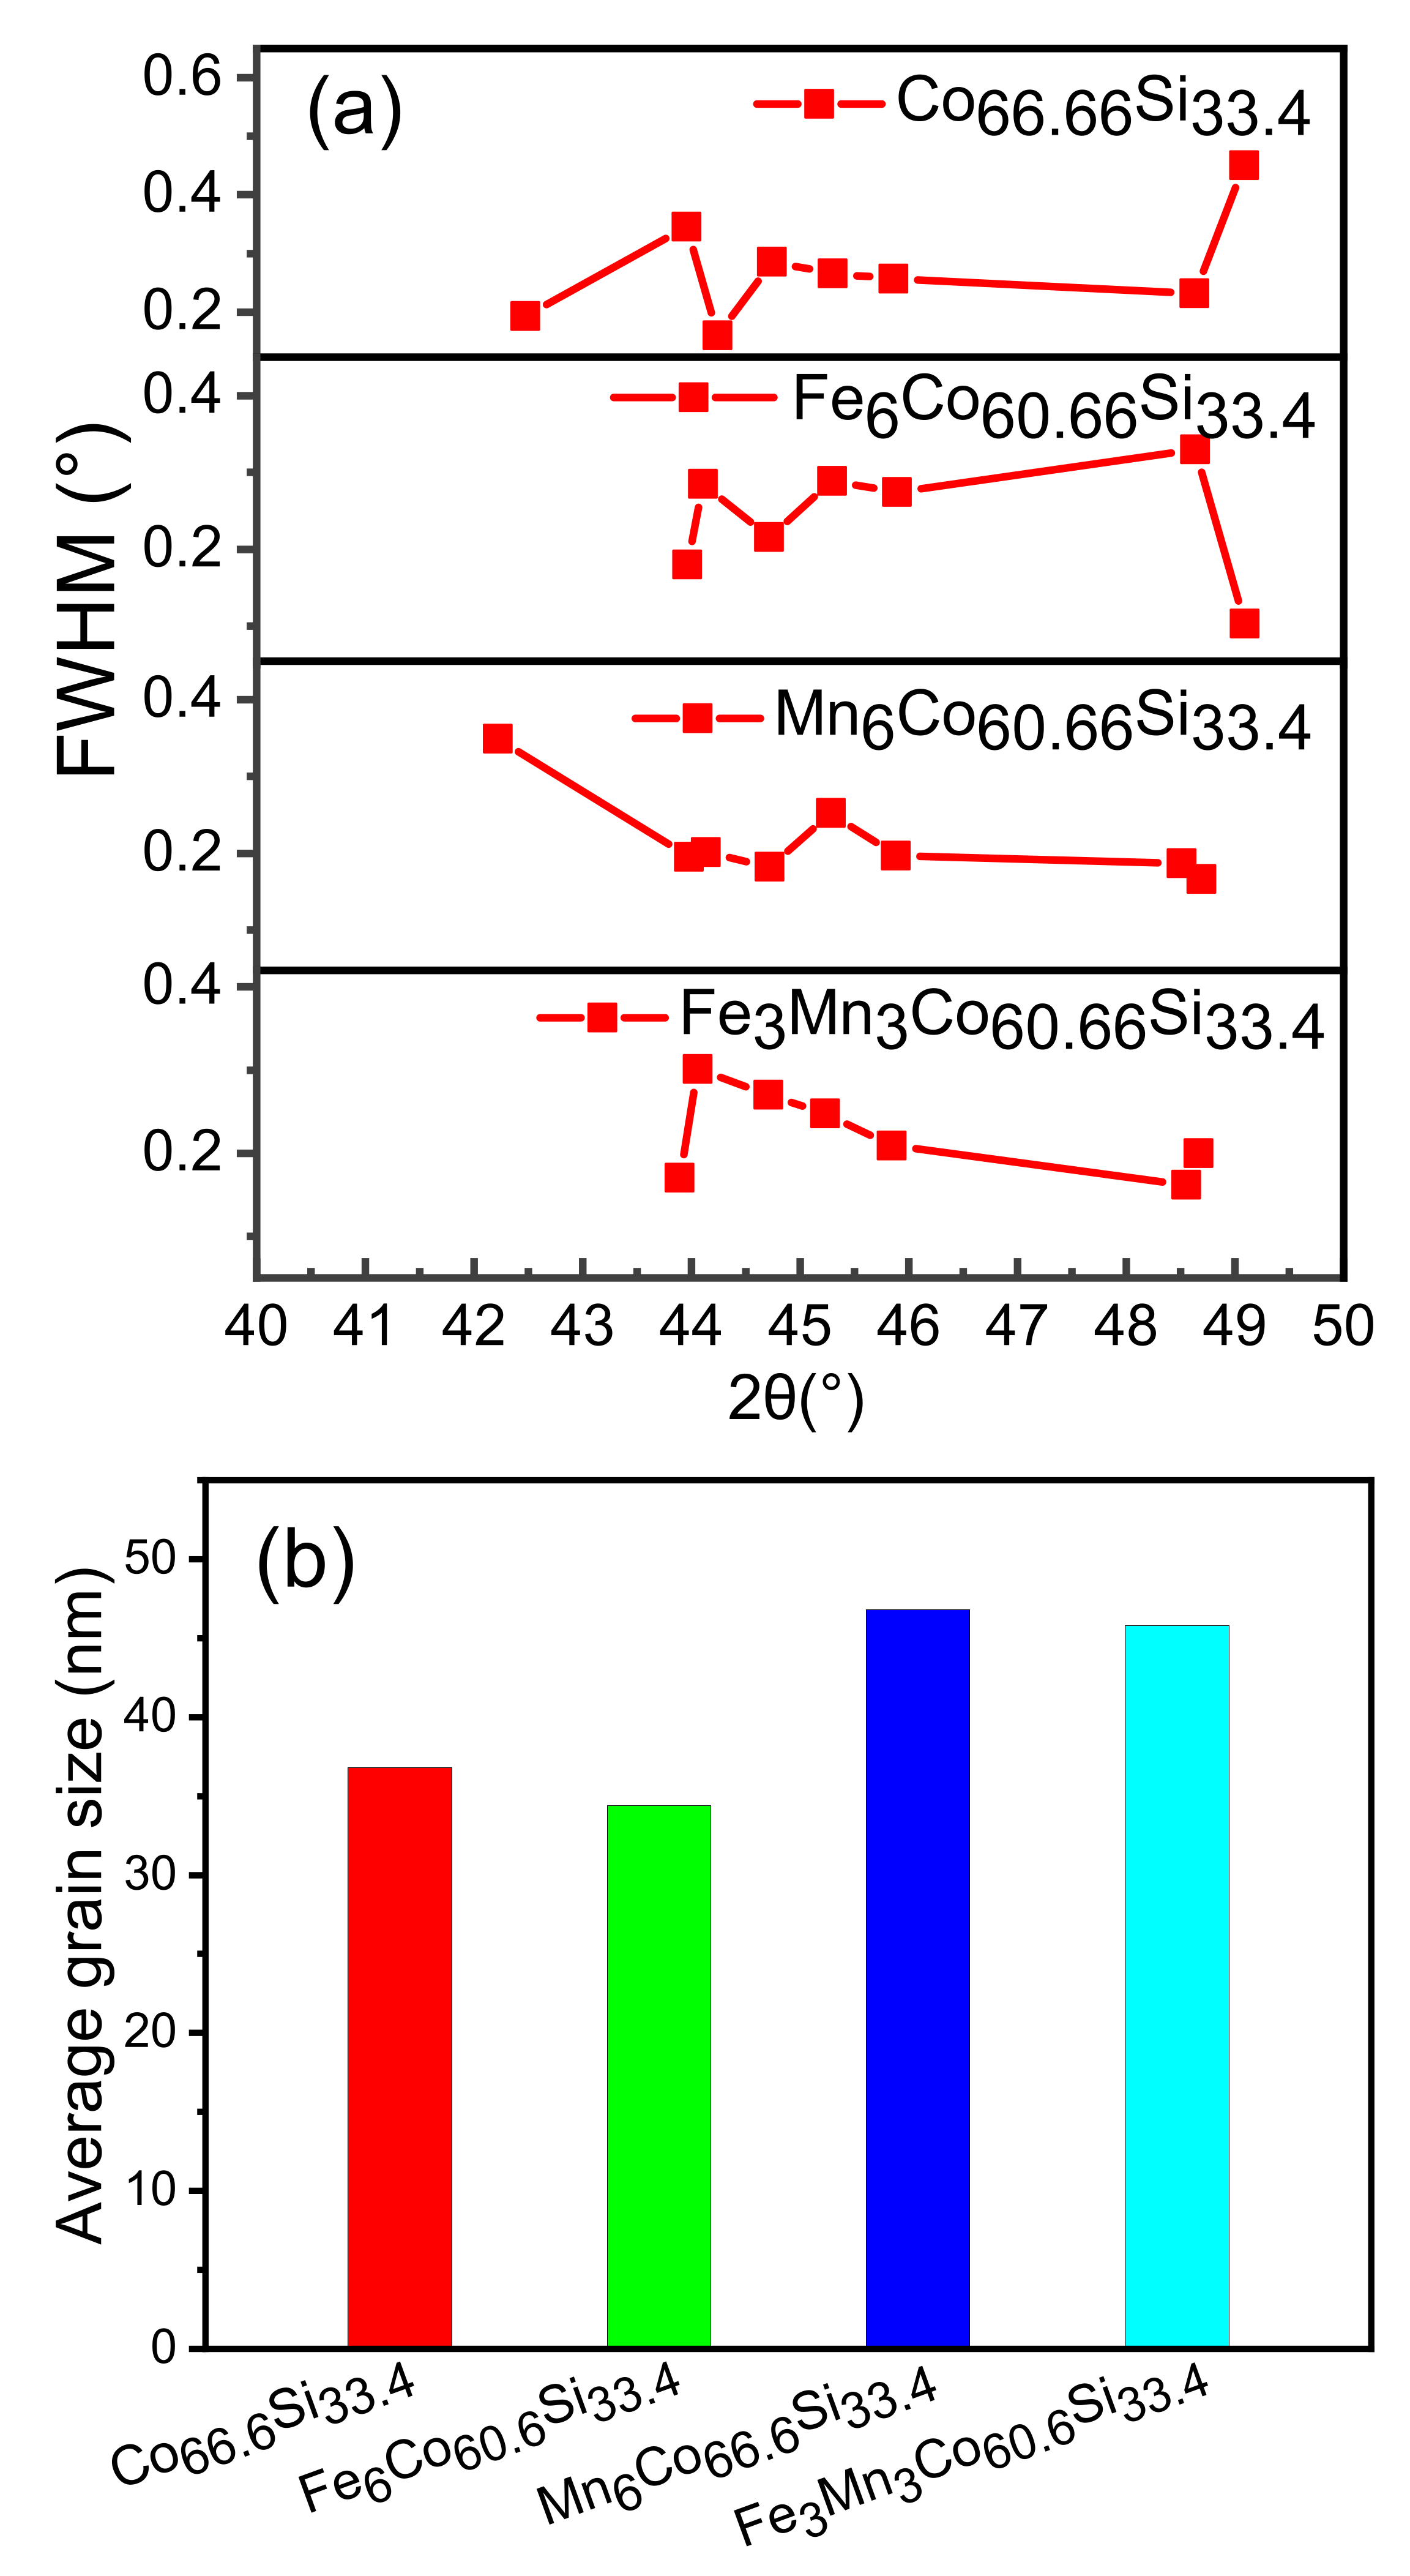
By importing the detected data of the XRD, the lattice parameters of the crystal planes were calculated using JADE6.5 [24], which is an XRD analysis software. This software performs various functions, including XRD analysis of a given material, and analysis of its lattice parameters, FWHM (the half-width height of diffraction peak), and grain size. The diffraction peaks within the 2 range from 41° to 51° were fitted using the Pearson-VII function [25]. The crystal sizes were obtained using the Scherrer formula and the Williamson–Hall method [26]. The calculation is as follows:
where D is the grain size in nanometres, is the total broadening, is the wavelength of the radiation, k is a constant equal to 0.94, is the strain, is the peak width at half-maximum intensity, and is the peak position.
Figure 2a shows that the FWHM of the diffraction peaks for each sample were obtained within 41–51° using JADE6.5. Figure 2b shows the average grain size calculated using the Williamson–Hall method. Samples of about 1 g were applied to the glass for XRD and smoothed. The data of the samples obtained were imported into JADE. Then the diffraction peaks, (021), (220), (301), (121), and (002), were selected to calculate its grain size due to the major contribution of grain size. The calculated average grain size was 36.8 nm for CoSi, and the grain size changed after doping. This indicates that doping had an influence on the growth of the grain.
According to Table 2, the measured average grain sizes were 23, 21, 38, and 32 nm, for CoSi, CoXSi (X = Fe, Mn), and CoFeMnSi, respectively. When the XRD was performed, the amount of powder was relatively large, about 1 g. In the XRD analysis. When TEM is made, only a small particle is taken about a few milligrams. Therefore, there was a certain error between the measured and estimated values.
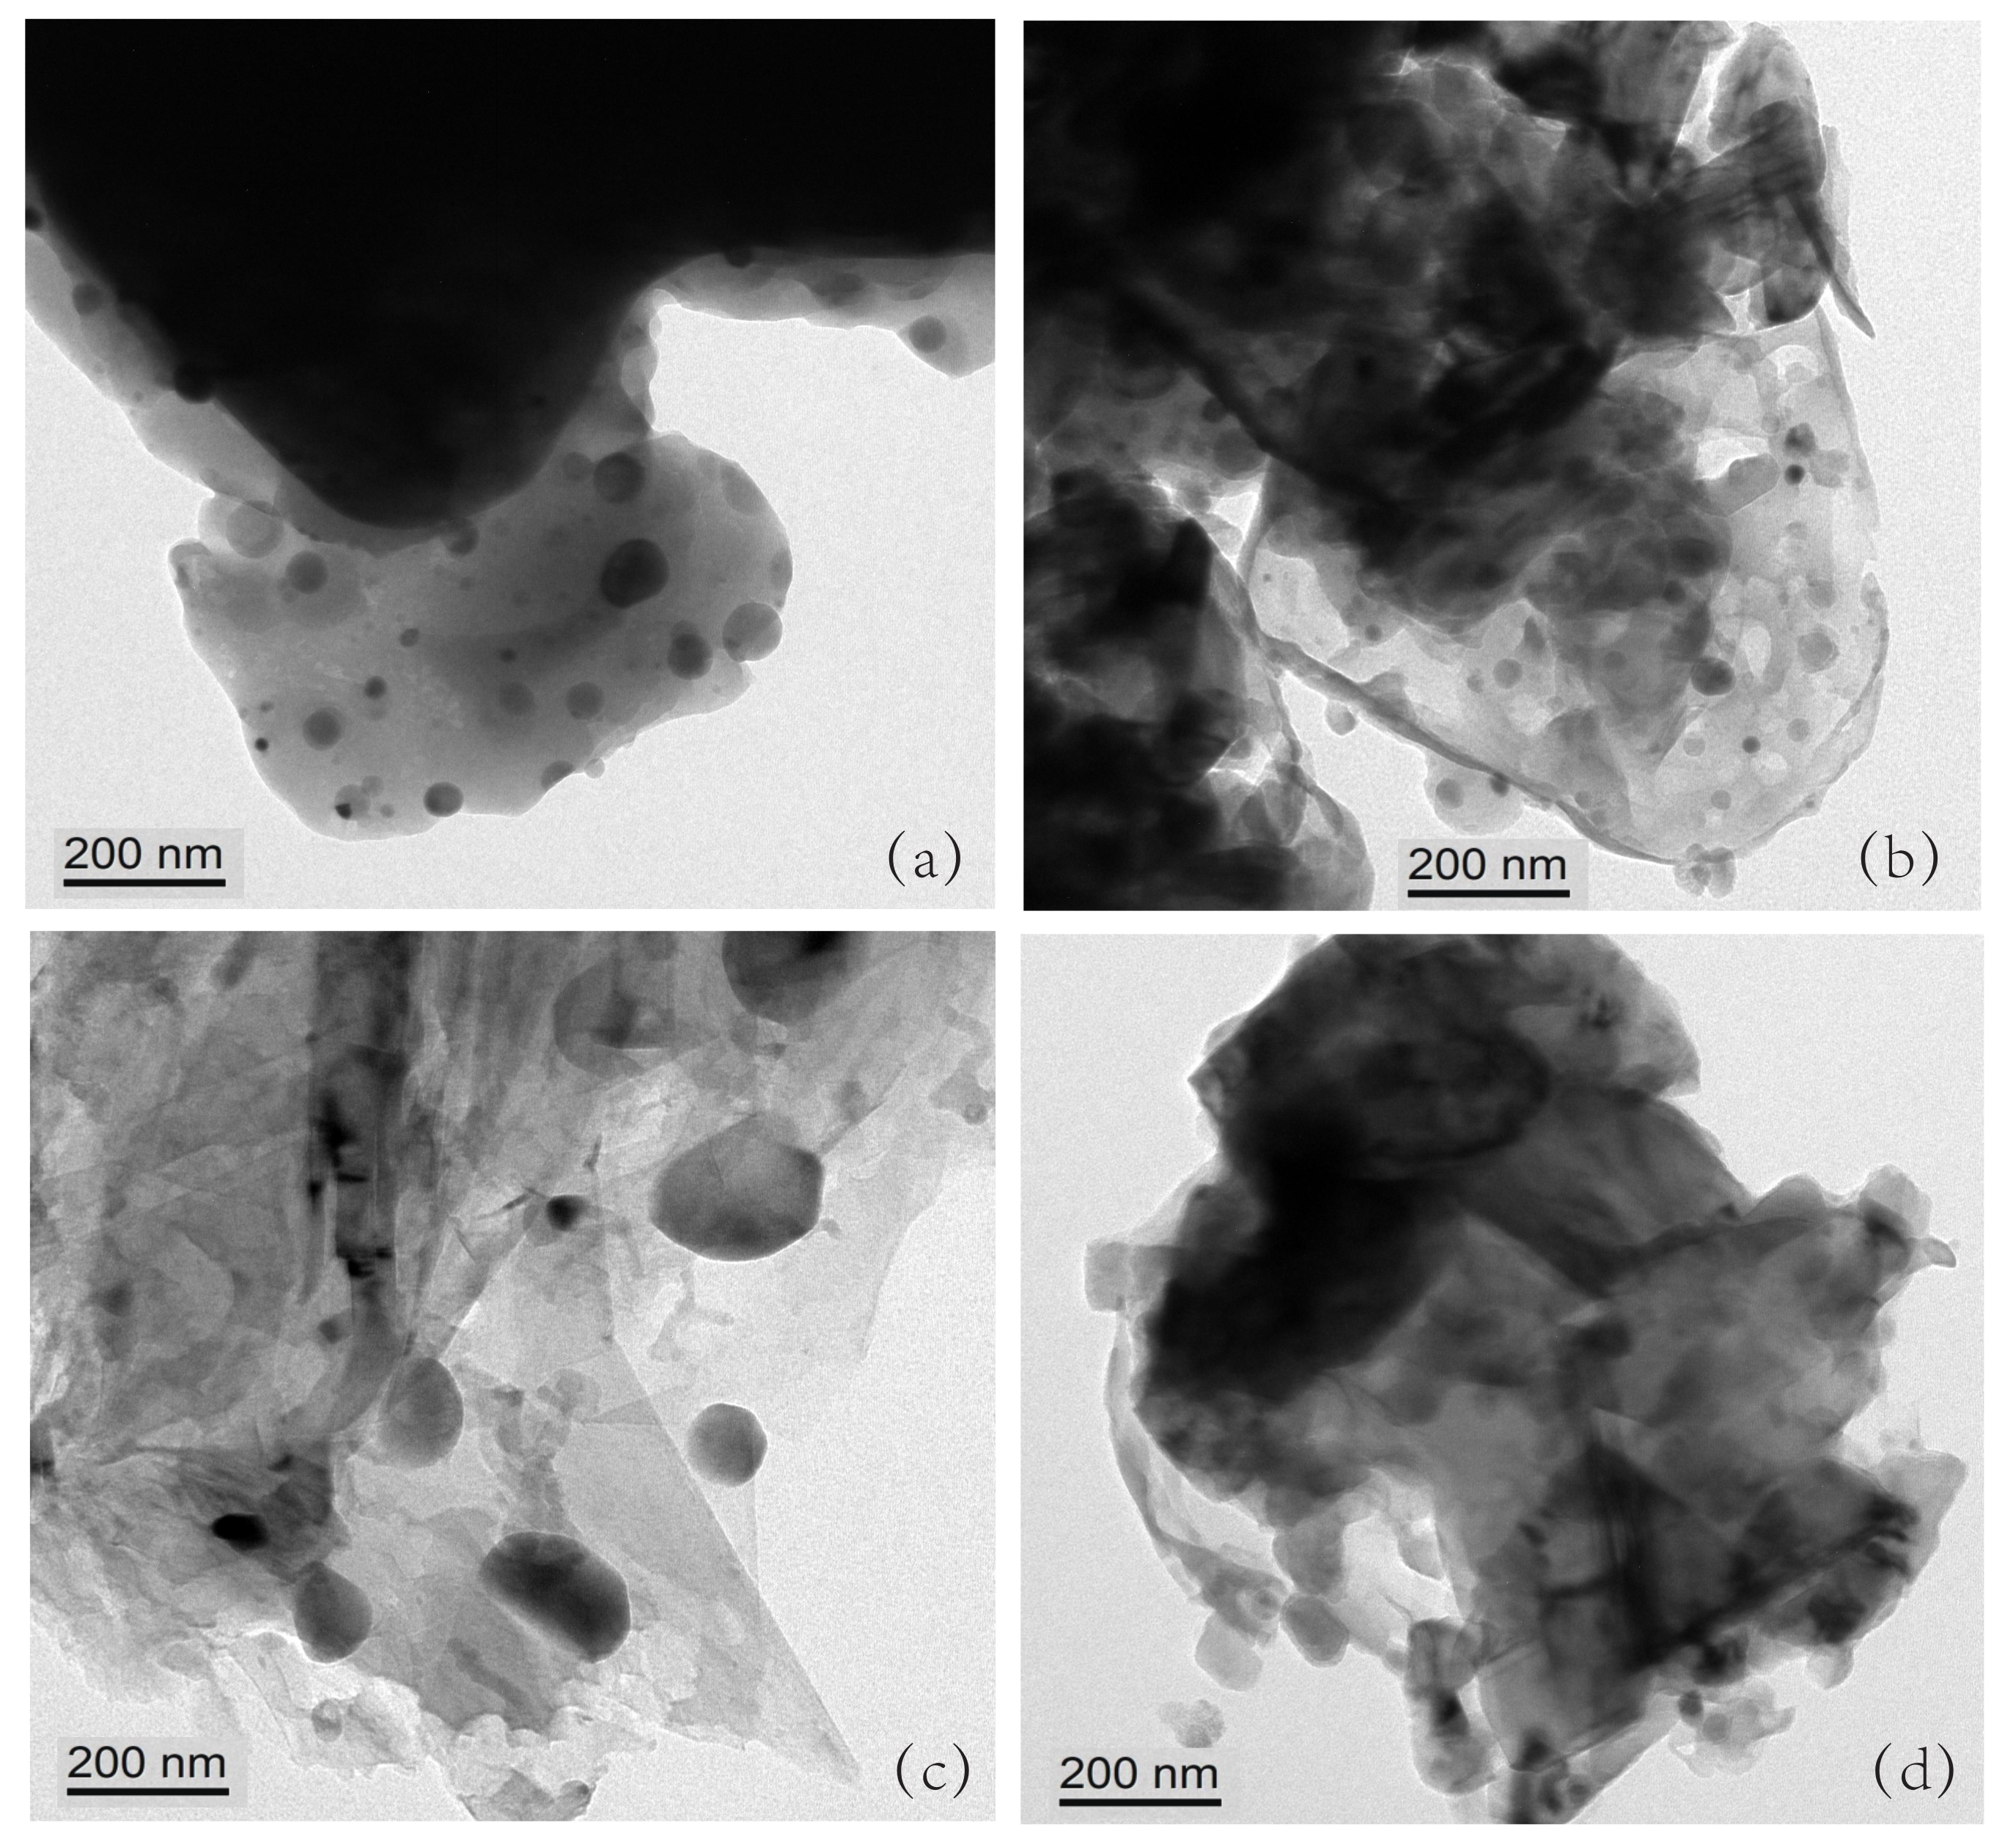
A magnetic material affects the accuracy of the testing equipment, which is one of the reasons for the error. Figure 3a–d shows the powder micrograph images of CoSi, CoXSi (X = Fe, Mn), and CoFeMnSi. The scale bar in Figure 3a–d equals 200 nm. The radii of Fe and Mn atoms are not greatly different from that of Co atoms. Hence, Fe and Mn atoms can enter the CoSi lattice and replace the Co atoms. In the periodic table, Fe and Co are adjacent to each other.
Therefore, when Fe atoms replace the Co atoms, they have little effect on the lattice growth compared to Mn atom doping. As the radii of Fe atoms and Co atoms are not very different, the diffusion is slow during the heating process, thereby, hindering the growth of the grain. The radius of Mn is smaller than that of Fe; therefore, it is easier to enter the CoSi lattice. Therefore, Mn doping and Fe–Mn doping promote growth of the grain.
Table 3 shows the conductivities of the as-prepared CoSi, CoXSi (X = Fe, Mn), and CoFeMnSi. To study the effect of doping on the conductivities of the as-prepared CoSi and doped CoSi, the resistivities of the samples were measured using a high-precision resistivity tester. Ench sample was placed inside the sample pool, and a certain pressure was applied to the sample. The current and voltage parameters were set, and the high-precision resistivity tester was used to record the data. Under different pressures, the resistivities recorded were different; thus, we selected three different pressures. A resistance meter was used to measure their resistivities under the pressures of 1, 2, and 3 MPa.
The conductivity was calculated by taking the reciprocals of resistivities. As shown in Table 3, we chose 3 MPa as an example because the compounds followed the same rules under this pressure. Under 3 MPa, the conductivity of CoSi was 183 S/m, which is very low. The conductivity of FeCoSi was 190 S/m, which indicates that the effect of Fe doping on its conductivity is insignificant.
The conductivities of MnCoSi and FeMnCoSi were 111,000 and 32,000 S/m, indicating that Mn doping and Fe, Mn co-doping enhance the conductivity of CoSi. Conductivity is mainly determined by electron mobility. After sintering to form CoSi, the Co–Si bonding with electrons becomes relatively strong, resulting in a low conductivity.
After doping, the outermost layer of the 4d orbital of the Fe atom contains six electrons, whereas that of the 4d orbital of the Mn atom contains five electrons. Further, it is easier to lose a single electron from the outermost layer of the 4d orbital than to lose two electrons. Therefore, the influence of Mn doping on improving the conductivity is significant, while that of Fe doping is relatively small.
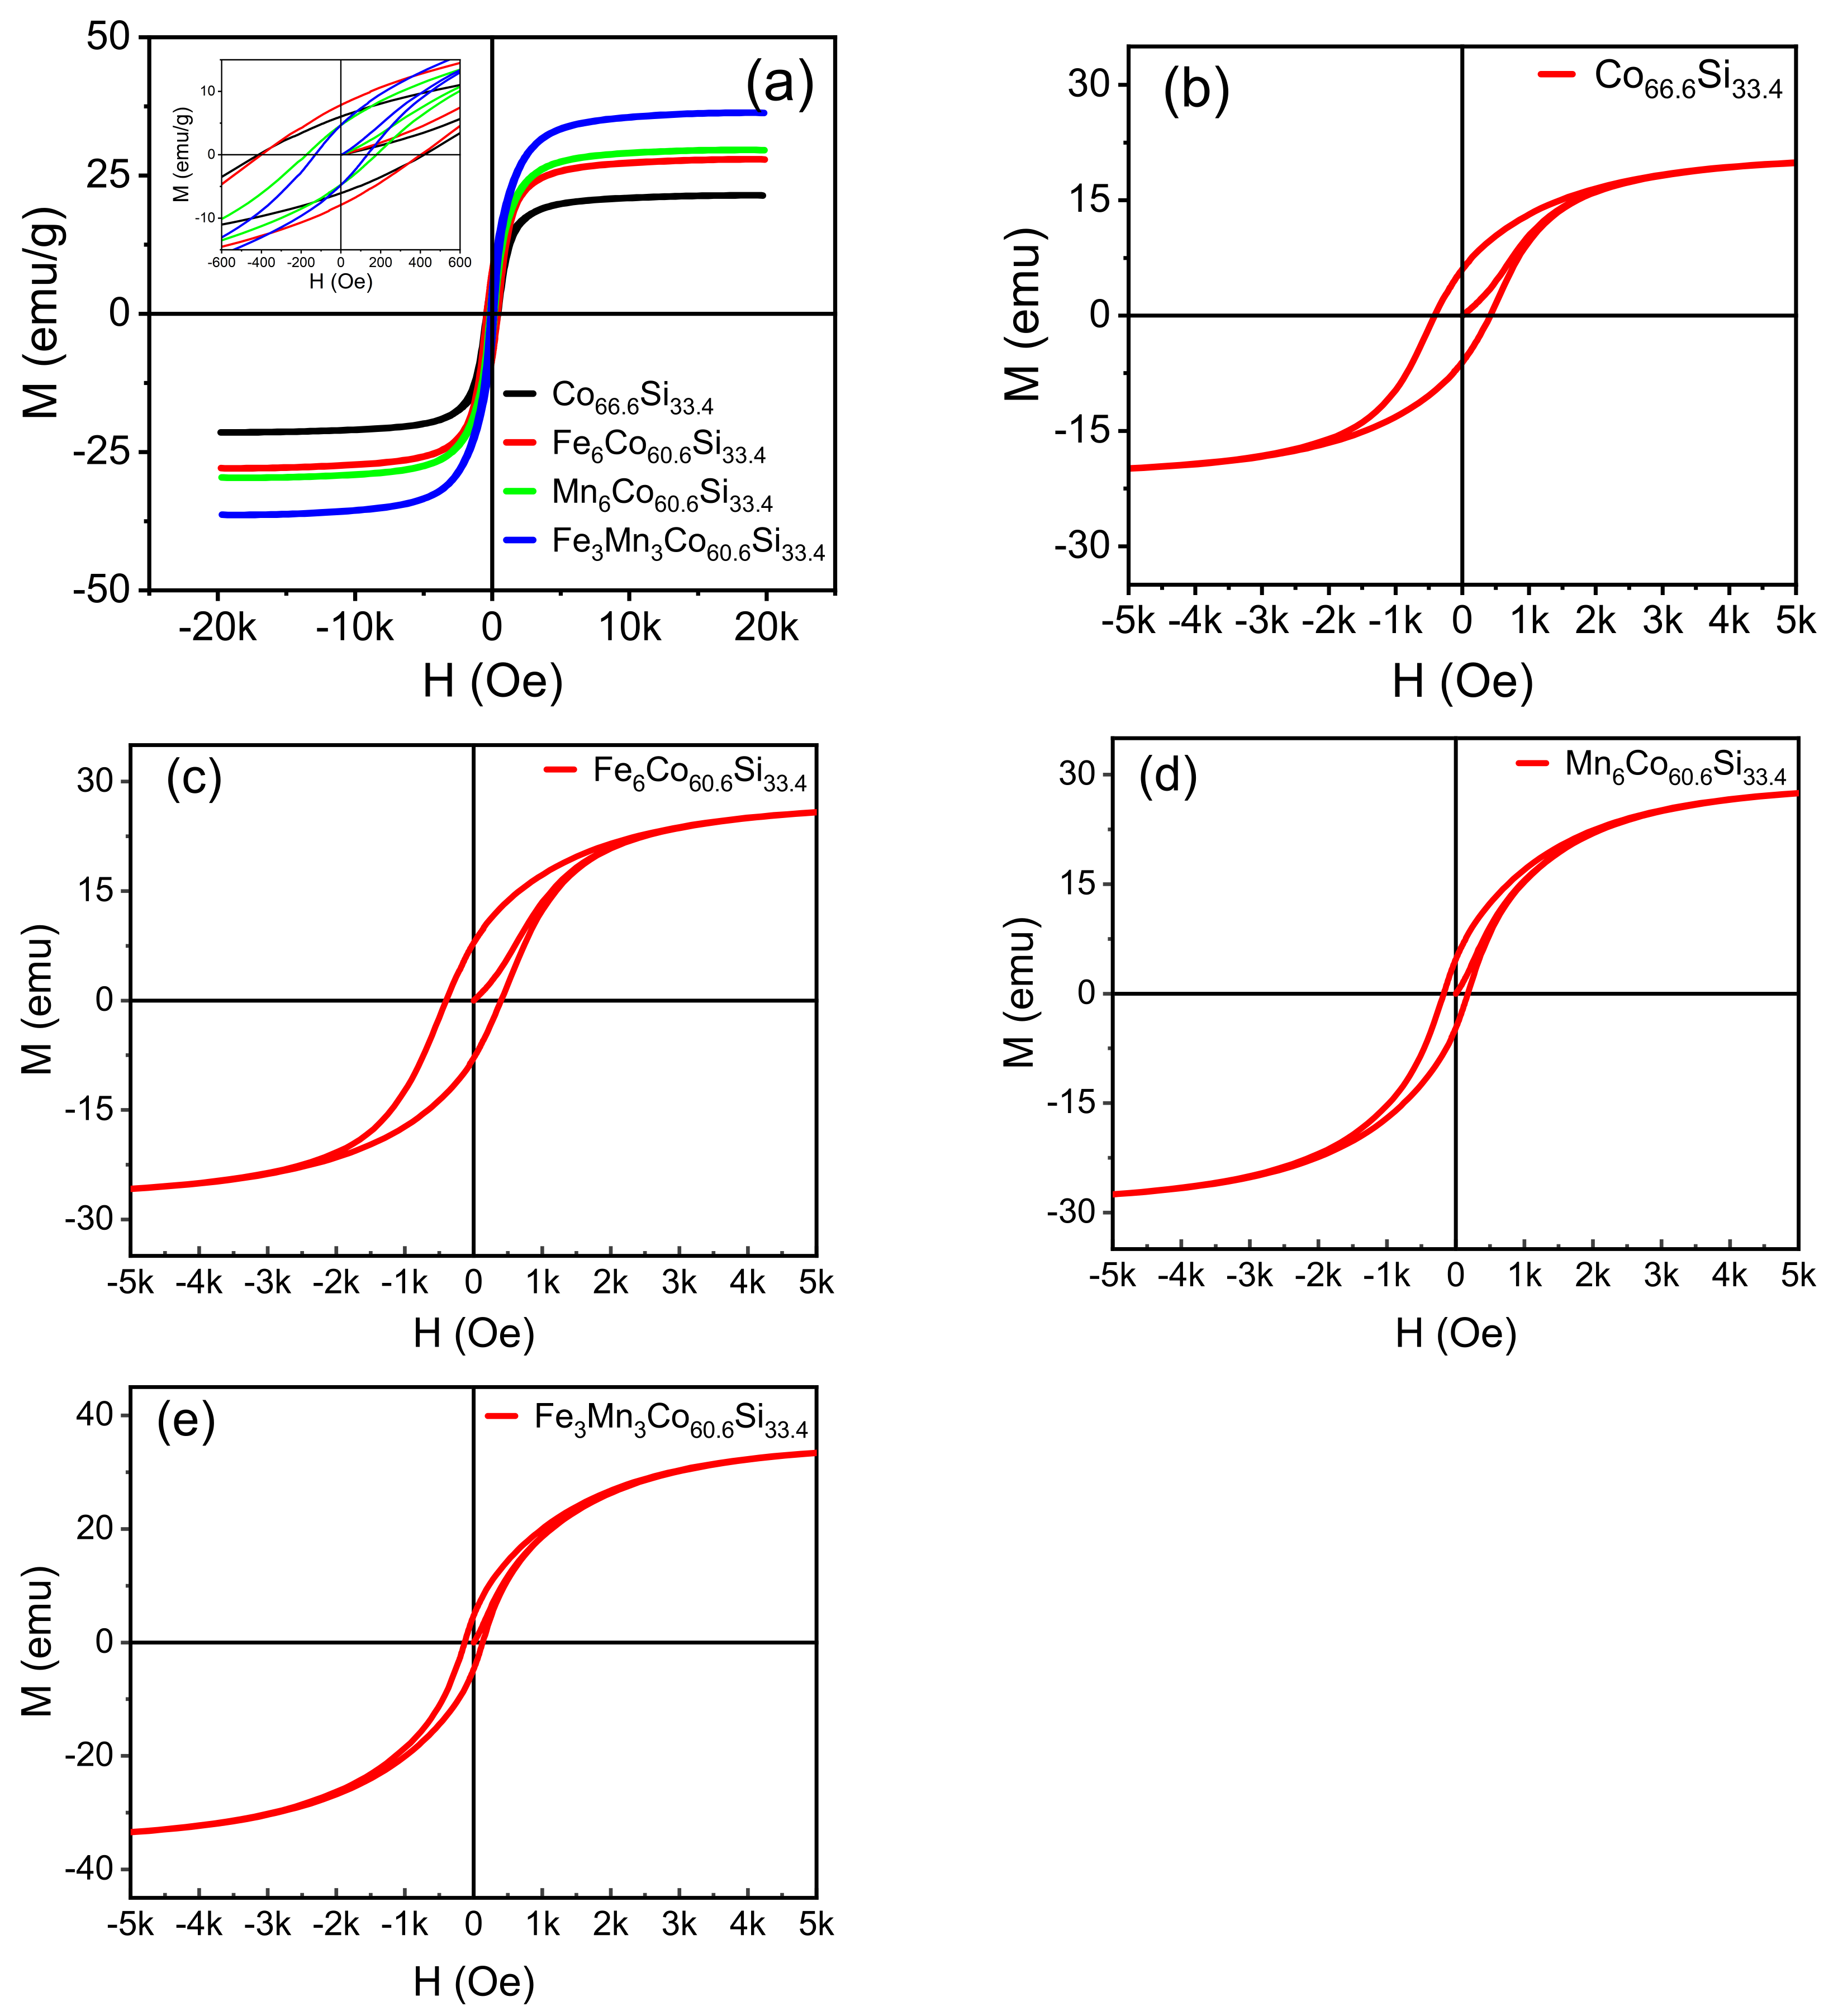
Figure 4a–e shows the hysteresis loops of CoSi, CoXSi, (X = Fe, Mn), and CoFeMnSi, which were observed under a parallel magnetic field. All samples exhibit magnetic properties. Cristina Bormio-Nunes [13] studied the magnetisation of CoSi, which was obtained by heat treatment.
They obtained a saturation magnetisation of 18 KA/M, indicating that the magnetic properties are better than those obtained in our study. However, they performed they found powder heating at 1000 °C for 50 h, which requires complex instrumentation as CoSi is easily oxidised at high temperatures. Van der Walls-Zeeman [16] obtained CoSi by ball milling and sintering. They milled CoSi for 120, 260, and 629 h, then sintered it at 900 K. The diffraction peak matched the diffraction pattern of CoSi for the sample ball-milled for 629 h. However, the machine was continuously operated for hundreds of hours, resulting in damage to the mechanical bearing. Therefore, our method is more effective.
Magnetisation gradually increases as increase in the magnetic field intensity (H); at a certain value, it attains saturation. The doping of CoSi with Fe and Mn improved the saturation magnetisation of the sample. The obtained saturation magnetisations were 27.9, 29.6, and 36.3 emu/g. The magnetic moment of CoSi was significantly improved when CoSi was doped with Fe and Mn, as inferred from theoretical analysis. By introducing different metal ions as dopants, the magnetism of CoSi could be ameliorated.
The lattice will be changed during the introduction of ions, and in this process, some magnetic moments may be occur [27]. Consequently, the net magnetic moment of the sample increases and the macroscopic magnetism is enhanced. Following the introduction of Fe and Mn atoms into the lattice of CoSi, the orbit of Co is modified, and the hybridisation of the atomic orbital changes. After introducing the Fe and Mn dopants, the bond length changes, enhancing the magnetism. Figure 5 shows that the coercivity decreased after doping, and that of CoFeMnSi reached a minimum value of 129.73 Oe.
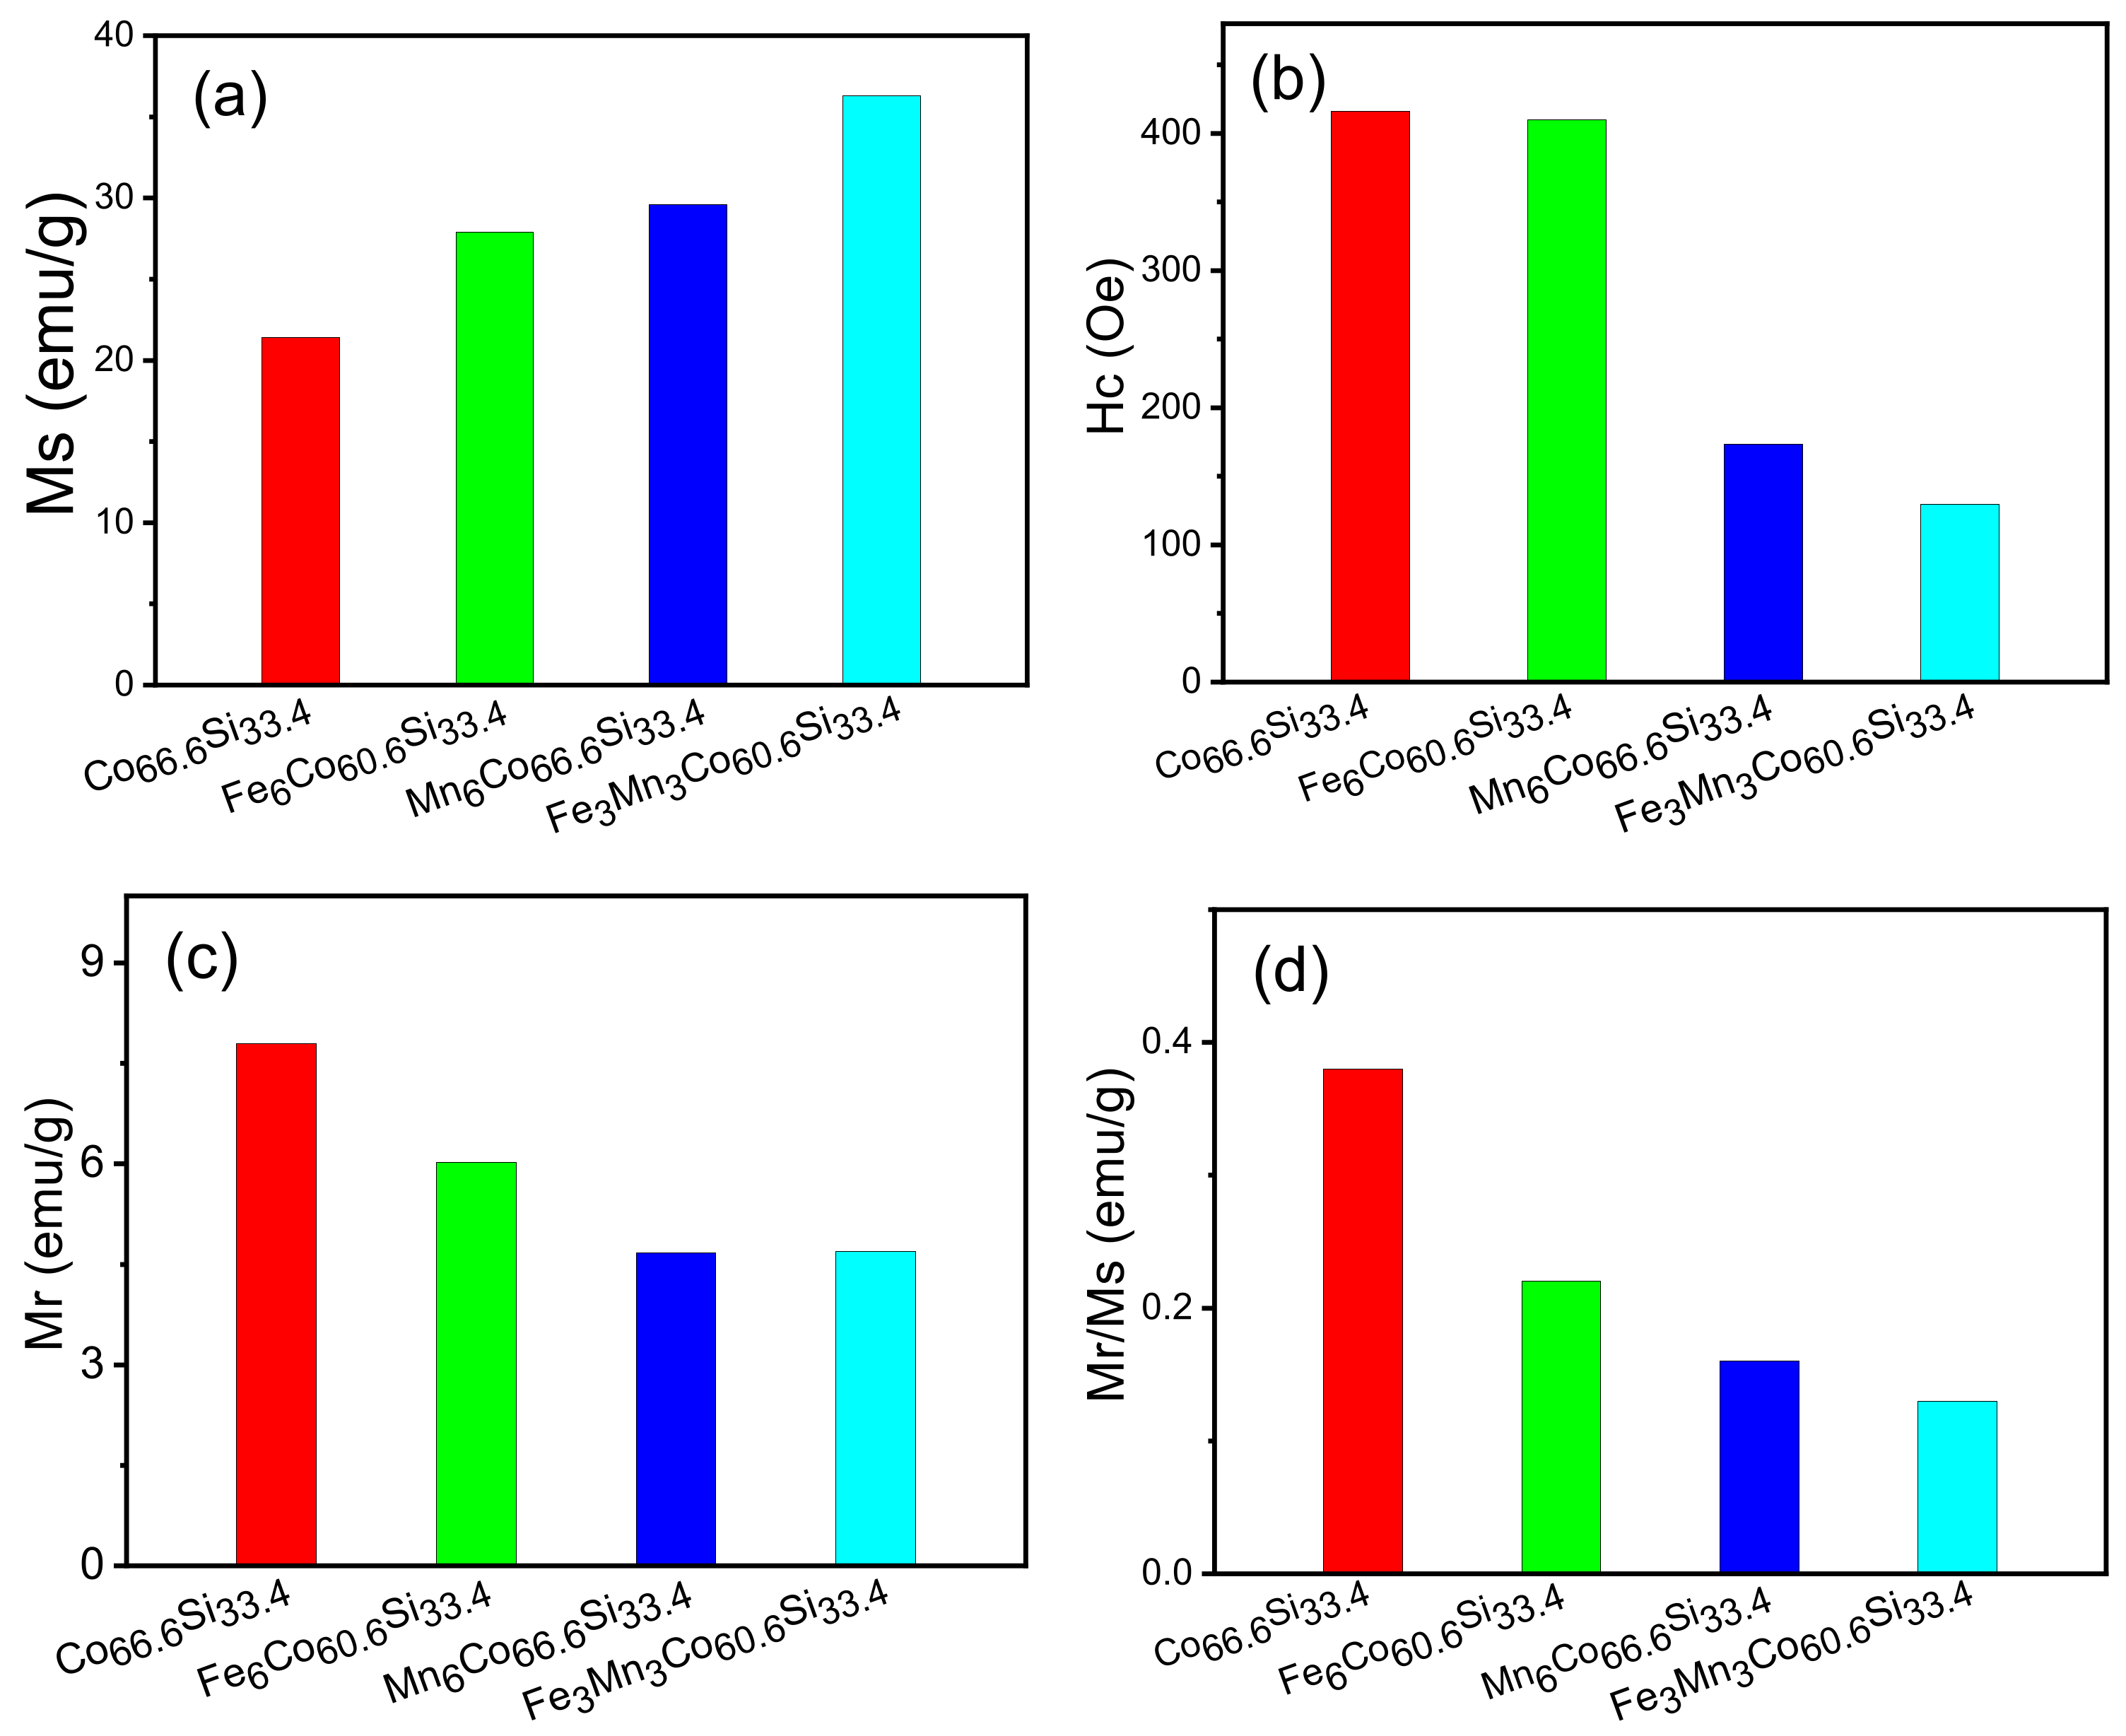
These results show that the magnetic properties of CoSi are enhanced after doping, and that the magnetic properties of CoFeMnSi are excellent. The saturation magnetisation (Ms), coercivity (Hc), remanence magnetisation (Mr), and ratio of remanence to saturation magnetisation (Mr/Ms) of CoFeMnSi are 36.3 emu/g, 129.73 Oe, 4.69 emu/g, and 0.16, respectively.
Figure 5a–d shows the Ms, Hc, Mr, and Mr/Ms of all samples. The x-axis represents the type of material, namely CoSi, CoXSi, (X = Fe, Mn), or CoFeMnSi. The y-axis shows the Ms, Hc, Mr, and Mr/Ms values, respectively. In Figure 5a, the Ms values of CoSi, CoXSi, (X = Fe, Mn), and CoFeMnSi were 21.4, 27.9, 29.6, and 36.3 emu/g, respectively. Following doping, the magnetic saturation intensity improved, and that of CoFeMnSi reaches the maximum value of 36.3 emu/g. When CoSi is doped with Fe, the primary sources of magnetism are the d orbitals of Co and Fe; on the other hand, when CoSi is doped with Mn, they are the d orbitals of Co and Mn.
The d orbital of Mn introduces a new magnetic source of magnetization atom, which enhances the coupling effect of the original system. When CoSi is co-doped with Fe and Mn, the magnetic moment further increases, indicating that co-doping with Fe and Mn has a synergistic effect. Figure 5b compares the coercivities of CoSi, CoXSi, (X = Fe, Mn), and CoFeMnSi with that of CoSi, and indicates that the samples underwent varying degrees of deterioration.
The coercivities of CoSi and CoFeMnSi were 173.4, and 129.73 Oe, respectively. The Hc of CoFeMnSi was the lowest among all samples. In Figure 5c, the Mr values of CoSi, CoXSi, (X = Fe, Mn), and CoFeMnSi exhibit slight differences. Further, the lower the Mr, the stronger the magnetic property. The Mr values of CoSi, CoXSi, (X = Fe, Mn), and CoFeMnSi were 7.8, 6.02, 4.67, and 4.69 emu/g, respectively.
As shown in Figure 5d, the Mr/Ms ratios of CoSi, CoXSi, (X = Fe, Mn), and CoFeMnSi were 0.38, 0.22, 0.16, and 0.13, respectively, exhibiting little in the way differences. In summary, the magnetic properties of CoFeMnSi are significantly improved after doping; further, Co-doping had a significant effect on CoFeMnSi, whereby the saturation magnetisation reaches the maximum, its Hc was the lowest, and its Mr was remarkable.
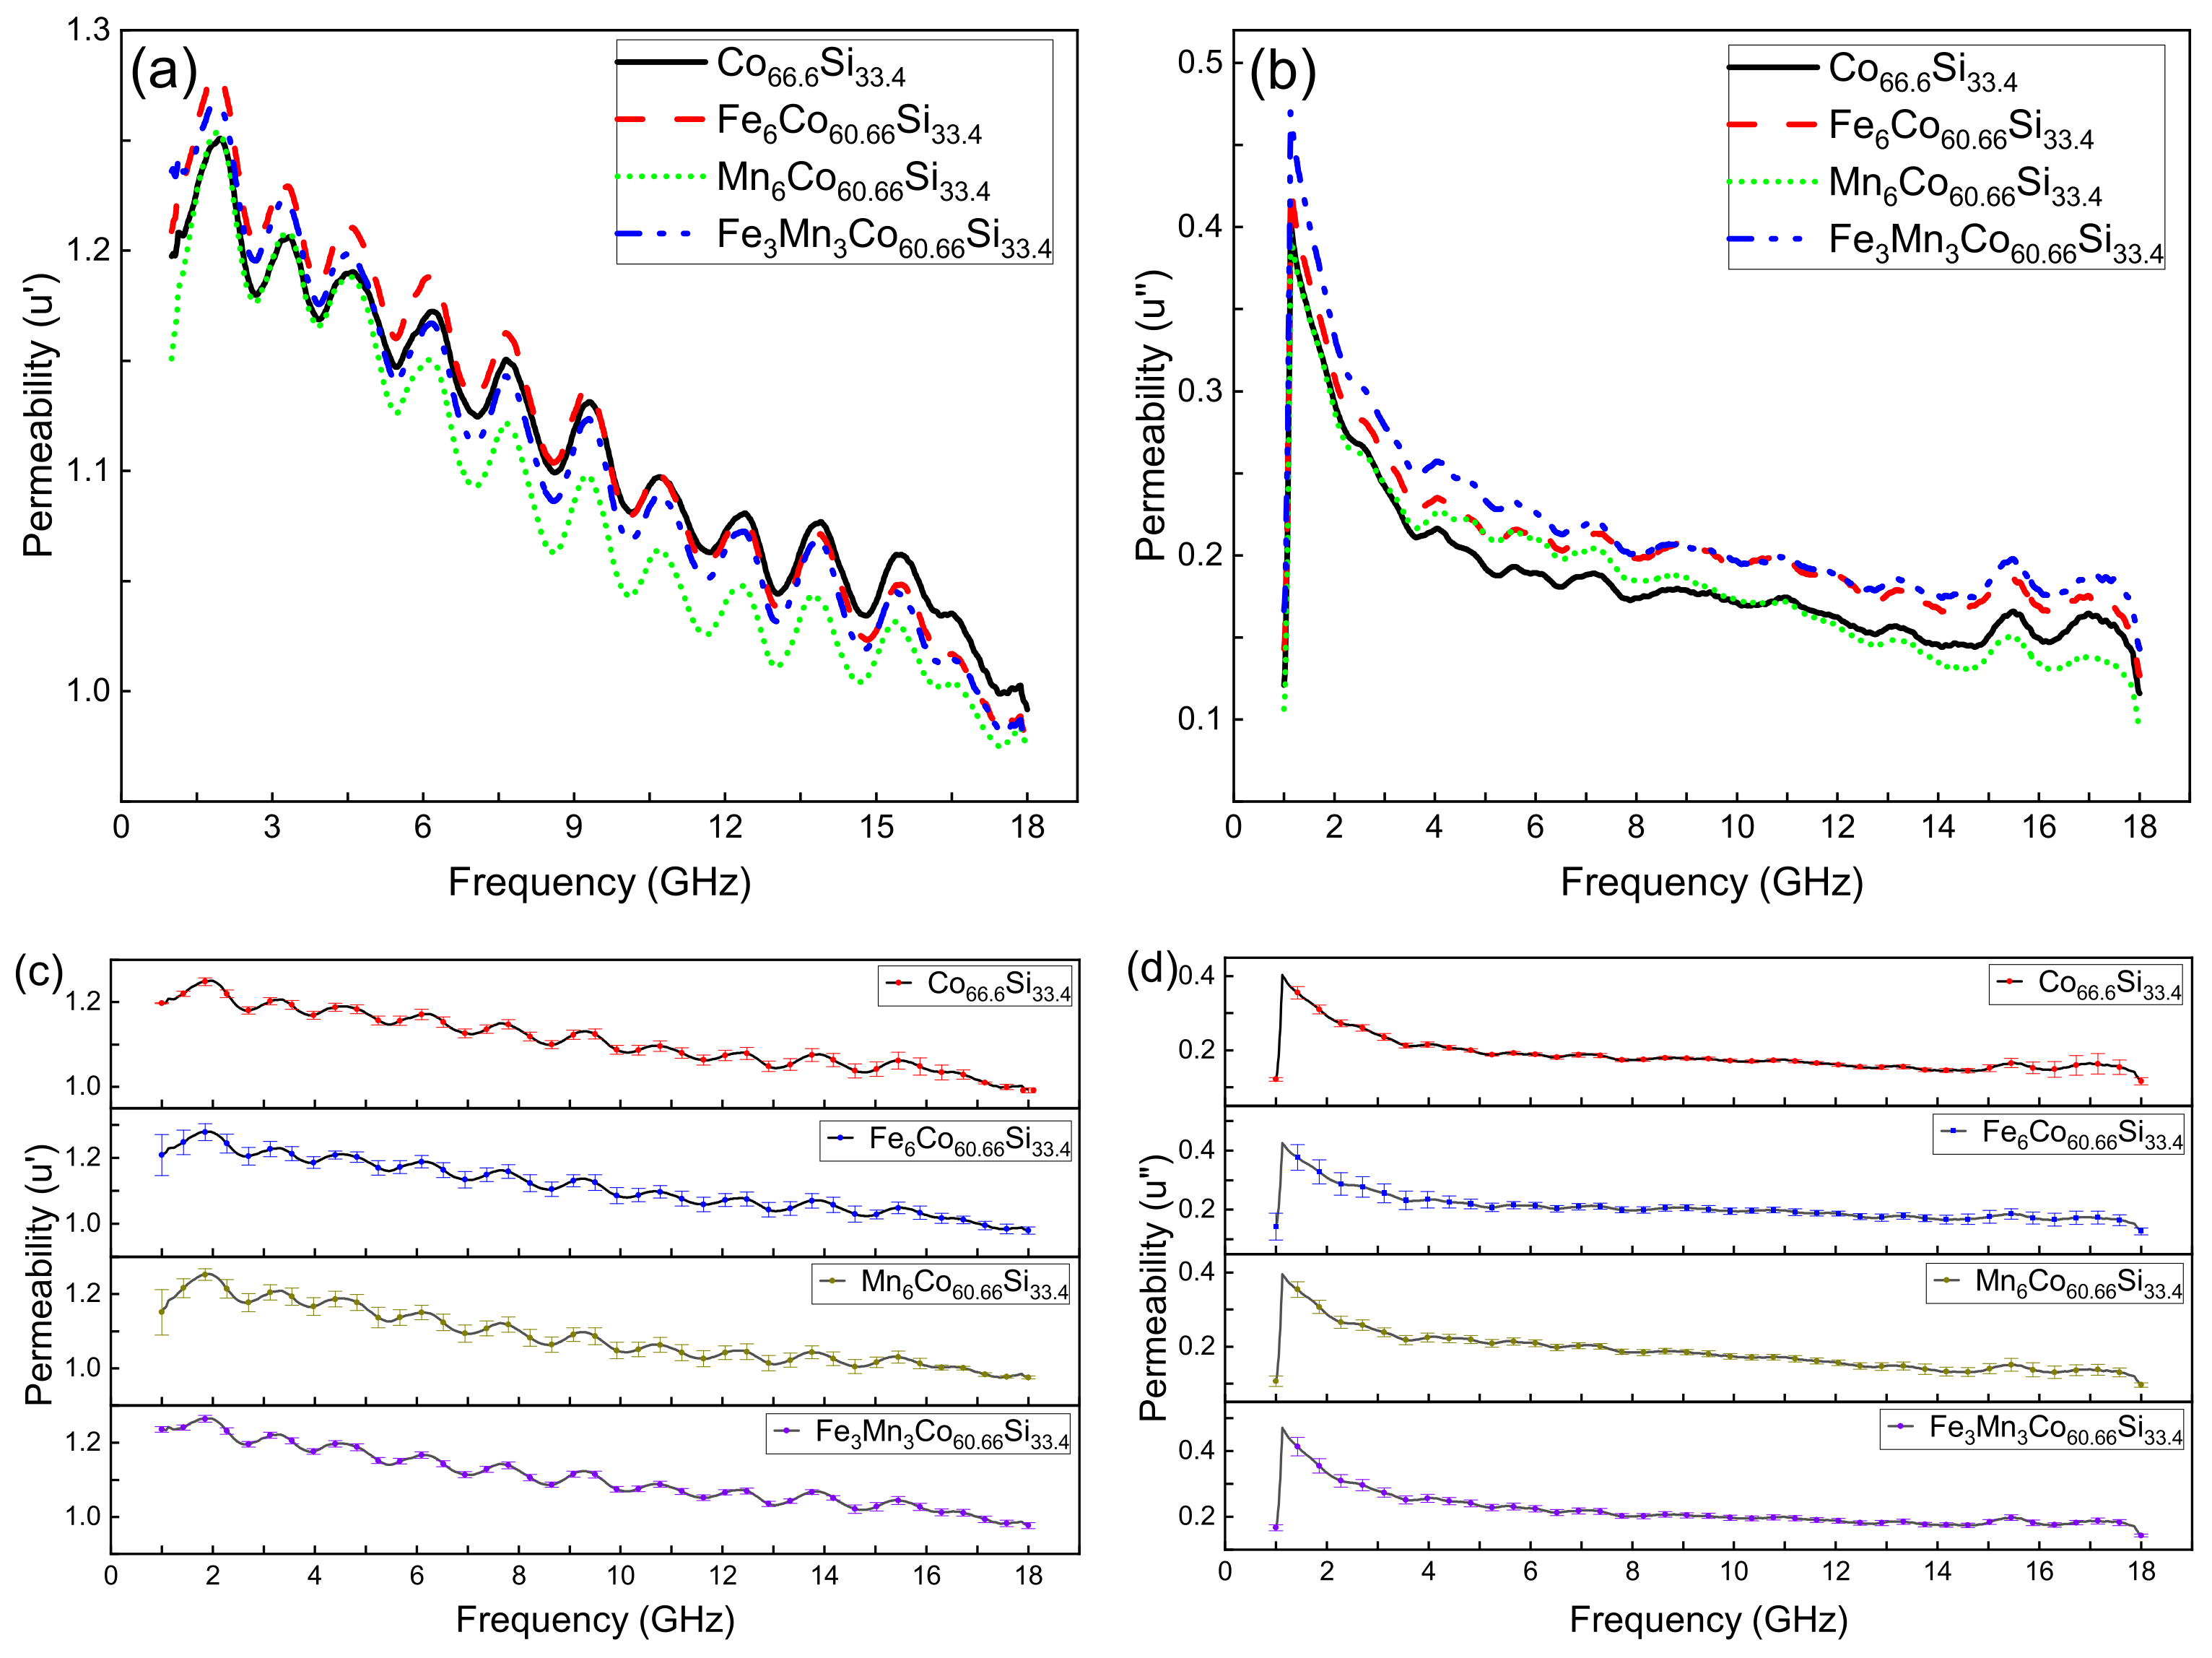
Figure 6a,b, respectively, show the real (u’) and imaginary permeabilities (u”) of CoSi, CoXSi, (X = Fe, Mn), and CoFeMnSi. Figure 6c,d, respectively, show the error bar of the real(u’) and imaginary permeabilities (u”) of CoSi, CoXSi, (X = Fe, Mn), and CoFeMnSi (mean ± SD). The real permeability represents the storage capacity of magnetic energy, while the imaginary permeability reflects the ability to lose magnetic energy [28]. As shown in Figure 6a,b, we chose CoSi as an example because they all had the same trend. The u’ of CoSi improved at 0.9–1.9 GHz, decreased at 1.9–2.68 GHz,, and reached a maximum at the 1.9 GHz.
The u’ of CoSi fell and rose alternately, and there are ten peaks from 1.9 to 18 GHz. This figure shows a downward trend as a whole in the 1.9–18 GHz range. At 18–20 GHz, the permeability dropped to zero. The u’ of CoSi started to appear at 1 GHz and reached its maximum immediately. Then it began to fall and reached 0 at 18 GHz.
As shown in Figure 6a,b, with increasing frequency, the u’ and u” of CoSi, CoXSi, (X = Fe, Mn), and CoFeMnSi gradually decreased, indicating that the storage capacity of magnetic energy and the ability to lose magnetic energy decrease with increasing frequency.
At low frequencies, the u’ and u” of CoSi, CoFeMnSi increase, whereas at high frequencies, after doping, they changed only slightly. This phenomenon indicates that doping has a greater effect on the properties in the low-frequency region than in the high-frequency region. As shown in Figure 6c,d, the maximum standard deviation of the u’ of CoSi, CoXSi, (X = Fe, Mn), and CoFeMnSi is, respectively, 0.03264, 0.06129, 0.0615, 0.0091.
The maximum standard deviation of the u” of CoSi, CoXSi, (X = Fe, Mn), and CoFeMnSi is, respectively, 0.03264, 0.06129, 0.0615, 0.0091. This is because we measured three times, and in the process of each measurement, we made a new loop, thus, resulting in a certain error.
4. Conclusions
In this study, the effects of different dopants on the crystal structure, electrical conductivity, and magnetic properties of CoSi were studied.
(1) Based on the PDF card (98-005-2281), a single phase of CoSi was obtained by ball milling and sintering. The doped CoSi did not form other phases, except for a phase of CoSi. There were slight differences between the measured and calculated grain sizes of CoSi, CoSi, CoXSi, (X = Fe, Mn), and CoFeMnSi (measured: 23, 21, 38, and 32 nm, respectively; calculated: 36.8, 34.4, 46.8, and 45.8 nm, respectively). This is due to the different methods employed (the data of XRD for calculation for calculation and TEM for measurements). Another reason is that magnetic materials affect the accuracy of the measured grain sizes.
(2) Under pressures of 1, 2, and 3 MPa, the resistivity of each samples was measured by a resistance meter. The conductivity was calculated by taking the reciprocals of resistivities. The effect of Fe doping on the conductivity was insignificant. The conductivities of MnCoSi and FeMnCoSi were superior to that of CoSi, indicating that the doping of Mn atoms has an influence on the electronic structure. This is because the entry of Mn atoms enhanced the electron mobility.
(3) The CoSi alloy exhibited typical magnetic properties, which were improved after doping. At the same temperature, Ms increased, whereas Hc, Mr, and Mr/Ms decreased. This indicates that the magnetic properties of the CoSi alloy are ameliorated after doping. Among the doping strategies employed, the effect of the co-doping of Fe and Mn was excellent, the resulting values of Ms, Hc, Mr, and Mr/Ms were 36.3 emu/g, 129.73 Oe, 4.69 emu/g, and 0.16, respectively.
(4) The storage capacity of magnetic energy and the ability to lose magnetic energy declined with increasing frequency for CoSi and doped CoSi. This is because impedance matching also plays a role. If the impedance does not match, lesser electromagnetic waves will enter the material, resulting in no improvement in the storage capacity despite a decrease in the loss of magnetic energy. Doping affects the permeability in the low-frequency region more than in the high-frequency region.
(5) This work suggests alternative candidates for future magnetic functional materials. The low coercivities of MnCoSi and FeMnCoSi render them promising for use as audio and video magnetic head materials. The remanence characteristics of doped CoSi may render it suitable for use in electronic transformers.
Author Contributions
Methodology, J.Z. and Q.X.; software, L.W., B.W. and J.H.; data curation, J.Z. and L.W.; writing-original draft preparation, J.Z. and Q.X.; writing-review and editing, J.Z., L.W. and Q.X. All authors have read and agreed to the published version of the manuscript.
Funding
The study was supported by the Industry and Education Combination Innovation Platform of Intelligent Manufacturing and Graduate Joint Training Base at Guizhou University (Grant No: 2020-520000-83-01-324061), the National Natural Science Foundation of China (Grant No.61264004), and High-level Creative Talent Training Program in Guizhou Province of China (Grant No. [2015]4015). The Education Department of Guizhou Province Electronic Manufacturing Production Base (NO. [2014]230).
Data Availability Statement
The data presented in this study are available on request from the corresponding author.
Conflicts of Interest
The authors declare no conflict of interest. The authors claim that none of the material in our manuscript has been published or is under consideration for publication elsewhere. This manuscipt is our original work.
References
- Zhiyao, J.; Yue, M.; Qing, W.; Chuang, D. Research progress on high performance soft-magnetic alloys. J. Mater. Eng. 2021, 299, 1–18. [Google Scholar]
- Bin, J.; Wei, W. Research Progress in Electrochemical Synthesis of Fe-based Soft Magnetic Films. Surf. Technol. 2021, 50, 151–158. [Google Scholar]
- Liu, J.; Mei, Y.; Lu, G. Development of High-frequency Soft Magnetic Materials for Power Electronics. J. Mater. Eng. 2017, 45, 127–134. [Google Scholar]
- Huang, M.; Wu, K.; Xiang, Q.; Zhang, K.; Tsepelev, V.S.; Wang, R. Research status and future development trend of a novel FeSiBPCu nano soft magnetic alloy. J. Iron Steel Res. 2018, 30, 763–768. [Google Scholar]
- Barth, M.; Wei, B.; Herlach, D.M. Crystal-growth in undercooled melts of the intermetallic compounds FeSi and CoSi. Phys. Rev. B 1995, 51, 3422–3428. [Google Scholar] [CrossRef] [PubMed]
- Tao, Z.X.; Li, L.Z.; Wu, X.H.; Zhong, X.X.; Zhong, Z.C. Structural, magnetic and electrical properties of CoSi ferrites synthesized by sol-gel self-propagating method. Phys. B-Condens. Matter 2021, 604. [Google Scholar] [CrossRef]
- Chengchuan, L.I.; Weili, R.E.N.; Zhijun, P.A.N.; Lanting, Z.; Jiansheng, W.U. The synthesis of thermoelectric compound CoSi by mechanical alloying. J. Shanghai Jiaotong Univ. 2006, 40, 889–892. [Google Scholar]
- Pan, Z.J.; Zhang, L.T.; Wu, J.S. First-principles study of electronic structure for CoSi. Acta Phys. Sin. 2005, 54, 328–332. [Google Scholar]
- Jo, C.; Kim, D.C.; Lee, J.I. Magnetic properties of Co-Si alloy clusters. J. Magn. Magn. Mater. 2006, 306, 156–160. [Google Scholar] [CrossRef]
- Velez, M.; Valvidares, S.; Diaz, J.; Morales, R.; Alameda, J. Structure and magnetic properties of amorphous CoSi alloy films. IEEE Trans. Magn. 2002, 38, 3078–3080. [Google Scholar] [CrossRef]
- Geller, S. The crystal structure of Co2Si. Acta Crystallogr. 1955, 8, 83–87. [Google Scholar] [CrossRef] [Green Version]
- Jan, C.H.; Chen, C.P.; Chang, Y.A. Growth of intermediate phases in Co/Si diffusion couples-Bulk versus thin-film studies. J. Appl. Phys. 1993, 73, 1168–1179. [Google Scholar] [CrossRef]
- Bormio-Nunes, C.; Nunes, C.A.; Coelho, A.A.; Sodero Toledo Faria, M.I.; Suzuki, P.A.; Coelho, G.C. Magnetization studies of binary and ternary Co-rich phases of the Co-Si-B system. J. Alloys Compd. 2010, 508, 5–8. [Google Scholar] [CrossRef]
- Tu, K.N.; Ottaviani, G.; Thompson, R.D.; Mayer, J.W. Thermal-stability and growth-kinetics of Co2Si and CoSi in thin-film reactions. J. Appl. Phys. 1982, 53, 4406–4410. [Google Scholar] [CrossRef]
- Baldan, R.; Sodero Toledo Faria, M.I.; Nunes, C.A.; Coelho, G.C.; Chad, V.M.; de Avillez, R.R. Microstructural Evidence of beta Co2Si-phase Stability in the Co-Si System. J. Phase Equilibria Diffus. 2008, 29, 477–481. [Google Scholar] [CrossRef]
- Zhou, G.F.; Bakker, H. Atomically disordered nanocrystalline Co2Si by high-energy ball-milling. J.-Phys.-Condens. Matter 1994, 6, 4043–4052. [Google Scholar] [CrossRef]
- Chen, X.; Huang, H.; Li, F. Phase transformation in β-FeSi2 thermoelectric materials during mechanical alloying and heat-treatment. J. Southeast Univ. Nat. Sci. Ed. 2008, 38, 898–901. [Google Scholar]
- Zhang, X.; Ma, R.; Xie, Q. Effects of Ni doping amount on microwave absorptive properties of Fe3Si alloy. Electron. Compon. Mater. 2014, 33, 38–41. [Google Scholar]
- Chen, Z.; Zhang, J.; Zhao, Q.; Zhu, P.; Zheng, X.; Xie, Q. Preparation of intermetallic compound Fe3Si with mechanical alloying and hot-pressing sintering. J. Mater. Sci. Eng. 2012, 30, 442–448. [Google Scholar]
- Lee, Y.; Jeon, J.K.; Shin, H.; Kim, J.Y. Magnetic behaviors of Ti50Zr33Ni17 quasicrystals measured by VSM. Z. Fur Krist. 2009, 224, 67–70. [Google Scholar] [CrossRef]
- He, H.Y.; Huang, J.F.; Cao, L.Y.; He, Z.; Shen, Q. Magnetic and microwave-absorbing properties of SrAl4Fe8O19 powders synthesized by coprecipitation and citric-combustion methods. Bull. Mater. Sci. 2011, 34, 463–468. [Google Scholar] [CrossRef]
- Brazhkin, V.V.; Bychkov, E.; Tsiok, O.B. High-precision measurements of the compressibility and the electrical resistivity of bulk g-As2Te3 glasses at a hydrostatic pressure up to 8.5 GPa. J. Exp. Theor. Phys. 2017, 125, 451–464. [Google Scholar] [CrossRef]
- Zhong, Y.; Ping, D.; Song, X.; Yin, F. Determination of grain size by XRD profile analysis and TEM counting in nano-structured Cu. J. Alloys Compd. 2009, 476, 113–117. [Google Scholar] [CrossRef]
- Jianxin, L.; Dangyu, S.; Junying, Z.; Chuguang, Z. Evaluation of the X-ray Diffraction Data Analysis System. Rock Miner. Anal. 2008, 27, 189–192, 196. [Google Scholar]
- Velde, H.; Platbrood, G. Detectability of two overlapping Pearson VII peaks in simulated X-ray diffraction patterns. Int. Union Crystallogr. 1985, 18, 114–119. [Google Scholar] [CrossRef] [Green Version]
- Zak, A.K.; Majid, W.H.A.; Abrishami, M.E.; Yousefi, R. X-ray analysis of ZnO nanoparticles by Williamson–Hall and size-strain plot methods. Solid State Sci. 2011, 13, 251–256. [Google Scholar]
- Ul Haque, S.; Saikia, K.K.; Murugesan, G.; Kalainathan, S. A study on dielectric and magnetic properties of lanthanum substituted cobalt ferrite. J. Alloys Compd. 2017, 701, 612–618. [Google Scholar] [CrossRef]
- Xiong, Y.; Xu, L.; Yang, C.; Sun, Q.; Xu, X. Implanting FeCo/C nanocages with tunable electromagnetic parameters in anisotropic wood carbon aerogels for efficient microwave absorption. J. Mater. Chem. A 2020, 8, 18863–18871. [Google Scholar] [CrossRef]
Figure 1.
XRD patterns of (a) as-prepared CoSi, (b) Fe doped CoSi, (c) Mn doped CoSi and (d) Fe and Mn co-doped CoSi.
Figure 1.
XRD patterns of (a) as-prepared CoSi, (b) Fe doped CoSi, (c) Mn doped CoSi and (d) Fe and Mn co-doped CoSi.

Figure 2.
(a) FWHM of CoSi, CoXSi, (X = Fe, Mn), and CoFeMnSi; (b) Average grain size of as-prepared CoSi, CoXSi, (X = Fe, Mn), and CoFeMnSi.
Figure 2.
(a) FWHM of CoSi, CoXSi, (X = Fe, Mn), and CoFeMnSi; (b) Average grain size of as-prepared CoSi, CoXSi, (X = Fe, Mn), and CoFeMnSi.

Figure 3.
(a–d) Powder micrograph images of CoSi, CoXSi, (X = Fe, Mn), and CoFeMnSi.

Figure 4.
(a–e) Hysteresis loops of the as-prepared CoSi, CoXSi, (X = Fe, Mn), CoFeMnSi samples sintered at 950 °C.
Figure 4.
(a–e) Hysteresis loops of the as-prepared CoSi, CoXSi, (X = Fe, Mn), CoFeMnSi samples sintered at 950 °C.

Figure 5.
(a–d) M, H, M and M/M of as-prepared CoSi, CoXSi, (X = Fe, Mn), CoFeMnSi samples.

Figure 6.
(a) Real permeability of CoSi, CoXSi, (X = Fe, Mn), and CoFeMnSi; (b) Imaginary permeability of CoSi, CoXSi, (X = Fe, Mn), and CoFeMnSi; (c) Real permeability of CoSi, CoXSi, (X = Fe, Mn), and CoFeMnSi (mean ± SD); (d) Imaginary permeability of CoSi, CoXSi, (X = Fe, Mn), and CoFeMnSi (mean ± SD).


Table 1.
Lattice parameters of as-prepared CoSi, CoXSi, (X = Fe, Mn), and CoFeMnSi.
| 2° | B | d (Å) | hkl | a (Å) | b (Å) | c (Å) | |
|---|---|---|---|---|---|---|---|
| 43.899 | 0.242 | 2.0545 | 021 | 0.70813 | 0.49439 | 0.37311 | |
| CoSi | 45.859 | 0.028 | 1.9999 | 301 | 0.70813 | 0.48499 | 0.37734 |
| 45.277 | 0.115 | 1.9771 | 121 | 0.78013 | 0.49361 | 0.37394 | |
| 43.902 | 0.239 | 2.0606 | 021 | 0.71019 | 0.49337 | 0.37480 | |
| FeCoSi | 45.308 | 0.003 | 1.9999 | 301 | 0.71019 | 0.49582 | 0.37480 |
| 45.874 | 0.100 | 1.9765 | 121 | 0.71019 | 0.49210 | 0.37536 | |
| 44.002 | 0.139 | 2.0562 | 021 | 0.71639 | 0.49615 | 0.36752 | |
| MnCoSi | 45.248 | 0.057 | 2.0024 | 301 | 0.71639 | 0.49615 | 0.36752 |
| 45.877 | 0.097 | 1.9764 | 121 | 0.71639 | 0.49615 | 0.36752 | |
| 44.107 | 0.034 | 2.0510 | 021 | 0.71273 | 0.49225 | 0.37100 | |
| FeMnCoSi | 45.413 | 0.108 | 2.0252 | 301 | 0.71273 | 0.49225 | 0.37100 |
| 45.865 | 0.109 | 2.0007 | 121 | 0.71273 | 0.49225 | 0.37100 |
Table 2.
Average grain size by testing of as-prepared CoSi, CoXSi, (X = Fe, Mn), and CoFeMnSi.
| Structure | CoSi | FeCoSi | MnCoSi | FeMnCoSi |
|---|---|---|---|---|
| Size (nm) | 23 | 21 | 38 | 32 |
Table 3.
Conductivities of as-prepared CoSi, CoXSi, (X = Fe, Mn), and CoFeMnSi.
| Structure | CoSi | FeCoSi | MnCoSi | FeMnCoSi |
|---|---|---|---|---|
| 1 MPa | 280 (S/m) | 297 (S/m) | 30,002 (S/m) | 17,500 (S/m) |
| 2 MPa | 512 (S/m) | 649 (S/m) | 68,900 (S/m) | 24,300 (S/m) |
| 3 MPa | 183 (S/m) | 190 (S/m) | 111,000 (S/m) | 32,000 (S/m) |
Publisher’s Note: MDPI stays neutral with regard to jurisdictional claims in published maps and institutional affiliations. |
© 2022 by the authors. Licensee MDPI, Basel, Switzerland. This article is an open access article distributed under the terms and conditions of the Creative Commons Attribution (CC BY) license (https://creativecommons.org/licenses/by/4.0/).
Share and Cite
MDPI and ACS Style
Zou, J.; Wang, L.; He, J.; Wu, B.; Xie, Q. Effects of Fe, Mn Individual Doping and (Fe, Mn) Co-Doping on Ferromagnetic Properties of Co2Si Powders. Nanomaterials 2022, 12, 293. https://0-doi-org.brum.beds.ac.uk/10.3390/nano12020293
AMA Style
Zou J, Wang L, He J, Wu B, Xie Q. Effects of Fe, Mn Individual Doping and (Fe, Mn) Co-Doping on Ferromagnetic Properties of Co2Si Powders. Nanomaterials. 2022; 12(2):293. https://0-doi-org.brum.beds.ac.uk/10.3390/nano12020293
Chicago/Turabian StyleZou, Jiang, Lifeng Wang, Juan He, Bo Wu, and Quan Xie. 2022. "Effects of Fe, Mn Individual Doping and (Fe, Mn) Co-Doping on Ferromagnetic Properties of Co2Si Powders" Nanomaterials 12, no. 2: 293. https://0-doi-org.brum.beds.ac.uk/10.3390/nano12020293
Note that from the first issue of 2016, this journal uses article numbers instead of page numbers. See further details here.