
Photovoltaic Properties of ZnO Films Co-Doped with Mn and La to Enhance Solar Cell Efficiency

 and
and
Abstract
:1. Introduction
2. Experimentation
3. Results and Discussion
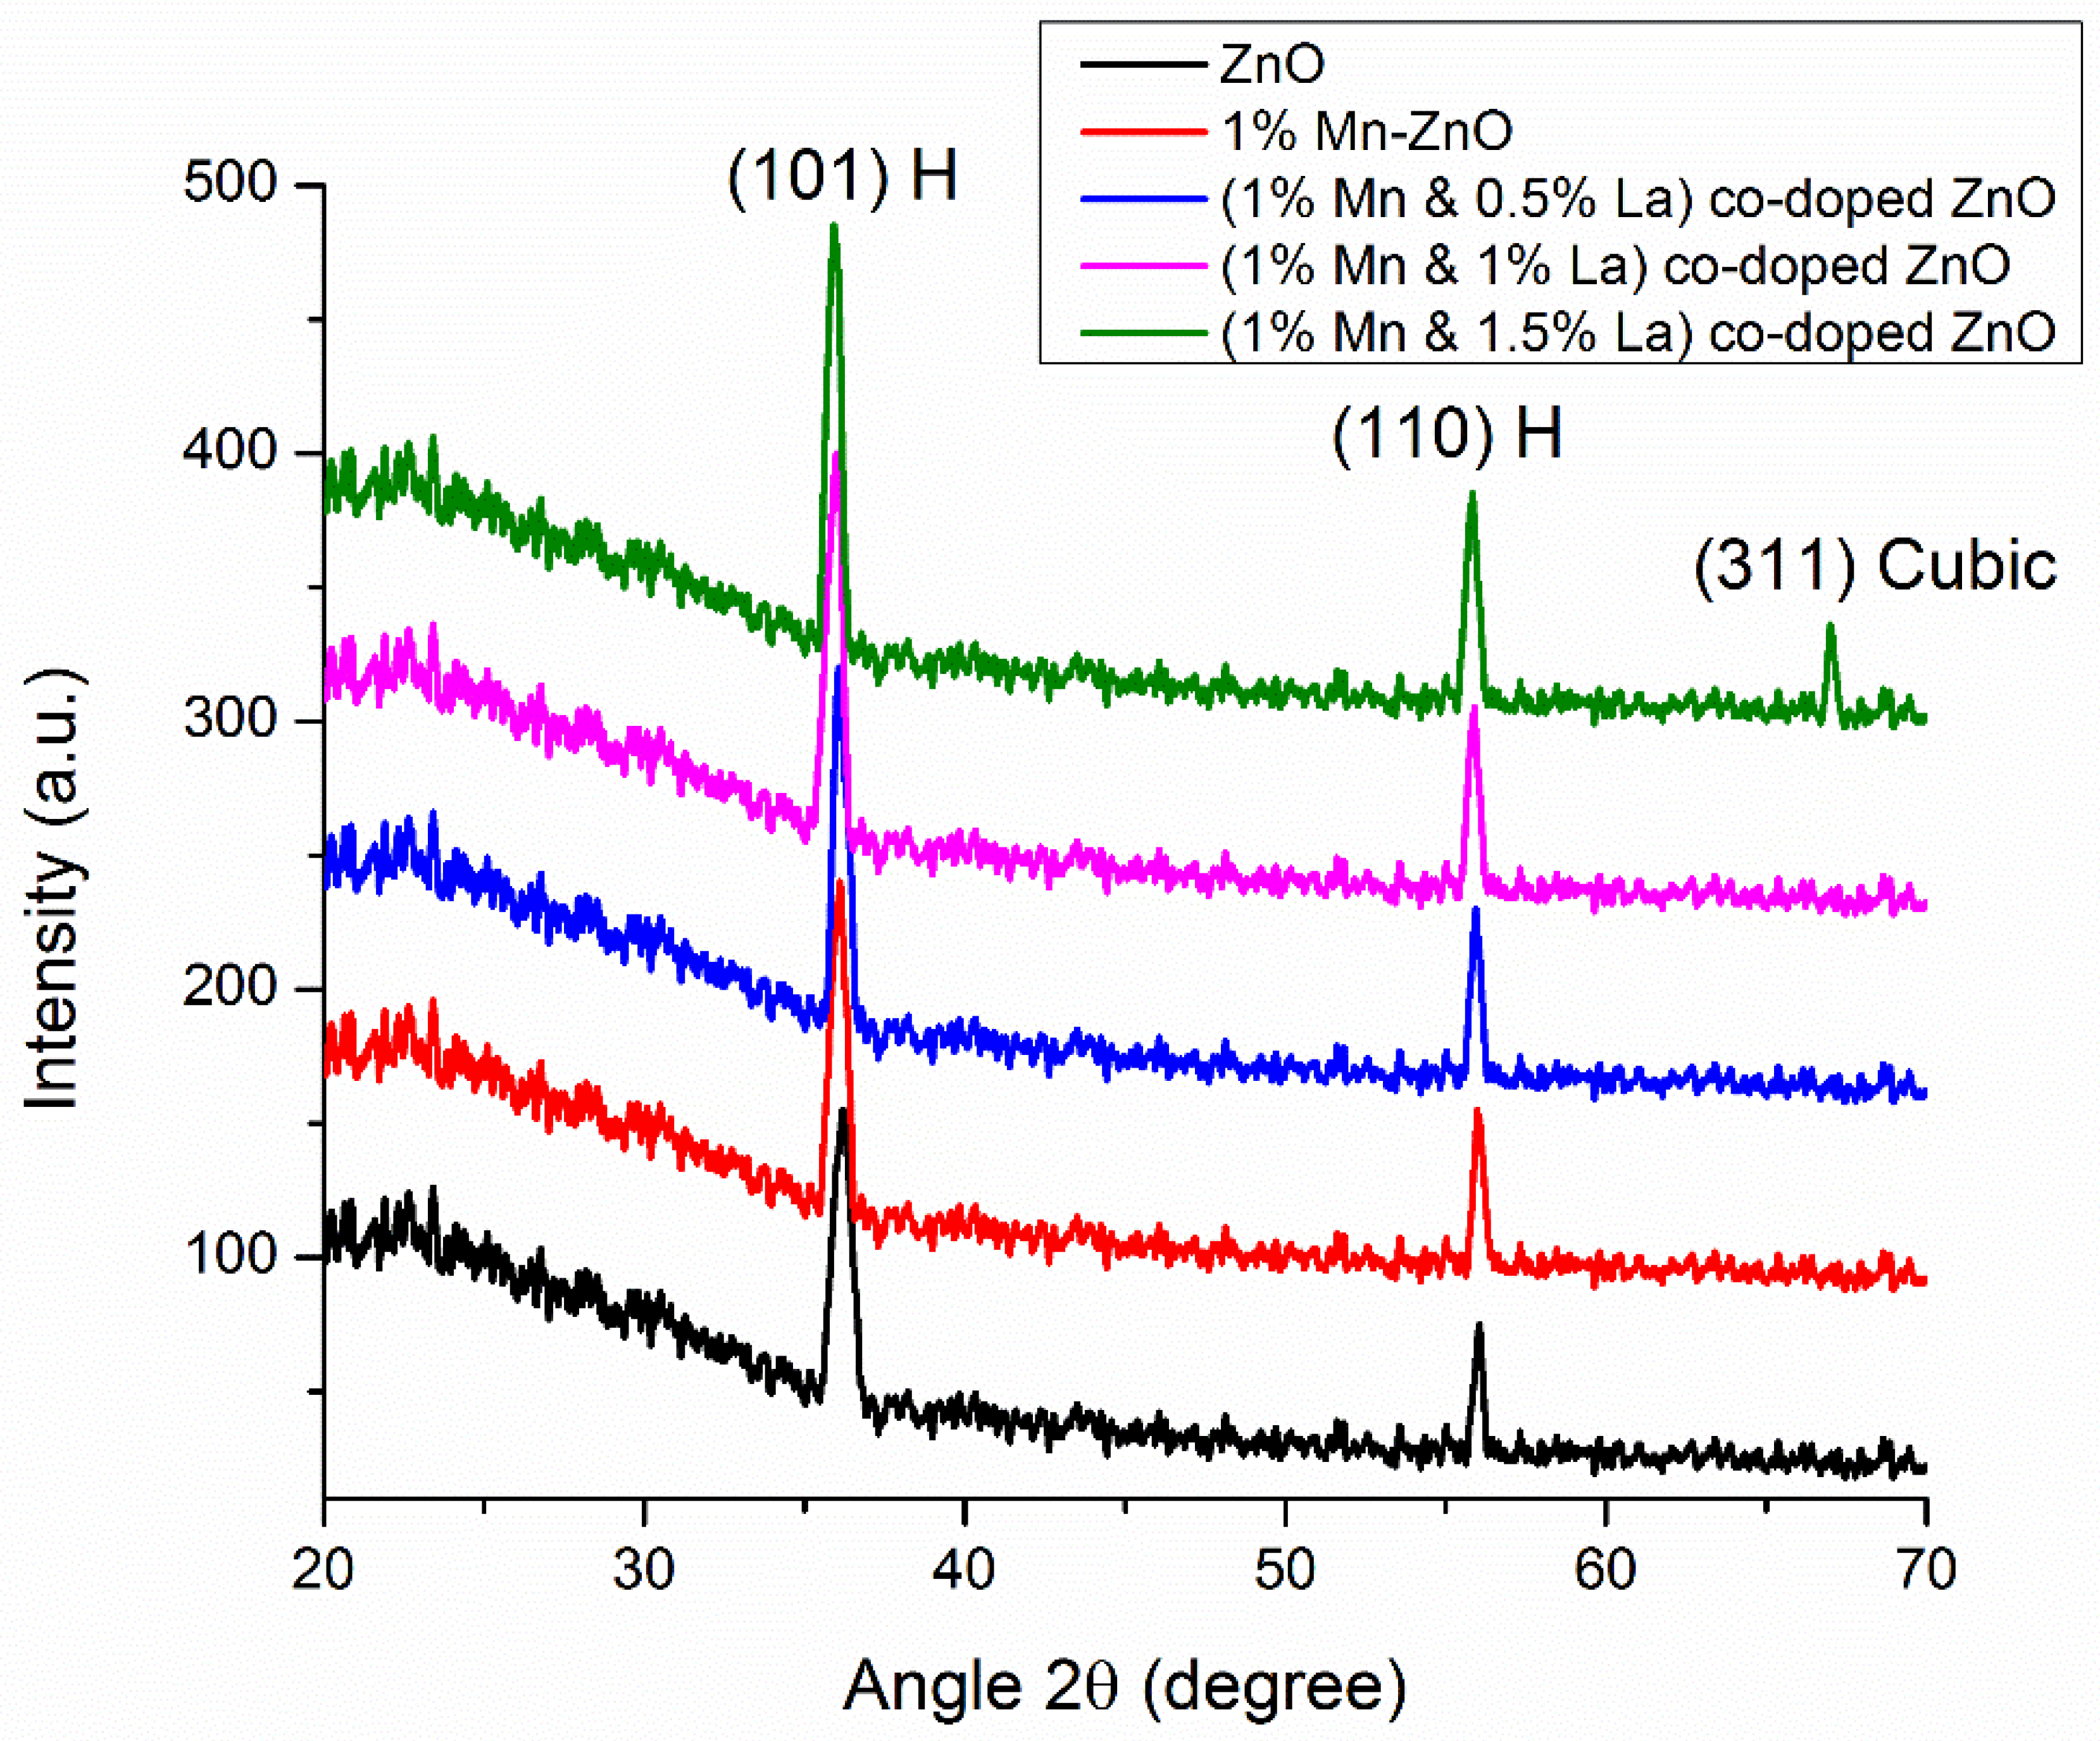
3.1. XRD
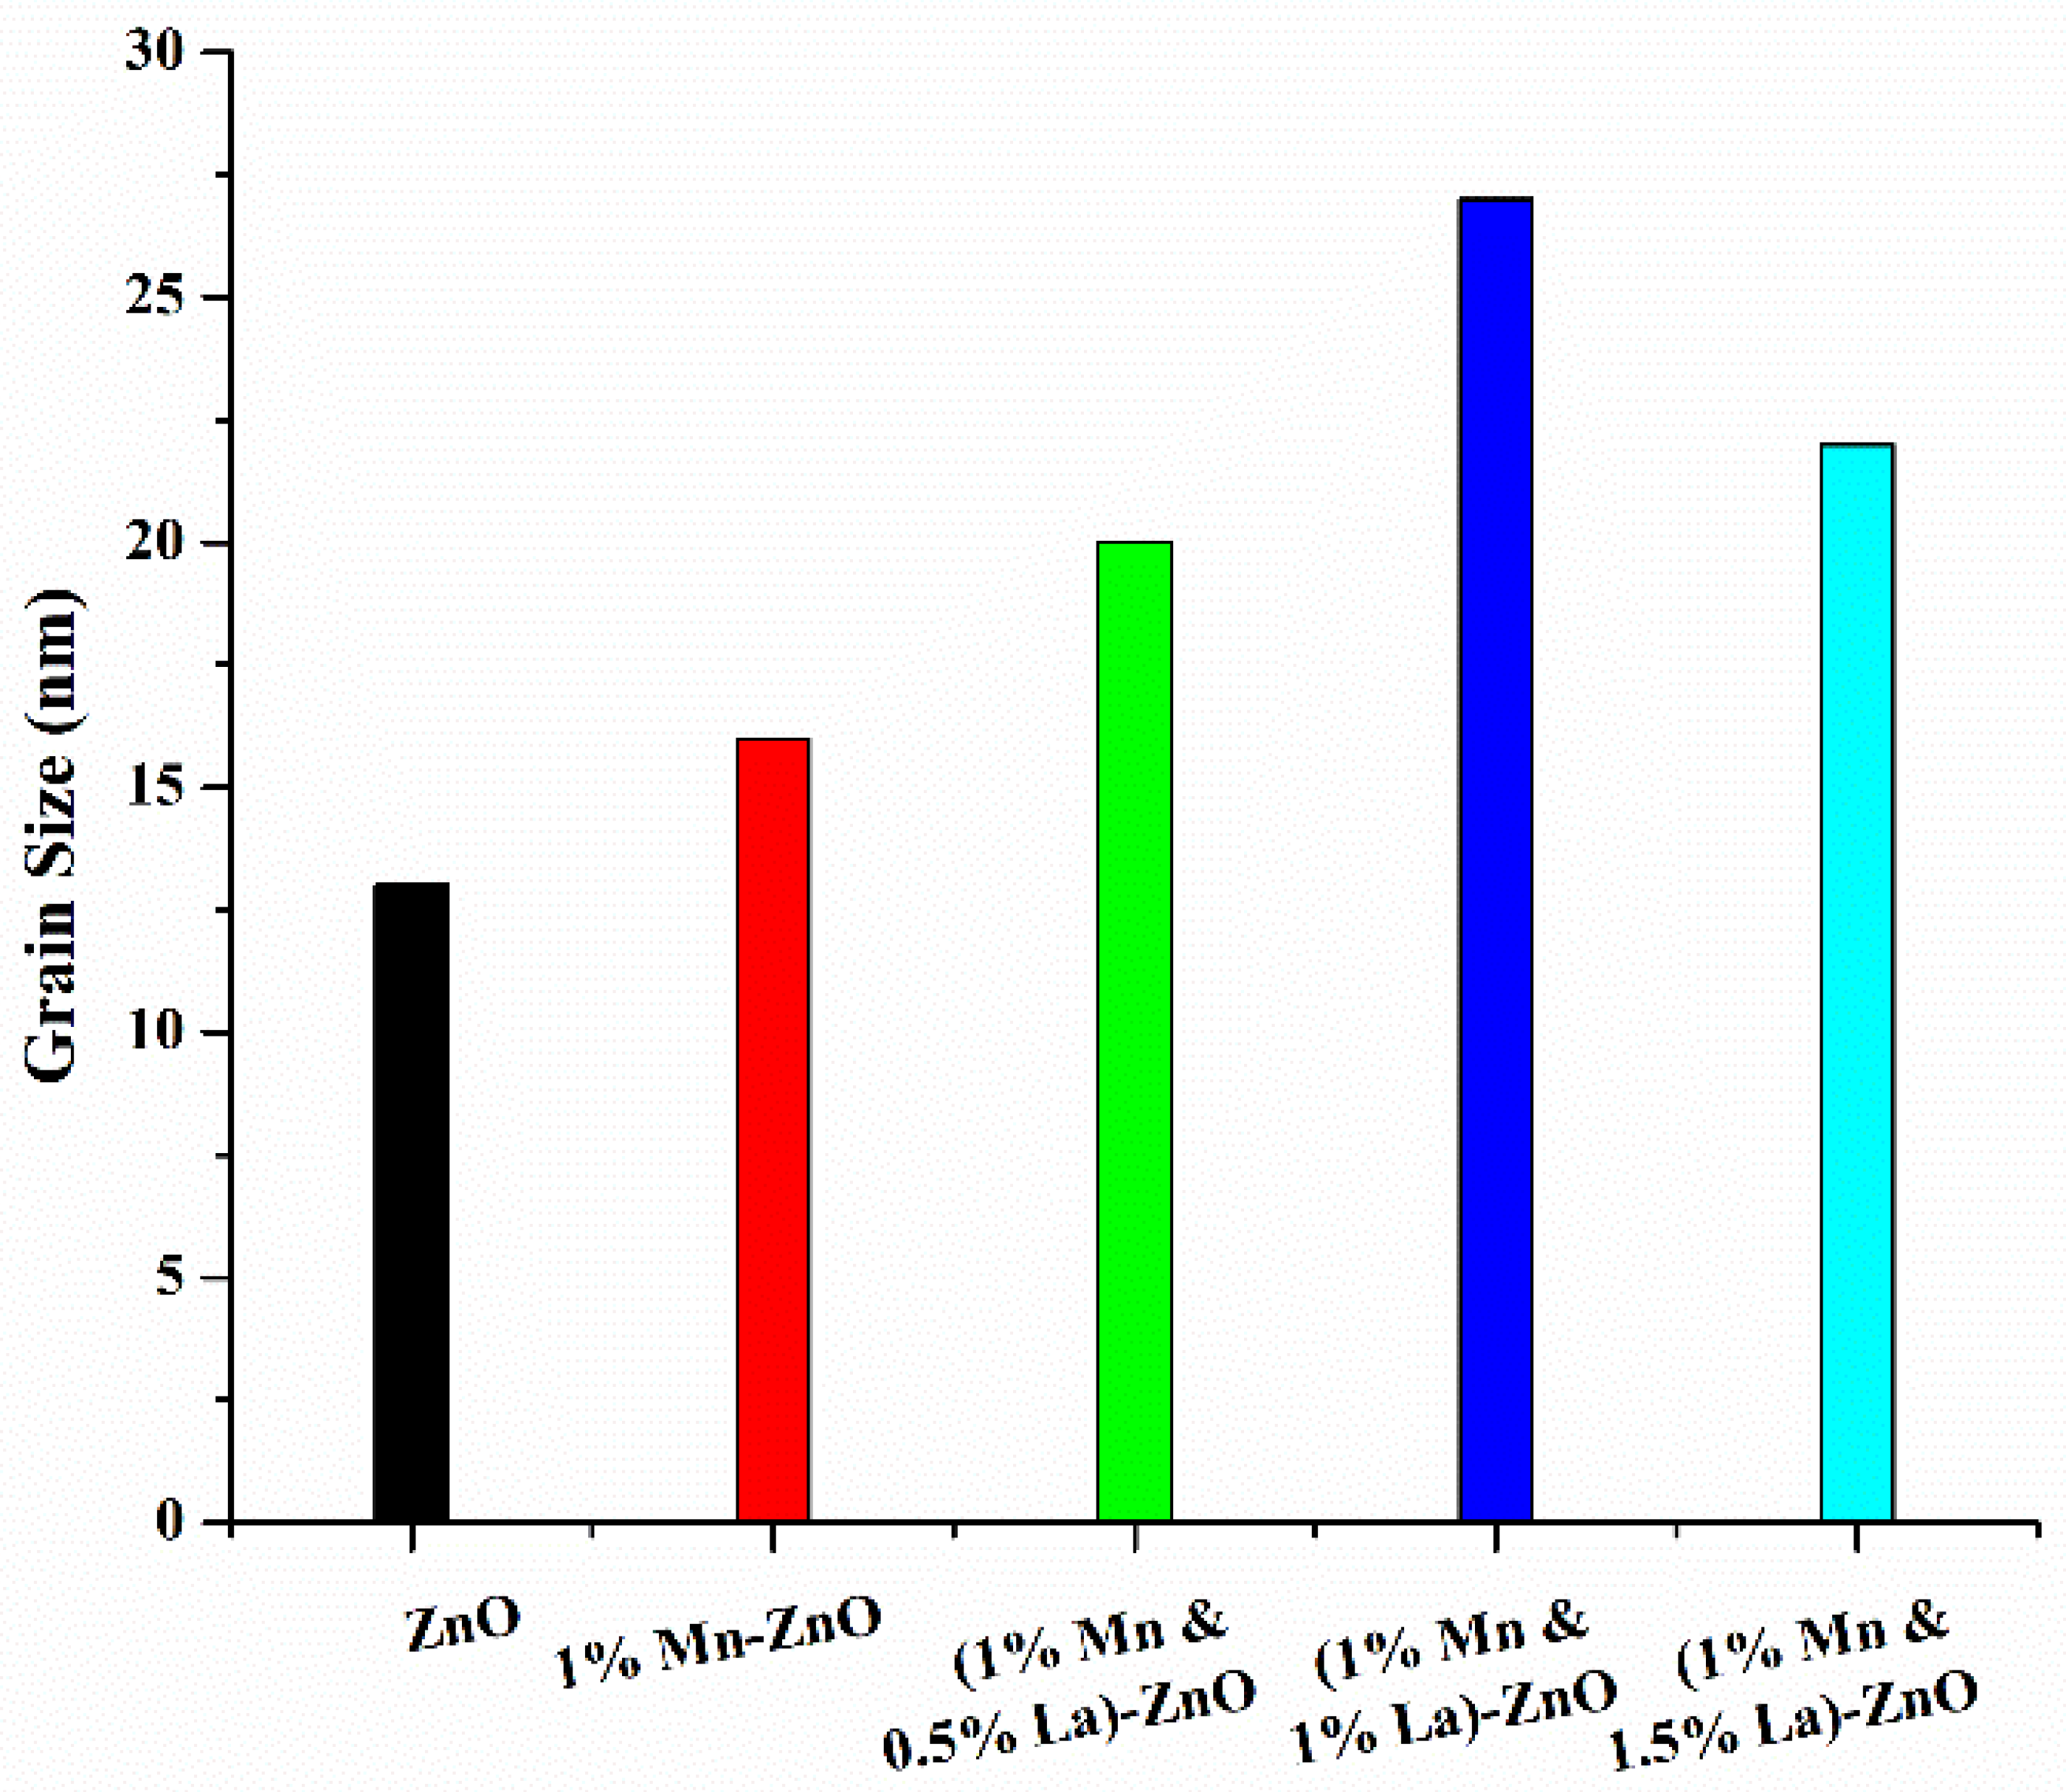
3.1.1. Grain Size
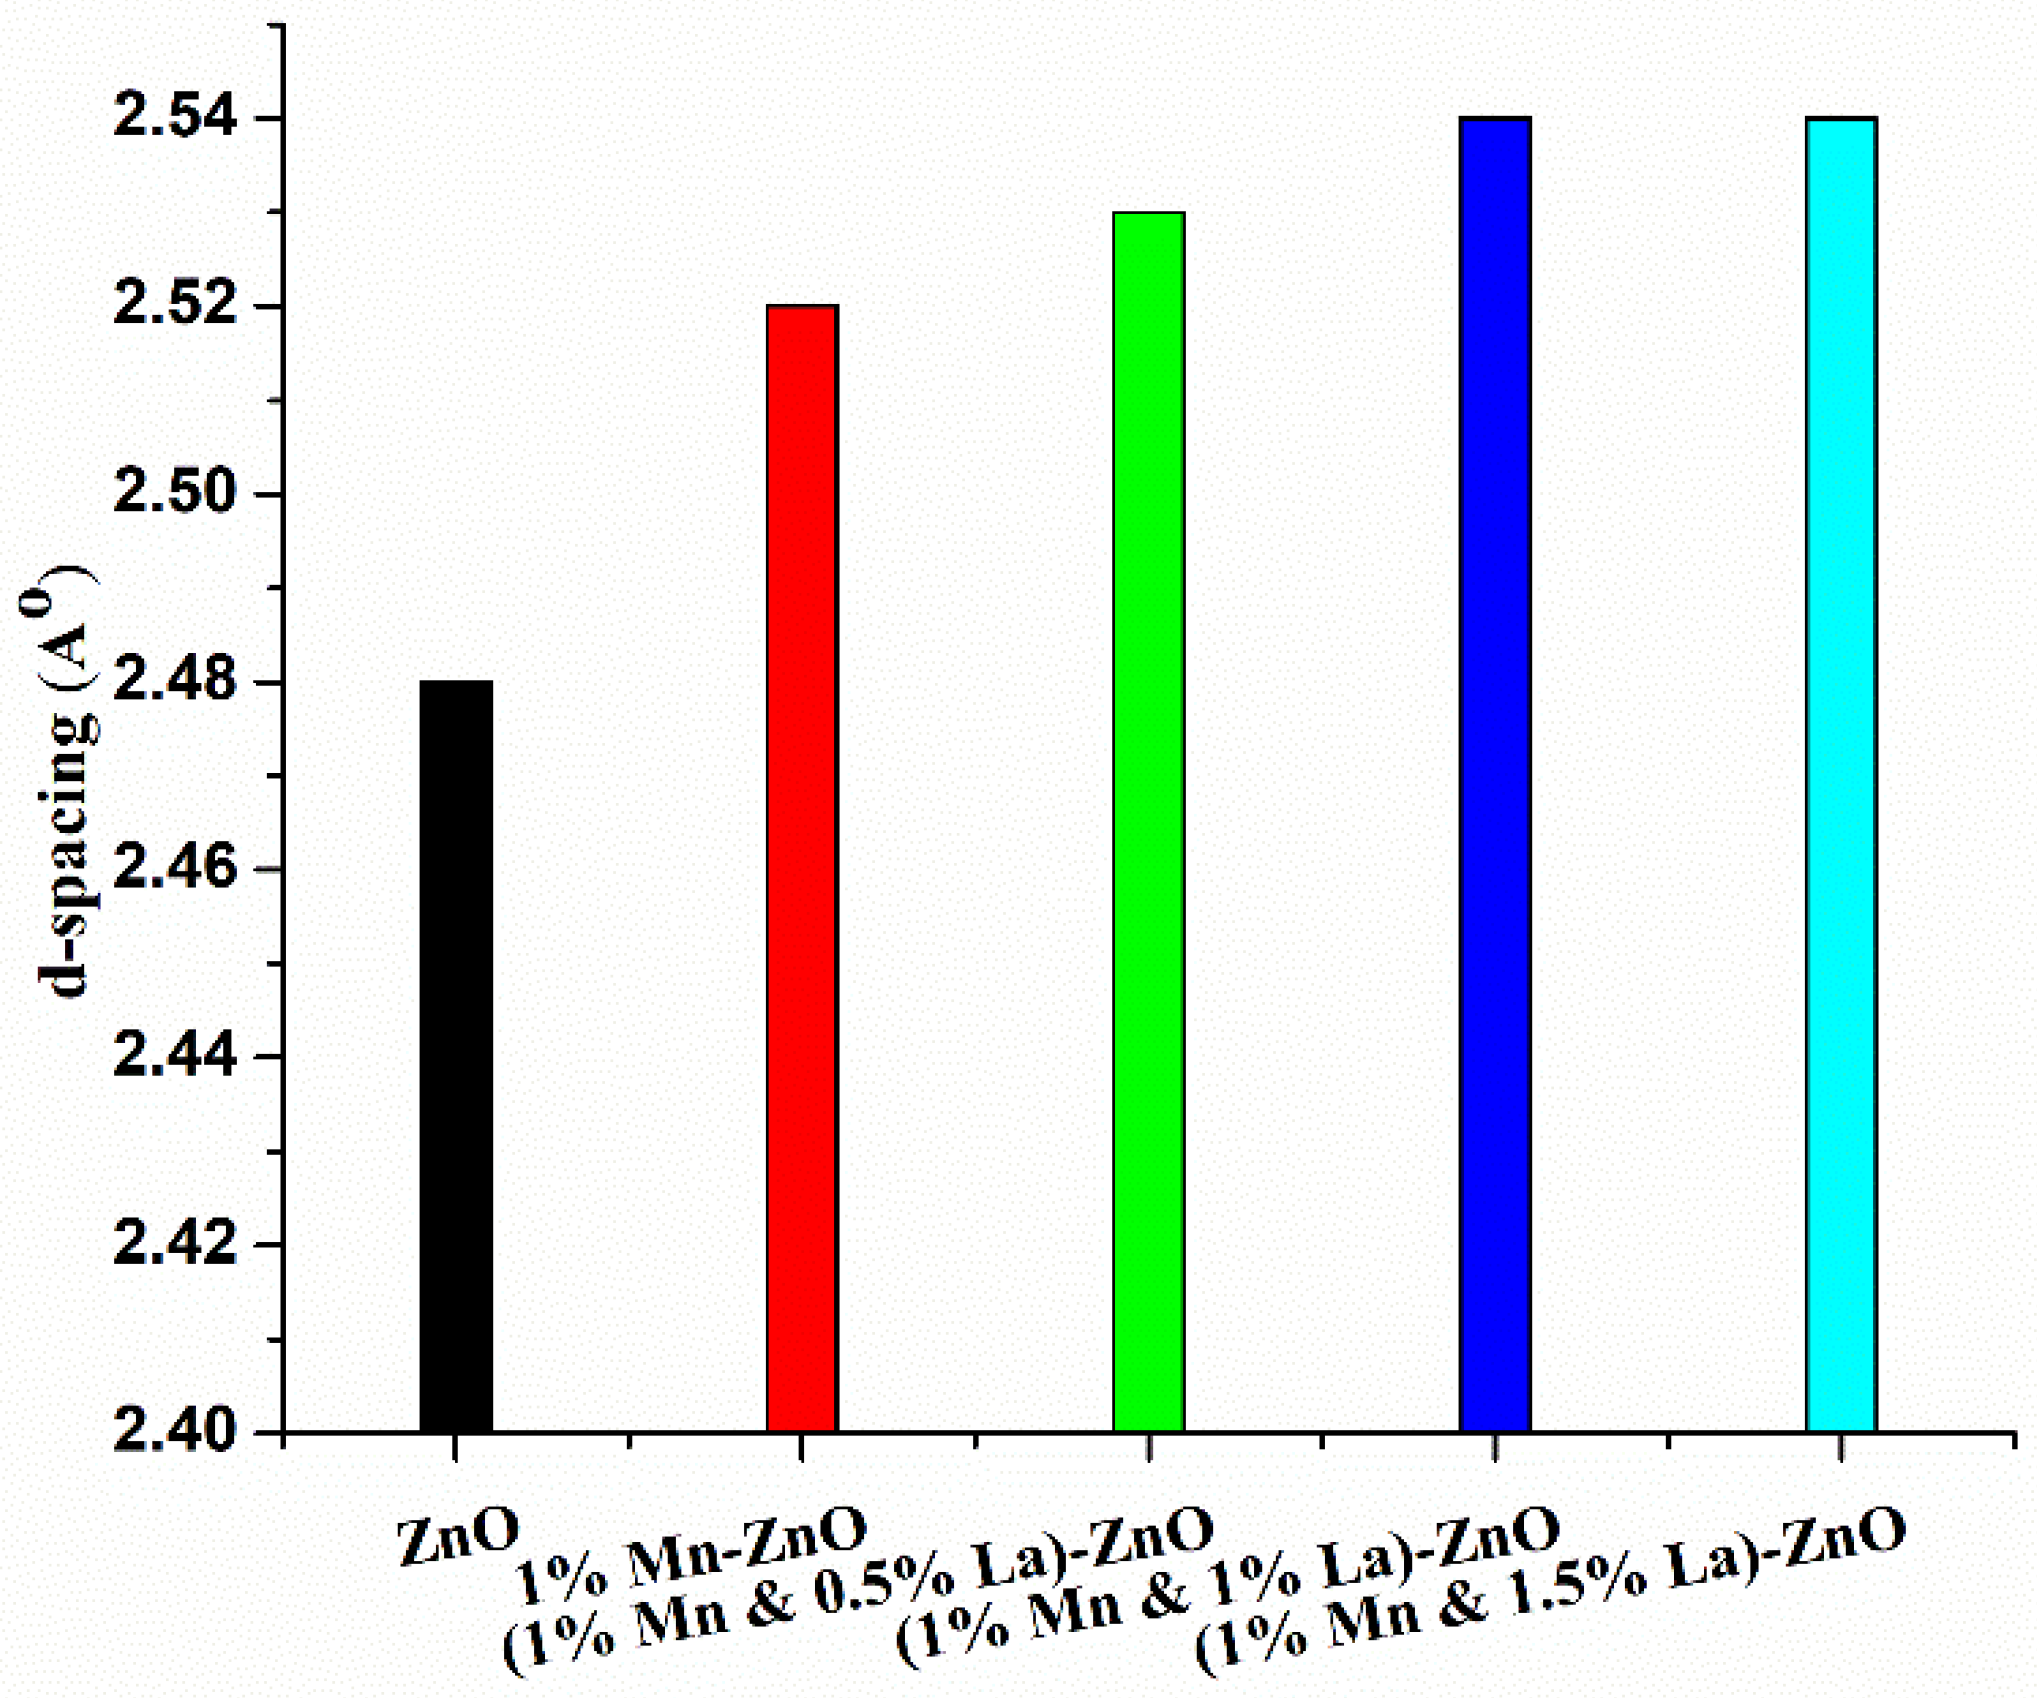
3.1.2. D-Spacing
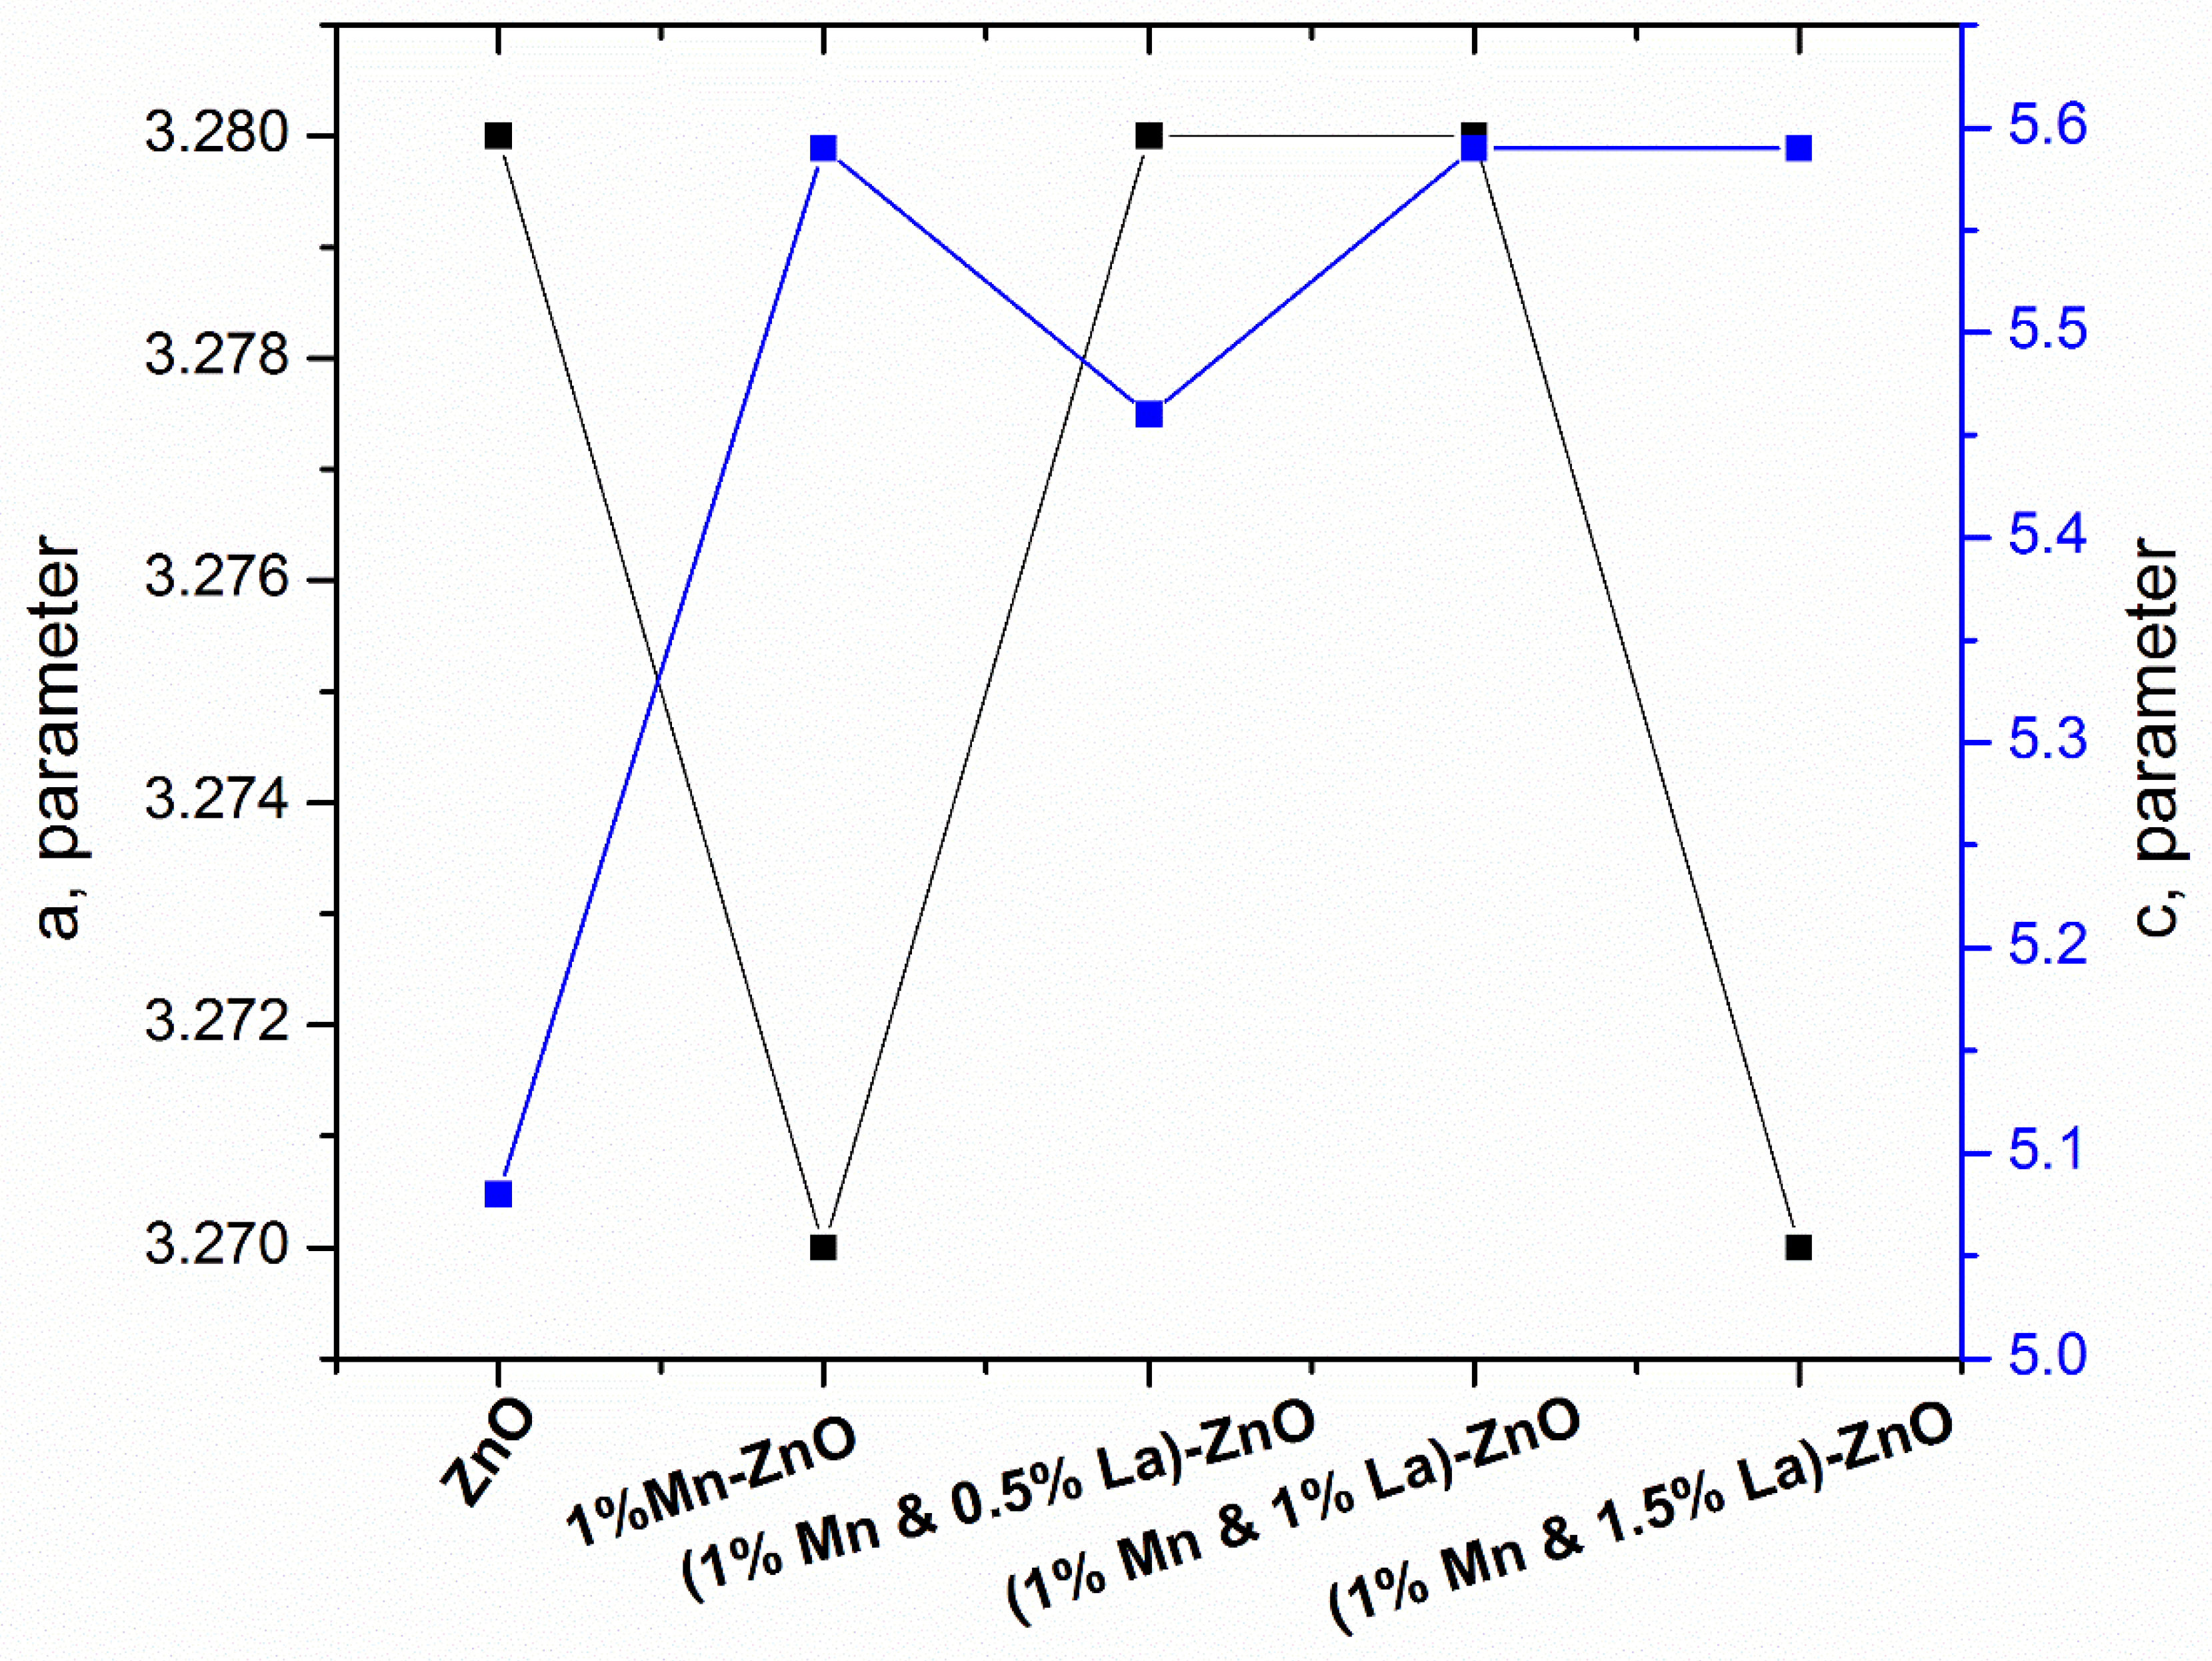
3.1.3. Lattice Parameter
3.1.4. Packing Fraction and Strain
3.1.5. Crystallinity
3.1.6. Volume of Unit Cell, Bond Length, and Lattice Distortion
3.2. UV–Vis Analysis
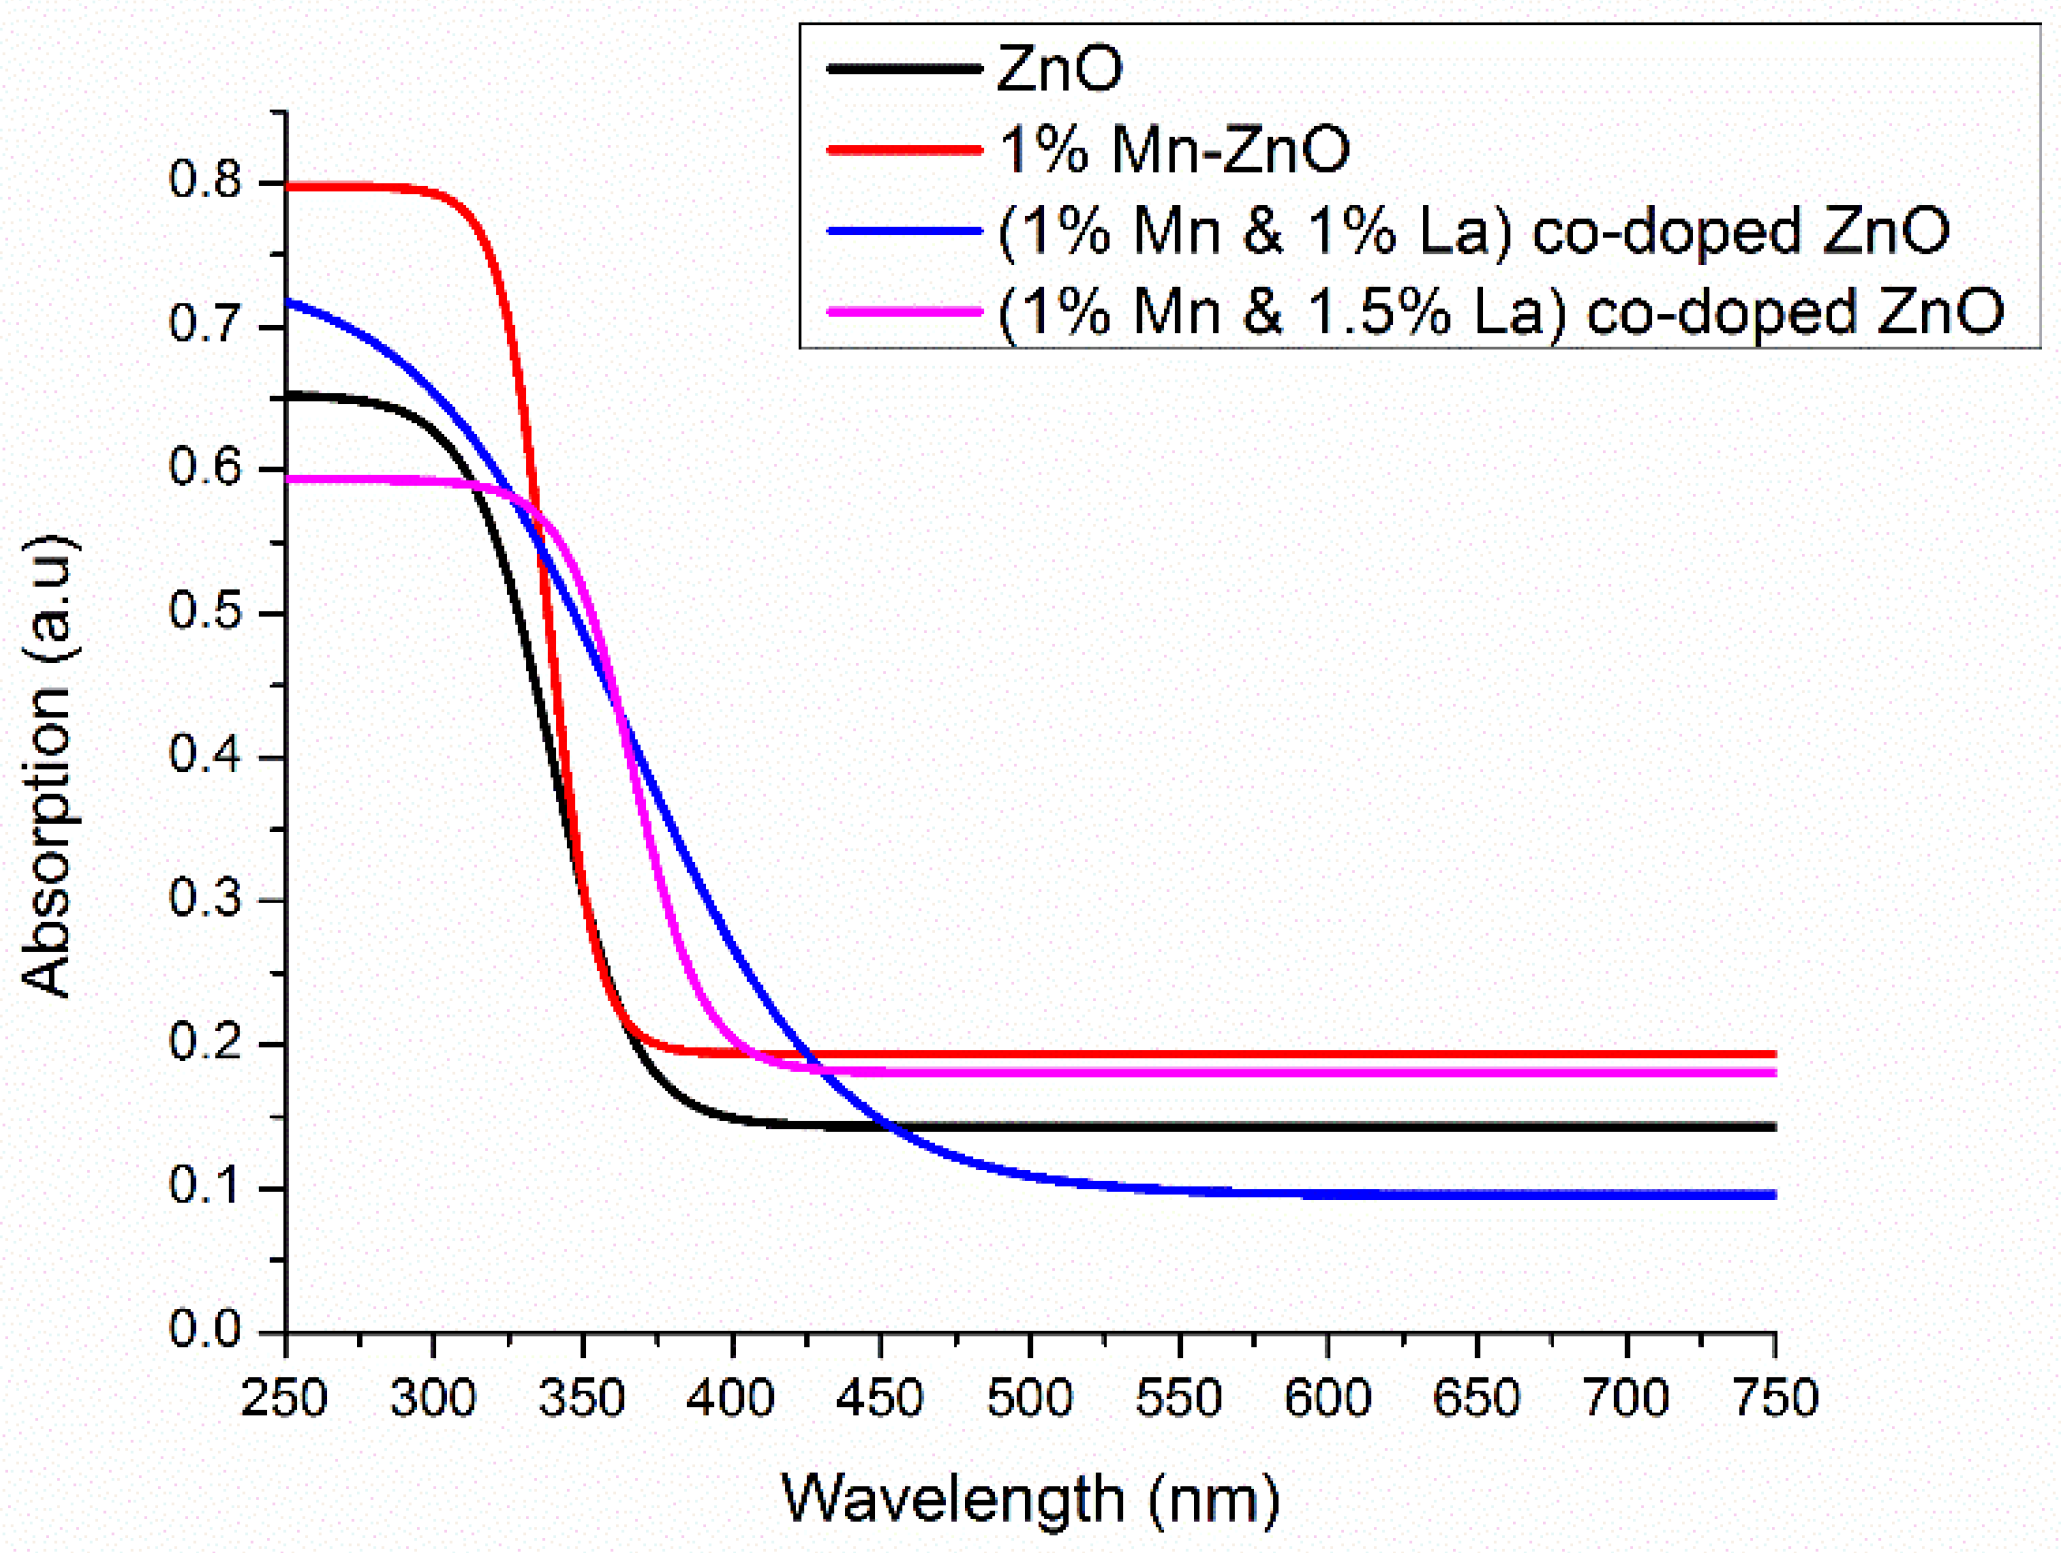
3.2.1. Absorbance
3.2.2. Band Gap Calculation
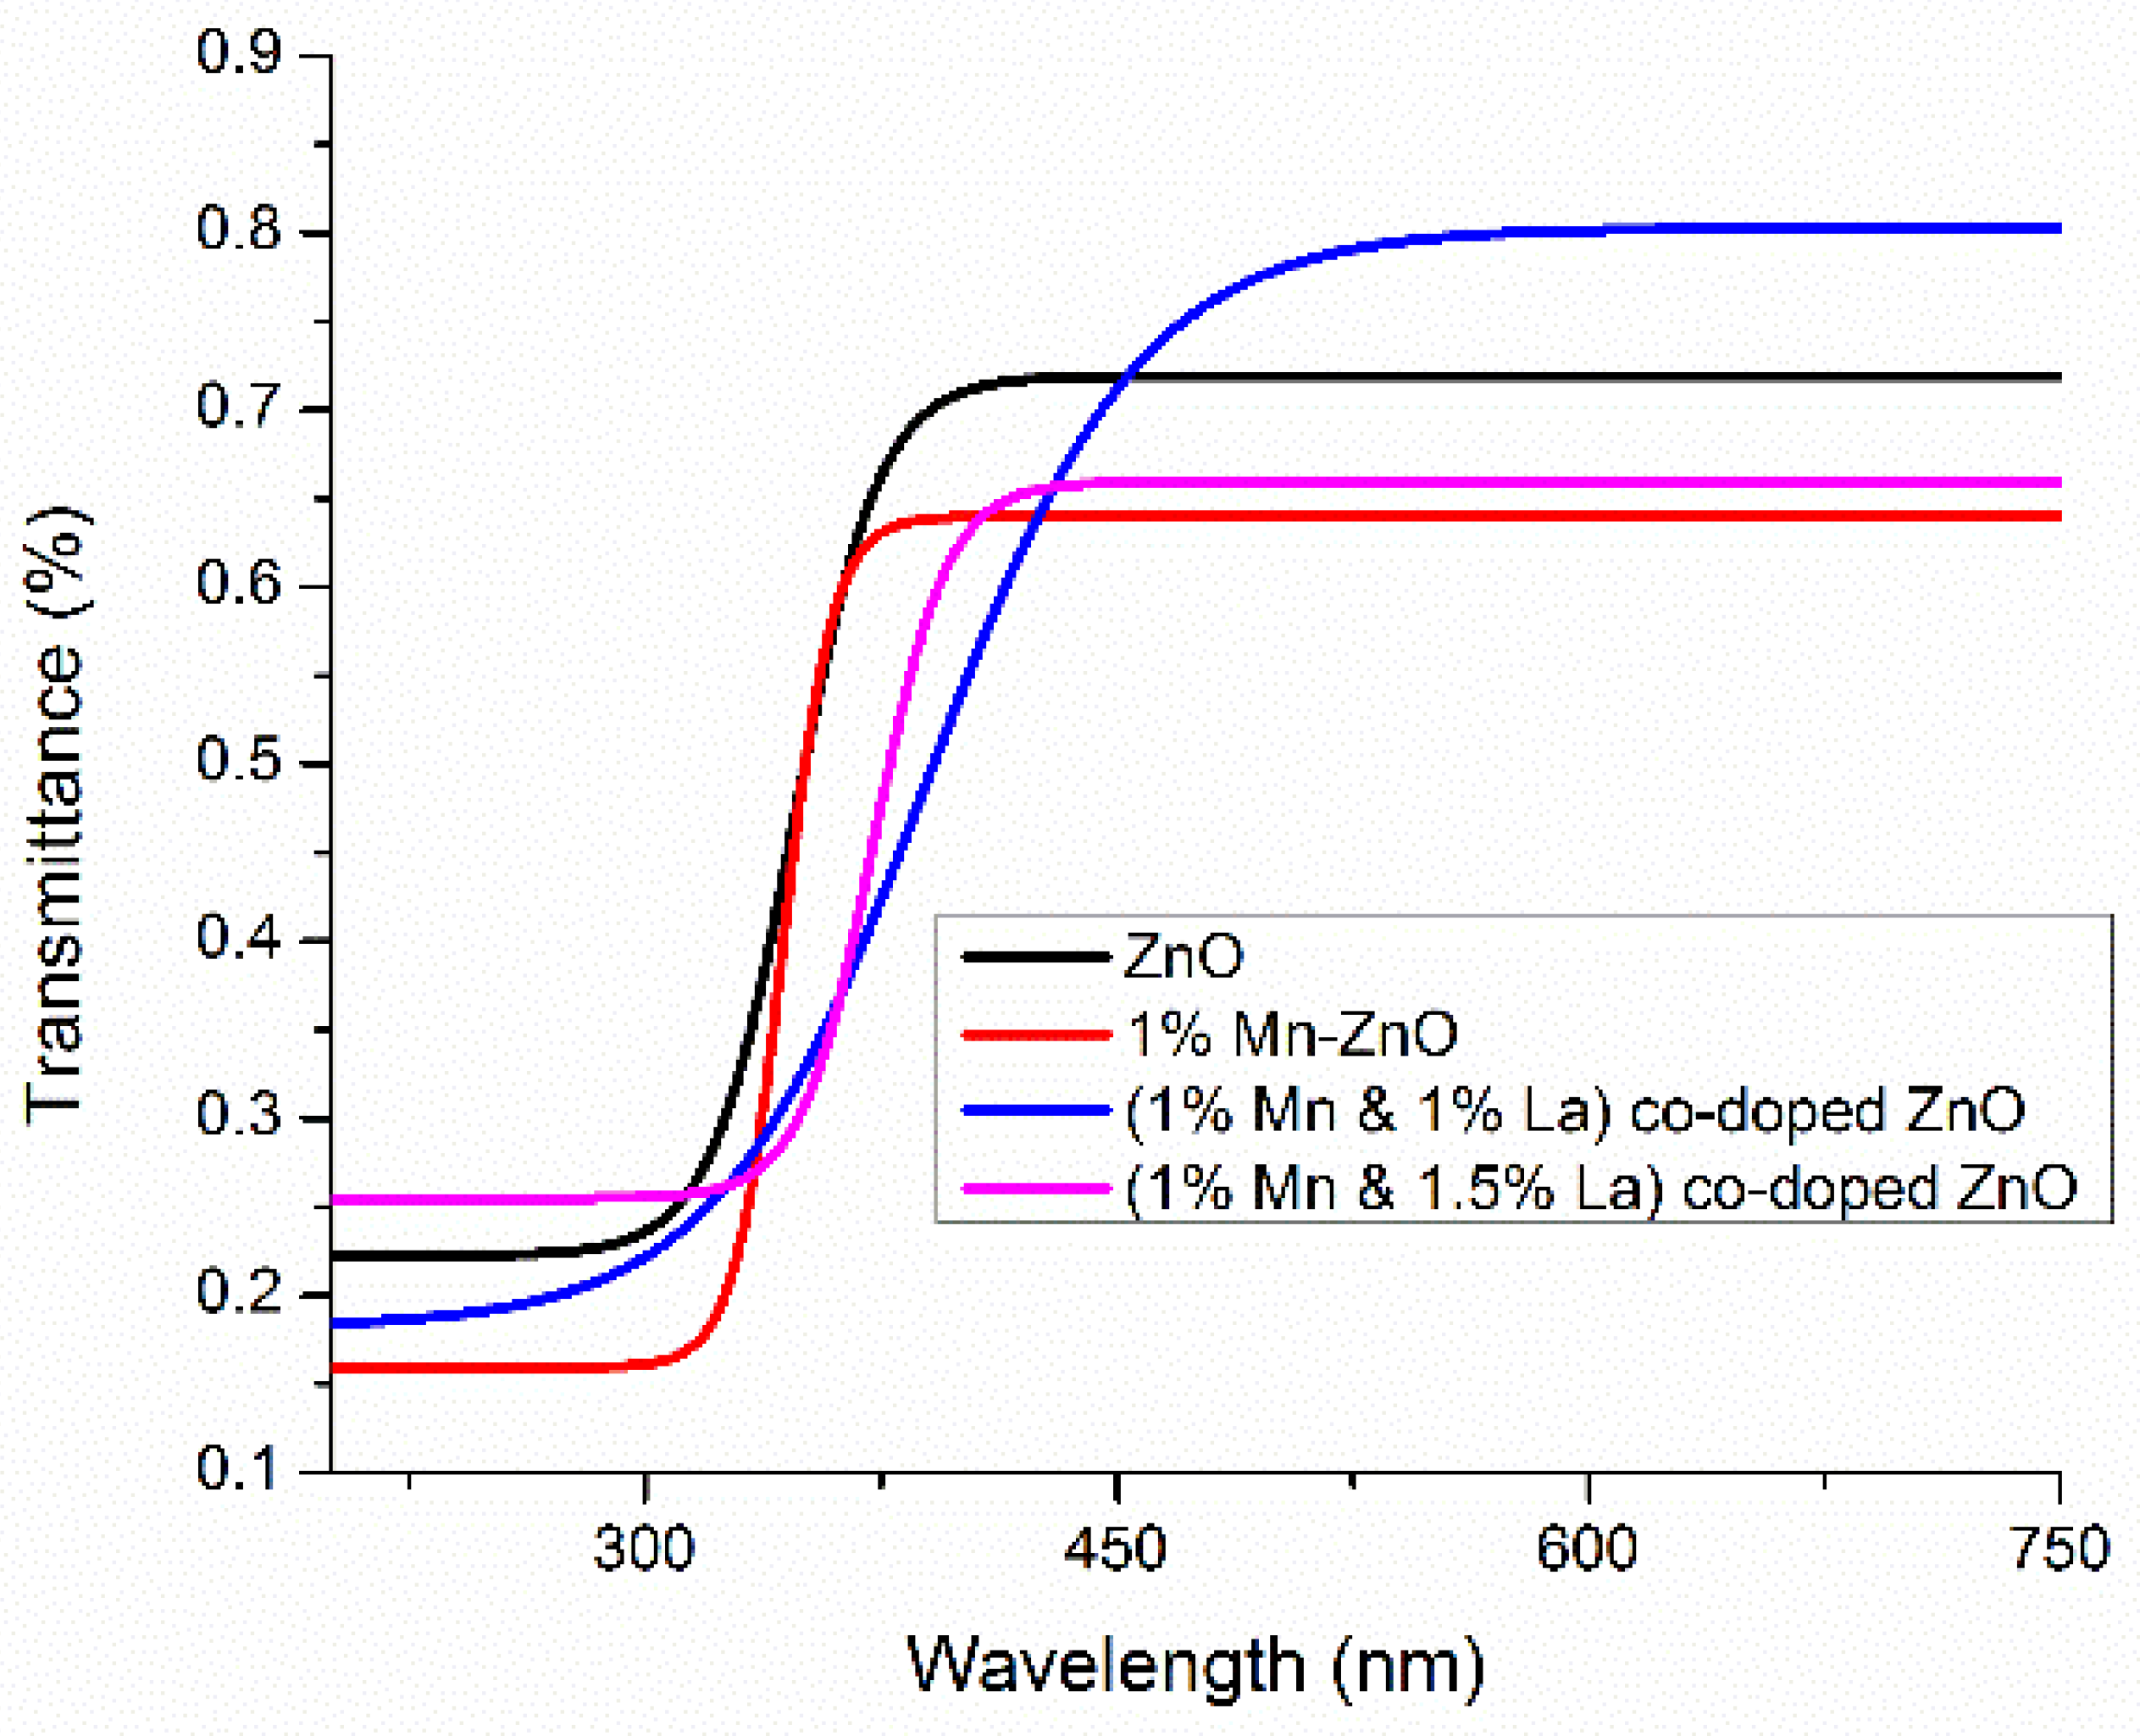
3.2.3. Transmittance of the Films
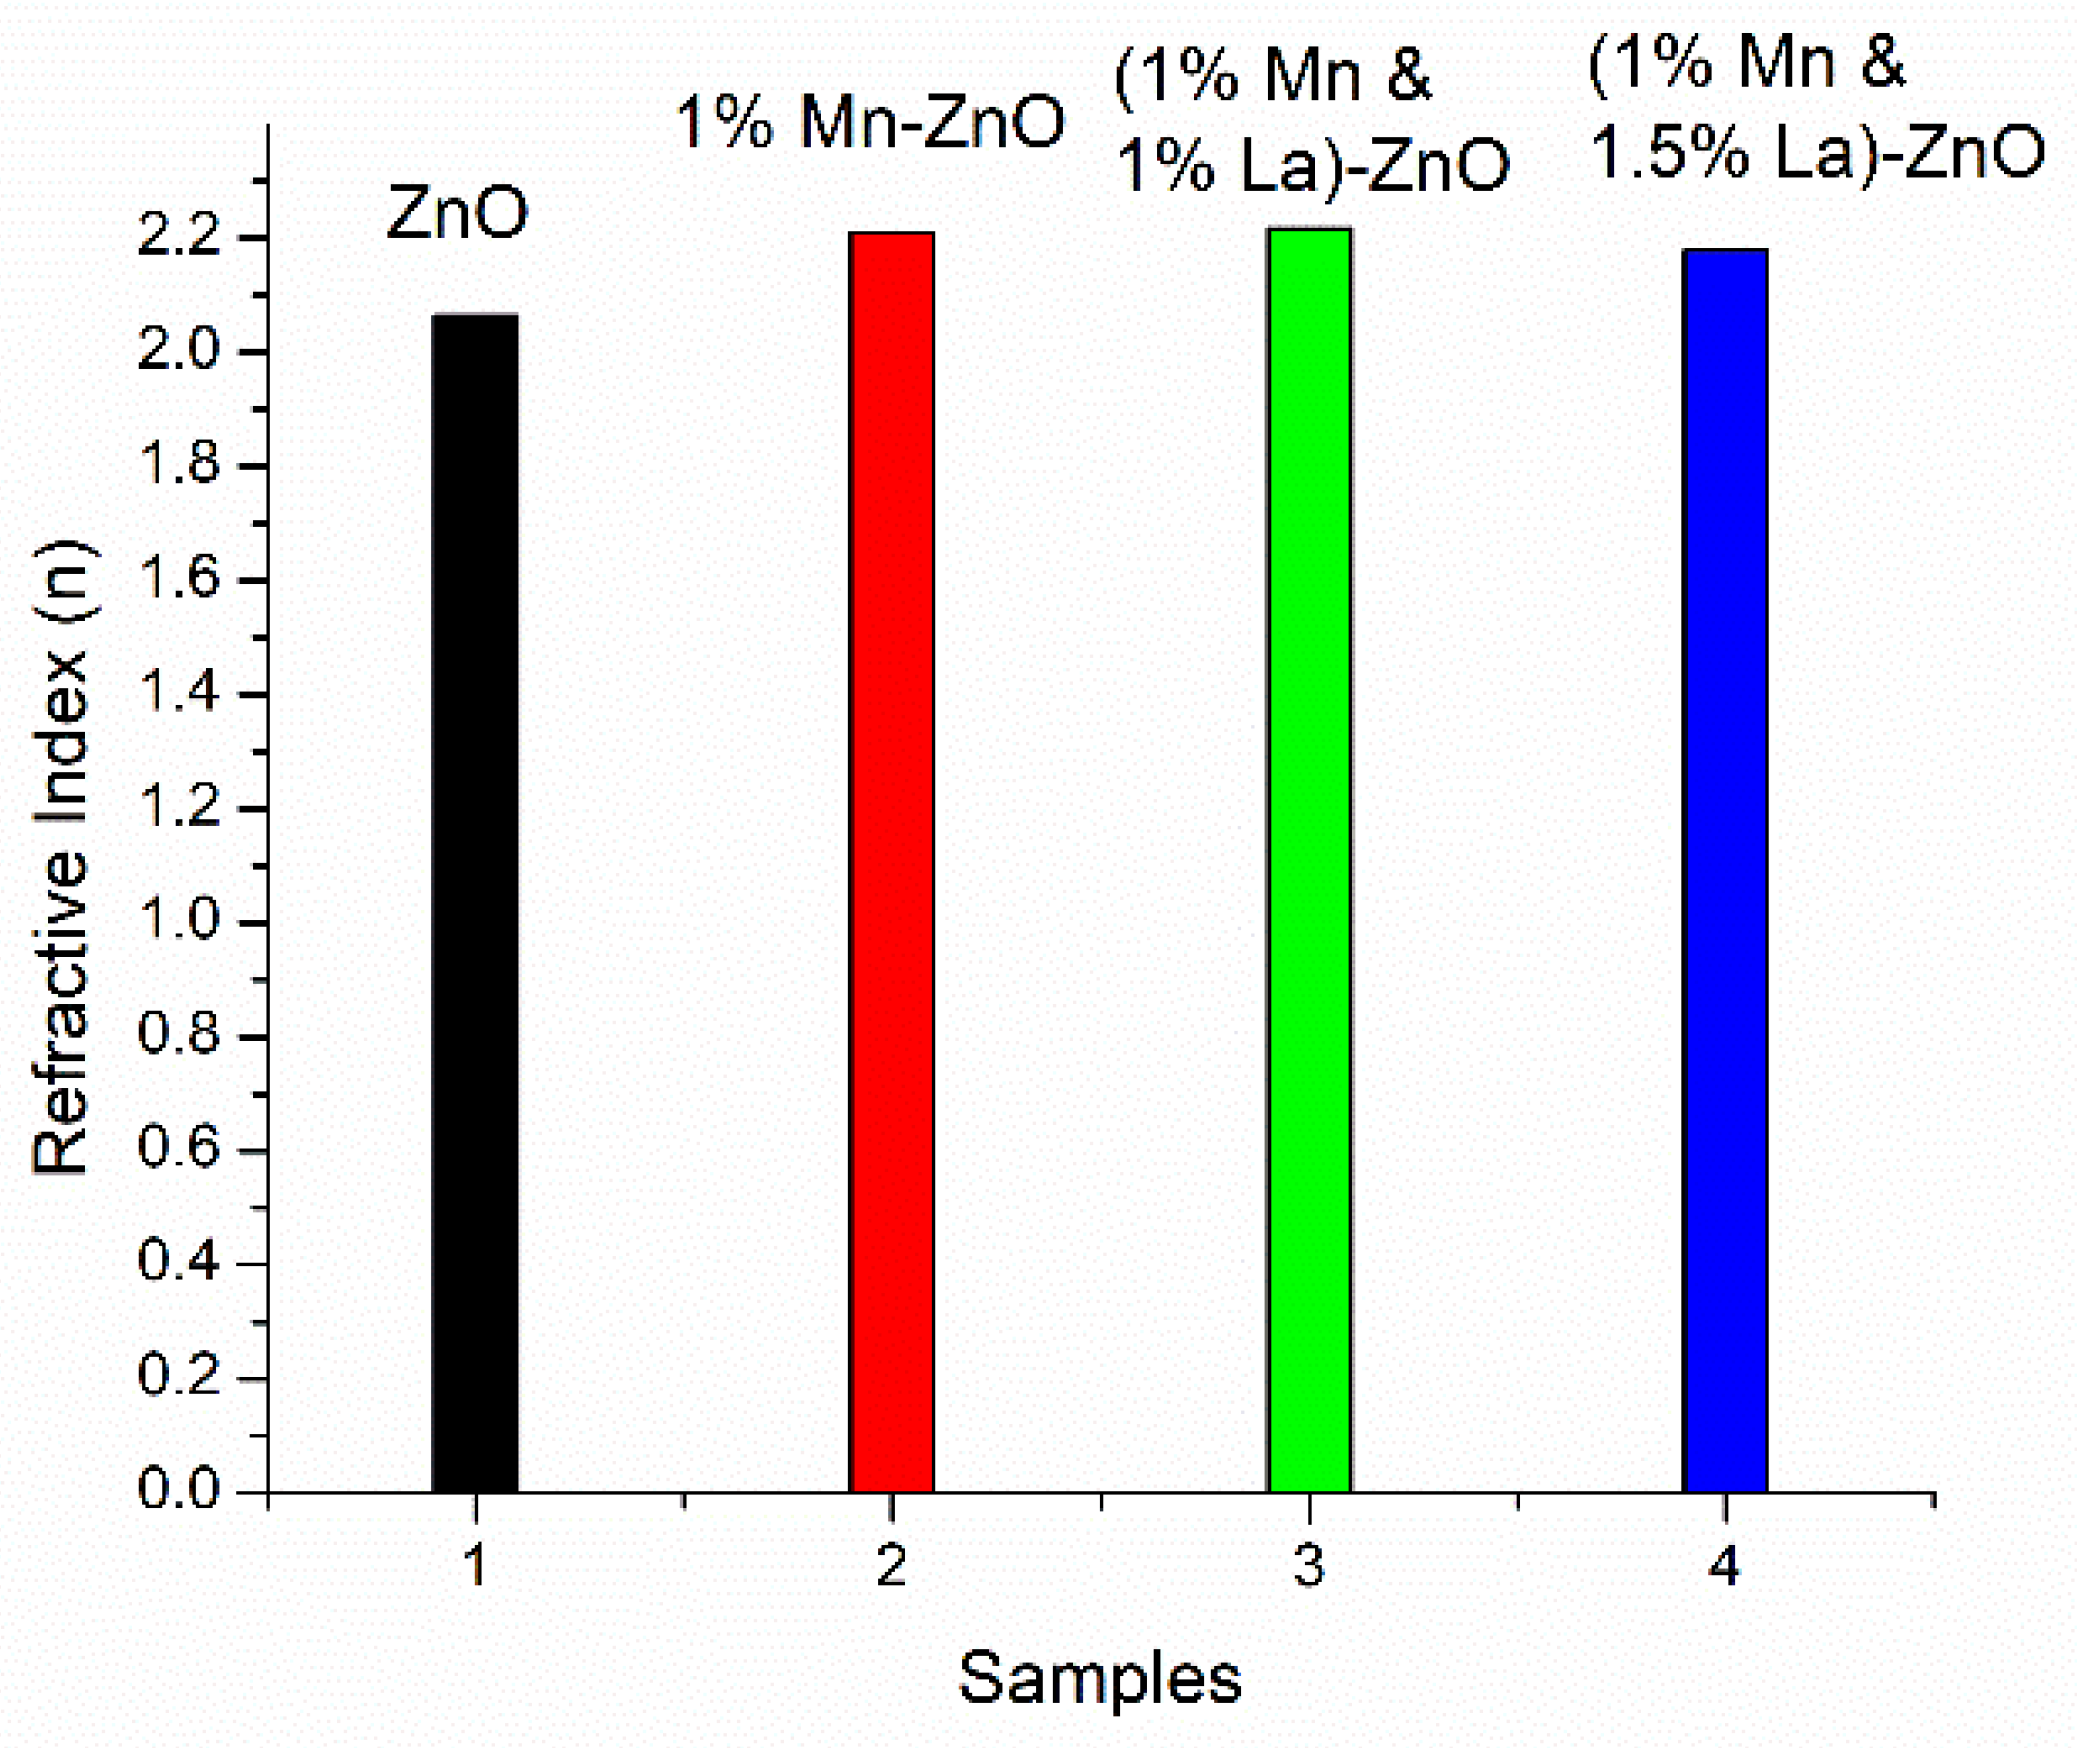
3.2.4. Refractive Index
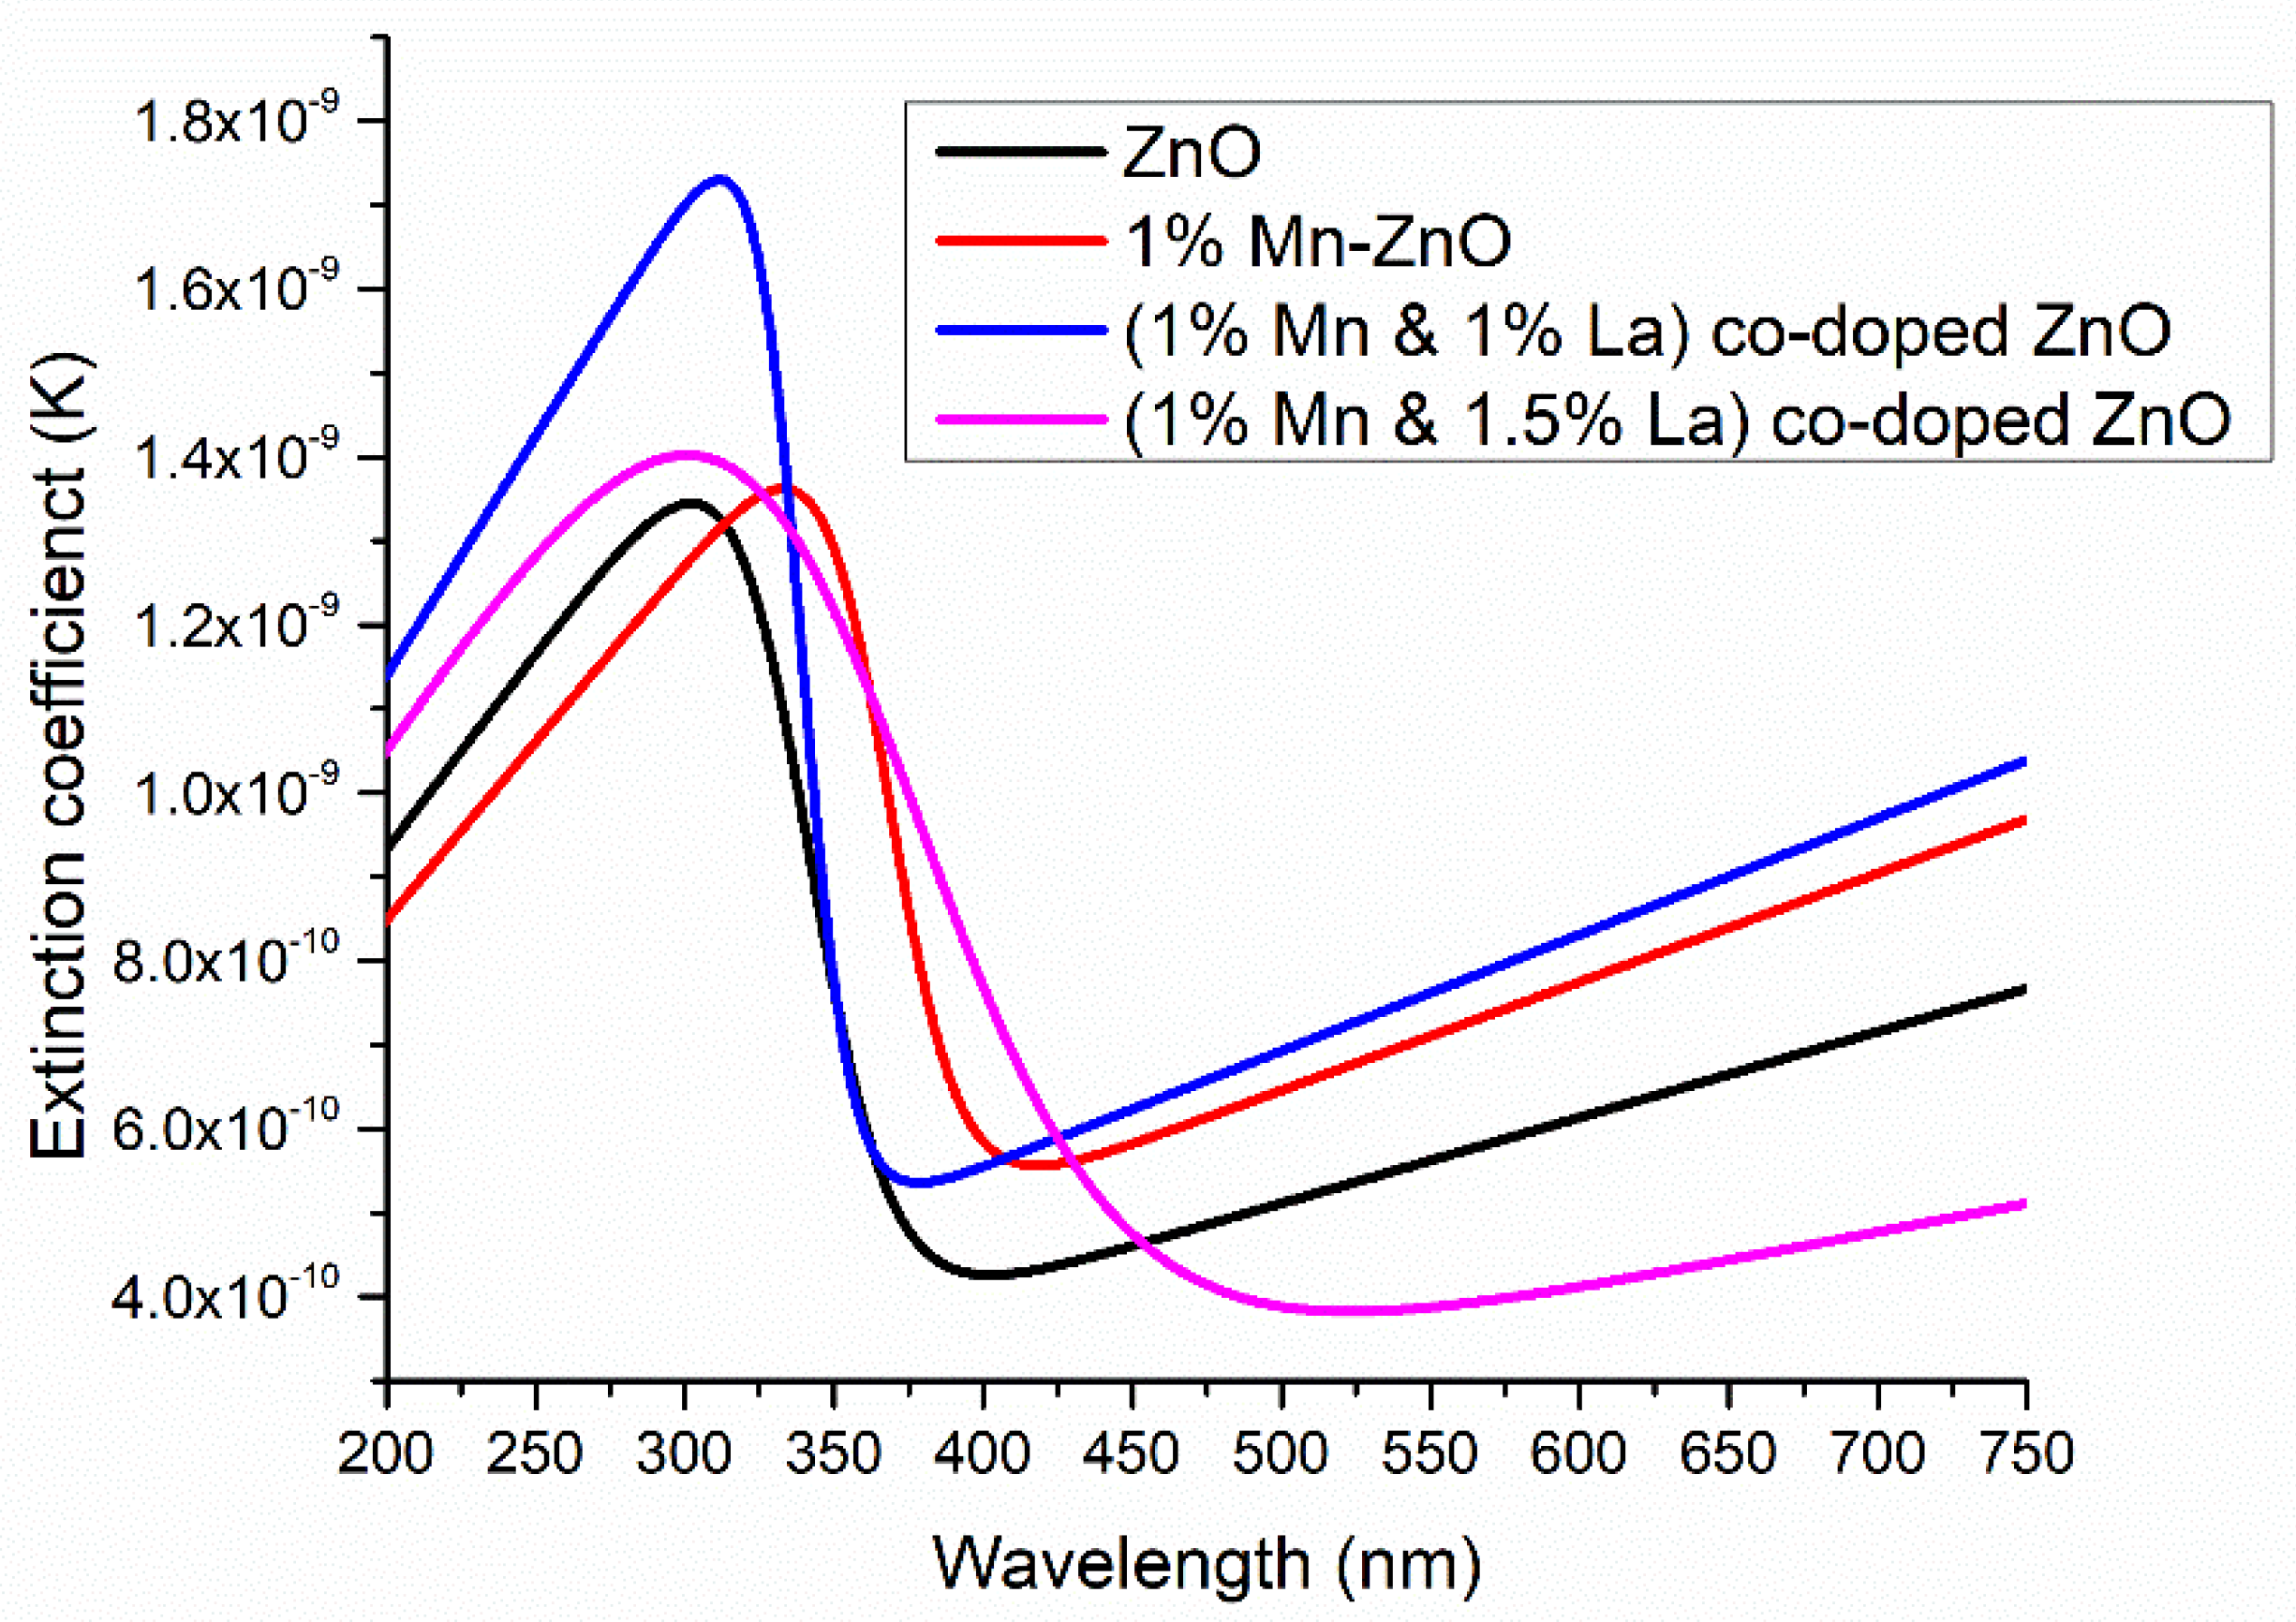
3.2.5. Extinction Coefficient (k)
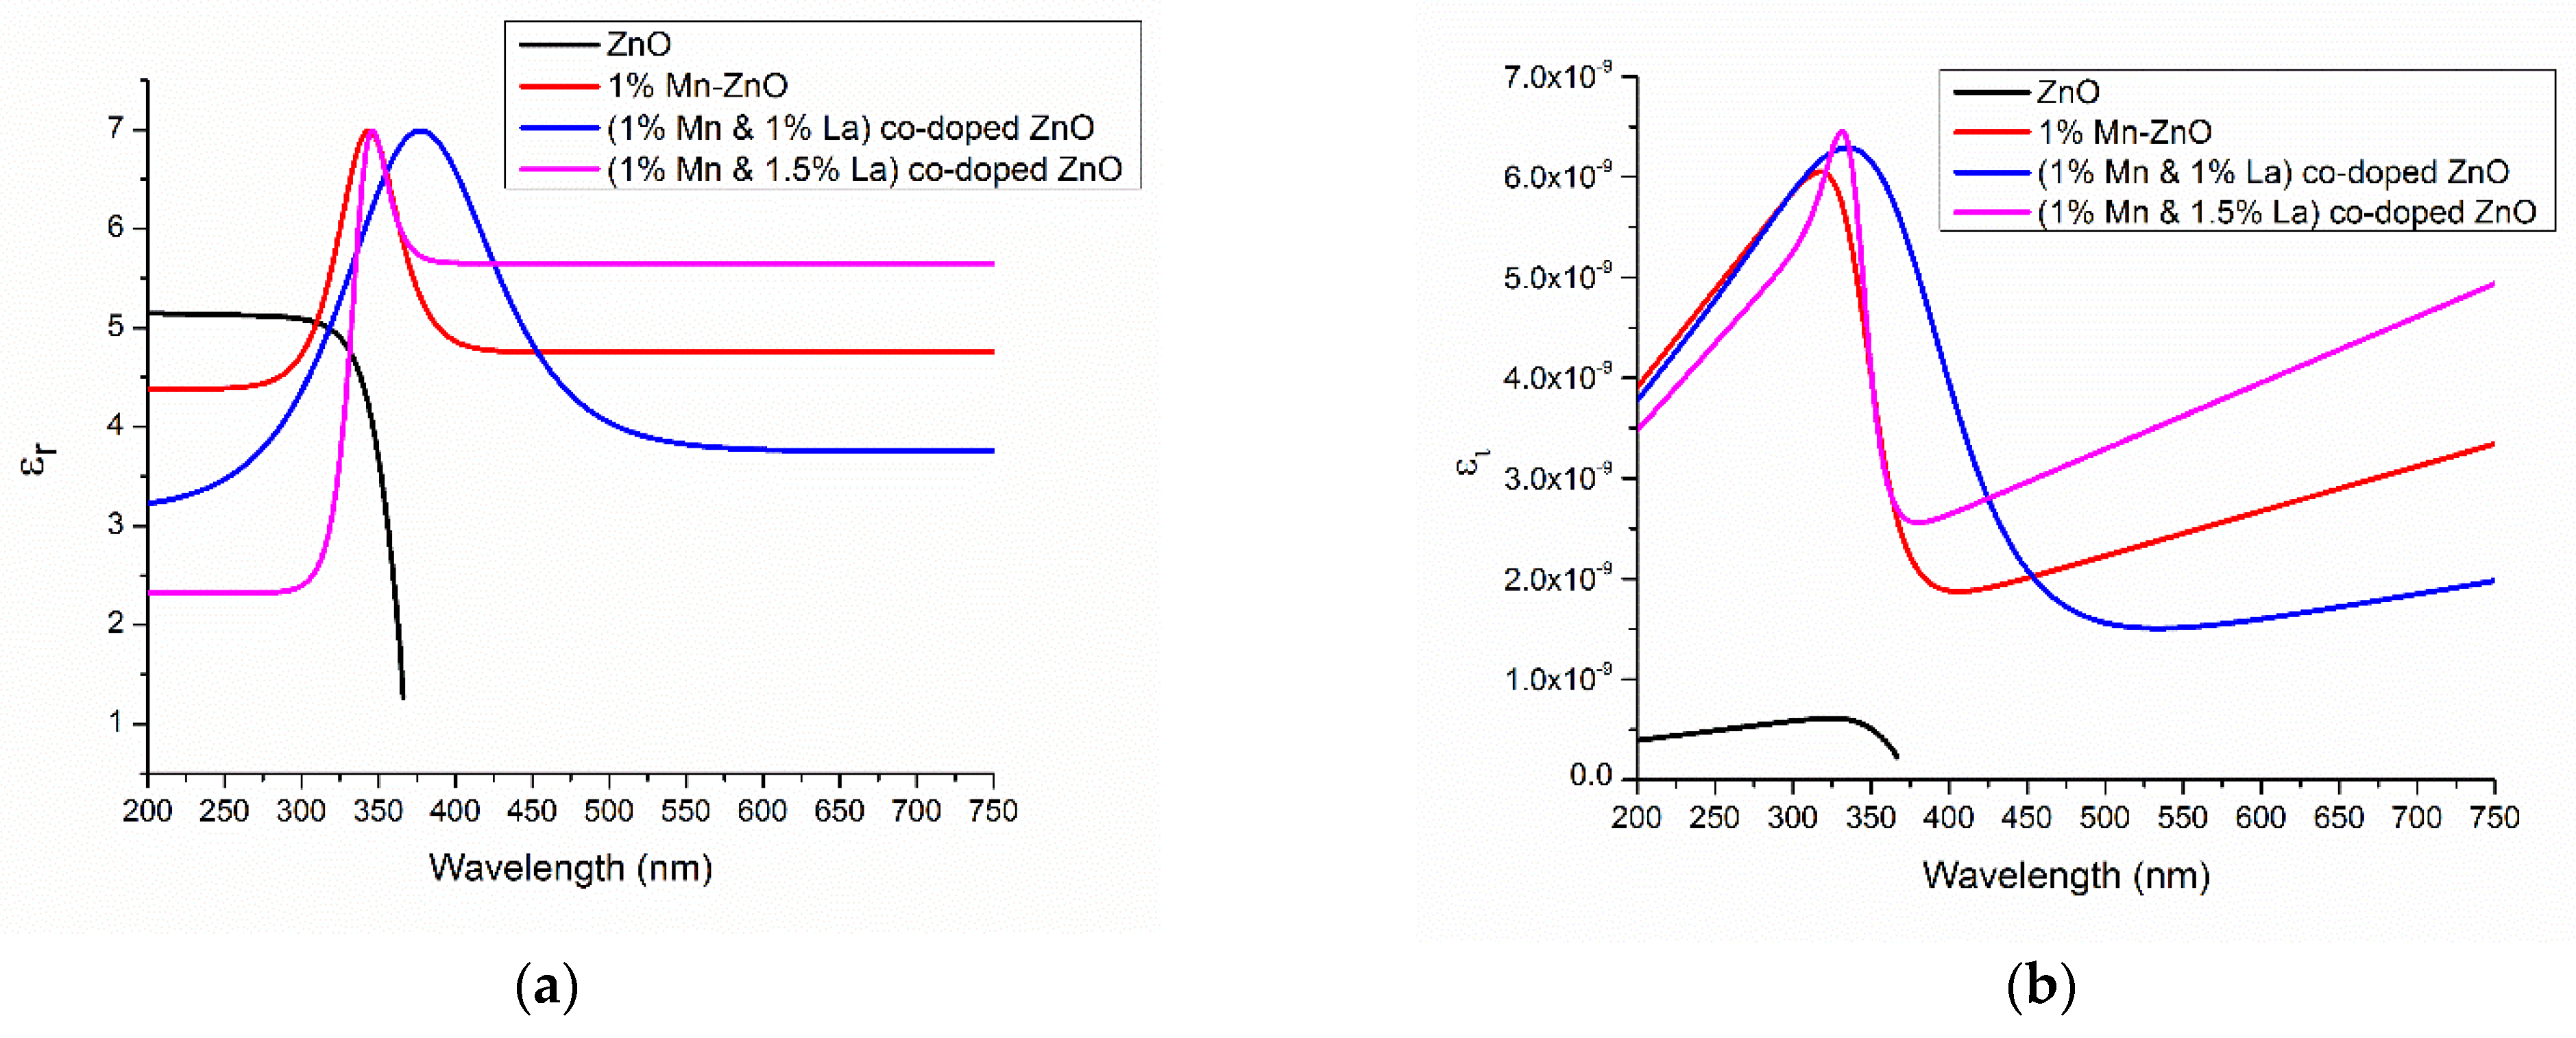
3.2.6. Dielectric Constants (εr and εi)
3.2.7. Conduction and Valence Band Energy
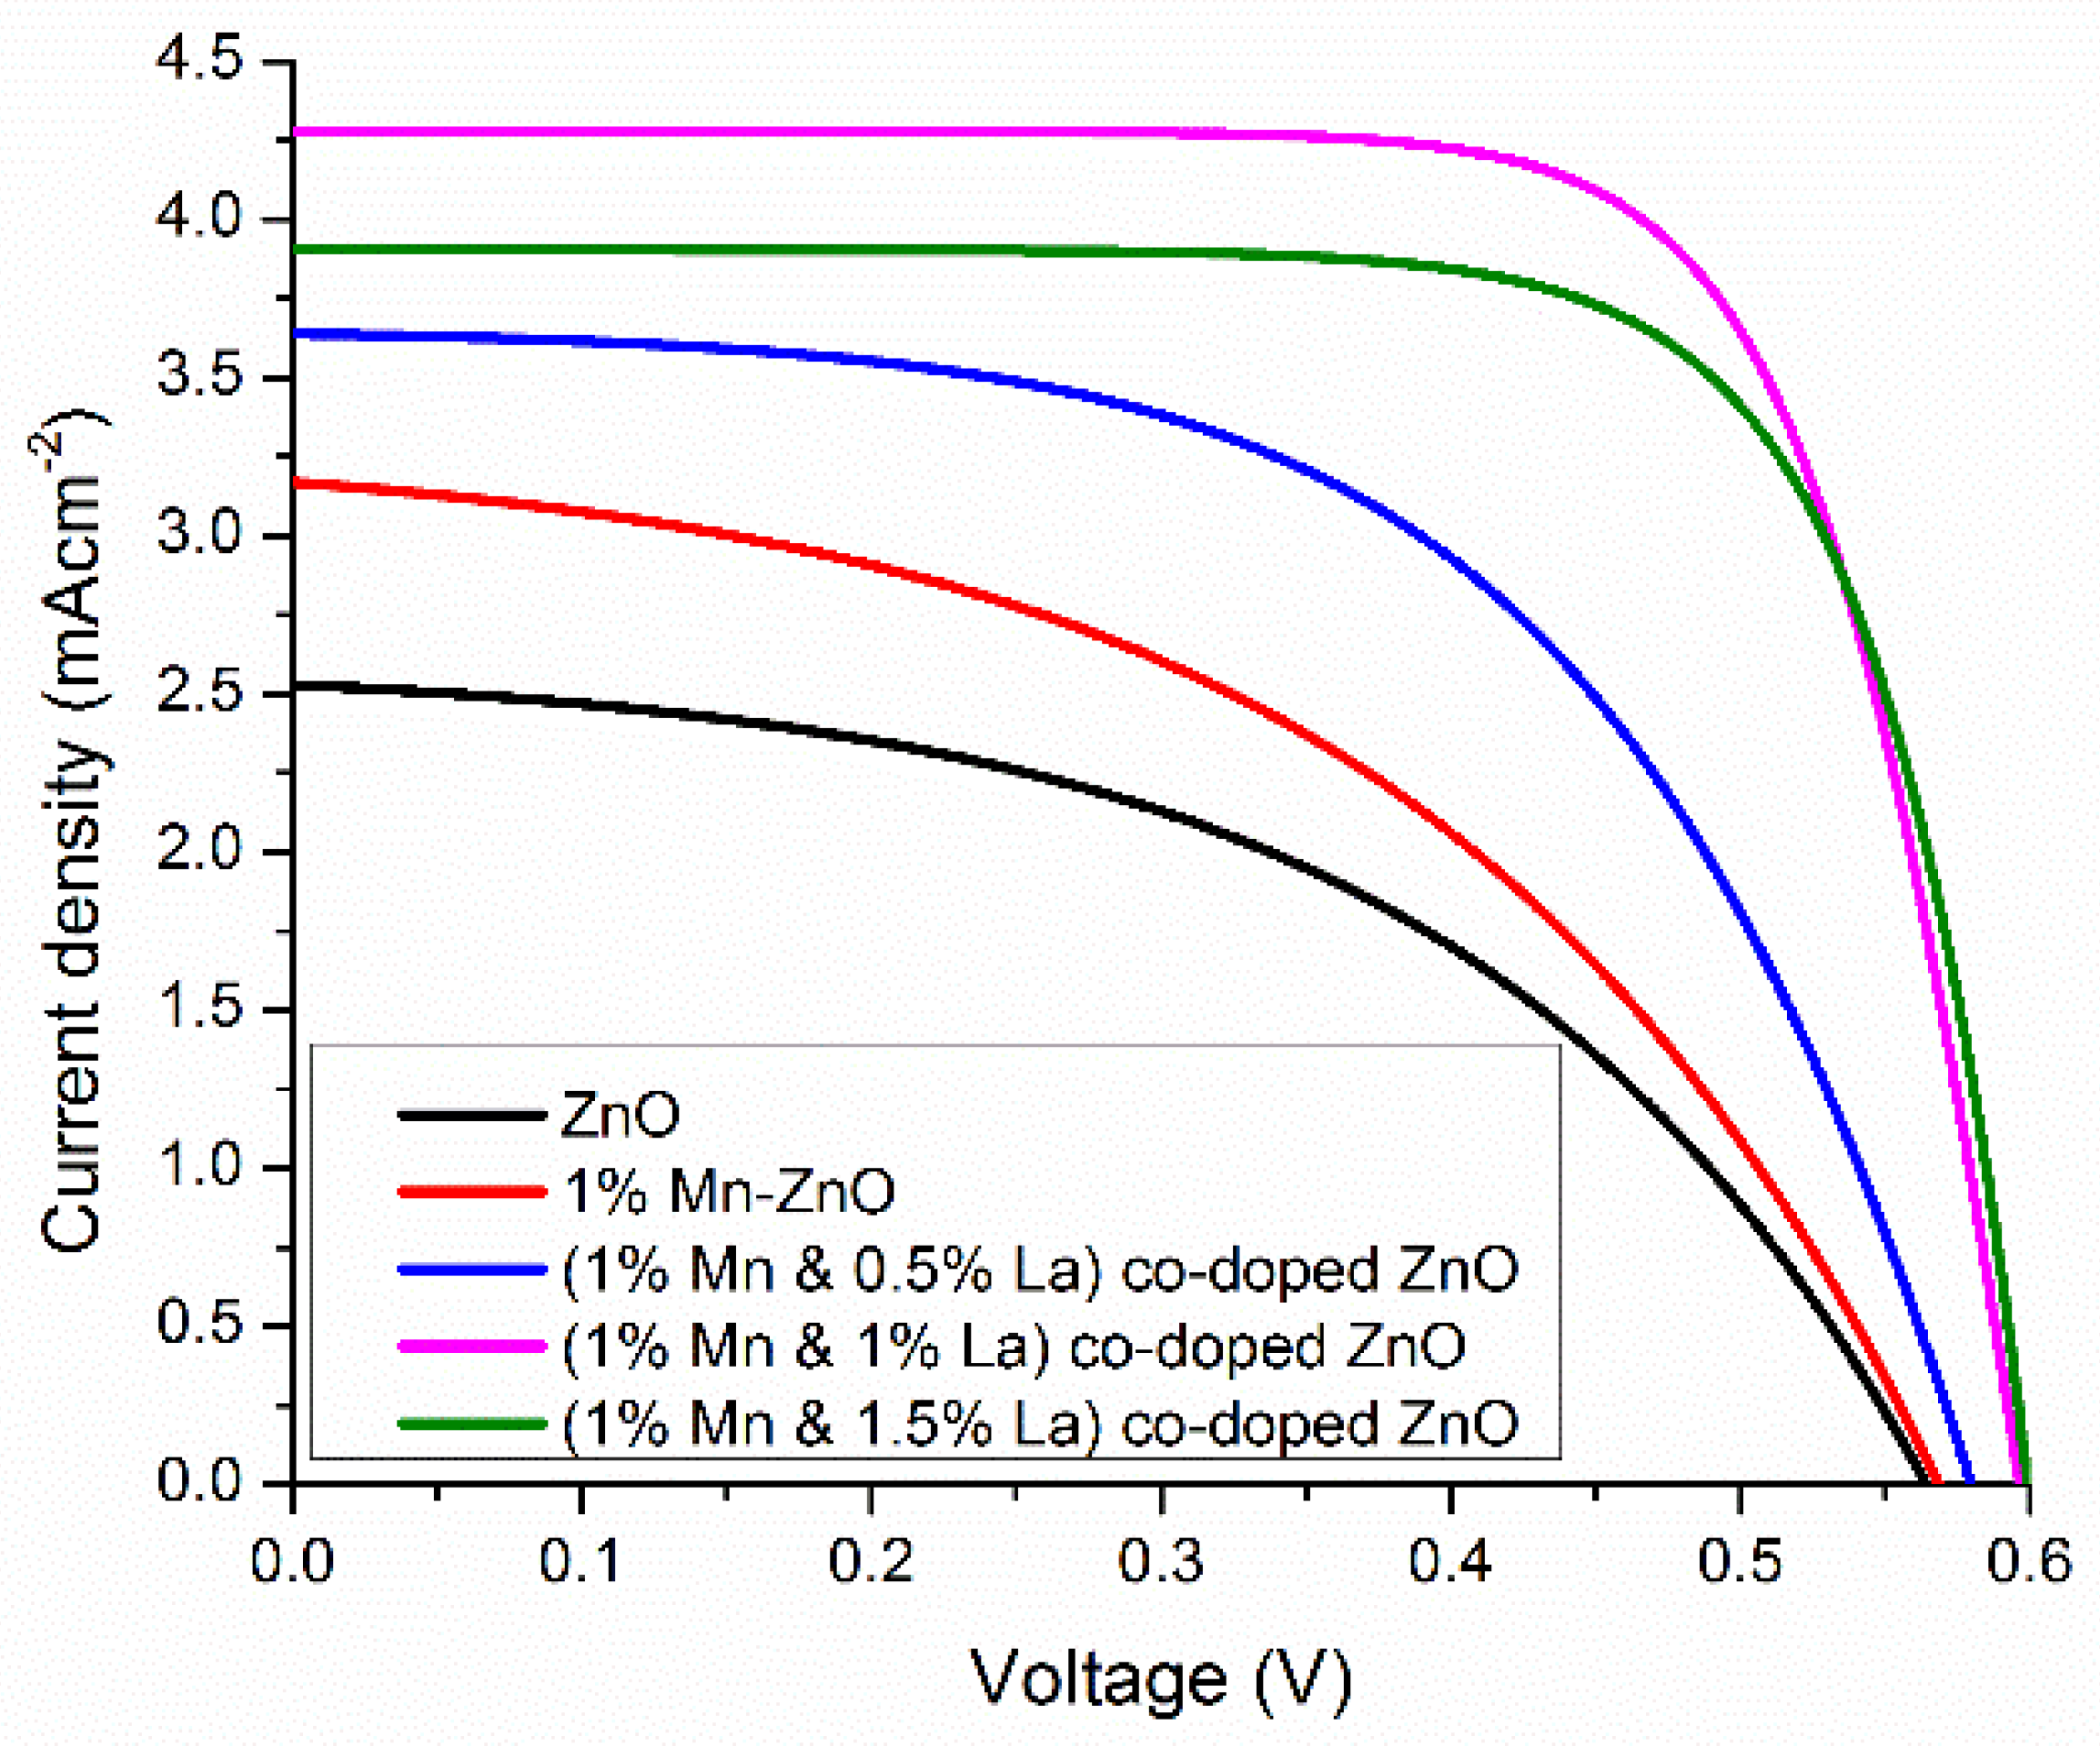
3.3. DSSC Parameter Measurement
4. Conclusions
Author Contributions
Funding
Acknowledgments
Conflicts of Interest
References
- Armaroli, N.; Balzani, V. Solar electricity and solar fuels: Status and perspectives in the context of the energy transition. Chem. A Eur. J. 2016, 22, 32–57. [Google Scholar] [CrossRef] [PubMed]
- Ahmadi, M.H.; Ghazvini, M.; Alhuyi Nazari, M.; Ahmadi, M.A.; Pourfayaz, F.; Lorenzini, G.; Ming, T. Renewable energy harvesting with the application of nanotechnology: A review. Int. J. Energy Res. 2019, 43, 1387–1410. [Google Scholar] [CrossRef]
- Bangash, K.A.; Kazmi, S.A.A.; Farooq, W.; Ayub, S.; Musarat, M.A.; Alaloul, W.S.; Javed, M.F.; Mosavi, A. Thickness Optimization of Thin-Film Tandem Organic Solar Cell. Micromachines 2021, 12, 518. [Google Scholar] [CrossRef]
- Sanda, M.D.A.; Badu, M.; Awudza, J.A.; Boadi, N.O. Development of TiO2-based dye-sensitized solar cells using natural dyes extracted from some plant-based materials. Chem. Int. 2021, 7, 9–20. [Google Scholar]
- Shindy, H.A.; El-Maghraby, M.A.; Goma, M.M.; Harb, N.A. Dicarbocyanine and tricarbocyanine dyes: Novel synthetic approaches, photosensitization evaluation and antimicrobial screening. Chem. Int. 2020, 6, 30–41. [Google Scholar]
- Aal, R.M.A.; Gitru, M.A.; Essam, Z.M. Novel synthetized near infrared cyanine dyes as sensitizer for dye sensitized solar cells based on nano-TiO2. Chem. Int. 2017, 3, 358–367. [Google Scholar]
- Parisi, M.L.; Maranghi, S.; Vesce, L.; Sinicropi, A.; Di Carlo, A.; Basosi, R. Prospective life cycle assessment of third-generation photovoltaics at the pre-industrial scale: A long-term scenario approach. Renew. Sustain. Energy Rev. 2020, 121, 109703. [Google Scholar] [CrossRef]
- Mei, X.; Cho, S.J.; Fan, B.; Ouyang, J. High-performance dye-sensitized solar cells with gel-coated binder-free carbon nanotube films as counter electrode. Nanotechnology 2010, 21, 395202. [Google Scholar] [CrossRef]
- Parisi, M.L.; Dessì, A.; Zani, L.; Maranghi, S.; Mohammadpourasl, S.; Calamante, M.; Mordini, A.; Basosi, R.; Reginato, G.; Sinicropi, A. Combined LCA and green metrics approach for the sustainability assessment of an organic dye synthesis on lab scale. Front. Chem. 2020, 8, 214. [Google Scholar] [CrossRef]
- O’regan, B.; Grätzel, M. A low-cost, high-efficiency solar cell based on dye-sensitized colloidal TiO2 films. Nature 1991, 353, 737–740. [Google Scholar] [CrossRef]
- Tahir, M.B.; Farman, S.; Rasheed, A.; Alrobei, H.; Shahzad, K.; Ali, A.M.; Muhammad, S. Insight role of TiO2 to improve the photocatalytic performance of WO3 nanostructures for the efficient degradation of ciprofloxacin. Z. Für Phys. Chem. 2021, 236, 169–180. [Google Scholar] [CrossRef]
- Hendry, E.; Koeberg, M.; O’regan, B.; Bonn, M. Local field effects on electron transport in nanostructured TiO2 revealed by terahertz spectroscopy. Nano Lett. 2006, 6, 755–759. [Google Scholar] [CrossRef]
- Qian, J.; Liu, P.; Xiao, Y.; Jiang, Y.; Cao, Y.; Ai, X.; Yang, H. TiO2-coated multilayered SnO2 hollow microspheres for dye-sensitized solar cells. Adv. Mater. 2009, 21, 3663–3667. [Google Scholar] [CrossRef]
- Awwad, A.M.; Amer, M.W.; Salem, N.M.; Abdeen, A.O. Green synthesis of zinc oxide nanoparticles (ZnO-NPs) using Ailanthus altissima fruit extracts and antibacterial activity. Chem. Int. 2020, 6, 151–159. [Google Scholar]
- Awwad, A.M.; Amer, M.W.; Al-Aqarbeh, M.M. TiO2-kaolinite nanocomposite prepared from the Jordanian Kaolin clay: Adsorption and thermodynamic of Pb(II) and Cd(II) ions in aqueous solution. Chem. Int. 2020, 6, 168–178. [Google Scholar]
- Igwe, O.U.; Nwamezie, F. Green synthesis of iron nanoparticles using flower extract of Piliostigma thonningii and antibacterial activity evaluation. Chem. Int. 2018, 4, 60–66. [Google Scholar]
- Law, M.; Greene, L.E.; Johnson, J.C.; Saykally, R.; Yang, P. Nanowire dye-sensitized solar cells. Nat. Mater. 2005, 4, 455–459. [Google Scholar] [CrossRef]
- Hosono, E.; Fujihara, S.; Kimura, T. Synthesis, structure and photoelectrochemical performance of micro/nano-textured ZnO/eosin Y electrodes. Electrochim. Acta 2004, 49, 2287–2293. [Google Scholar] [CrossRef]
- Yin, X.; Que, W.; Fei, D.; Xie, H.; He, Z.; Wang, G. Strategies to prepare an efficient photoanode for ZnO nanowires-based CdS–CdSe co-sensitized solar cells. Electrochim. Acta 2013, 89, 561–570. [Google Scholar] [CrossRef]
- Keis, K.; Bauer, C.; Boschloo, G.; Hagfeldt, A.; Westermark, K.; Rensmo, H.; Siegbahn, H. Nanostructured ZnO electrodes for dye-sensitized solar cell applications. J. Photochem. Photobiol. A Chem. 2002, 148, 57–64. [Google Scholar] [CrossRef]
- Rahman, M.U.; Wei, M.; Xie, F.; Khan, M. Efficient dye-sensitized solar cells composed of nanostructural ZnO doped with Ti. Catalysts 2019, 9, 273. [Google Scholar] [CrossRef] [Green Version]
- De Angelis, F.; Fantacci, S.; Selloni, A.; Grätzel, M.; Nazeeruddin, M.K. Influence of the sensitizer adsorption mode on the open-circuit potential of dye-sensitized solar cells. Nano Lett. 2007, 7, 3189–3195. [Google Scholar] [CrossRef]
- Roose, B.; Pathak, S.; Steiner, U. Doping of TiO2 for sensitized solar cells. Chem. Soc. Rev. 2015, 44, 8326–8349. [Google Scholar] [CrossRef] [Green Version]
- Noreen, S.; Ismail, S.; Ibrahim, S.M.; Kusuma, H.S.; Nazir, A.; Yaseen, M.; Khan, M.I.; Iqbal, M. ZnO, CuO and Fe2O3 green synthesis for the adsorptive removal of direct golden yellow dye adsorption: Kinetics, equilibrium and thermodynamics studies. Z. Für Phys. Chem. 2020, 235, 1055–1075. [Google Scholar] [CrossRef]
- Ata, S.; Tabassum, A.; Bibi, I.; Ghafoor, S.; Ahad, A.; Bhatti, M.A.; Islam, A.; Rizvi, H.; Iqbal, M. Synthesis and Characterization of ZnO Nanorods as an Adsorbent for Cr (VI) Sequestration. Z. Für Phys. Chem. 2019, 233, 995–1017. [Google Scholar] [CrossRef]
- Mehmood, B.; Khan, M.; Iqbal, M.; Mahmood, A.; Al-Masry, W. Structural and optical properties of Ti and Cu co-doped ZnO thin films for photovoltaic applications of dye sensitized solar cells. Int. J. Energy Res. 2021, 45, 2445–2459. [Google Scholar] [CrossRef]
- Viswanatha, R.; Sapra, S.; Sen Gupta, S.; Satpati, B.; Satyam, P.; Dev, B.; Sarma, D. Synthesis and characterization of Mn-doped ZnO nanocrystals. J. Phys. Chem. B 2004, 108, 6303–6310. [Google Scholar] [CrossRef]
- Mondal, S.; Bhattacharyya, S.; Mitra, P. Preparation of manganese-doped ZnO thin films and their characterization. Bull. Mater. Sci. 2013, 36, 223–229. [Google Scholar] [CrossRef] [Green Version]
- Chakrabarti, M.; Dechoudhury, S.; Sanyal, D.; Roy, T.K.; Bhowmick, D.; Chakrabarti, A. Observation of room temperature ferromagnetism in Mn–Fe doped ZnO. J. Phys. D Appl. Phys. 2008, 41, 135006. [Google Scholar] [CrossRef]
- Yang, S.; Zhang, Y. Structural, optical and magnetic properties of Mn-doped ZnO thin films prepared by sol–gel method. J. Magn. Magn. Mater. 2013, 334, 52–58. [Google Scholar] [CrossRef]
- Porkalai, V.; Anburaj, D.B.; Sathya, B.; Nedunchezhian, G.; Meenambika, R. Study on the synthesis, structural, optical and electrical properties of ZnO and lanthanum doped ZnO nano particles by sol-gel method. Mech. Mater. Sci. Eng. J. 2017, 9. [Google Scholar] [CrossRef]
- Shahzad, K.; Mushtaq, S.; Akhtar, S.; Yaseen, K.; Amin, F.; Ali, Z. Effect of lanthanum substitution on shape and cytotoxicity of zinc oxide (LaxZn1− XO) nano-colloids. Mater. Res. Express 2019, 6, 055012. [Google Scholar] [CrossRef]
- Kaviyarasu, K.; Premanand, D.; Kennedy, J.; Manikandan, E. Synthesis of Mg doped TiO2 nanocrystals prepared by wet-chemical method: Optical and microscopic studies. Int. J. Nanosci. 2013, 12, 1350033. [Google Scholar] [CrossRef]
- Khan, M.; Farooq, W.; Saleem, M.; Bhatti, K.; Atif, M.; Hanif, A. Phase change, band gap energy and electrical resistivity of Mg doped TiO2 multilayer thin films for dye sensitized solar cells applications. Ceram. Int. 2019, 45, 21436–21439. [Google Scholar] [CrossRef]
- Kumar, V.; Singh, N.; Kumar, V.; Purohit, L.; Kapoor, A.; Ntwaeaborwa, O.M.; Swart, H.C. Doped zinc oxide window layers for dye sensitized solar cells. J. Appl. Phys. 2013, 114, 134506. [Google Scholar] [CrossRef]
- Khan, M.I.; Imran, S.; Shahnawaz; Saleem, M.; Ur Rehman, S. Annealing effect on the structural, morphological and electrical properties of TiO2/ZnO bilayer thin films. Results Phys. 2018, 8, 249–252. [Google Scholar] [CrossRef]
- Han, J.; Mantas, P.; Senos, A. Grain growth in Mn-doped ZnO. J. Eur. Ceram. Soc. 2000, 20, 2753–2758. [Google Scholar] [CrossRef]
- Suwanboon, S.; Amornpitoksuk, P.; Sukolrat, A.; Muensit, N. Optical and photocatalytic properties of La-doped ZnO nanoparticles prepared via precipitation and mechanical milling method. Ceram. Int. 2013, 39, 2811–2819. [Google Scholar] [CrossRef]
- Khodadadi, B.; Bordbar, M.; Yeganeh-Faal, A. Optical, structural, and photocatalytic properties of Cd-doped ZnO powders prepared via sol–gel method. J. Sol-Gel Sci. Technol. 2016, 77, 521–527. [Google Scholar] [CrossRef]
- Dhanshree, K.; Elangovan, T. Synthesis and characterization of ZnO and Mn-doped ZnO nanoparticles. Int. J. Sci. Res. 2015, 4, 1816–1820. [Google Scholar]
- Tliba, M.; Benhaoua, A.; Gheriani, R.; Benhaoua, B.; Rahal, A.; Boukaous, C.; Tliba, A. La-doped zno thin films prepared by spray pyrolysis withmoving nozzle: Study of physical properties and adsorption ability of the copper. Dig. J. Nanomater. Biostructures 2018, 13, 991–1002. [Google Scholar]
- Iqbal, A.; Zakria, M.; Mahmood, A. Structural and spectroscopic analysis of wurtzite (ZnO)1−x (Sb2O3)x composite semiconductor. Prog. Nat. Sci. Mater. Int. 2015, 25, 131–136. [Google Scholar]
- Suryanaryana, C.; Norton, M.G. X-ray Diffraction A Practical Approach; Plenum Press: New York, NY, USA, 1998. [Google Scholar]
- Deshmukh, A.V.; Patil, S.; Yusuf, S.; Rajarajan, A.; Lalla, N. Structural, chemical and magnetic investigations of polycrystalline Zn1−xMnxO. J. Magn. Magn. Mater. 2010, 322, 536–541. [Google Scholar] [CrossRef]
- Park, K.-W.; Jang, J.-i.; Wakeda, M.; Shibutani, Y.; Lee, J.-C. Atomic packing density and its influence on the properties of Cu–Zr amorphous alloys. Scr. Mater. 2007, 57, 805–808. [Google Scholar] [CrossRef]
- Dhanalakshmi, A.; Natarajan, B.; Ramadas, V.; Palanimurugan, A.; Thanikaikarasan, S. Structural, morphological, optical and antibacterial activity of rod-shaped zinc oxide and manganese-doped zinc oxide nanoparticles. Pramana 2016, 87, 57. [Google Scholar] [CrossRef]
- Mote, V.; Dargad, J.; Dole, B. Effect of Mn doping concentration on structural, morphological and optical studies of ZnO nano-particles. Nanosci. Nanoeng. 2013, 1, 116–122. [Google Scholar] [CrossRef]
- Chauhan, J.; Shrivastav, N.; Dugaya, A.; Pandey, D. Synthesis and characterization of Ni and Cu doped ZnO. J. Nanomed. Nanotechnol. 2017, 1, 26–34. [Google Scholar]
- Dhannia, T.; Jayalekshmi, S.; Kumar, M.S.; Rao, T.P.; Bose, A.C. Effect of iron doping and annealing on structural and optical properties of cerium oxide nanocrystals. J. Phys. Chem. Solids 2010, 71, 1020–1025. [Google Scholar] [CrossRef]
- Verma, H.K.; Vij, M.; Maurya, K. Synthesis, characterization and sun light-driven photocatalytic activity of zinc oxide nanostructures. J. Nanosci. Nanotechnol. 2020, 20, 3683–3692. [Google Scholar] [CrossRef]
- Yang, Y.; Li, K.; Li, H. Doping effects on the crystal structure and electrochemical performance of LiFePO4/C. Int. J. Appl. Ceram. Technol. 2015, 12, 163–168. [Google Scholar] [CrossRef]
- Huang, P.-R.; He, Y.; Cao, C.; Lu, Z.-H. Impact of lattice distortion and electron doping on α-MoO3 electronic structure. Sci. Rep. 2014, 4, 7131. [Google Scholar] [CrossRef] [Green Version]
- Moosavi, F.; Bahrololoom, M.E.; Kamjou, R. Effects of cu doping on nano structure, morphology and photocatalytic activity of zno thin film synthesized by sol-gel method. Studia Univ. Babes-Bolyai Chem. 2016, 1, 79. [Google Scholar]
- Kim, K.J.; Park, Y.R. Optical investigation of Zn1−xFexO films grown on Al2O3 (0001) by radio-frequency sputtering. J. Appl. Phys. 2004, 96, 4150–4153. [Google Scholar] [CrossRef]
- Khan, M.; Hassan, G.; Hasan, M.; Abubshait, S.A.; Abubshait, H.A.; Al-Masry, W.; Mahmood, Q.; Mahmood, A.; Ramay, S.M. Investigations on the efficiency variation of zinc and gallium Co-doped TiO2 based dye sensitized solar cells. Ceram. Int. 2020, 46, 24844–24849. [Google Scholar] [CrossRef]
- Ghose, S.; Jana, D. Defect dependent inverted shift of band structure for ZnO nanoparticles. Mater. Res. Express 2019, 6, 105907. [Google Scholar] [CrossRef]
- Chattopadhyay, S.; Dutta, S.; Banerjee, A.; Jana, D.; Bandyopadhyay, S.; Sarkar, A. Synthesis and characterization of single-phase Mn-doped ZnO. Phys. B Condens. Matter 2009, 404, 1509–1514. [Google Scholar] [CrossRef] [Green Version]
- Lee, B.-S.; Bishop, S.G. Optical and electrical properties of phase change materials. In Phase Change Materials; Springer: Berlin/Heidelberg, Germany, 2009; pp. 175–198. [Google Scholar]
- Gupta, R.; Ghosh, K.; Patel, R.; Mishra, S.; Kahol, P. Band gap engineering of ZnO thin films by In2O3 incorporation. J. Cryst. Growth 2008, 310, 3019–3023. [Google Scholar] [CrossRef]
- Aal, N.A.; Al-Hazmi, F.; Al-Ghamdi, A.A.; Hendi, A.; Alorainy, R.; Nawar, A.; El-Gazzar, S.; El-Tantawy, F.; Yakuphanoglu, F. Nanostructure lanthanum doped zinc oxide optical materials. J. Nanoelectron. Optoelectron. 2014, 9, 624–634. [Google Scholar] [CrossRef]
- Kumar, R.K.; Husain, M.; Khan, Z.H. Optical studies on amorphous ZnO film. Dig. J. Nanomater. Biostruct. 2011, 6, 1317–1323. [Google Scholar]
- Xie, G.; Fanga, L.; Peng, L.; Liu, G.; Ruan, H.; Wu, F.; Kong, C. Effect of In-doping on the optical constants of ZnO thin films. Phys. Procedia 2012, 32, 651–657. [Google Scholar] [CrossRef] [Green Version]
- Zhang, B.; Hu, X.; Liu, E.; Fan, J. Novel S-scheme 2D/2D BiOBr/g-C3N4 heterojunctions with enhanced photocatalytic activity. Chin. J. Catal. 2021, 42, 1519–1529. [Google Scholar] [CrossRef]
- Lin, H.; Chou, Y.; Cheng, C.; Chen, Y. Giant enhancement of band edge emission based on ZnO/TiO2 nanocomposites. Opt. Express 2007, 15, 13832–13837. [Google Scholar] [CrossRef]
- Silwal, S.B.; Adhikari, R.; Lamichhane, P.; Bhandari, N.L. Natural dyes as photo-sensitizer in solar cells. BIBECHANA 2020, 17, 28–33. [Google Scholar] [CrossRef] [Green Version]
- Ünlü, B.; Özacar, M. Effect of Cu and Mn amounts doped to TiO2 on the performance of DSSCs. Sol. Energy 2020, 196, 448–456. [Google Scholar] [CrossRef]
- Liu, J.; Yang, H.; Tan, W.; Zhou, X.; Lin, Y. Photovoltaic performance improvement of dye-sensitized solar cells based on tantalum-doped TiO2 thin films. Electrochim. Acta 2010, 56, 396–400. [Google Scholar] [CrossRef]
- Zhang, L.; Wang, Z.S. Enhancing the Performance of Dye-Sensitized Solar Cells with a Gold-Nanoflowers Box. Chem. -Asian J. 2016, 11, 3283–3289. [Google Scholar] [CrossRef] [PubMed]


| Sr. No. | 2θ (Degree) | Grain Size (D) (nm) | Volume of Unit Cell Å3 | Bond Length (L) (Å) | Lattice Distortion (R) (Å) | d-Spacing (Å) | Atomic Packing Fraction (APF)% | Lattice Constant (Å) a = b, c | Strain (ε) | Crystallinity (Xc) | Phase |
|---|---|---|---|---|---|---|---|---|---|---|---|
| Pure ZnO | |||||||||||
| 1 | 36.18 | 13.25 | 47.27 | 1.97 | 0.61 | 2.483 | 78.12 | a = 3.28 c = 5.08 | 0.008806 | 20.86 | Hexagonal |
| 2 | 56.04 | 21.88 | - | - | - | 1.641 | - | 0.003526 | 32.0 | Hexagonal | |
| 1%Mn-ZnO | |||||||||||
| 1 | 36.11 | 14.37 | 51.70 | 2.03 | 0.55 | 2.488 | 70.78 | a = 3.27 c = 5.59 | 0.001834 | 22.64 | Hexagonal |
| 2 | 55.99 | 23.11 | - | - | - | 1.643 | - | 0.003341 | 33.80 | Hexagonal | |
| (1%Mn + 0.5%La)-ZnO | |||||||||||
| 1 | 36.06 | 16.40 | 50.81 | 2.02 | 0.56 | 2.491 | 72.68 | a = 3.28 c = 5.46 | 0.007621 | 26.08 | Hexagonal |
| 2 | 55.93 | 25.24 | - | - | - | 1.644 | - | 0.001792 | 36.92 | Hexagonal | |
| (1%Mn + 1%La)-ZnO | |||||||||||
| 1 | 36.00 | 16.58 | 52.02 | 2.03 | 0.55 | 2.495 | 70.99 | a = 3.28 c = 5.59 | 0.007097 | 24.24 | Hexagonal |
| 2 | 55.88 | 43.16 | - | - | - | 1.646 | - | 0.003824 | 63.15 | Hexagonal | |
| (1%Mn + 1.5%La)-ZnO | |||||||||||
| 1 | 35.93 | 15.39 | 51.70 | 2.03 | 0.55 | 2.500 | 70.78 | a = 3.27 c = 5.59 | 0.00707 | 26.08 | Hexagonal |
| 2 | 55.83 | 20.24 | - | - | - | 1.647 | - | 0.003063 | 29.62 | Hexagonal | |
| 3 | 66.99 | 32.78 | - | - | - | 1.397 | - | 0.002004 | 45.28 | Cubic | |
| Sr. No. | Samples | Conduction Band Edge |
|---|---|---|
| 1 | ZnO | −0.92 |
| 2 | 1%Mn-ZnO | −0.89 |
| 3 | (1%Mn + 1%La)-ZnO | −0.72 |
| 4 | (1%Mn + 1.5%La)-ZnO | −0.76 |
| Sr. No. | Samples | Imax (mA) | Vmax (V) | Jsc (mAcm−2) | Voc(v) | FF | (η)% |
|---|---|---|---|---|---|---|---|
| 1 | ZnO | 1.76 | 0.39 | 2.5 | 0.56 | 0.4902 | 0.6864 |
| 2 | 1%Mn-ZnO | 2.29 | 0.37 | 3.17 | 0.57 | 0.4689 | 0.8473 |
| 3 | (1%Mn + 0.5%La)-ZnO | 2.94 | 0.40 | 3.63 | 0.58 | 0.5585 | 1.176 |
| 4 | (1%Mn + 1.0%La)-ZnO | 3.93 | 0.48 | 4.28 | 0.59 | 0.7470 | 1.8864 |
| 5 | (1%Mn + 1.5%La)-ZnO | 3.55 | 0.49 | 3.9 | 0.598 | 0.7458 | 1.7395 |
Publisher’s Note: MDPI stays neutral with regard to jurisdictional claims in published maps and institutional affiliations. |
© 2022 by the authors. Licensee MDPI, Basel, Switzerland. This article is an open access article distributed under the terms and conditions of the Creative Commons Attribution (CC BY) license (https://creativecommons.org/licenses/by/4.0/).
Share and Cite
Amjad, M.; Khan, M.I.; Alwadai, N.; Irfan, M.; Ikram-ul-Haq; Albalawi, H.; Almuqrin, A.H.; Almoneef, M.M.; Iqbal, M. Photovoltaic Properties of ZnO Films Co-Doped with Mn and La to Enhance Solar Cell Efficiency. Nanomaterials 2022, 12, 1057. https://0-doi-org.brum.beds.ac.uk/10.3390/nano12071057
Amjad M, Khan MI, Alwadai N, Irfan M, Ikram-ul-Haq, Albalawi H, Almuqrin AH, Almoneef MM, Iqbal M. Photovoltaic Properties of ZnO Films Co-Doped with Mn and La to Enhance Solar Cell Efficiency. Nanomaterials. 2022; 12(7):1057. https://0-doi-org.brum.beds.ac.uk/10.3390/nano12071057
Chicago/Turabian StyleAmjad, Muhammad, Muhammad Iftikhar Khan, Norah Alwadai, Muhammad Irfan, Ikram-ul-Haq, Hind Albalawi, Aljawhara H. Almuqrin, Maha M. Almoneef, and Munawar Iqbal. 2022. "Photovoltaic Properties of ZnO Films Co-Doped with Mn and La to Enhance Solar Cell Efficiency" Nanomaterials 12, no. 7: 1057. https://0-doi-org.brum.beds.ac.uk/10.3390/nano12071057