
A Comparison of the Genotoxic Effects of Gold Nanoparticles Functionalized with Seven Different Ligands in Cultured Human Hepatocellular Carcinoma Cells


Abstract
:1. Introduction
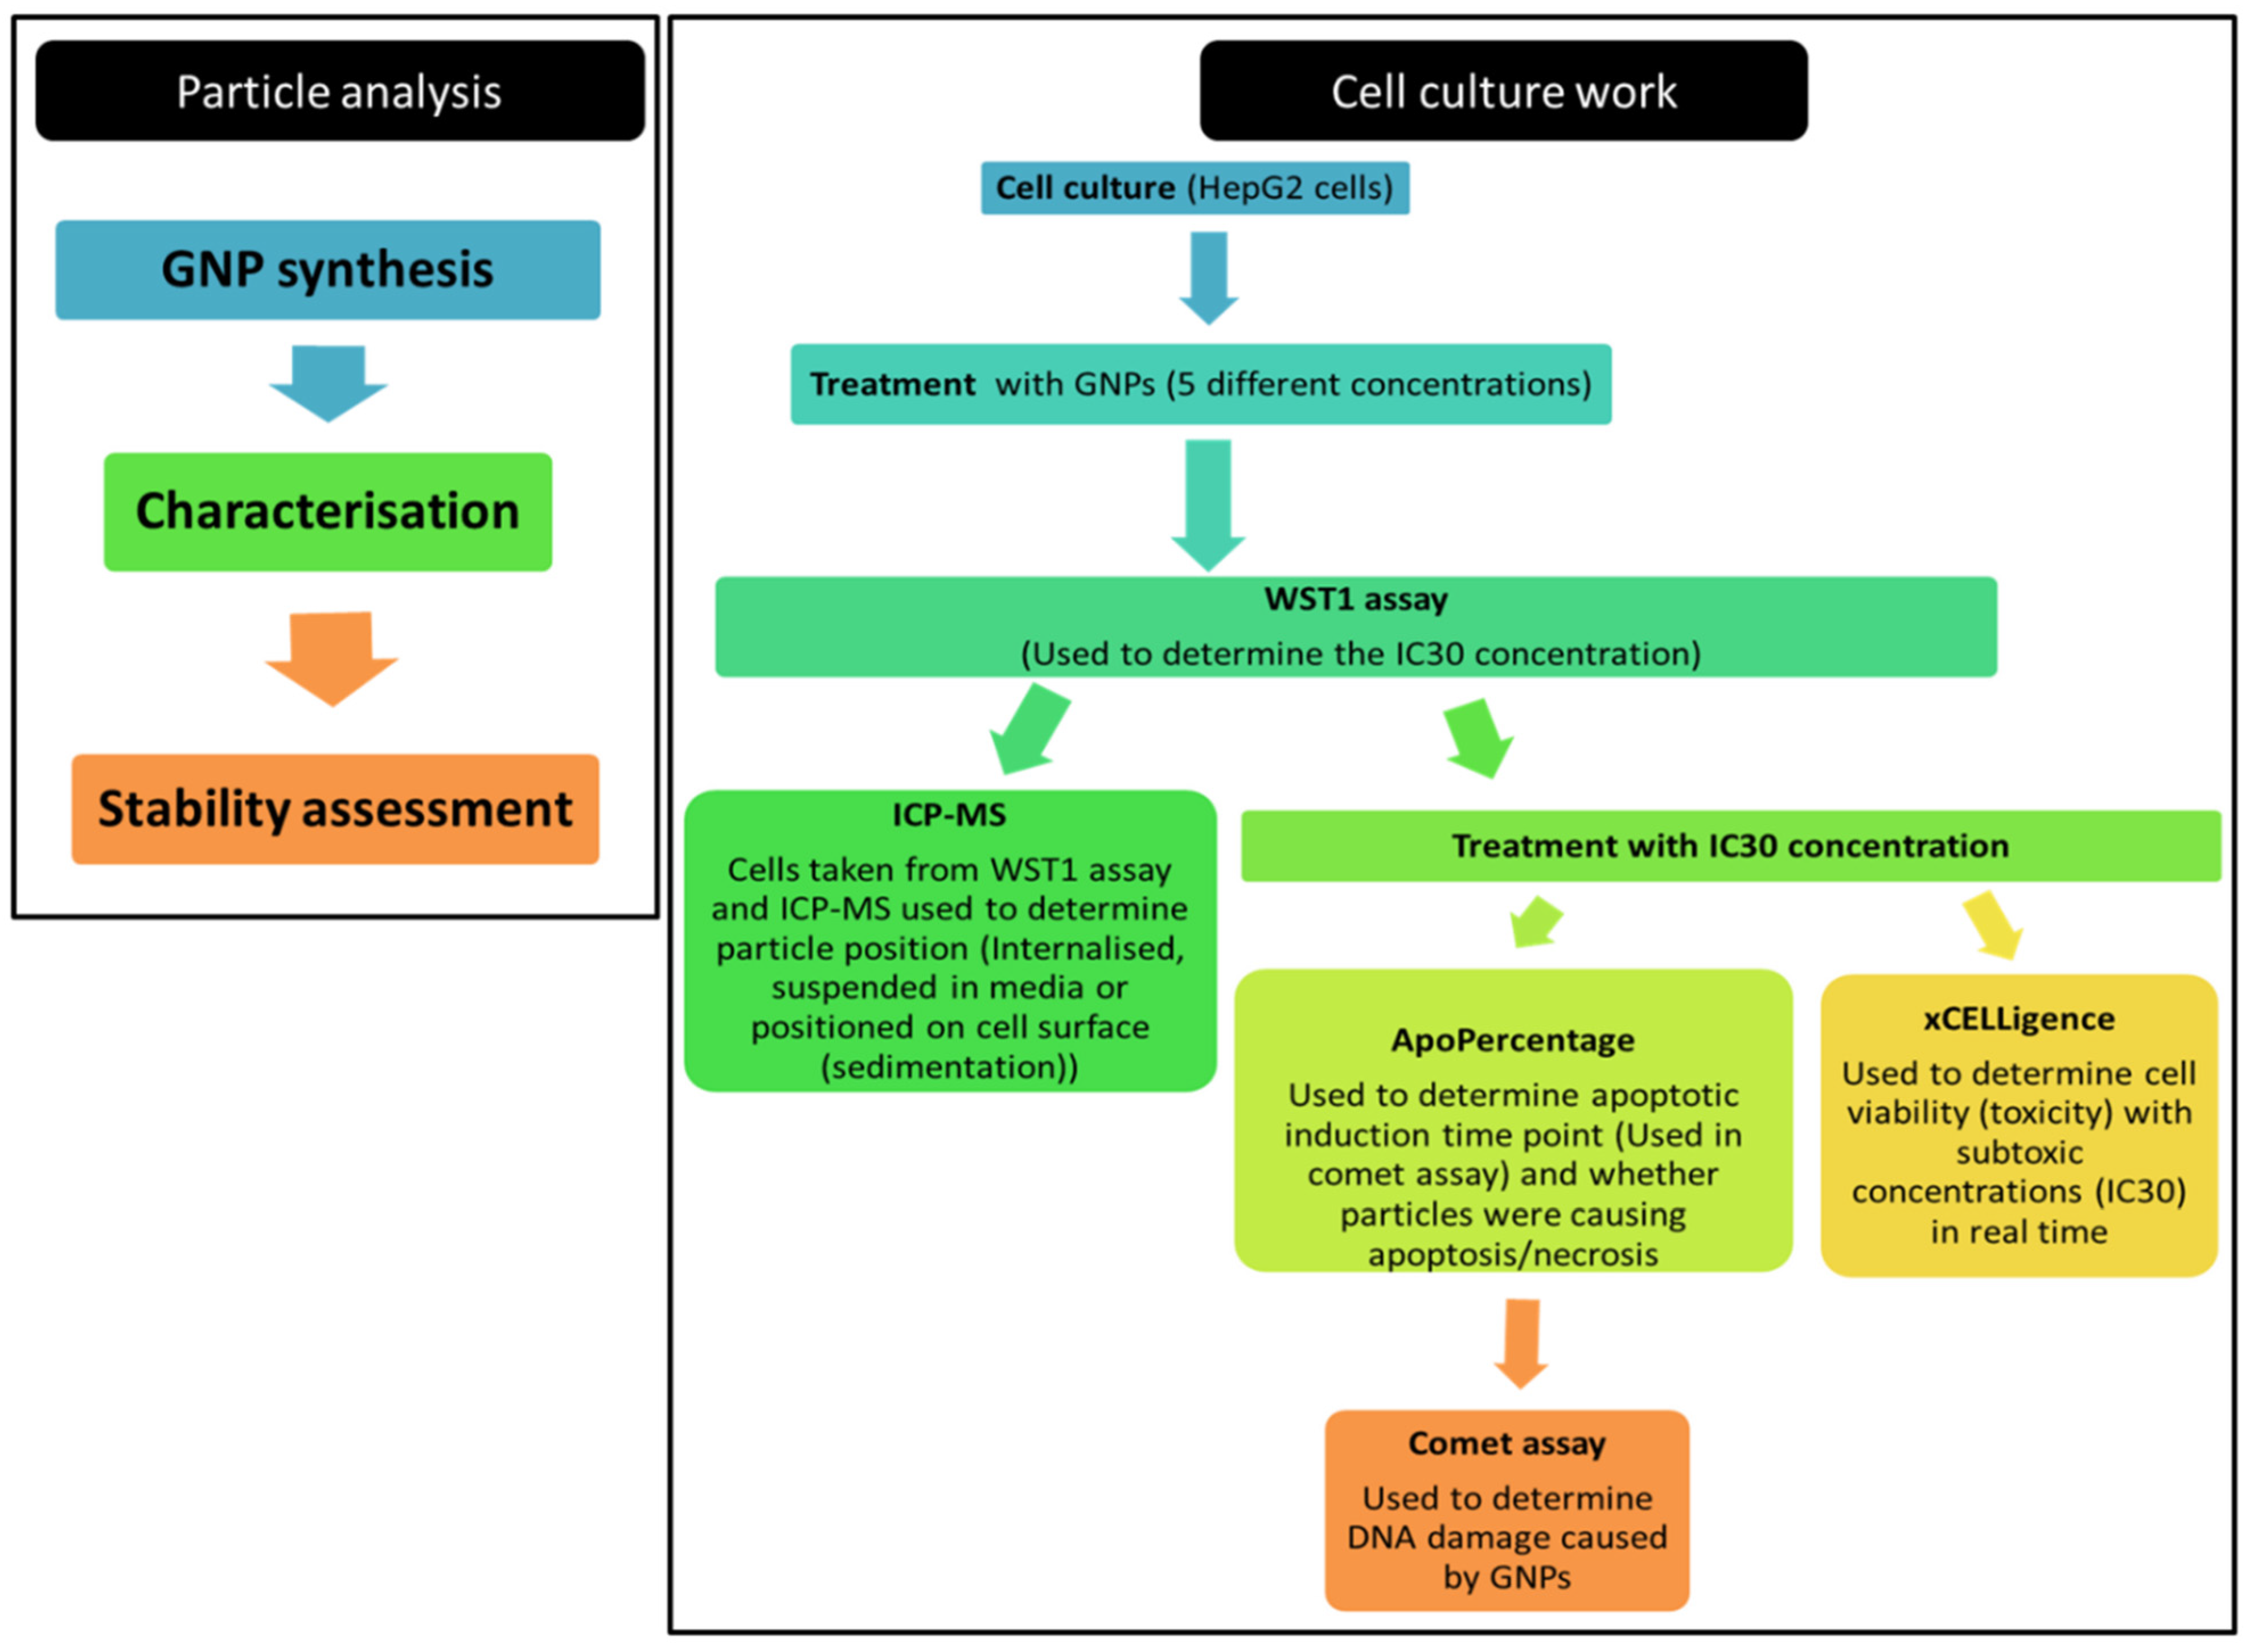
2. Materials and Methods
2.1. Gold Nanoparticle Work
2.1.1. Gold Nanoparticle Synthesis Using the Turkevich Method
2.1.2. Functionalization by Ligand Exchange
2.1.3. GNP Characterization and Stability
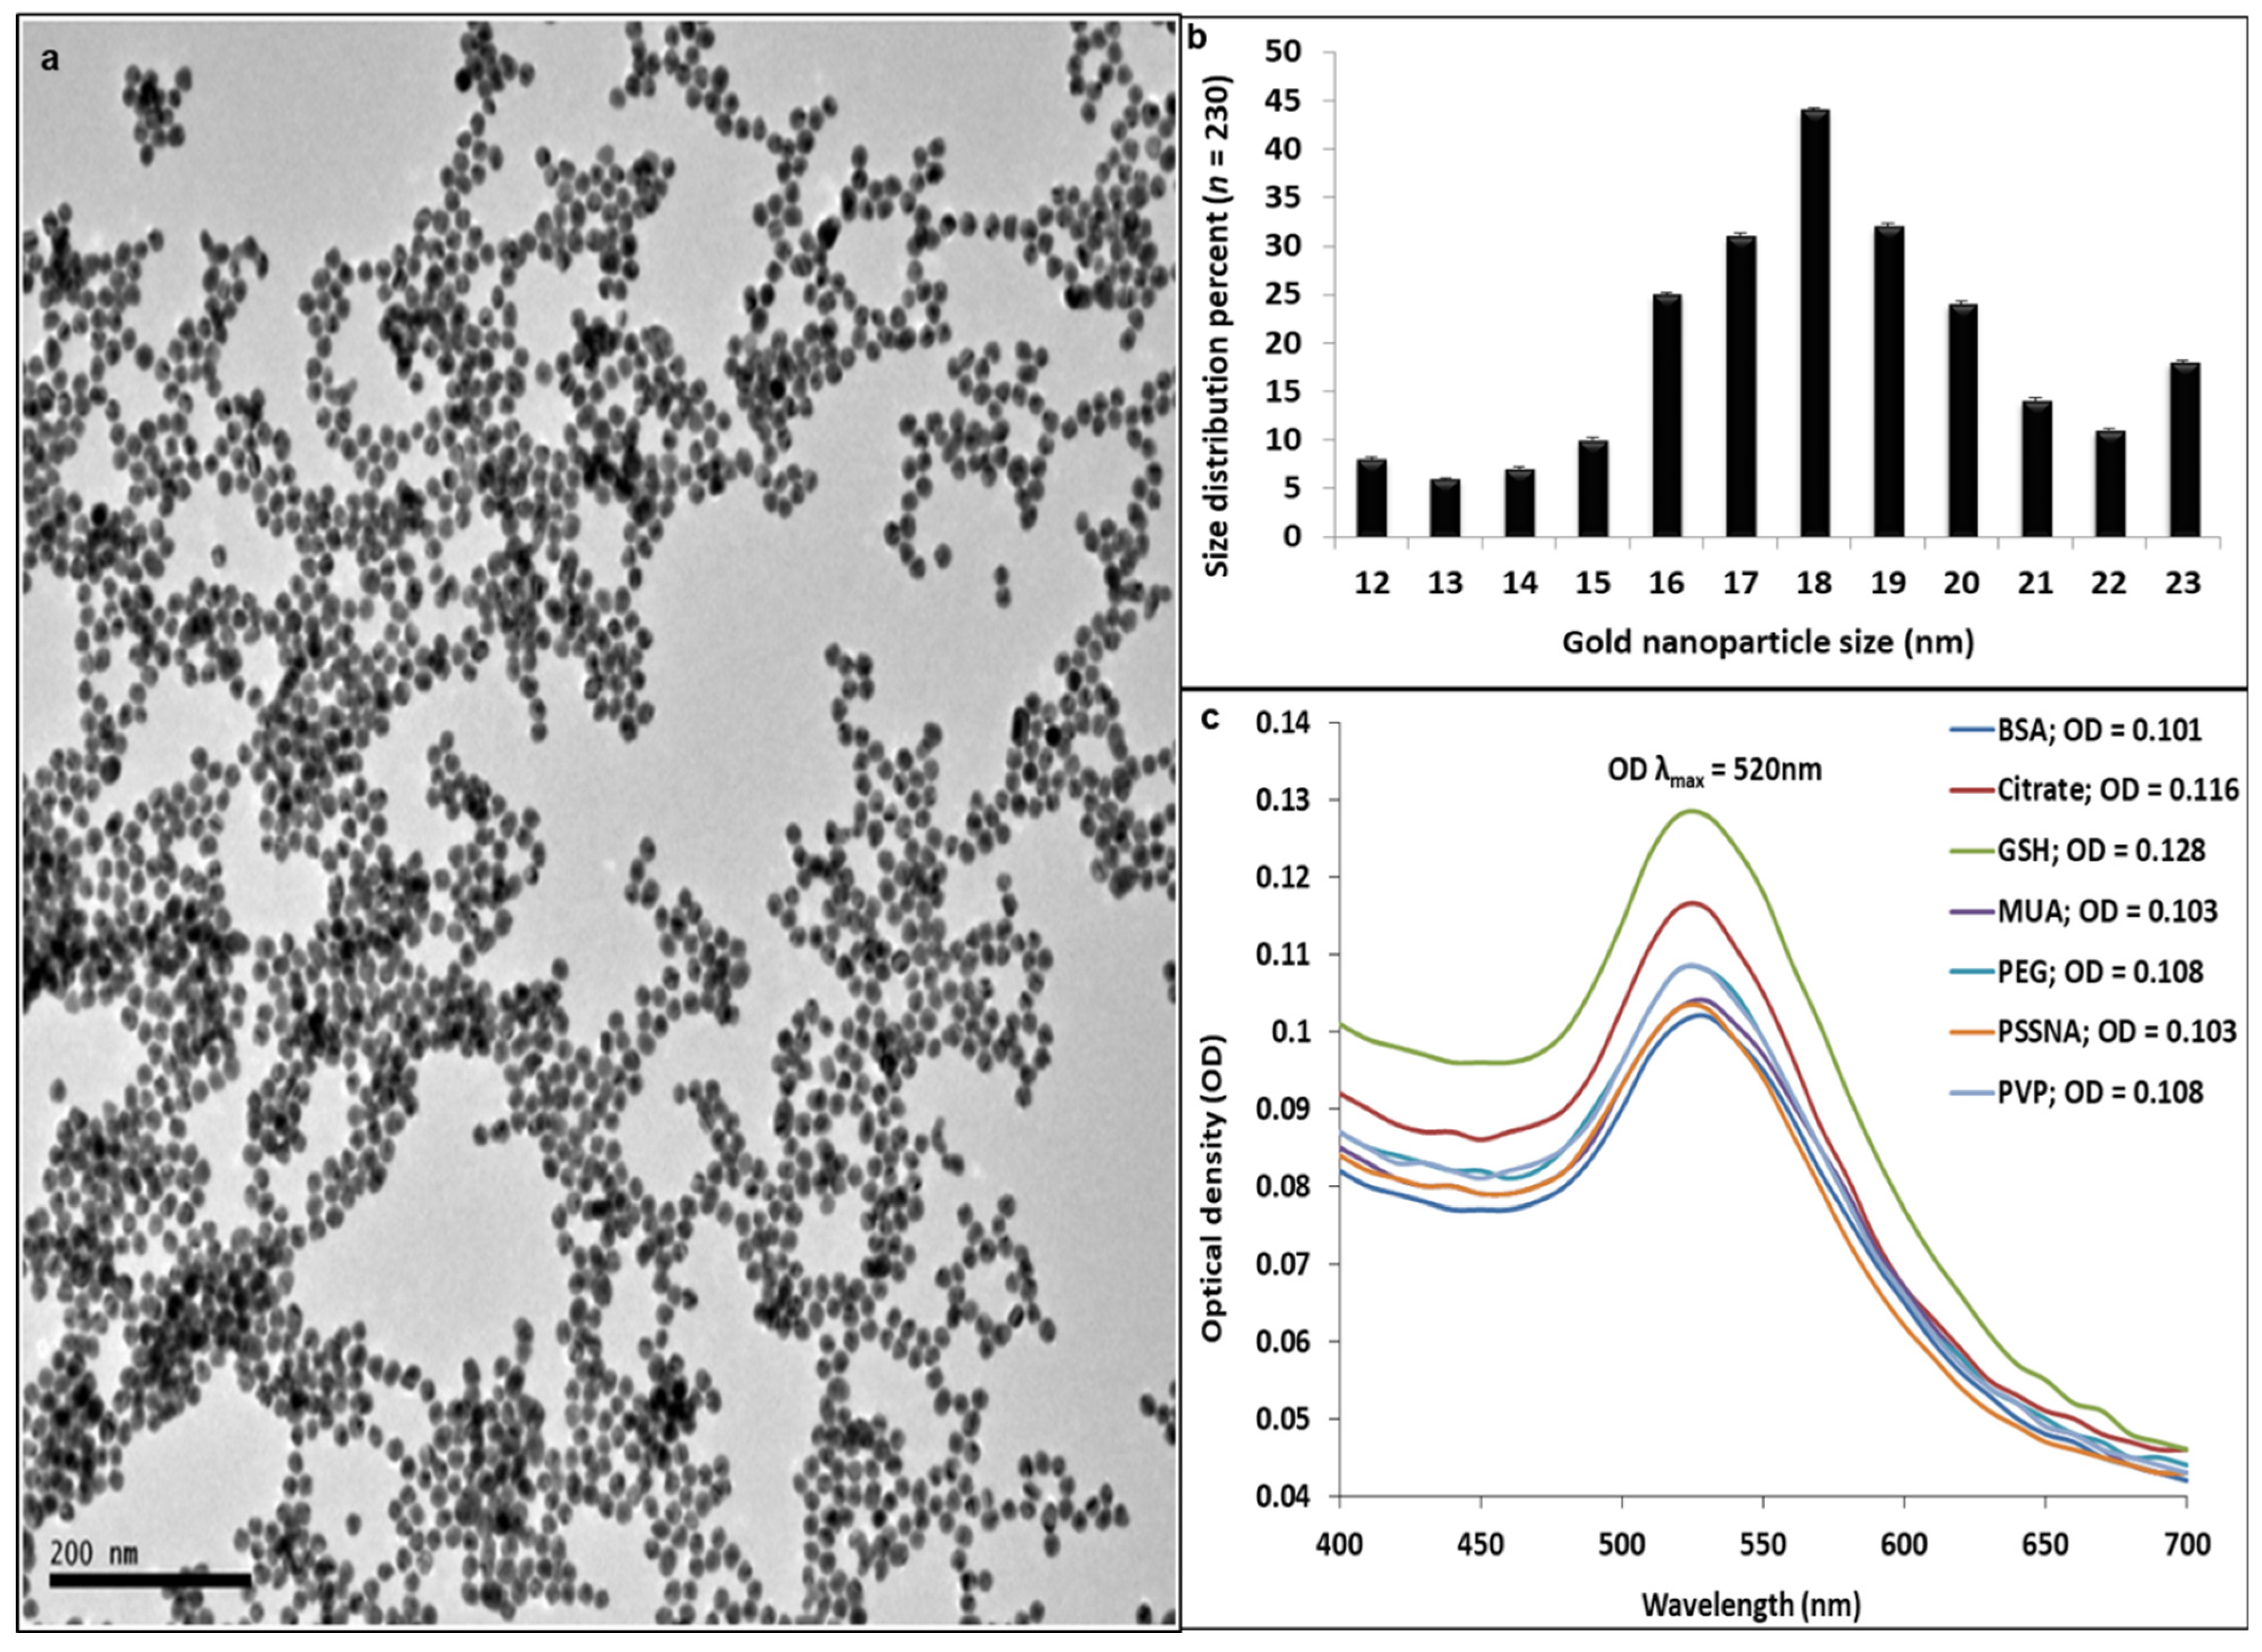
2.1.4. GNP Morphology and Size Distribution
UV-Vis Spectrometry
High-Resolution Transmission Electron Microscopy (HR-TEM)
Dynamic Light Scattering (DLS)
Biofunctionalized GNP Net Charge
2.1.5. GNP-Ligand Stability Test
2.2. Cell Culture Work
2.2.1. Human Hepatocellular Carcinoma HEPG2 ([HepG2] ATCC HB−8065) Cell Culturing
General Cell Culturing of the Cell Line
Trypsinization and Cell Counting
2.2.2. Cell-Based Assays to Determine Cytotoxicity
WST-1 Cell Viability Kit
Determination of GNP-Ligand Cellular Internalization Using Inductively Coupled Plasma Mass Spectrometry (ICP-MS)
Apoptosis Induction Time-Point
Real-Time Cellular Growth and Cytotoxicity Determination
2.3. Genotoxicity Determination
2.3.1. Comet Assay
2.3.2. Statistical Analysis for Comet Assay (DNA Damage Statistics)
3. Results
3.1. Gold Particle Synthesis and Stability Evaluation
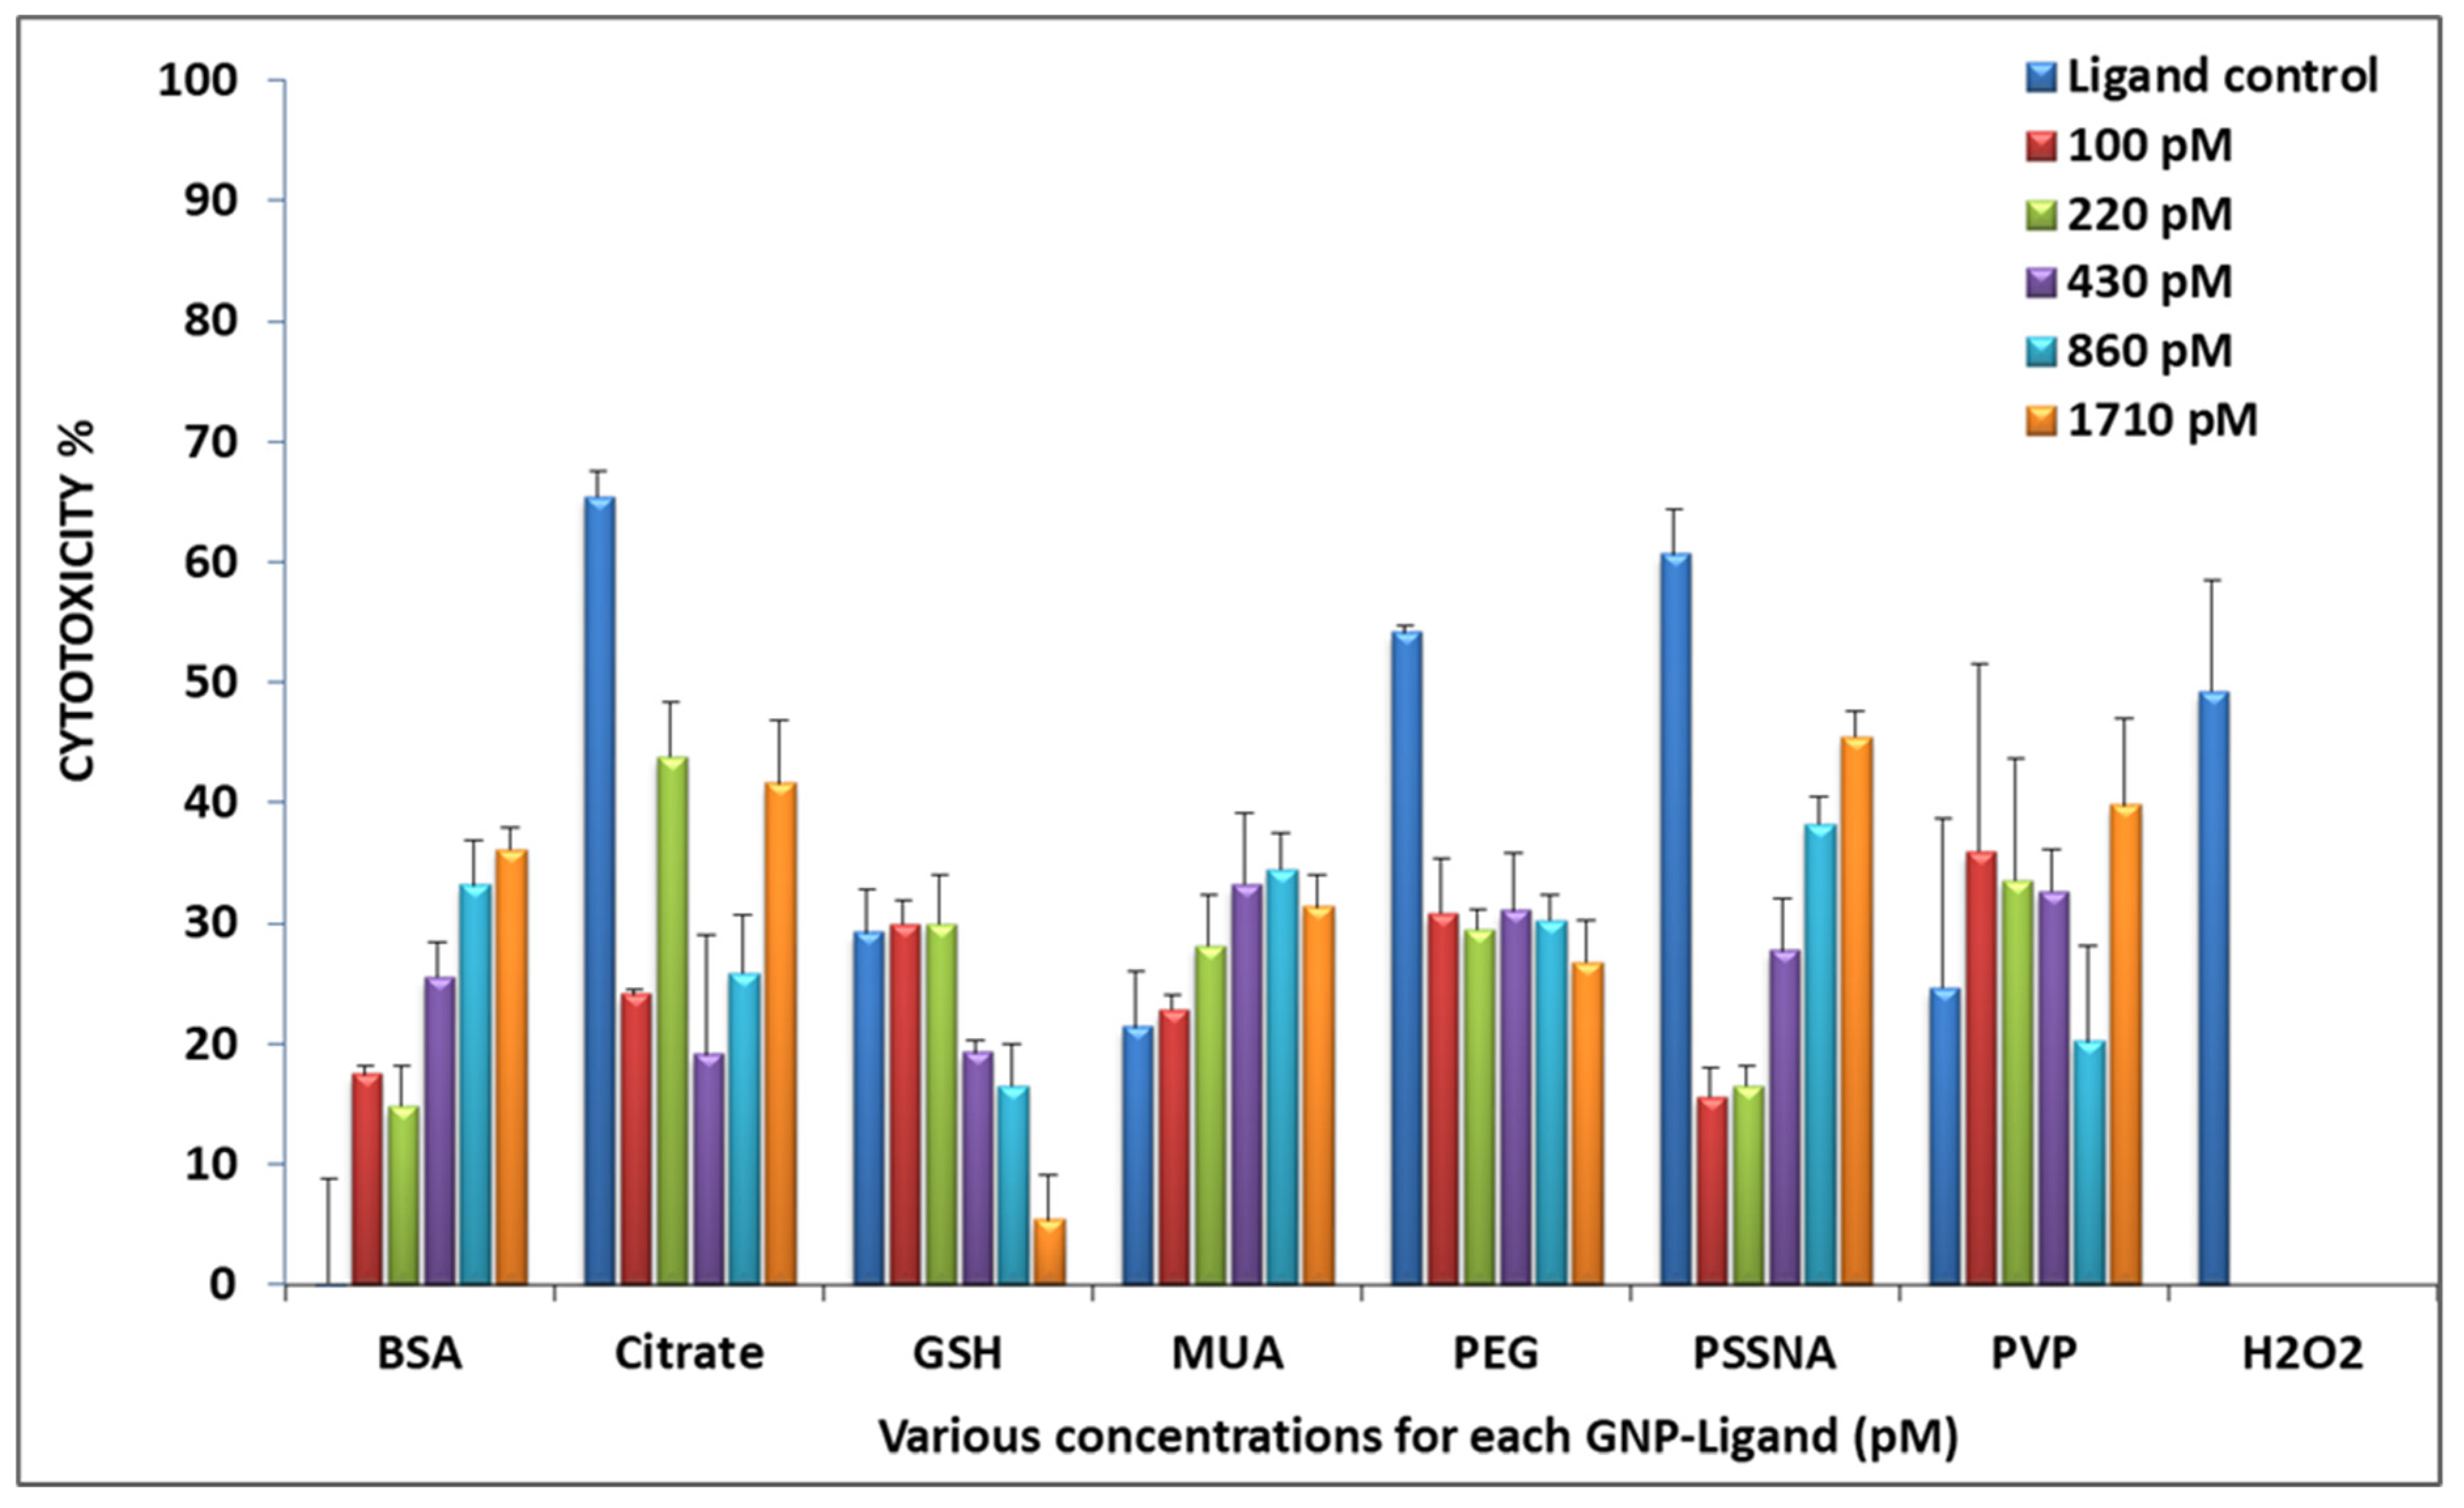
3.2. Cytotoxicity
3.2.1. WST-1 Assay
3.2.2. ApoPercentage
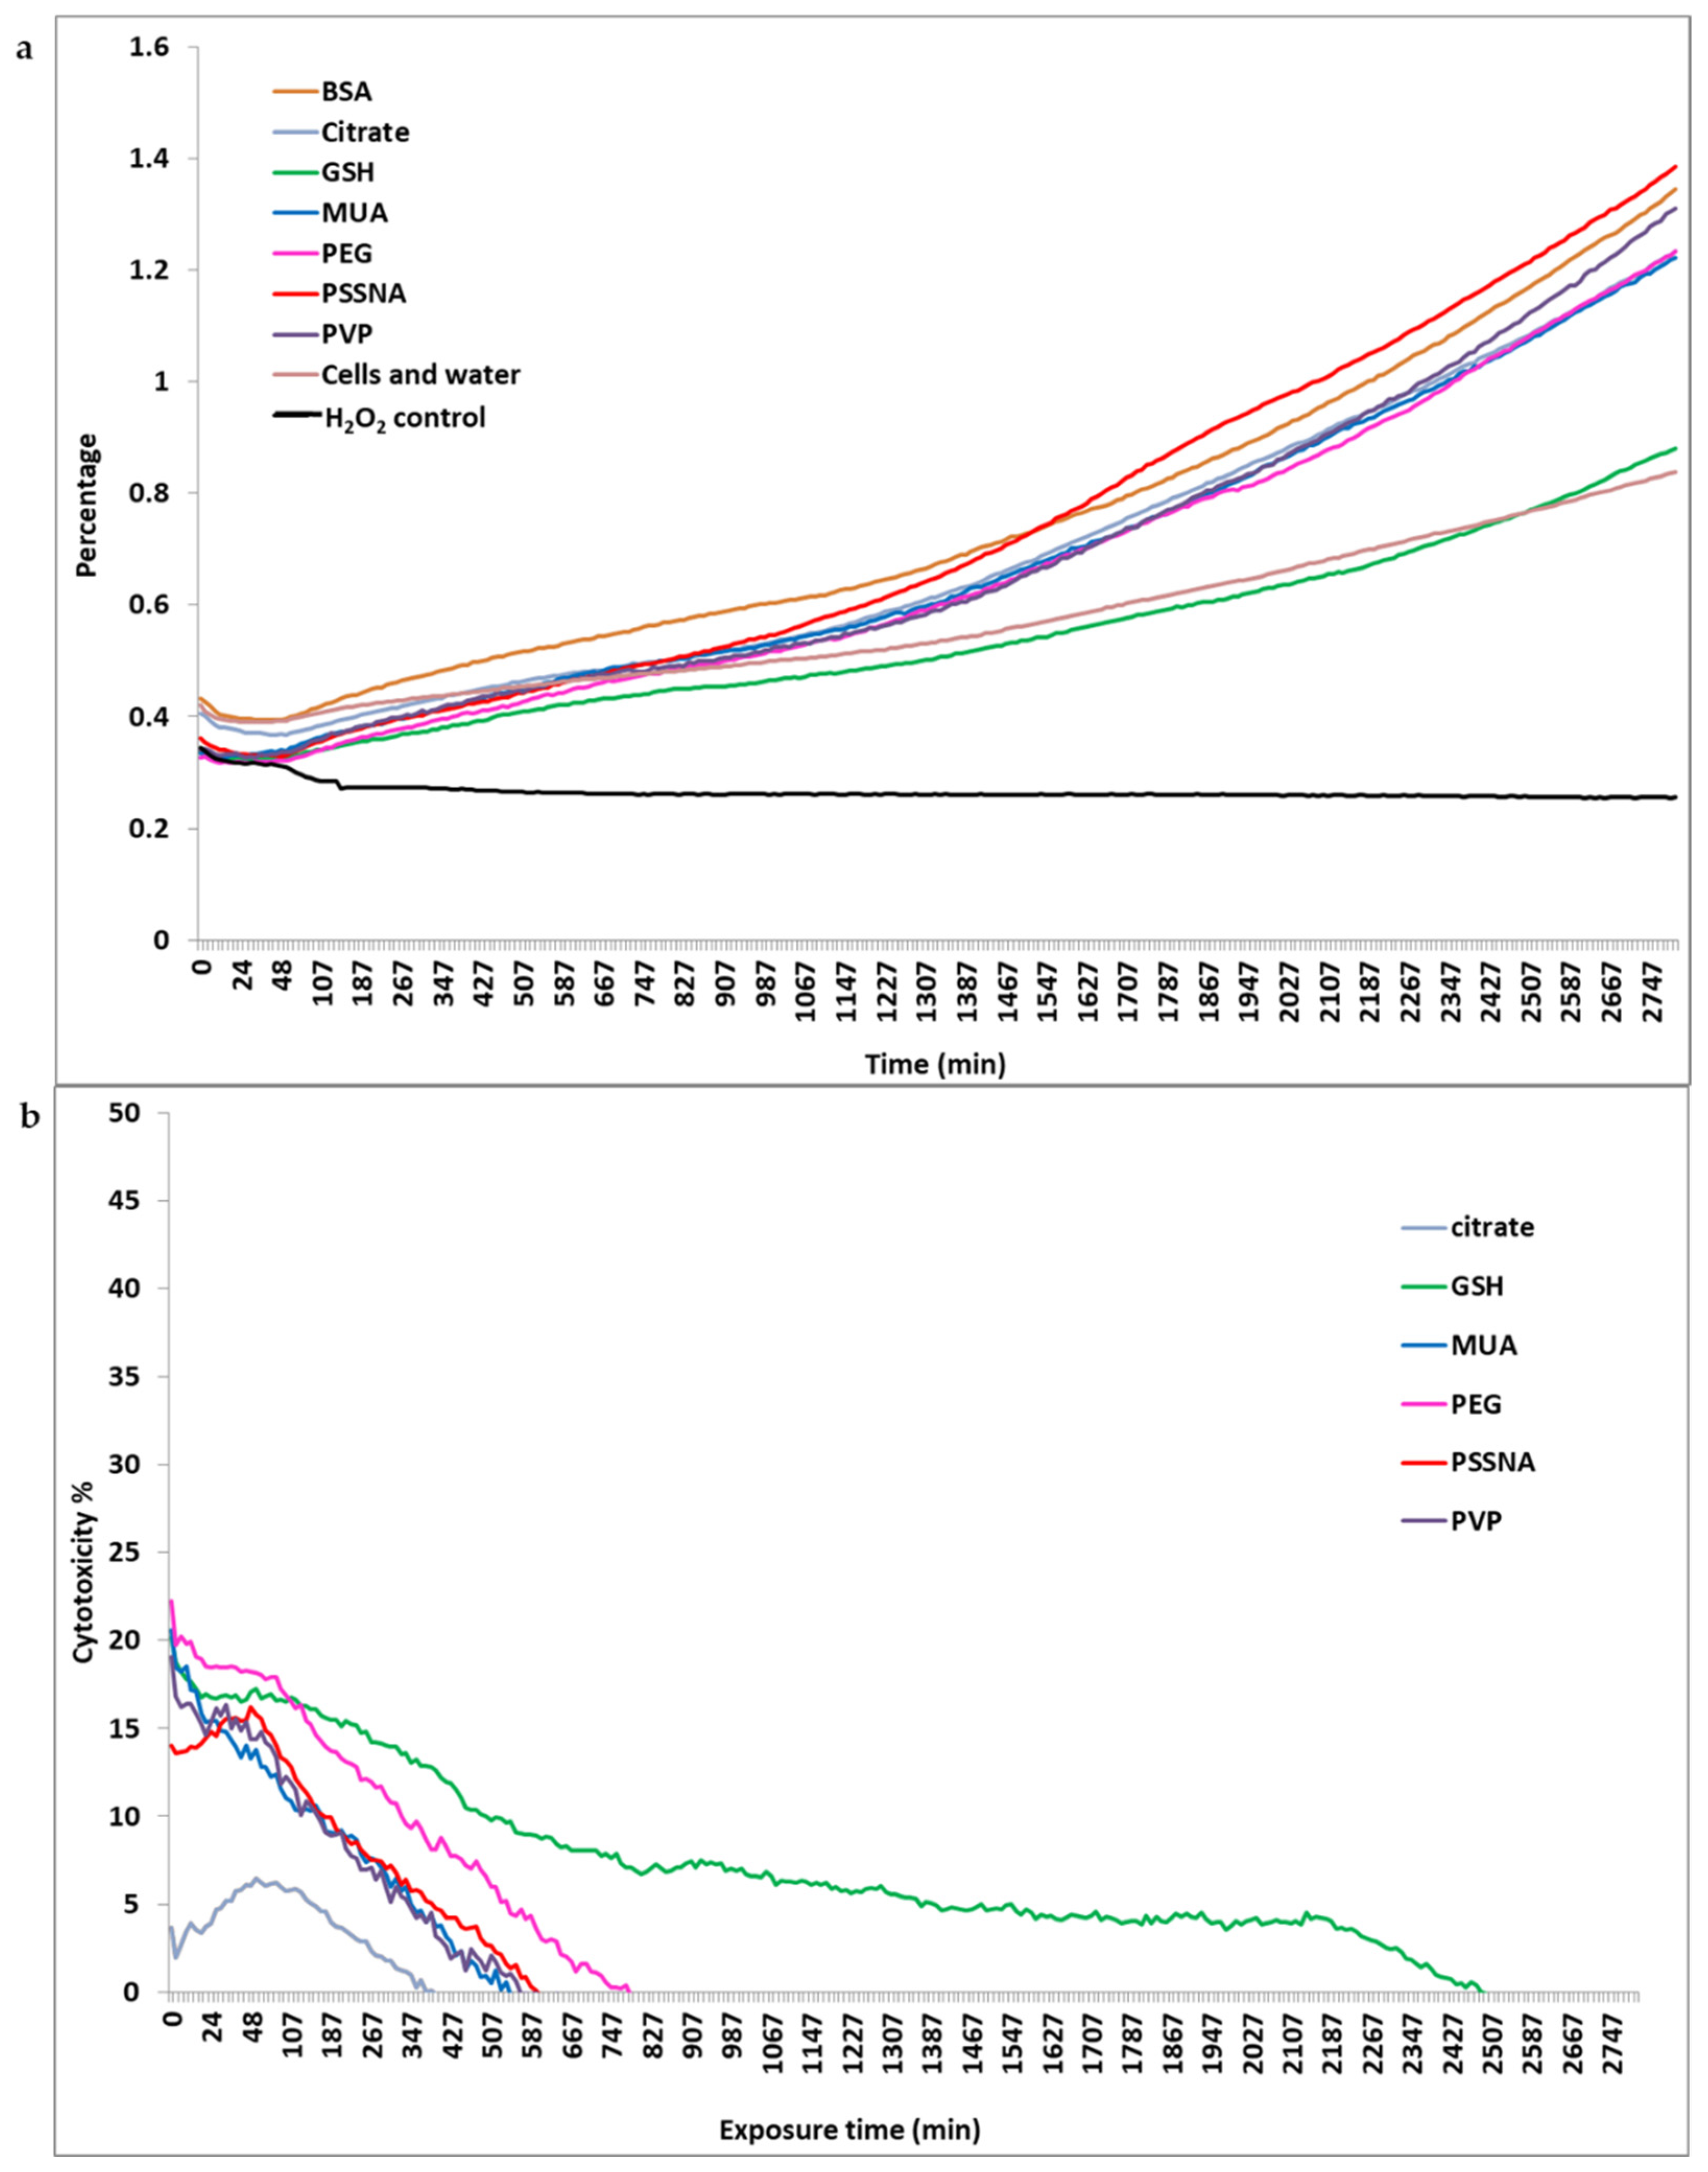
3.2.3. xCELLigence
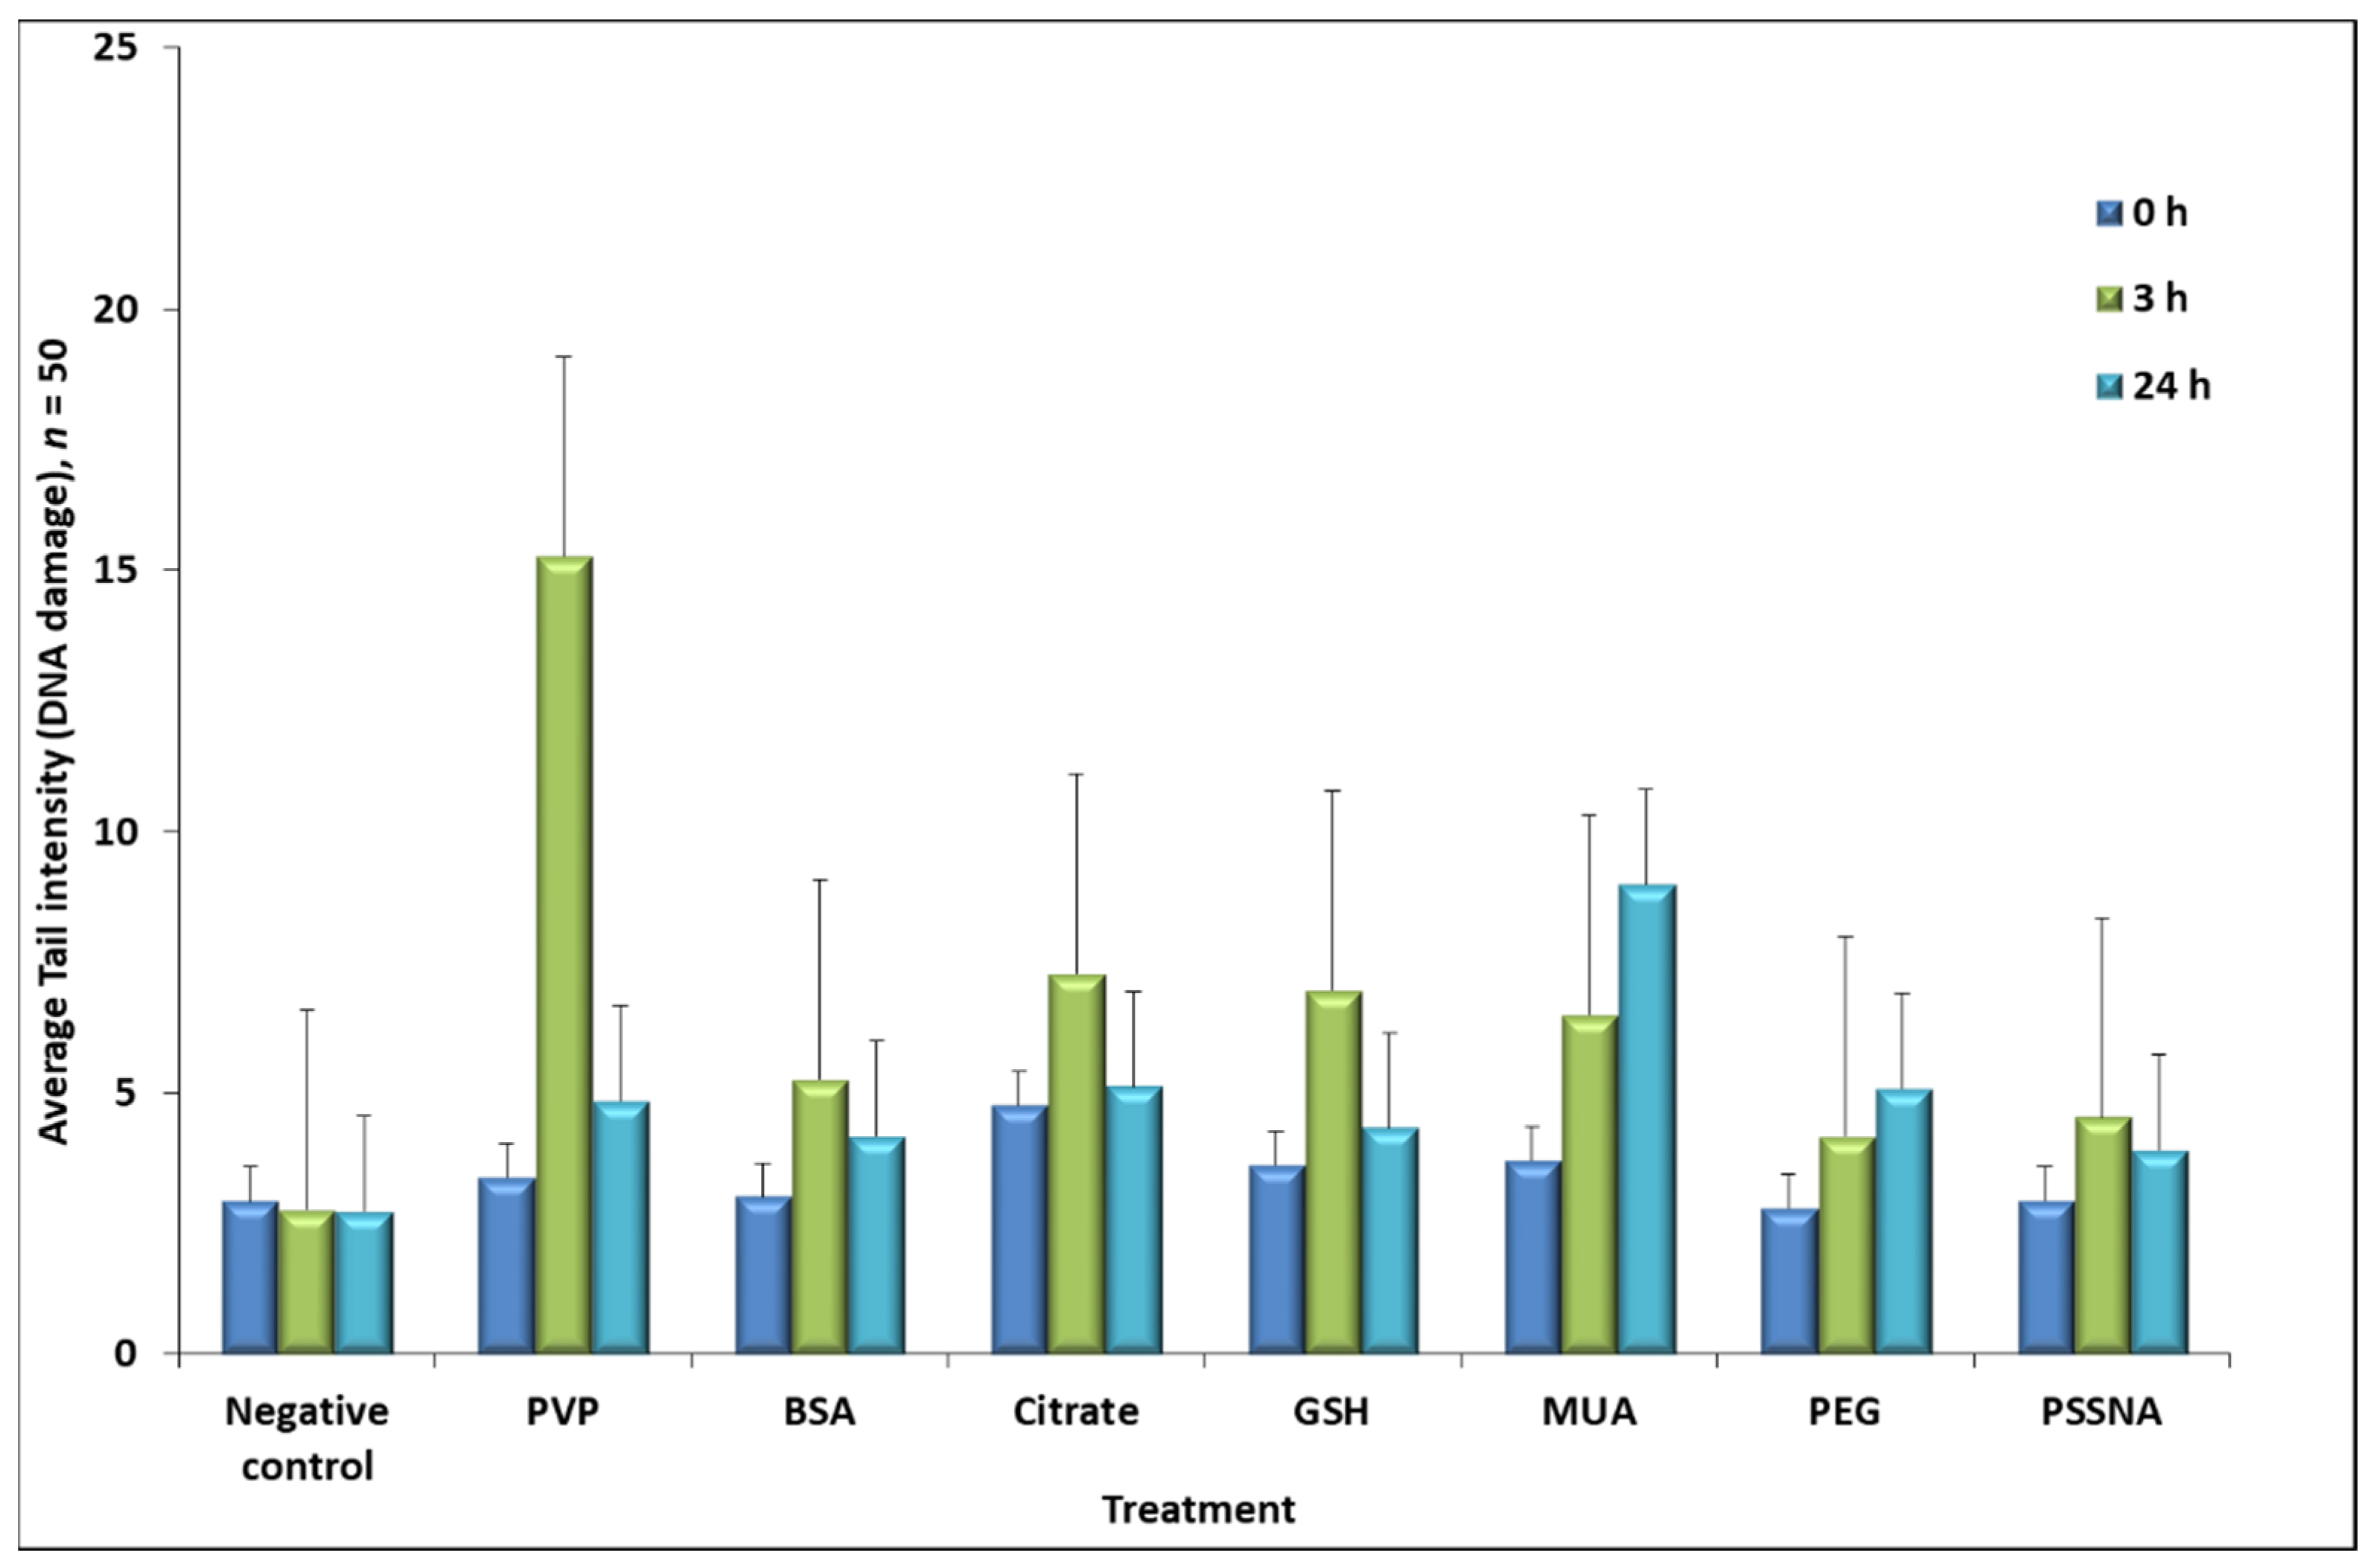
3.3. Genotoxicity
4. Discussion
5. Conclusions
Supplementary Materials
Author Contributions
Funding
Institutional Review Board Statement
Informed Consent Statement
Data Availability Statement
Acknowledgments
Conflicts of Interest
References
- Solano-Umaña, V.; Vega Baudrit, J. The New Field of the Nanomedicine. Int. J. Appl. Sci. Technol. 2015, 5, 79. [Google Scholar]
- Panyala, R.N.; Pena-Mendez, M.E.; Havel, J. Gold and nano-gold in medicine: Overview, toxicology and perspectives. J. Appl. Biomed. 2009, 7, 75–91. [Google Scholar] [CrossRef] [Green Version]
- Daniel, M.-C.; Astruc, D. Gold Nanoparticles: Assembly, Supramolecular Chemistry, Quantum-Size-Related Properties, and Applications toward Biology, Catalysis, and Nanotechnology. Chem. Rev. 2004, 104, 293–346. [Google Scholar] [CrossRef] [PubMed]
- Patra, C.R.; Bhattacharya, R.; Mukhopadhyay, D.; Mukherjee, P. Fabrication of gold nanoparticles for targeted therapy in pancreatic cancer. Adv. Drug Deliv. Rev. 2010, 62, 346–361. [Google Scholar] [CrossRef] [PubMed] [Green Version]
- Rosarin, F.; Mirunalini, S. Nobel metallic nanoparticles with novel biomedical properties. J. Bioanal. Biomed. 2011, 3, 85–91. [Google Scholar] [CrossRef] [Green Version]
- Jain, S.; Hirst, D.G.; O’Sullivan, J.M. Gold nanoparticles as novel agents for cancer therapy. Br. J. Radiol. 2012, 85, 101–113. [Google Scholar] [CrossRef] [PubMed]
- Cabuzu, D.; Cirja, A.; Puiu, R.; Grumezescu, A.M. Biomedical applications of gold nanoparticles. Curr. Top. Med. Chem. 2015, 15, 1605–1613. [Google Scholar] [CrossRef]
- Parveen, S.; Misra, R.; Sahoo, S.K. Nanoparticles: A boon to drug delivery, therapeutics, diagnostics and imaging. Nanomed. Nanotechnol. Biol. Med. 2012, 8, 147–166. [Google Scholar] [CrossRef]
- Ajnai, G.; Chiu, A.; Kan, T.; Cheng, C.-C.; Tsai, T.-H.; Chang, J. Trends of Gold Nanoparticle-based Drug Delivery System in Cancer Therapy. J. Exp. Clin. Med. 2014, 6, 172–178. [Google Scholar] [CrossRef]
- Gulumian, M.; Kuempel, E.; Savolainen, K. Global challenges in the risk assessment of nanomaterials: Relevance to South Africa. S. Afr. J. Sci. 2012, 108, 1–9. [Google Scholar] [CrossRef]
- Magdolenova, Z.; Collins, A.; Kumar, A.; Dhawan, A.; Stone, V.; Dusinska, M. Mechanisms of genotoxicity. A review of in vitro and in vivo studies with engineered nanoparticles. Nanotoxicology 2014, 8, 233–278. [Google Scholar] [CrossRef] [PubMed]
- Schulte, P.A.; Roth, G.; Hodson, L.L.; Murashov, V.; Hoover, M.D.; Zumwalde, R.; Kuempel, E.D.; Geraci, C.L.; Stefaniak, A.B.; Castranova, V.; et al. Taking stock of the occupational safety and health challenges of nanotechnology: 2000–2015. J. Nanopart. Res. 2016, 18, 159. [Google Scholar] [CrossRef] [PubMed] [Green Version]
- Qian, L.; Su, W.; Wang, Y.; Dang, M.; Zhang, W.; Wang, C. Synthesis and characterization of gold nanoparticles from aqueous leaf extract of Alternanthera sessilis and its anticancer activity on cervical cancer cells (HeLa). Artif. Cells Nanomed. Biotechnol. 2019, 47, 1173–1180. [Google Scholar] [CrossRef] [PubMed] [Green Version]
- Agasti, S.S.; Chompoosor, A.; You, C.-C.; Ghosh, P.; Kim, C.K.; Rotello, V.M. Photoregulated Release of Caged Anticancer Drugs from Gold Nanoparticles. J. Am. Chem. Soc. 2009, 131, 5728–5729. [Google Scholar] [CrossRef] [Green Version]
- Papasani, M.R.; Wang, G.; Hill, R.A. Gold nanoparticles: The importance of physiological principles to devise strategies for targeted drug delivery. Nanomed. Nanotechnol. Biol. Med. 2012, 8, 804–814. [Google Scholar] [CrossRef]
- Lien Nghiem, T.H.; Nguyen, T.T.; Fort, E.; Nguyen, T.P.; Nhung Hoang, T.M.; Nguyen, T.Q.; Nhung Tran, H. Capping and in vivo toxicity studies of gold nanoparticles. Adv. Nat. Sci. Nanosci. Nanotechnol. 2012, 3, 015002. [Google Scholar] [CrossRef]
- Kermanizadeh, A.; Powell, L.G.; Stone, V. A review of hepatic nanotoxicology—Summation of recent findings and considerations for the next generation of study designs. J. Toxicol. Environ. Health Part B 2020, 23, 137–176. [Google Scholar] [CrossRef]
- Yao, Y.; Zang, Y.; Qu, J.; Tang, M.; Zhang, T. The Toxicity Of Metallic Nanoparticles On Liver: The Subcellular Damages, Mechanisms, And Outcomes. Int. J. Nanomed. 2019, 14, 8787–8804. [Google Scholar] [CrossRef] [Green Version]
- Soenen, S.; Rivera-Gil, P.; Montenegro, J.; Parak, W.; De Smedt, S.; Braeckmans, K. Cellular toxicity of inorganic nanoparticles: Common aspects and guidelines for improved nanotoxicity evaluation. Nanotoday 2011, 6, 446–465. [Google Scholar] [CrossRef]
- Carnovale, C.; Bryant, G.; Shukla, R.; Bansal, V. Identifying Trends in Gold Nanoparticle Toxicity and Uptake: Size, Shape, Capping Ligand, and Biological Corona. ACS Omega 2019, 4, 242–256. [Google Scholar] [CrossRef] [Green Version]
- Tedesco, S.; Doyle, H.; Blasco, J.; Redmond, G.; Sheehan, D. Oxidative stress and toxicity of gold nanoparticles in Mytilus edulis. Aquat. Toxicol. 2010, 100, 178–186. [Google Scholar] [CrossRef] [PubMed]
- Sani, A.; Cao, C.; Cui, D. Toxicity of gold nanoparticles (AuNPs): A review. Biochem. Biophys. Rep. 2021, 26, 100991. [Google Scholar] [CrossRef] [PubMed]
- Patra, H.K.; Banerjee, S.; Chaudhuri, U.; Lahiri, P.; Dasgupta, A.K. Cell selective response to gold nanoparticles. Nanomed. Nanotechnol. Biol. Med. 2007, 3, 111–119. [Google Scholar] [CrossRef] [PubMed]
- Panigrahi, S.; Basu, S.; Praharaj, S.; Pande, S.; Jana, S.; Pal, A.; Ghosh, S.K.; Pal, T. Synthesis and Size-Selective Catalysis by Supported Gold Nanoparticles: Study on Heterogeneous and Homogeneous Catalytic Process. J. Phys. Chem. C 2007, 111, 4596–4605. [Google Scholar] [CrossRef]
- Haiss, W.; Thanh, N.T.K.; Aveyard, J.; Fernig, D.G. Determination of Size and Concentration of Gold Nanoparticles from UV−Vis Spectra. Anal. Chem. 2007, 79, 4215–4221. [Google Scholar] [CrossRef]
- Karri, V.; Kumar, V.; Ramos, D.; Oliveira, E.; Schuhmacher, M. Comparative In Vitro Toxicity Evaluation of Heavy Metals (Lead, Cadmium, Arsenic, and Methylmercury) on HT-22 Hippocampal Cell Line. Biol. Trace Elem. Res. 2018, 184, 226–239. [Google Scholar] [CrossRef] [Green Version]
- Biosciences, G. CytoScan™. WST-1 Cell Cytotoxicity Assay Colorimetric Assay for Quantitation of Cellular Cytotoxicity & Proliferation; A Geno Technology Inc.: St. Louis, MO, USA, 2013. [Google Scholar]
- Sundquist, T.; Moravec, R.; Niles, A.; O’Brien, M.; Riss, T. Timing your apoptosis assays. Cell Notes 2006, 16, 18–21. [Google Scholar]
- Singh, N.P.; McCoy, M.T.; Tice, R.R.; Schneider, E.L. A simple technique for quantitation of low levels of DNA damage in individual cells. Exp. Cell Res. 1988, 175, 184–191. [Google Scholar] [CrossRef] [Green Version]
- Collins, A.R.; Dobson, V.L.; Dusinská, M.; Kennedy, G.; Stĕtina, R. The comet assay: What can it really tell us? Mutat. Res. 1997, 375, 183–193. [Google Scholar] [CrossRef]
- Van Dyk, E.; Pretorius, P.J. DNA damage and repair in mammalian cells exposed to p-hydroxyphenylpyruvic acid. Biochem. Biophys. Res. Commun. 2005, 338, 815–819. [Google Scholar] [CrossRef]
- Field, A. Discovering Statistics Using IBM SPSS Statistics; SAGE Publications: Thousand Oaks, CA, USA, 2009. [Google Scholar]
- Welch, B.L. On the Comparison of Several Mean Values: An Alternative Approach. Biometrika 1951, 38, 330–336. [Google Scholar] [CrossRef]
- Fraga, S.; Faria, H.; Soares, M.E.; Duarte, J.A.; Soares, L.; Pereira, E.; Costa-Pereira, C.; Teixeira, J.P.; de Lourdes Bastos, M.; Carmo, H. Influence of the surface coating on the cytotoxicity, genotoxicity and uptake of gold nanoparticles in human HepG2 cells. J. Appl. Toxicol. 2013, 33, 1111–1119. [Google Scholar] [CrossRef] [PubMed]
- Jayaraman, A.; Hahn, J. Methods in Bioengineering: Systems Analysis of Biological Networks; Artech House: Boston, MA, USA, 2009. [Google Scholar]
- Arzumanian, V.A.; Kiseleva, O.I.; Poverennaya, E.V. The Curious Case of the HepG2 Cell Line: 40 Years of Expertise. Int. J. Mol. Sci. 2021, 22, 13135. [Google Scholar] [CrossRef]
- MacCuspie, R.I. Nanoparticle Size. Measurement Techniques. Comparison of LVEM, TEM, SEM, AFM, DLS, spICP-MS, and AF4; Delong Instruments: Brno, Czech Republic, 2021. [Google Scholar]
- Nurakhmetova, Z.A.; Azhkeyeva, A.N.; Klassen, I.A.; Tatykhanova, G.S. Synthesis and Stabilization of Gold Nanoparticles Using Water-Soluble Synthetic and Natural Polymers. Polymers 2020, 12, 2625. [Google Scholar] [CrossRef] [PubMed]
- Shenhar, R.; Norsten, T.B.; Rotello, V.M. Polymer-Mediated Nanoparticle Assembly: Structural Control and Applications. Adv. Mater. 2005, 17, 657–669. [Google Scholar] [CrossRef]
- Cartiera, M.S.; Johnson, K.M.; Rajendran, V.; Caplan, M.J.; Saltzman, W.M. The uptake and intracellular fate of PLGA nanoparticles in epithelial cells. Biomaterials 2009, 30, 2790–2798. [Google Scholar] [CrossRef] [Green Version]
- Divine, K.K.; Ayala-Fierro, F.; Barber, D.S.; Carter, D.E. Glutathione, albumin, cysteine, and cys-gly effects on toxicity and accumulation of mercuric chloride in LLC-PK1 cells. J. Toxicol. Environ. Health. Part A 1999, 57, 489–505. [Google Scholar] [CrossRef]
- Emerson, T.E., Jr. Unique features of albumin: A brief review. Crit. Care Med. 1989, 17, 690–694. [Google Scholar] [CrossRef]
- Oudemans-van Straaten, H.M.; Ostermann, M. Bench-to-bedside review: Citrate for continuous renal replacement therapy, from science to practice. Crit. Care 2012, 16, 249. [Google Scholar] [CrossRef] [Green Version]
- Lu, Y.; Zhang, X.; Zhang, H.; Lan, J.; Huang, G.; Varin, E.; Lincet, H.; Poulain, L.; Icard, P. Citrate Induces Apoptotic Cell Death: A Promising Way to Treat Gastric Carcinoma? Anticancer Res. 2011, 31, 797–805. [Google Scholar]
- Lindeque, J.Z.; Matthyser, A.; Mason, S.; Louw, R.; Taute, C.J.F. Metabolomics reveals the depletion of intracellular metabolites in HepG2 cells after treatment with gold nanoparticles. Nanotoxicology 2018, 12, 251–262. [Google Scholar] [CrossRef]
- Tlotleng, N.; Vetten, M.A.; Keter, F.K.; Skepu, A.; Tshikhudo, R.; Gulumian, M. Cytotoxicity, intracellular localization and exocytosis of citrate capped and PEG functionalized gold nanoparticles in human hepatocyte and kidney cells. Cell Biol. Toxicol. 2016, 32, 305–321. [Google Scholar] [CrossRef] [PubMed]
- Das, S.; Debnath, N.; Mitra, S.; Datta, A.; Goswami, A. Comparative analysis of stability and toxicity profile of three differently capped gold nanoparticles for biomedical usage. BioMetals 2012, 25, 1009–1022. [Google Scholar] [CrossRef]
- Simpson, C.A.; Salleng, K.J.; Cliffel, D.E.; Feldheim, D.L. In vivo toxicity, biodistribution, and clearance of glutathione-coated gold nanoparticles. Nanomed. Nanotechnol. Biol. Med. 2013, 9, 257–263. [Google Scholar] [CrossRef] [PubMed]
- Liu, C.-J.; Wang, C.-H.; Chien, C.-C.; Yang, T.-Y.; Chen, S.-T.; Leng, W.-H.; Lee, C.-F.; Lee, K.-H.; Hwu, Y.; Lee, Y.-C.; et al. Enhanced x-ray irradiation-induced cancer cell damage by gold nanoparticles treated by a new synthesis method of polyethylene glycol modification. Nanotechnology 2008, 19, 295104. [Google Scholar] [CrossRef] [PubMed] [Green Version]
- Banki, K.; Hutter, E.; Colombo, E.; Gonchoroff, N.J.; Perl, A. Glutathione levels and sensitivity to apoptosis are regulated by changes in transaldolase expression. J. Biol. Chem. 1996, 271, 32994–33001. [Google Scholar] [CrossRef] [PubMed] [Green Version]
- Kominkova, M.; Michalek, P.; Cihalova, K.; Guran, R.; Cernei, N.; Nejdl, L.; Smerkova, K.; Dostalova, S.; Chudobova, D.; Heger, Z.; et al. Study of linkage between glutathione pathway and the antibiotic resistance of Escherichia coli from patients’ swabs. Int. J. Mol. Sci. 2015, 16, 7210–7229. [Google Scholar] [CrossRef] [PubMed] [Green Version]
- Enea, M.; Pereira, E.; Costa, J.; Soares, M.E.; Dias da Silva, D.; Bastos, M.d.L.; Carmo, H.F. Cellular uptake and toxicity of gold nanoparticles on two distinct hepatic cell models. Toxicol. Vitr. 2021, 70, 105046. [Google Scholar] [CrossRef] [PubMed]
- Vales, G.; Suhonen, S.; Siivola, K.; Savolainen, K.; Catalán, J.; Norppa, H. Genotoxicity and Cytotoxicity of Gold Nanoparticles In Vitro: Role of Surface Functionalization and Particle Size. Nanomaterials 2020, 10, 271. [Google Scholar] [CrossRef] [PubMed] [Green Version]
- Poljsak, B.; Šuput, D.; Milisav, I. Achieving the balance between ROS and antioxidants: When to use the synthetic antioxidants. Oxid. Med. Cell. Longev. 2013, 2013, 956792. [Google Scholar] [CrossRef]
- ABCAM. How to Convert between Different Concentrations [Online]. 2021. Available online: https://www.abcam.com/help/how-to-convert-between-different-concentrations (accessed on 17 January 2022).
- Bueno, V.B.; Petri, D.F.S. Xanthan hydrogel films: Molecular conformation, charge density and protein carriers. Carbohydr. Polym. 2014, 101, 897–904. [Google Scholar] [CrossRef] [PubMed] [Green Version]
- Gans, E.H.; Chavkin, L. The use of polyethylene glycol in tablet coating. J. Am. Pharm. Assoc. 1954, 43, 483–485. [Google Scholar] [CrossRef] [PubMed]
- Nadi, M.M.; Ashrafi Kooshk, M.R.; Mansouri, K.; Ghadami, S.A.; Amani, M.; Ghobadi, S.; Khodarahmi, R. Comparative Spectroscopic Studies on Curcumin Stabilization by Association to Bovine Serum Albumin and Casein: A Perspective on Drug-Delivery Application. Int. J. Food Prop. 2014, 18, 638–659. [Google Scholar] [CrossRef]
- Nair, B. Final Report On the Safety Assessment of Polyvinylpyrrolidone (PVP). Int. J. Toxicol. 1998, 17, 95–130. [Google Scholar] [CrossRef]
- National Center For Biotechnology & Information. 11-Mercaptoundecanoic Acid [Online]. 2015. Available online: https://pubchem.ncbi.nlm.nih.gov/compound/543502 (accessed on 27 March 2005).
- Okumura, M.; Shimamoto, S.; Nakanishi, T.; Yoshida, Y.-I.; Konogami, T.; Maeda, S.; Hidaka, Y. Effects of positively charged redox molecules on disulfide-coupled protein folding. FEBS Lett. 2012, 586, 3926–3930. [Google Scholar] [CrossRef] [Green Version]
- Shovsky, A.; Varga, I.; Makuska, R.; Claesson, P.M. Adsorption and solution properties of bottle-brush polyelectrolyte complexes: Effect of molecular weight and stoichiometry. Langmuir 2012, 28, 6618–6631. [Google Scholar] [CrossRef]
- Simonian, A.L.; Revzin, A.; Wild, J.R.; Elkind, J.; Pishko, M.V. Characterization of oxidoreductase–redox polymer electrostatic film assembly on gold by surface plasmon resonance spectroscopy and Fourier transform infrared–external reflection spectroscopy. Anal. Chim. Acta 2002, 466, 201–212. [Google Scholar] [CrossRef]
- Tolwani, A.J.; Campbell, R.C.; Schenk, M.B.; Allon, M.; Warnock, D.G. Simplified citrate anticoagulation for continuous renal replacement therapy. Kidney Int. 2001, 60, 370–374. [Google Scholar] [CrossRef] [Green Version]
- Townsend, D.M.; Tew, K.D.; Tapiero, H. The importance of glutathione in human disease. Biomed. Pharmacother. 2003, 57, 145–155. [Google Scholar] [CrossRef]
- Venkatesan, R.; Pichaimani, A.; Hari, K.; Balasubramanian, P.K.; Kulandaivel, J.; Premkumar, K. Doxorubicin conjugated gold nanorods: A sustained drug delivery carrier for improved anticancer therapy. J. Mater. Chem. B 2013, 1, 1010–1018. [Google Scholar] [CrossRef]


| Ligand | Gel Electrophoresis: Particle Charge | DLS: Hydrodynamic Diameter (nm) |
|---|---|---|
| BSA | Negative | 23.32 |
| Citrate | Negative | 17.40 |
| GSH | Negative | 17.33 |
| MUA | Negative | 17.21 |
| PEG | Neutral | 18.86 |
| PSSNA | Negative | 17.26 |
| PVP | Negative | 18.96 |
| Ligand | * WST-1 | ICP-MS | ApoPercentage | ||||
|---|---|---|---|---|---|---|---|
| IC 30 (pM) | Cell % | Normalized IC30 (pM) | Fold Change in Cytotoxicity/Relative Cytotoxicity | PBS % | Media % | Apoptotic Time-Point | |
| BSA | 430 ± 2.96 | 2 | 9 | 47.8 ± 2.96 | 2 | 96 | Stepwise |
| Citrate | 860 ± 4.78 | 17 | 146 | 5.9 ± 4.78 | 3 | 80 | Stepwise |
| GSH | 220 ± 4.07 | 92 | 202 | 1.1 ± 4.07 | 2 | 6 | 3 h |
| MUA | 220 ± 4.18 | 10 | 22 | 10.0 ± 4.18 | 2 | 88 | 6 h |
| PEG | 430 ± 4.76 | 22 | 95 | 4.5 ± 4.76 | 7 | 71 | 3 h |
| PSSNA | 430 ± 4.33 | 23 | 99 | 4.3 ± 4.33 | 0 | 77 | 3 h |
| PVP | 430 ± 3.46 | 32 | 138 | 3.1 ± 3.46 | 2 | 66 | 3 h |
| Ligand | Time-Point at Which DNA Damage Was Determined # | |||
|---|---|---|---|---|
| 0 h | 3 h | 24 h | Welch p-Value | |
| BSA | 26 | 36 | 24 | 0.004 * |
| Citrate | 24 | 36 | 36 | 0.494 |
| GSH | 20 | 38 | 24 | 0.381 |
| MUA | 24 | 28 | 46 | 0.003 *** |
| PEG | 22 | 26 | 32 | 0.033 *** |
| PSSNA | 20 | 32 | 28 | 0.103 |
| PVP | 22 | 48 | 28 | 0.005 *,** |
| Positive control | 100 | 100 | 100 | 1 |
| Negative control | 12 | 12 | 12 | 1 |
| Ligand | DLS Size (nm) ± 2 | Physio-Logical Charge | Cell Internalization % | Fold Change in Cytotoxicity/Relative Cytotoxicity | Apoptosis Induction Time | Cytotoxicity % (xCELLigence) | DNA Damage | DNA Repair |
|---|---|---|---|---|---|---|---|---|
| BSA | 23.32 | Negative | 2 | 50.0 | Stepwise | 0 | Yes | Yes |
| Citrate | 17.4 | Negative | 17 | 5.9 | Stepwise | 4 | Yes | No |
| GSH | 17.33 | Negative | 92 | 1.1 | 3 h | 20 | Yes | Yes |
| MUA | 17.21 | Negative | 10 | 10.0 | 6 h | 18 | Yes | No |
| PEG | 18.86 | Neutral | 22 | 4.5 | 3 h | 22 | Yes | No |
| PSSNA | 17.26 | Negative | 23 | 4.3 | 3 h | 14 | Yes | Yes |
| PVP | 18.96 | Negative | 32 | 3.1 | 3 h | 17 | Yes | Yes |
Publisher’s Note: MDPI stays neutral with regard to jurisdictional claims in published maps and institutional affiliations. |
© 2022 by the authors. Licensee MDPI, Basel, Switzerland. This article is an open access article distributed under the terms and conditions of the Creative Commons Attribution (CC BY) license (https://creativecommons.org/licenses/by/4.0/).
Share and Cite
Mulder, D.; Taute, C.J.F.; van Wyk, M.; Pretorius, P.J. A Comparison of the Genotoxic Effects of Gold Nanoparticles Functionalized with Seven Different Ligands in Cultured Human Hepatocellular Carcinoma Cells. Nanomaterials 2022, 12, 1126. https://0-doi-org.brum.beds.ac.uk/10.3390/nano12071126
Mulder D, Taute CJF, van Wyk M, Pretorius PJ. A Comparison of the Genotoxic Effects of Gold Nanoparticles Functionalized with Seven Different Ligands in Cultured Human Hepatocellular Carcinoma Cells. Nanomaterials. 2022; 12(7):1126. https://0-doi-org.brum.beds.ac.uk/10.3390/nano12071126
Chicago/Turabian StyleMulder, Danielle, Cornelius Johannes Francois Taute, Mari van Wyk, and Pieter J. Pretorius. 2022. "A Comparison of the Genotoxic Effects of Gold Nanoparticles Functionalized with Seven Different Ligands in Cultured Human Hepatocellular Carcinoma Cells" Nanomaterials 12, no. 7: 1126. https://0-doi-org.brum.beds.ac.uk/10.3390/nano12071126