
A Plasmonic Biosensor Based on Light-Diffusing Fibers Functionalized with Molecularly Imprinted Nanoparticles for Ultralow Sensing of Proteins

 ,
,  , ,
, ,  , , ,
, , ,  and
and 
Abstract
:
1. Introduction
2. Materials and Methods
2.1. Chemicals
2.2. SPR-LDF Sensor System: Fabrication Steps and Experimental Setup
2.3. NanoMIP Synthesis and LDF-SPR Functionalization Process
3. Results and Discussion
4. Conclusions
Author Contributions
Funding
Institutional Review Board Statement
Informed Consent Statement
Data Availability Statement
Acknowledgments
Conflicts of Interest
References
- Homola, J. Present and future of surface plasmon resonance biosensors. Anal. Bioanal. Chem. 2003, 377, 528–539. [Google Scholar] [CrossRef] [PubMed]
- Tong, L.; Wei, H.; Zhang, S.; Xu, H. Recent advances in plasmonic sensors. Sensors 2014, 14, 7959–7973. [Google Scholar] [CrossRef] [PubMed] [Green Version]
- Singh, P. SPR biosensors: Historical perspectives and current challenges. Sens. Actuators B Chem. 2016, 229, 110–130. [Google Scholar] [CrossRef]
- Tabasi, O.; Falamaki, C. Recent advancements in the methodologies applied for the sensitivity enhancement of surface plasmon resonance sensors. Anal. Methods 2018, 10, 3906–3925. [Google Scholar] [CrossRef]
- Abbas, A.; Linman, M.J.; Cheng, Q. New trends in instrumental design for surface plasmon resonance-based biosensors. Biosens. Bioelectron. 2011, 26, 1815–1824. [Google Scholar] [CrossRef] [PubMed] [Green Version]
- Klantsataya, E.; Jia, P.; Ebendorff-Heidepriem, H.; Monro, T.M.; François, A. Plasmonic fiber optic refractometric sensors: From conventional architectures to recent design trends. Sensors 2017, 17, 12. [Google Scholar] [CrossRef] [PubMed] [Green Version]
- Li, M.; Cushing, S.K.; Wu, N. Plasmon-enhanced optical sensors: A review. Analyst 2015, 140, 386–406. [Google Scholar] [CrossRef] [Green Version]
- Walter, J.G.; Eilers, A.; Alwis, L.S.M.; Roth, B.W.; Bremer, K. SPR Biosensor Based on Polymer Multi-Mode Optical Waveguide and Nanoparticle Signal Enhancement. Sensors 2020, 20, 2889. [Google Scholar] [CrossRef]
- Caucheteur, C.; Guo, T.; Albert, J. Review of plasmonic fiber optic biochemical sensors: Improving the limit of detection. Anal. Bioanal. Chem. 2015, 407, 3883–3897. [Google Scholar] [CrossRef]
- Wang, W.; Mai, Z.; Chen, Y.; Wang, J.; Li, L.; Su, Q.; Li, X.; Hong, X. A label-free fiber optic SPR biosensor for specific detection of C-reactive protein. Sci. Rep. 2017, 7, 16904–16912. [Google Scholar] [CrossRef]
- Cennamo, N.; Pasquardini, L.; Arcadio, F.; Lunelli, L.; Vanzetti, L.; Carafa, V.; Altucci, L.; Zeni, L. SARS-CoV-2 spike protein detection through a plasmonic D-shaped plastic optical fiber aptasensor. Talanta 2021, 233, 122532–122541. [Google Scholar] [CrossRef] [PubMed]
- Yu, H.; Chong, Y.; Zhang, P.; Ma, J.; Li, D. A D-shaped fiber SPR sensor with a composite nanostructure of MoS2-graphene for glucose detection. Talanta 2020, 219, 121324. [Google Scholar] [CrossRef] [PubMed]
- Chiappini, A.; Pasquardini, L.; Bossi, A.M. Molecular imprinted polymers coupled to photonic structures in biosensors: The state of art. Sensors 2020, 20, 5069. [Google Scholar] [CrossRef]
- Shrivastav, A.M.; Mishra, S.K.; Gupta, B.D. Fiber optic SPR sensor for the detection of melamine using molecular imprinting. Sens. Actuators B Chem. 2015, 212, 404–410. [Google Scholar] [CrossRef]
- Arshady, R.; Mosbach, K. Synthesis of Substrate-selective Polymers by Host-guest Polymerization. Die Makromol. Chemie 1981, 182, 687–692. [Google Scholar] [CrossRef]
- Haupt, K. Molecularly imprinted polymers in analytical chemistry. Analyst 2001, 126, 747–756. [Google Scholar] [CrossRef]
- Haupt, K.; Mosbach, K. Molecularly imprinted polymers and their use in biomimetic sensors. Chem. Rev. 2000, 100, 2495–2504. [Google Scholar] [CrossRef]
- Bossi, A.; Bonini, F.; Turner, A.P.F.; Piletsky, S.A. Molecularly imprinted polymers for the recognition of proteins: The state of the art. Biosens. Bioelectron. 2007, 22, 1131–1137. [Google Scholar] [CrossRef]
- Haupt, K. Biomaterials: Plastic Antibodies. Nat. Mater. 2010, 9, 612–614. [Google Scholar] [CrossRef]
- Poma, A.; Turner, A.P.; Piletsky, S.A. Advances in the manufacture of MIP nanoparticles. Trends Biotechnol. 2010, 28, 629–637. [Google Scholar] [CrossRef]
- Cenci, L.; Tatti, R.; Tognato, R.; Ambrosi, E.; Piotto, C.; Bossi, A.M. Synthesis and characterization of peptide-imprinted nanogels of controllable size and affinity. Eur. Polym. J. 2018, 109, 453–459. [Google Scholar] [CrossRef]
- Bertolla, M.; Cenci, L.; Anesi, A.; Ambrosi, E.; Tagliaro, F.; Vanzetti, L.; Guella, G.; Bossi, A.M. Solvent-Responsive Molecularly Imprinted Nanogels for Targeted Protein Analysis in MALDI-TOF Mass Spectrometry. ACS Appl. Mater. Interfaces 2017, 9, 6908–6915. [Google Scholar] [CrossRef] [PubMed]
- Cennamo, N.; Maniglio, D.; Tatti, R.; Zeni, L.; Bossi, A.M. Deformable molecularly imprinted nanogels permit sensitivity-gain in plasmonic sensing. Biosens. Bioelectron. 2020, 156, 112126. [Google Scholar] [CrossRef]
- Cennamo, N.; Bossi, A.M.; Arcadio, F.; Maniglio, D.; Zeni, L. On the Effect of Soft Molecularly Imprinted Nanoparticles Receptors Combined to Nanoplasmonic Probes for Biomedical Applications. Front. Bioeng. Biotechnol. 2021, 9, 801489. [Google Scholar] [CrossRef] [PubMed]
- Cennamo, N.; Zeni, L.; Catalano, E.; Arcadio, F.; Minardo, A. Refractive Index Sensing through Surface Plasmon Resonance in Light-Diffusing Fibers. Appl. Sci. 2018, 8, 1172. [Google Scholar] [CrossRef] [Green Version]
- Cennamo, N.; Zeni, L.; Arcadio, F.; Catalano, E.; Minardo, A. A Novel Approach to Realizing Low-Cost Plasmonic Optical Fiber Sensors: Light-Diffusing Fibers Covered by Thin Metal Films. Fibers 2019, 7, 34. [Google Scholar] [CrossRef] [Green Version]
- Cennamo, N.; Arcadio, F.; Del Prete, D.; Buonanno, G.; Minardo, A.; Pirozzi, S.; Zeni, L. A Simple and Efficient Plasmonic Sensor in Light Diffusive Polymer Fibers. IEEE Sens. J. 2021, 21, 16054–16060. [Google Scholar] [CrossRef]
- Zhou, X.; Cheng, T.; Li, S.; Suzuki, T.; Ohishi, Y. Practical sensing approach based on surface plasmon resonance in a photonic crystal fiber. OSA Contin. 2018, 1, 1332–1340. [Google Scholar] [CrossRef]
- Butt, M.A.; Khonina, S.N.; Kazanskiy, N.L. Plasmonics: A Necessity in the Field of Sensing-A Review (Invited). Fiber Integr. Opt. 2021, 40, 14–47. [Google Scholar] [CrossRef]
- Deng, Y.; Cao, G.; Wu, Y.; Zhou, X.; Liao, W. Theoretical Description of Dynamic Transmission Characteristics in MDM Waveguide Aperture-Side-Coupled with Ring Cavity. Plasmonics 2015, 10, 1537–1543. [Google Scholar] [CrossRef]
- Deng, Y.; Cao, G.; Yang, H.; Zhou, X.; Wu, Y. Dynamic Control of Double Plasmon-Induced Transparencies in Aperture-Coupled Waveguide-Cavity System. Plasmonics 2018, 13, 345–352. [Google Scholar] [CrossRef]
- Cennamo, N.; Trono, C.; Giannetti, A.; Baldini, F.; Minardo, A.; Zeni, L.; Tombelli, S. Biosensors exploiting unconventional platforms: The case of plasmonic light-diffusing fibers. Sens. Actuators B Chem. 2021, 337, 129771. [Google Scholar] [CrossRef]
- Matsui, J.; Akamatsu, K.; Nishiguchi, S.; Miyoshi, D.; Nawafune, H.; Tamaki, K.; Sugimoto, N. Composite of Au nanoparticles and molecularly imprinted polymer as a sensing material. Anal. Chem. 2004, 76, 1310–1315. [Google Scholar] [CrossRef] [PubMed]
- Mayang, Y.; He, X.; Cen, L.; Zhang, Y. Detection of transferrin by using a surface plasmon resonance sensor functionalized with a boronic acid monolayer. Microchim. Acta 2017, 184, 2749–2757. [Google Scholar] [CrossRef]


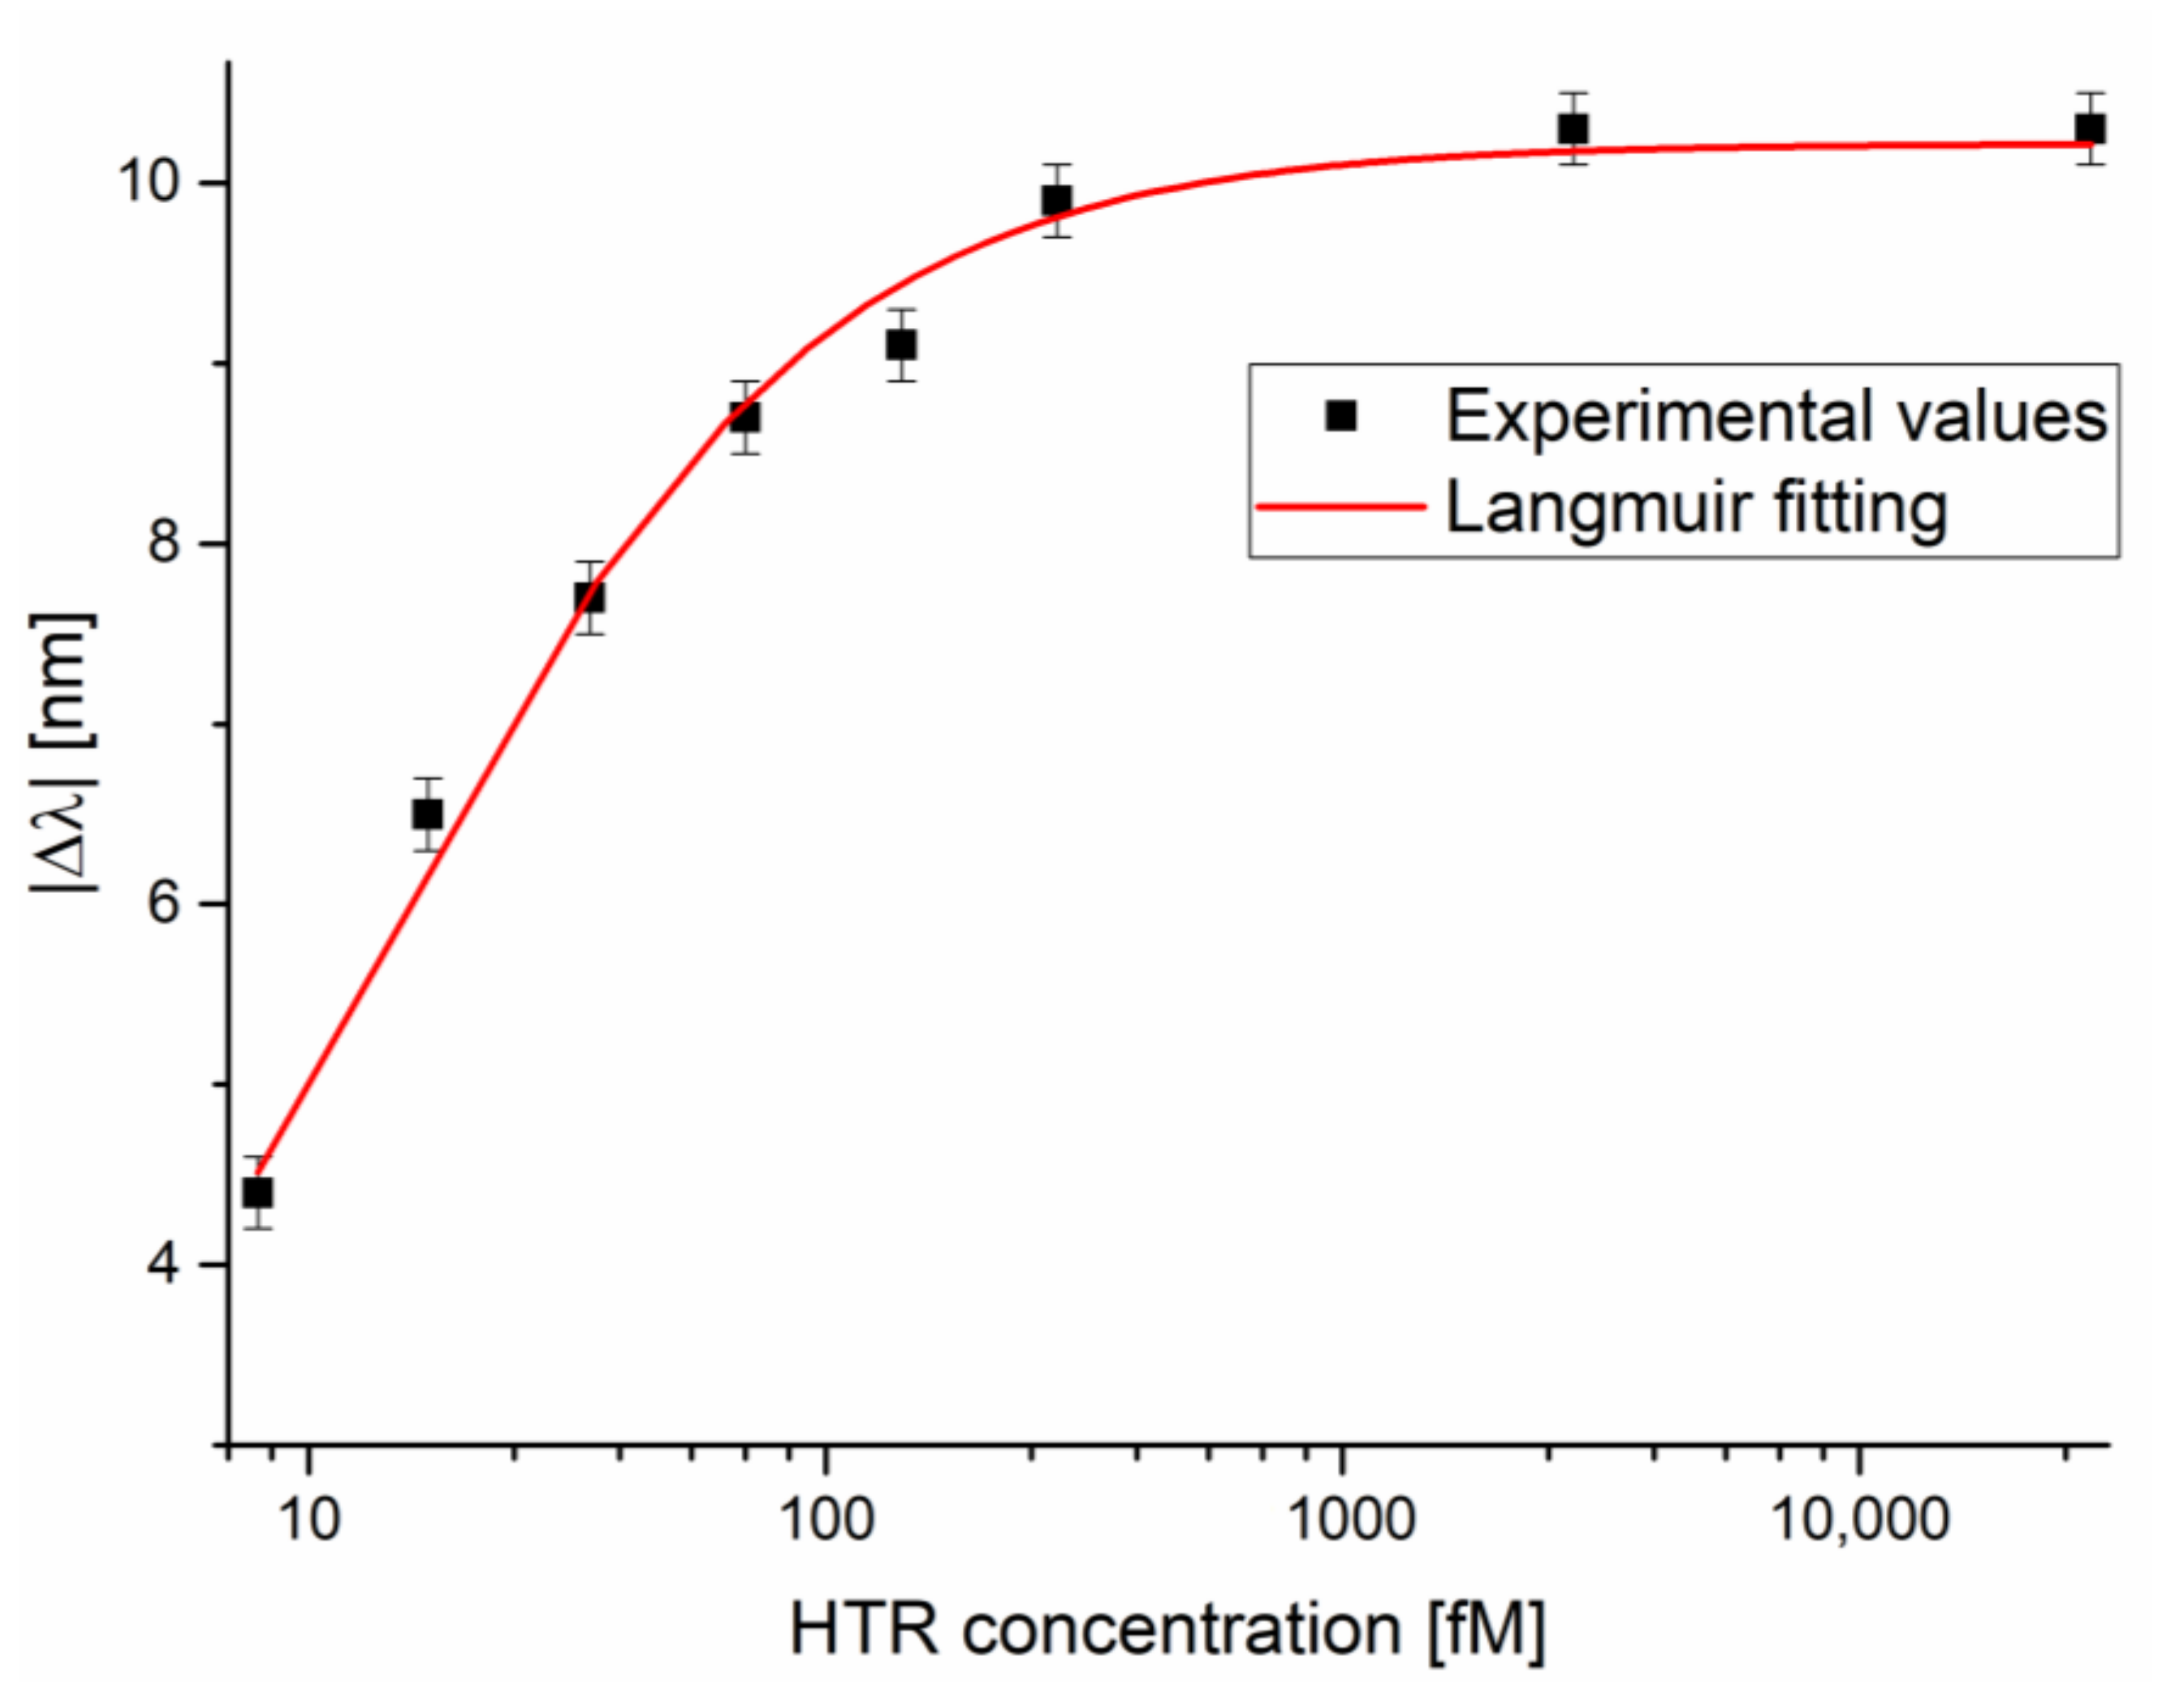
| Sensor | K [fM] | Statistics | ||||||
|---|---|---|---|---|---|---|---|---|
| NanoMIPs combined with SPR-LDF sensor | Value | Standard error | Value | Standard error | Value | Standard error | Reduced Chi-Sqr | Adj. R-square |
| 0.97 | 1.03 | 10.22 | 0.13 | 12.87 | 3.05 | 1.19 | 0.99 | |
| Sensor | Parameters | Value |
|---|---|---|
| SPR-LDF sensor combined with NanoMIPs | Kaff [fM−1] (Kaff = 1/K) | 0.08 |
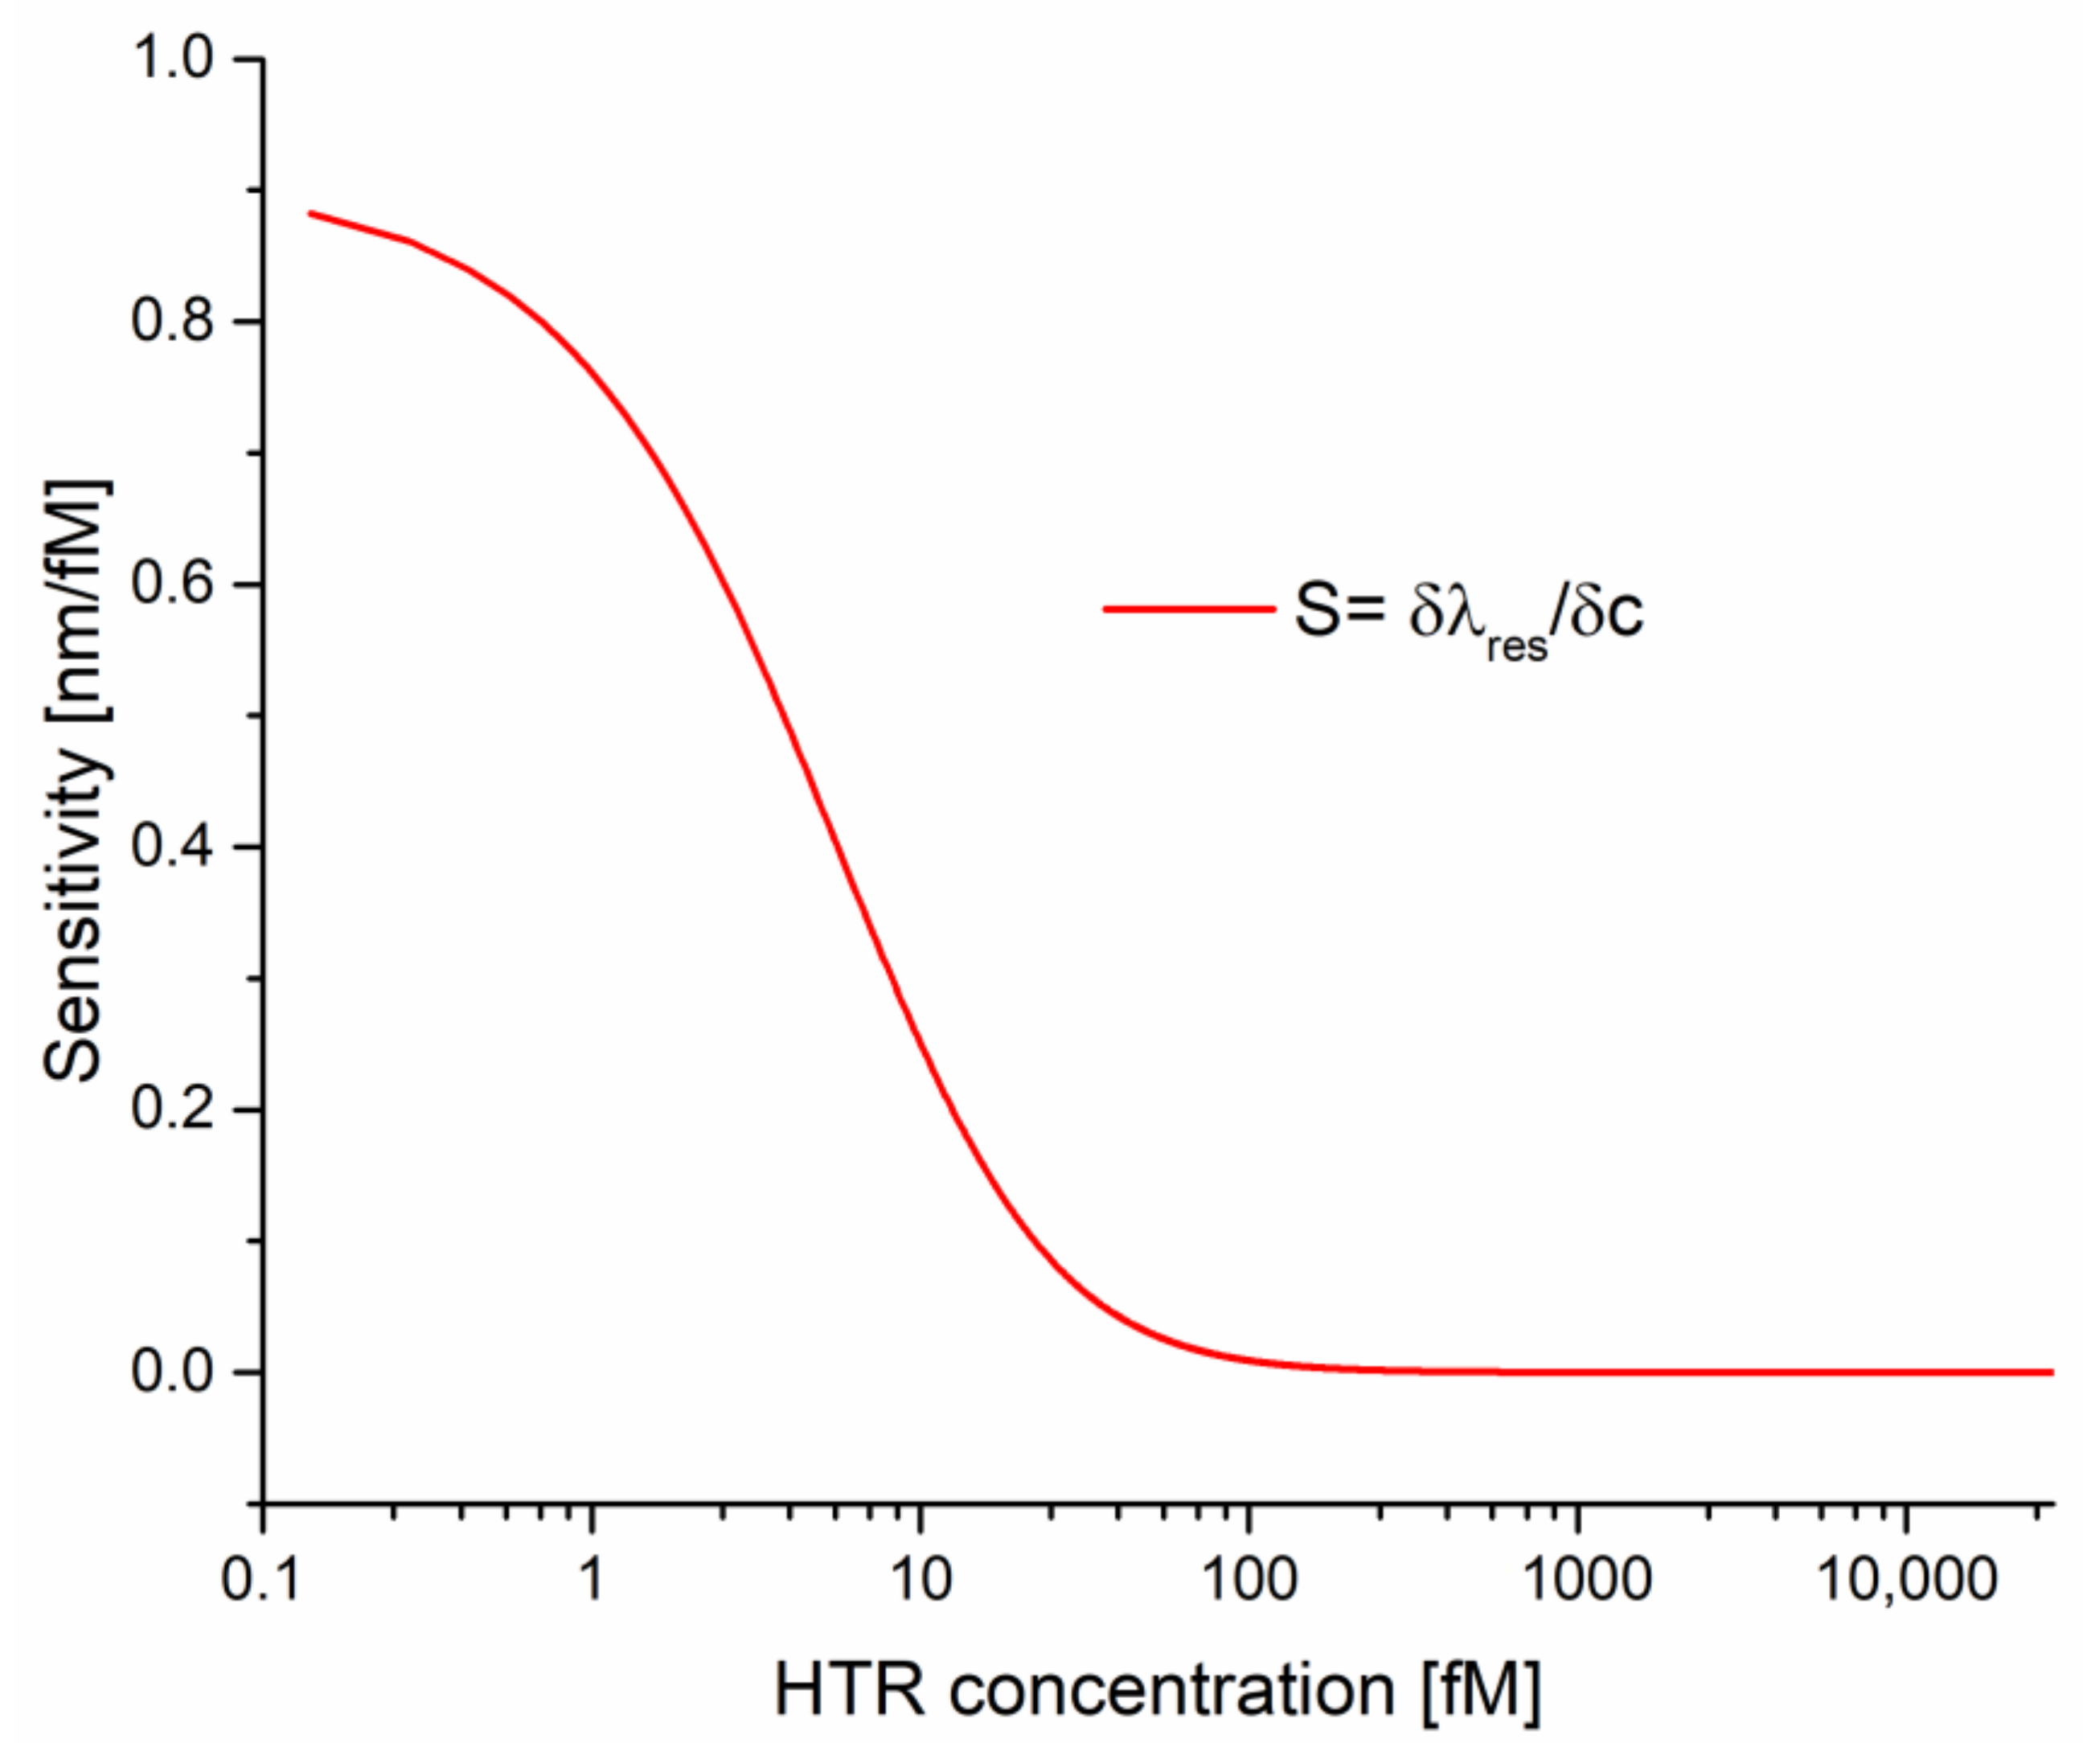
| Sensitivity at low c [nm/fM] | 0.72 | |
| LOD [fM] | 4.3 |
| Plasmonic Probe | Receptor | Analyte | LOD | Reference |
|---|---|---|---|---|
| D-shaped plastic optical fiber | nanoMIPs | HTR | 1.2 fM | [23] |
| Nanograting-based chip | nanoMIPs | Bovine serum albumin (BSA) | 3 fM | [24] |
| SPR-LDF sensor | antibody | C-reactive protein | 130 fM | [32] |
| SPR-sensor chip | boronic acid | HTR | 4.4 nM | [34] |
| SPR-LDF sensor | nanoMIPs | HTR | 4.3 fM | This work |
Publisher’s Note: MDPI stays neutral with regard to jurisdictional claims in published maps and institutional affiliations. |
© 2022 by the authors. Licensee MDPI, Basel, Switzerland. This article is an open access article distributed under the terms and conditions of the Creative Commons Attribution (CC BY) license (https://creativecommons.org/licenses/by/4.0/).
Share and Cite
Arcadio, F.; Seggio, M.; Del Prete, D.; Buonanno, G.; Mendes, J.; Coelho, L.C.C.; Jorge, P.A.S.; Zeni, L.; Bossi, A.M.; Cennamo, N. A Plasmonic Biosensor Based on Light-Diffusing Fibers Functionalized with Molecularly Imprinted Nanoparticles for Ultralow Sensing of Proteins. Nanomaterials 2022, 12, 1400. https://0-doi-org.brum.beds.ac.uk/10.3390/nano12091400
Arcadio F, Seggio M, Del Prete D, Buonanno G, Mendes J, Coelho LCC, Jorge PAS, Zeni L, Bossi AM, Cennamo N. A Plasmonic Biosensor Based on Light-Diffusing Fibers Functionalized with Molecularly Imprinted Nanoparticles for Ultralow Sensing of Proteins. Nanomaterials. 2022; 12(9):1400. https://0-doi-org.brum.beds.ac.uk/10.3390/nano12091400
Chicago/Turabian StyleArcadio, Francesco, Mimimorena Seggio, Domenico Del Prete, Gionatan Buonanno, João Mendes, Luís C. C. Coelho, Pedro A. S. Jorge, Luigi Zeni, Alessandra Maria Bossi, and Nunzio Cennamo. 2022. "A Plasmonic Biosensor Based on Light-Diffusing Fibers Functionalized with Molecularly Imprinted Nanoparticles for Ultralow Sensing of Proteins" Nanomaterials 12, no. 9: 1400. https://0-doi-org.brum.beds.ac.uk/10.3390/nano12091400