Article

A Novel Turn-On Fluorescent Sensor Based on Sulfur Quantum Dots and MnO2 Nanosheet Architectures for Detection of Hydrazine

1
College of Chemistry and Chemical Engineering, Yantai University, Yantai 264005, China
2
Shandong Dyne Marine Biopharmaceutical Co., Ltd., Weihai 264300, China
*
Authors to whom correspondence should be addressed.
Nanomaterials 2022, 12(13), 2207; https://0-doi-org.brum.beds.ac.uk/10.3390/nano12132207
Submission received: 12 May 2022 / Revised: 14 June 2022 / Accepted: 22 June 2022 / Published: 27 June 2022
(This article belongs to the Special Issue Nanostructures for Surfaces, Catalysis and Sensing)

Abstract

:
In this paper, the SQDs@MnO2 NS as the probe was applied to construct a novel “turn-on” fluorescent sensor for sensitive and selective detection of hydrazine (N2H4). Sulfur quantum dots (SQDs) and MnO2 nanosheets (MnO2 NS) were simply mixed, through the process of adsorption to prepare the architectures of SQDs@MnO2 NS. The fluorescent emissions of SQDs@MnO2 NS play a key role to indicate the state of the sensor. According to the inner filter effect (IFE) mechanism, the state of the sensor at the “off” position, or low emission, under the presence of MnO2 NS, is which the ultraviolet and visible spectrum overlaps with the fluorescence emission spectrum of SQDs. Under the optimal conditions, the emission was gradually recovered with the addition of the N2H4, since the N2H4 as a strong reductant could make the MnO2 NS converted into Mn2+, the state of the sensor at the “on”. Meanwhile, the fluorescent sensor possesses good selectivity and high sensitivity, and the detection concentration of N2H4 with a wide range from 0.1 µM to 10 mM with a detection limit of 0.072 µM. Furthermore, actual samples were successful in detecting certain implications, indicating that the fluorescent sensor possesses the potential application ability to monitor the N2H4 in the water.

Graphical Abstract

1. Introduction

Hydrazine (N2H4) has attracted particular attention due to its strong reducibility and weak alkalinity in applications such as pesticides, pharmaceuticals, fuels, organic dyes, and so on [1,2]. Meanwhile, the toxicity and harm of N2H4 could not be neglected due to its water-solubility. It could damage the lungs, eyes, skin, and some system diseases when exposed to the N2H4 surroundings for an extended period of time [3,4]. Hence, the development of a facile and sensitive measure for N2H4 is considerable. In the past decades, many analytical methods have been reported, including chromatography, electrochemical, fluorescent, titrimetric, colorimetry, and mass spectrometry [5,6,7]. The fluorescent method is a powerful technique to detect N2H4, due to a comprehensive consideration of the factors including the low cost, simple operation, and rapid analysis.
The fluorescent method consists of constructing a fluorescent probe to observe the fluorescence intensity enhancement, or quenching, for the qualitative and quantitative analysis present of the targets. The fluorescent probe materials are commonly applied in the fluorescent sensor field similar to quantum dots (QDs) [8,9,10], organics [11,12], metal-organic framework [13,14,15], and metal nanoclusters [16,17]. Therein, the sulfur quantum dots (SQDs) is a novel and attention the QDs, which retain the advantage of the traditional optical performance of QDs while overcoming potential issues of the toxicity of the heavy metal QDs. Thus, it is widely applied in the fluorescent probes, biological sensors, and cell imaging fields [18,19,20]. Lei et al., take the one-pot to prepare the polyvinyl alcohol-capped SQDs as the fluorescent probe for detection of Fe3+ and temperature in cells [21].
Nowadays, the various probes of fluorescent are being investigated and developed to detect N2H4. Based on the aggregation caused quenching effect [22,23,24], aggregation-induced emission effect [25,26,27], the excited-state intramolecular proton-transfer effect [28,29,30], and photo-induced electron transfer [31,32], probes such as 5-(9-phenyl-9H-carbazol-3-yl)thiophene-2-carbaldehyde [22], salicylaldehyde Schiff’s base [25], p-TNS [28], and 5-chlorothiophene-2-carbonyl chloride [31]. Using these mechanisms to detect N2H4 method is relatively mature, with little room for growth. Therefore, we introduced the inner filter effect (IFE) mechanism to rapidly detect N2H4, which is the absorption of the excitation and/or emission light by the quencher (MnO2) leading to the intensity decrease [33].
Herein, we first introduced the IFE mechanism to establish a “turn-on” fluorescent sensor for the detection of N2H4. The sensing strategy is illustrated in Figure 1; SQDs combined with MnO2 nanosheet (MnO2 NS) to prepare SQDs@MnO2 NS architectures. The SQDs alone have a strong fluorescence intensity and the MnO2 NS has nearly no fluorescence under the same experimental conditions. The SQDs@MnO2 NS possesses a lower intensity compared to the SQDs, due to the MnO2 NS as a full-of-all adsorbed material in the ultraviolet and visible (UV-Vis) spectrum, which could overlap with the fluorescence emission spectrum of SQDs, led to the fluorescence intensity quenching. Meanwhile, at this stage, the state of the fluorescent sensor is off. However, the emission of fluorescent is recovered under the N2H4 present condition, with the addition concentrations the state is gradually turned on. Benefits of the sensor for quantitatively detecting N2H4 was successfully constructed by monitoring the fluorescent intensity of SQDs@MnO2 NS. Furthermore, this approach possesses the potential for a practical application, due to its ability to effectively identify the N2H4 in the real samples of water.

2. Materials and Methods

2.1. Materials

Sublimed sulfur, polyethylene glycol (PEG-400), Tetramethylammonium hydroxide (TMA·OH), and NaOH were provided by Shanghai Aladdin Biochemical Technology Co. (Shanghai, China). MnCl2·4H2O, K2S2O8 were acquired from Sinopharm Chemical Reagent Co., Ltd. (Tianjin, China). N2H4 (v/v 80%) was purchased from Sigma Chemical Co., Ltd. (Shanghai, China). The prepared solutions of all experiments used ultrapure water (18.2 MΩ cm) from a water purification system.

2.2. Apparatus

Transmission electron microscopy (TEM) and high-resolution transmission electron microscopy (HR-TEM) measurements was carried out using a JEOL-2010F (200 kV) (JEOL, Tokyo, Japan). The ultraviolet and visible (UV-Vis) absorption spectra were examined with a UV-Vis spectrophotometer (TU-1901, Beijing, China). Fourier-transform infrared (FT-IR) spectroscopy was performed using a Nicolet 5700 Fourier transform infrared spectrometer (Shimadzu, Tokyo, Japan). The prepared nanomaterials were characterized by X-ray diffraction (XRD, LabX XRD-6000 (Shimadzu, Tokyo, Japan)). Elemental analysis was recorded by X-ray photoelectron spectroscopy (XPS, Thermo Scientific Escalab 250Xi, USA). Fluorescence spectra were collected using an F-4700 fluorescence spectrophotometer (HITACHI, Tokyo, Japan).

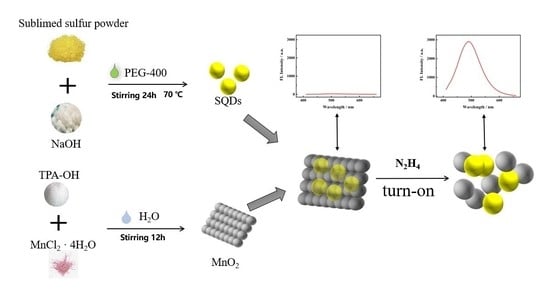
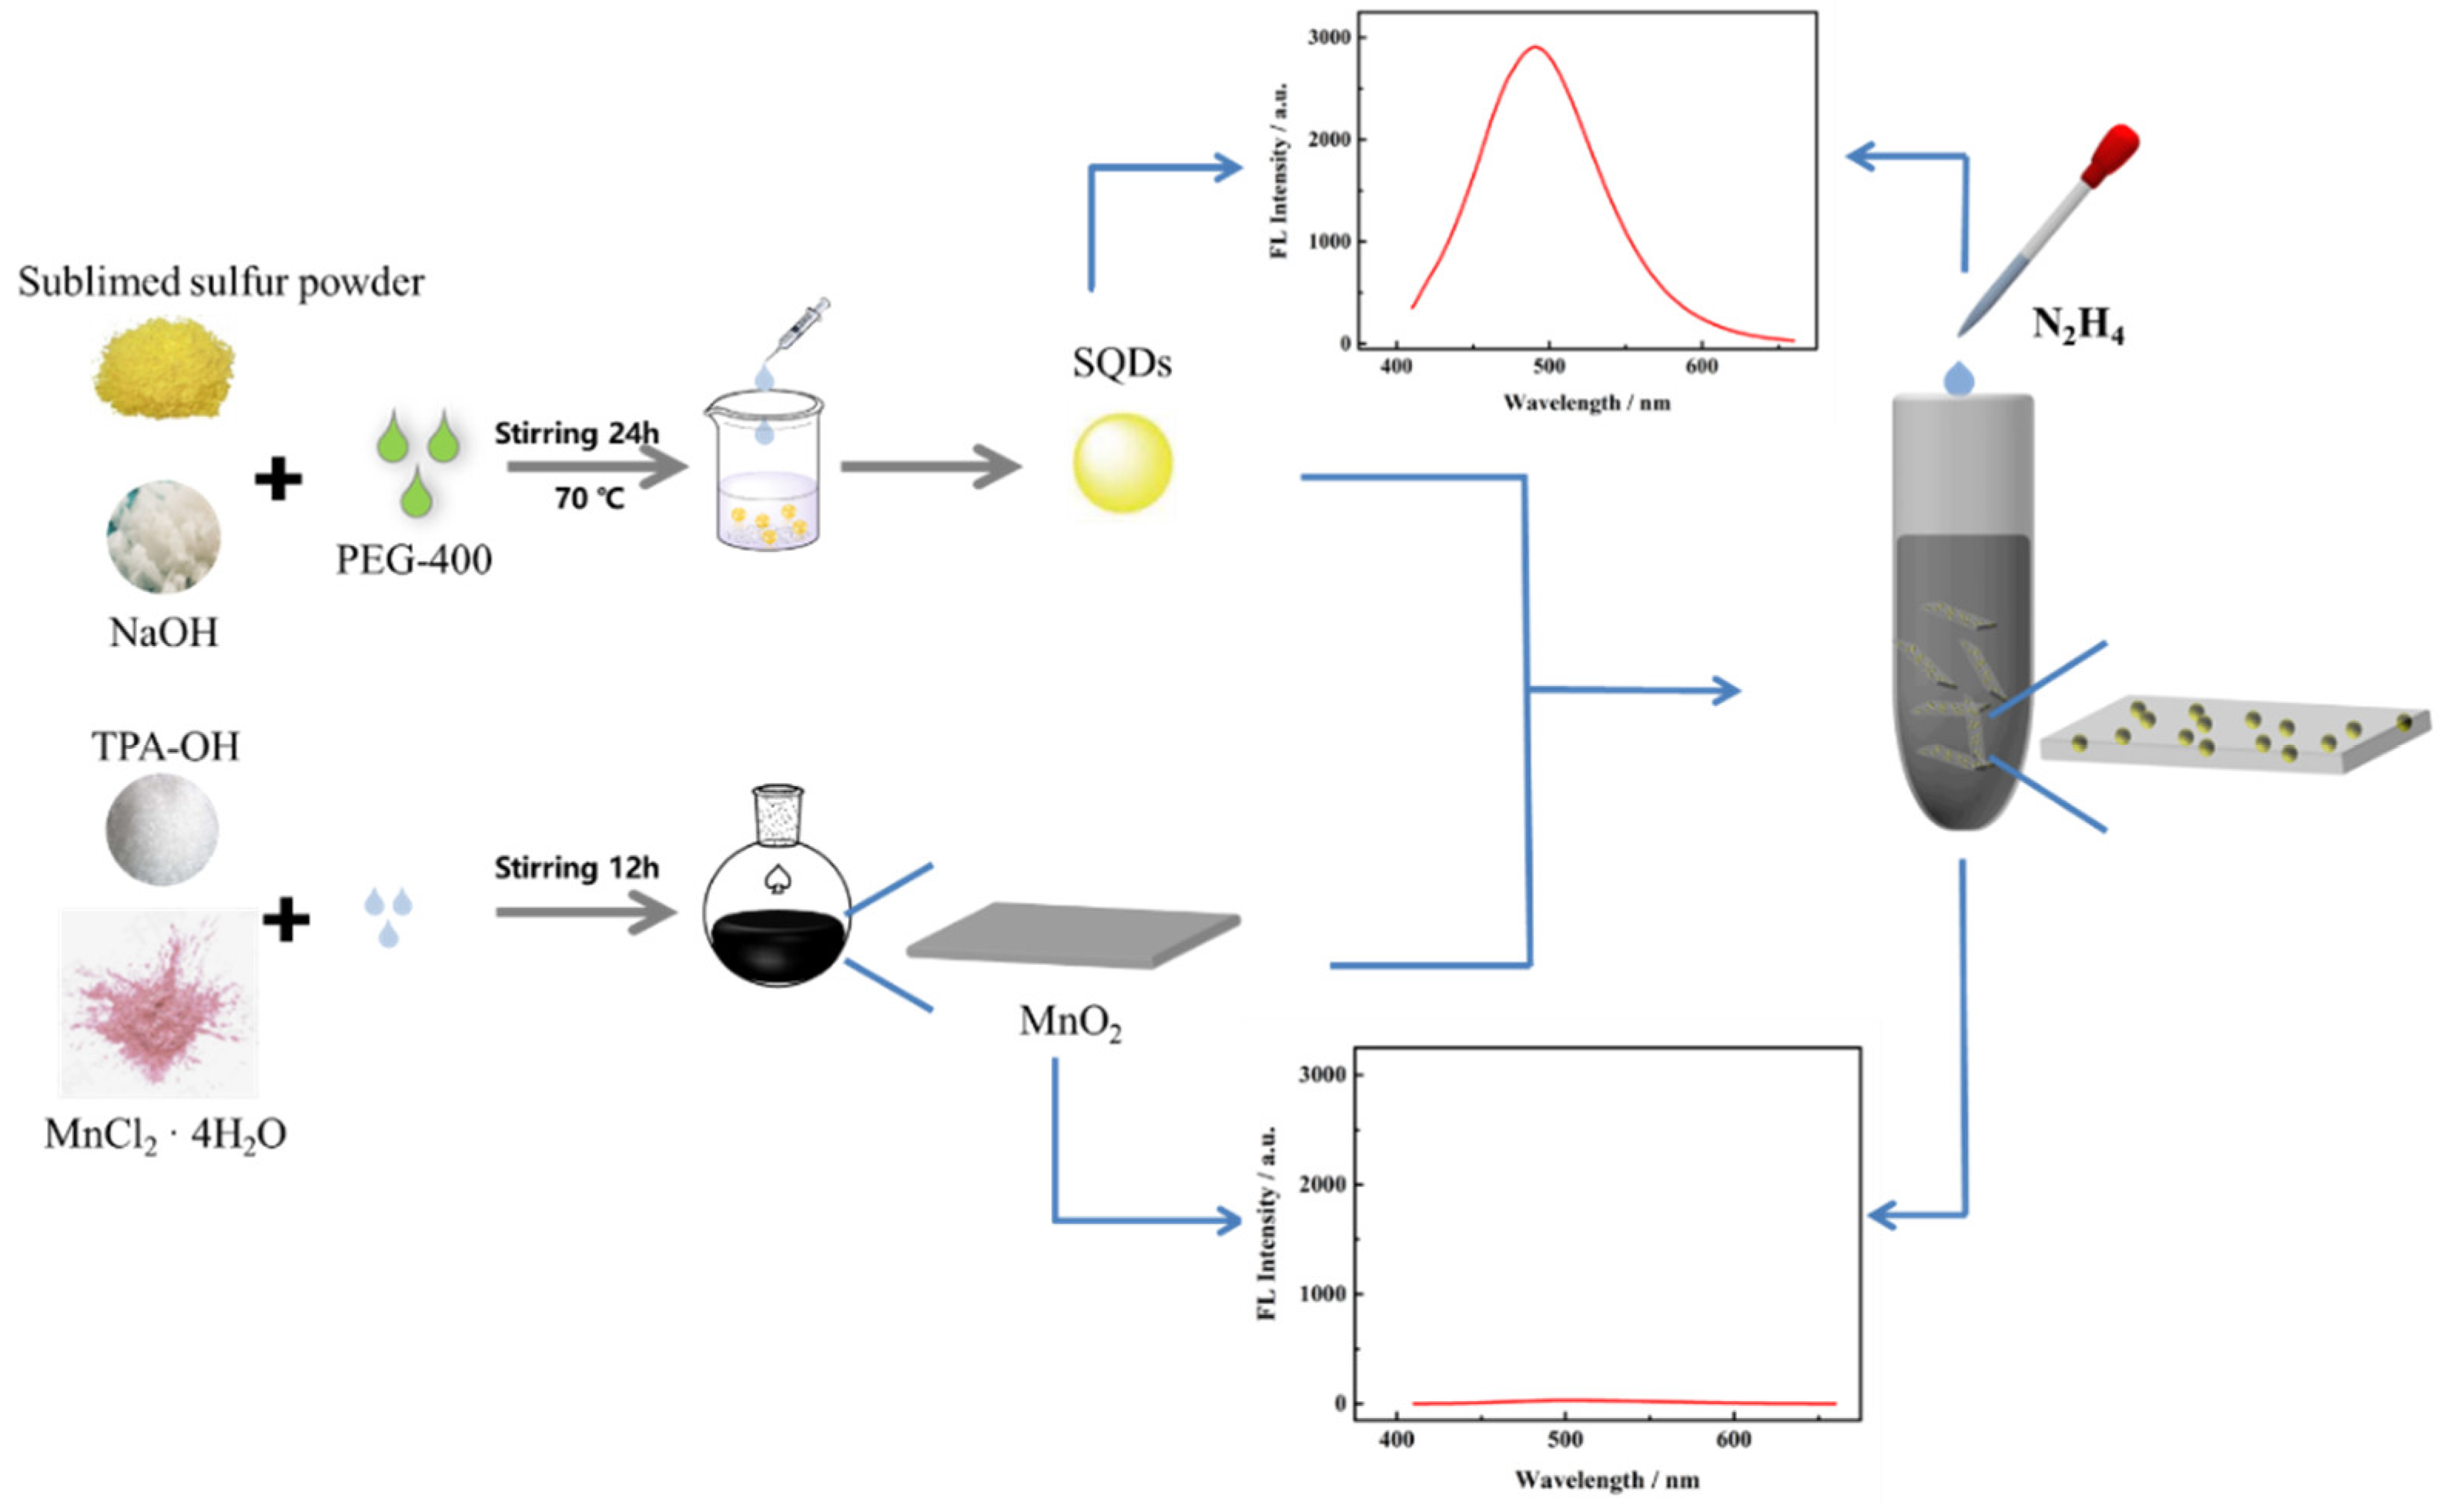
2.3. Synthesis of SQDs and MnO2 NS

SQDs were synthesized according to a literature method [34]. Briefly, the sublimed sulfur powder (1.4 g) was added to a mixed solution of PEG-400 (3 mL) and NaOH (50 mL, 0.08 g mL−1) stirring at 70 °C for 24 h. During the period, the color of the solution changed gradually from dark-yellow to light-yellow, and then added H2O2 (3 mL) to each, the obtained solution was termed as SQDs. The prepared SQDs were introduced in the dialysis membrane with the molecular weight of 1000 Da to remove unreacted molecular dialysis for 72 h each 12 h to change the water. Then, the light-yellow solid was acquired by freeze-drying at −20 °C for 24 h, and the SQDs were stored at 4 °C for further use.
MnO2 NS were prepared with reference to previous literature [35]. Firstly, TMA·OH (12 mL, 1.0 M) solution was introduced in MnCl2·4H2O (10 mL, 0.3 M) at the 50 mL round-bottomed flask. Afterward, the H2O2 (2 mL, 30%) solution was slowly added to the mixed solution vigorously stirring at room temperature for 24 h. The acquired dark brown solution was centrifuged and rinsed with ultra-water and CH3OH several times. Last, the obtained product of MnO2 NS was dried at room temperature.

2.4. The SQDs@MnO2 NS Fluorescent Probe Detection N2H4

The mixture solution of SQDs@MnO2 was obtained by SQDs and MnO2 NS mixed to stand for 1 h at room temperature. Next, the different concentrations of N2H4 solution (0.1 µM–10 mM) were added to the SQDs@MnO2 (1 mL) to react for 10 min at room temperature and perform fluorescence spectroscopy tests. Finally, a standard curve line was constructed between various concentrations of N2H4 and the recovery value of fluorescence intensity. In addition, the fluorescence probe selectivity, stability, and repeatability were studied under the optimal conditions.

2.5. Detection of Actual Samples

The fluorescence probe of SQDs@MnO2 NS was selected specifically for N2H4. To verify the performance in the actual sample of the probe, this was applied to detect the environmental water samples. Actual samples were acquired from the lake and river in Yantai. Briefly, the water samples were filtered with the 0.45 µm filter membrane to remove impurities. Then, to detect the N2H4 in the lake and river were used to prepare various concentrations of N2H4 (0.1 µM, 10 µM, and 10 mM) reaction for 10 min to test fluorescence spectroscopy, respectively. Three experiments were performed in parallel, and RSD was calculated.

3. Results

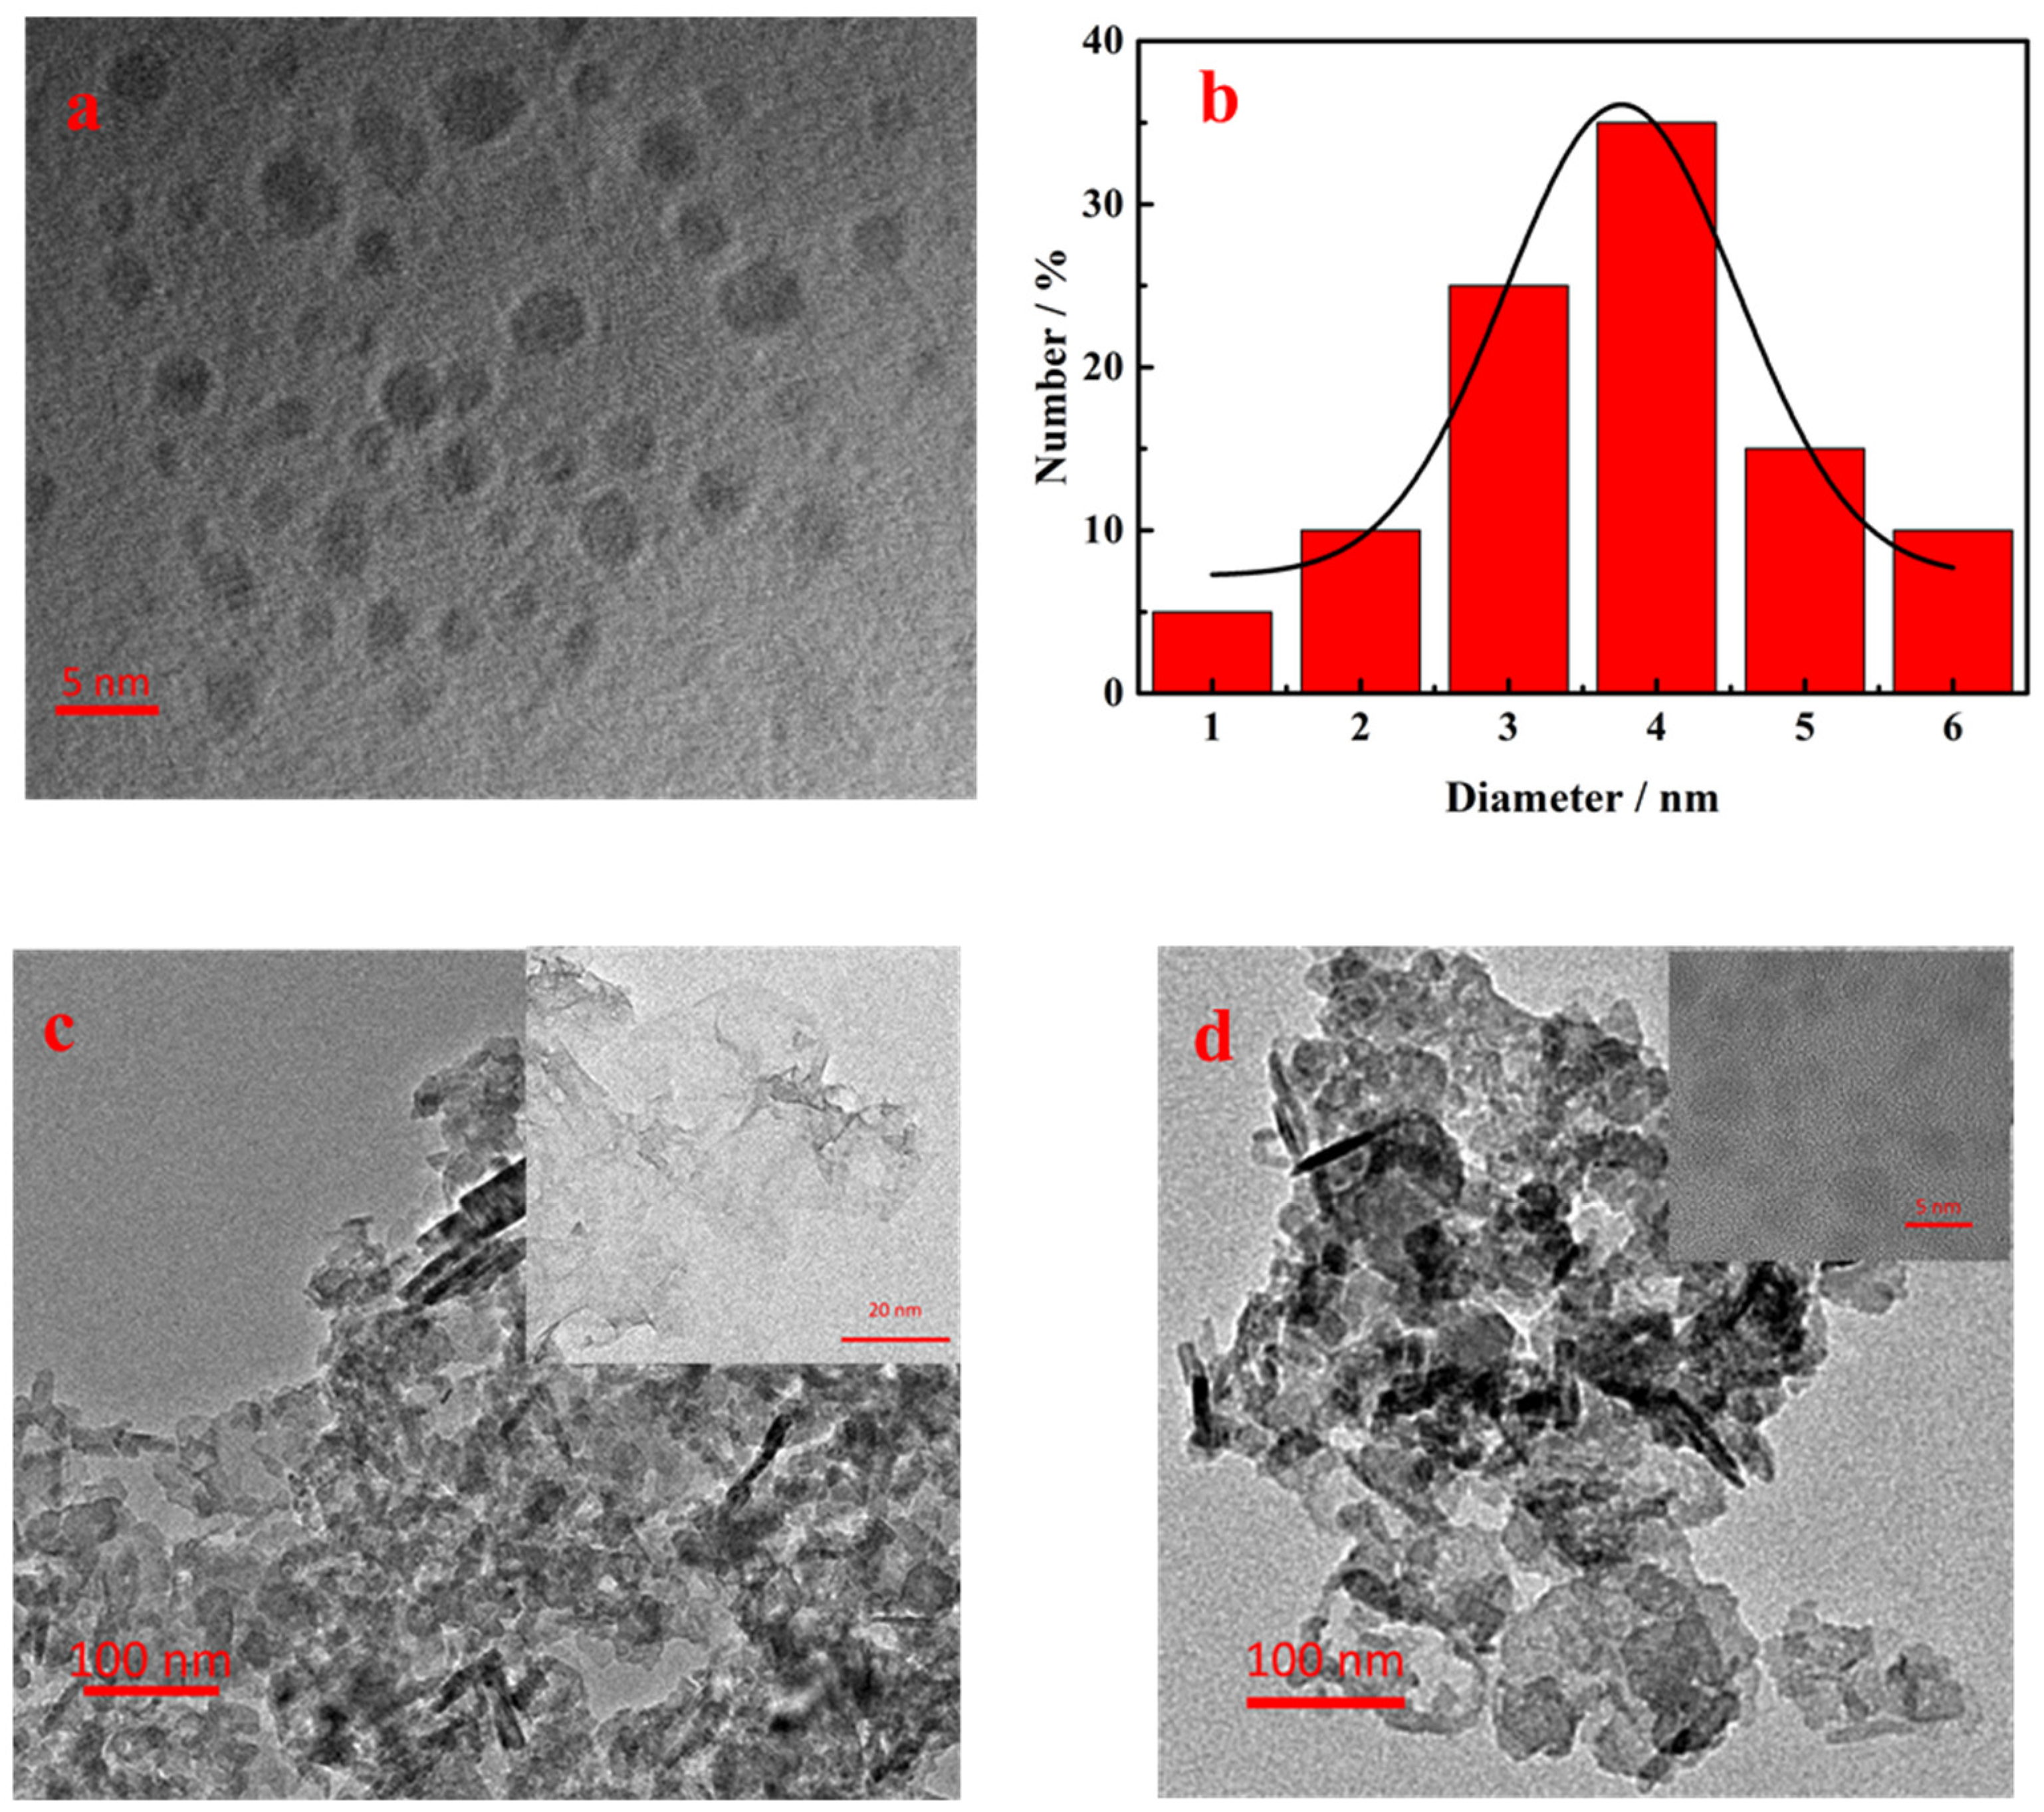
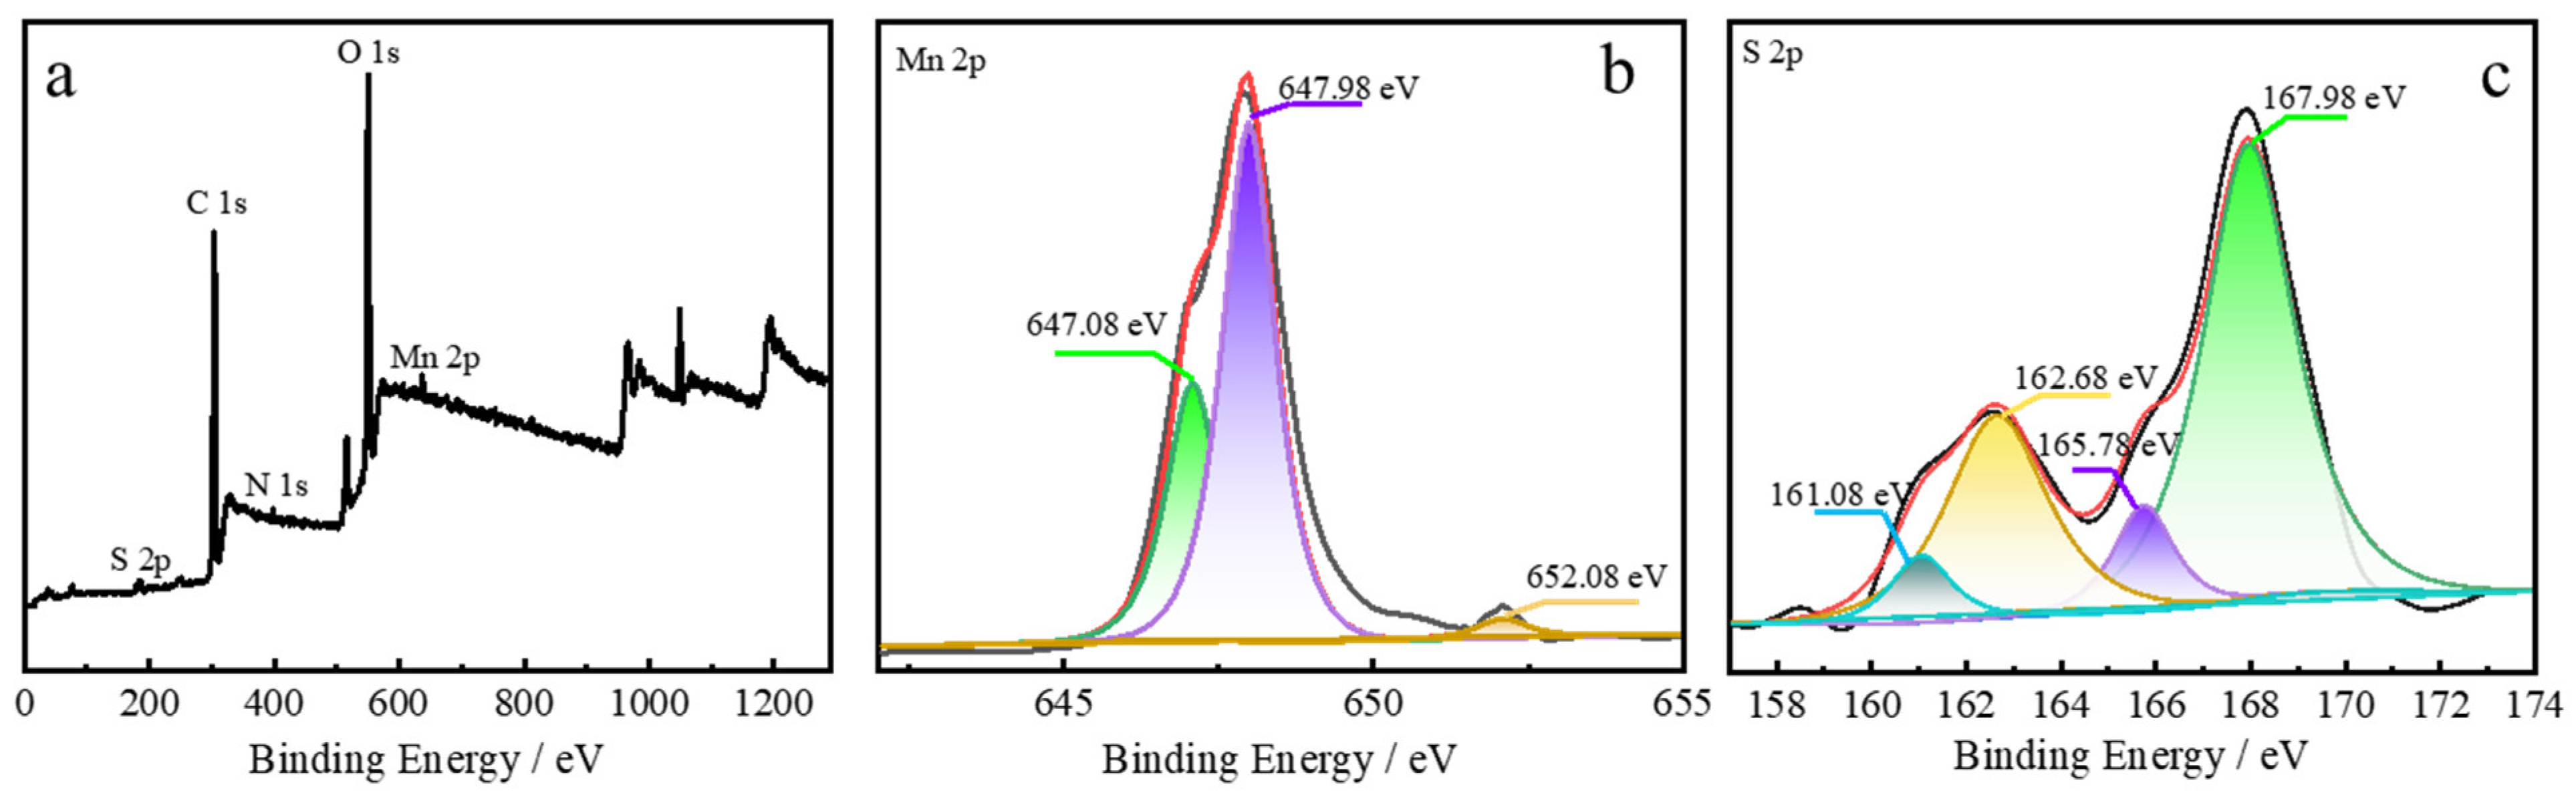
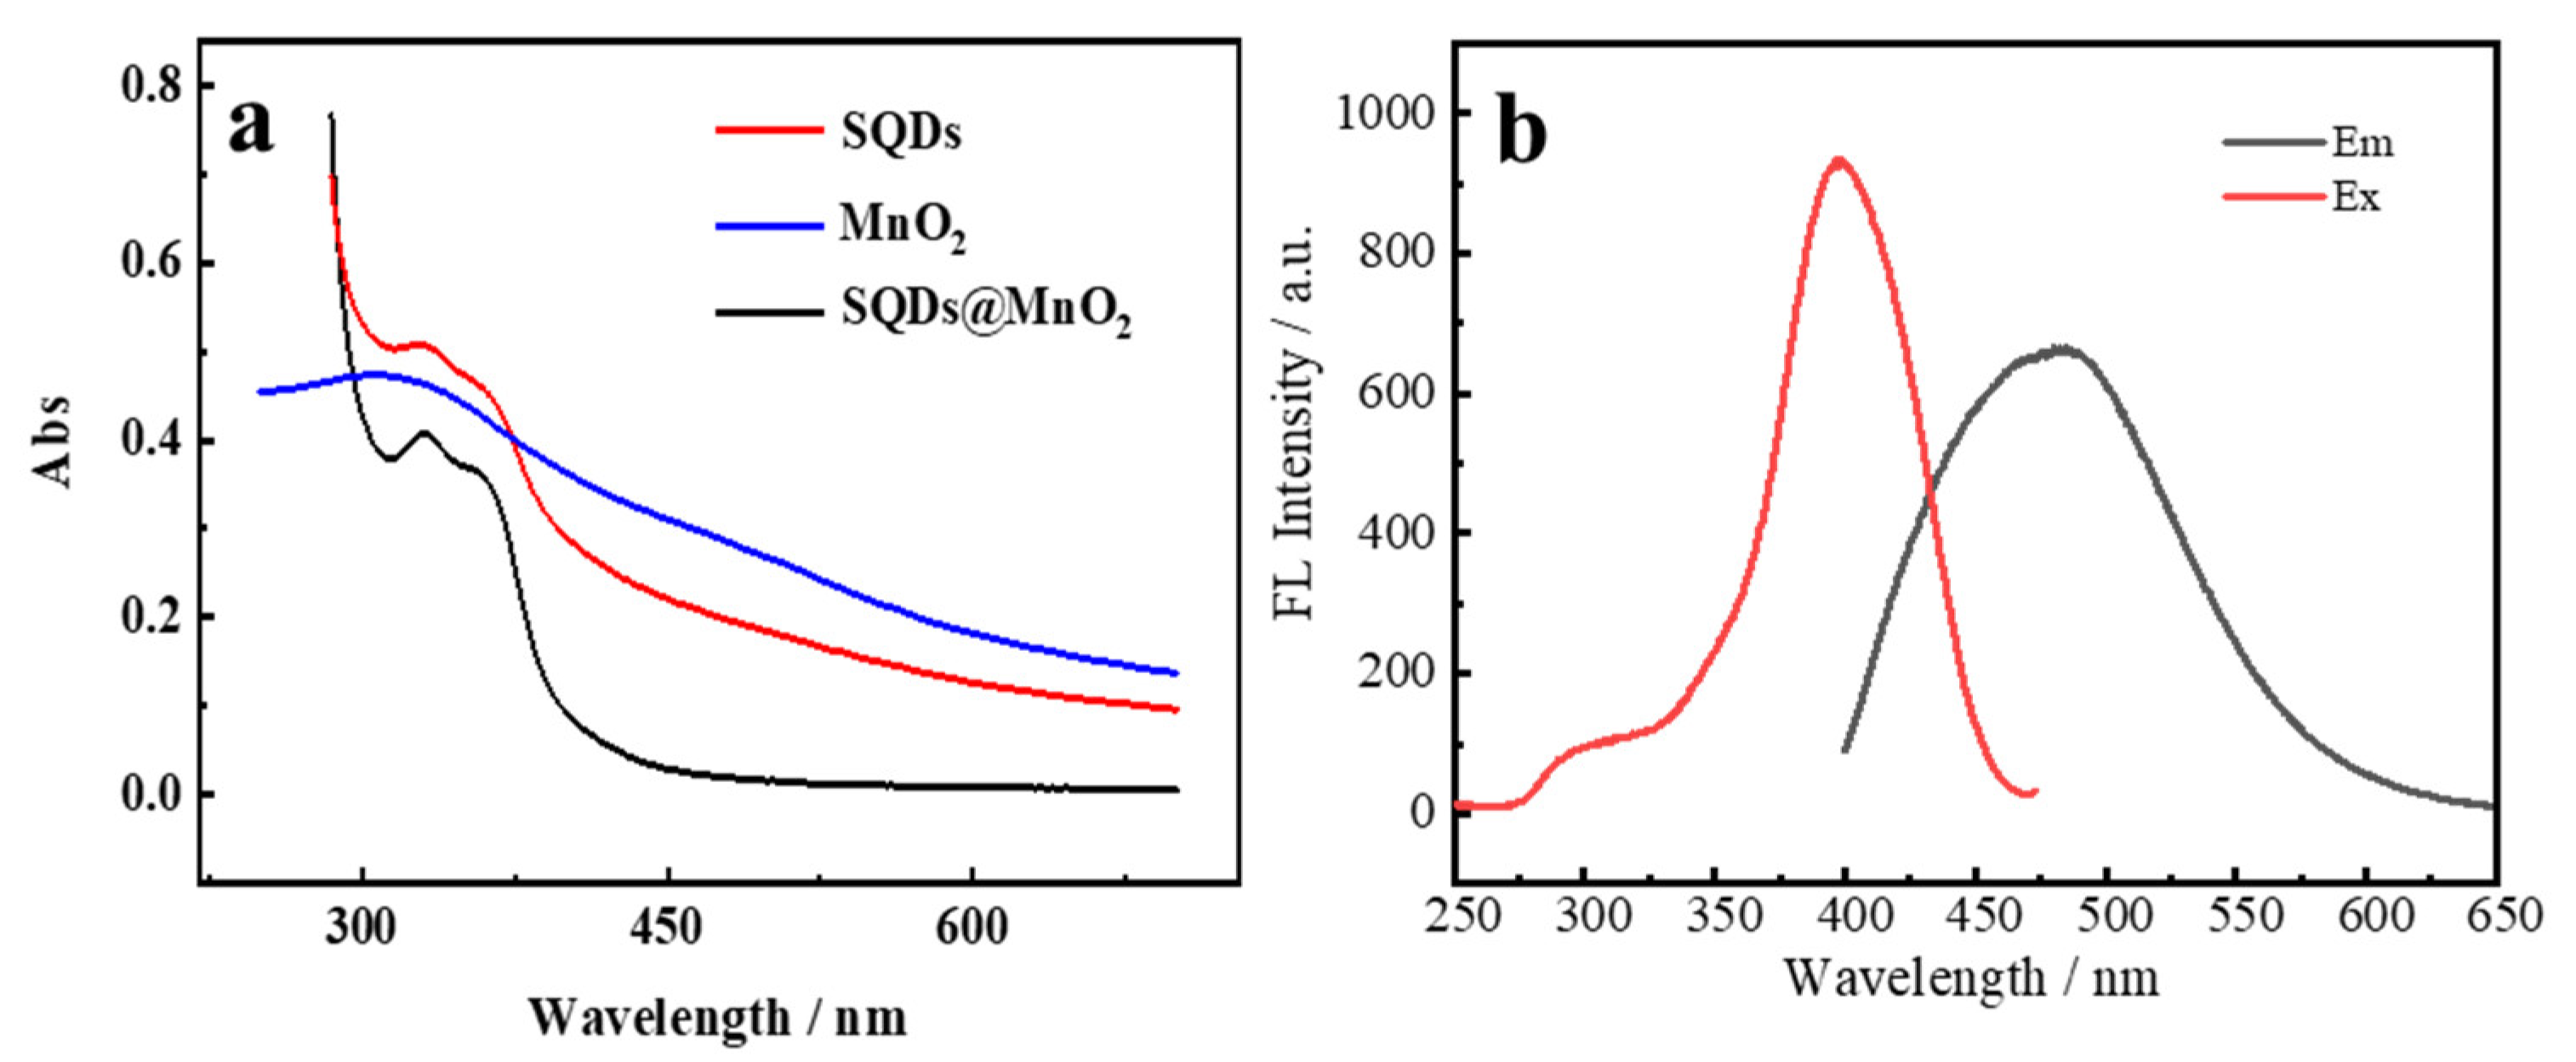
3.1. Characteristics of SQDs, MnO2 NS, SQDs@MnO2

The morphology of SQDs, MnO2 NS, and SQDs@MnO2 architectures was characterized by HR-TEM and TEM. As shown in Figure 2a,b, the morphology of SQDs was spherical particles with good distribution, and the size of SQDs was calculated mainly to be 3.5 ± 0.5 nm. Next, the morphology of MnO2 NS was investigated presenting a large two-dimensional ultrathin planar structure (inset of Figure 2c). Meanwhile, the structure of MnO2 NS under the size of 100 nm of TEM appears to wrinkle and aggregation (Figure 2c). Additionally, as shown in Figure 2d, SQDs@MnO2 retained the planar structure but have a stronger aggregate phenomenon compared with MnO2 NS (Figure 2c), and the SQDs were distributed on the surface of MnO2 NS, indicating that the SQDs@MnO2 was successfully prepared.
To further study the elements of SQDs and MnO2 NS, X-ray photoelectron spectroscopy (XPS) was analyzed. In Figure S1a, the MnO2 NS was composed of four elements of C, O, N, and Mn. In the spectrogram of the Mn 2p element in Figure S1b, the band energy peaks located at 641.8 eV belonged to MnO2, and the characteristic peaks of Mn 2p appeared at 644.3 eV, 649.1 eV, which was identified with the previously reported work [36]. As can be seen in Figure S1c, the XPS survey spectrum of SQDs was recorded, which peaks corresponding to the elements of C, O, and S, respectively. The spectrum of the S 2p region in Figure S1d exhibits two peaks at 162.3 eV and 163.2 eV, which were due to the elemental S. The band peaks at 166.5 eV, 168.2 eV, and 169.3 eV were respective corresponding to the SO32− (2p2/3), SO32− (2p2/3) or SO22− (2p1/2), and SO32− (2p1/2), which demonstrated that the prepared SQDs the surface has an amount of sulfite group by adsorbing since the huge surface and small volume [34]. Additionally, the XPS survey spectrum of SQDs@MnO2 was shown in Figure 3a, in which elements of S 2p (Figure 3b) and Mn 2p (Figure 3c) correspond to the SQDs and MnO2, indicating the SQDs@MnO2 was successfully prepared.
To further verify the SQDs, MnO2 NS, and SQDs@MnO2 NS were successful in preparation, the UV-Vis spectra were shown in Figure 4. The broad absorption bands of MnO2 NS the range from 280 to 650 nm a weak peak around 360 nm, which is due to the d-d transition of Mn4+ ions [37]. The UV-Vis absorption spectra of SQDs and SQDs@MnO2 both have peaks at 313 nm and 350 nm, which might be ascribed to the S22− and S82− adsorbed on the surface of SQDs [34]. However, the values of peaks of SQDs@MnO2 were lower than SQDs due to the adsorption of SQDs on MnO2 NS. The excitation (Ex) and emission (Em) spectra of fluorescence of SQDs@MnO2 were shown in Figure 4b, the Em wavelength at 484.2 nm under the excitation wavelength of 380 nm, which is like the previous work [38].

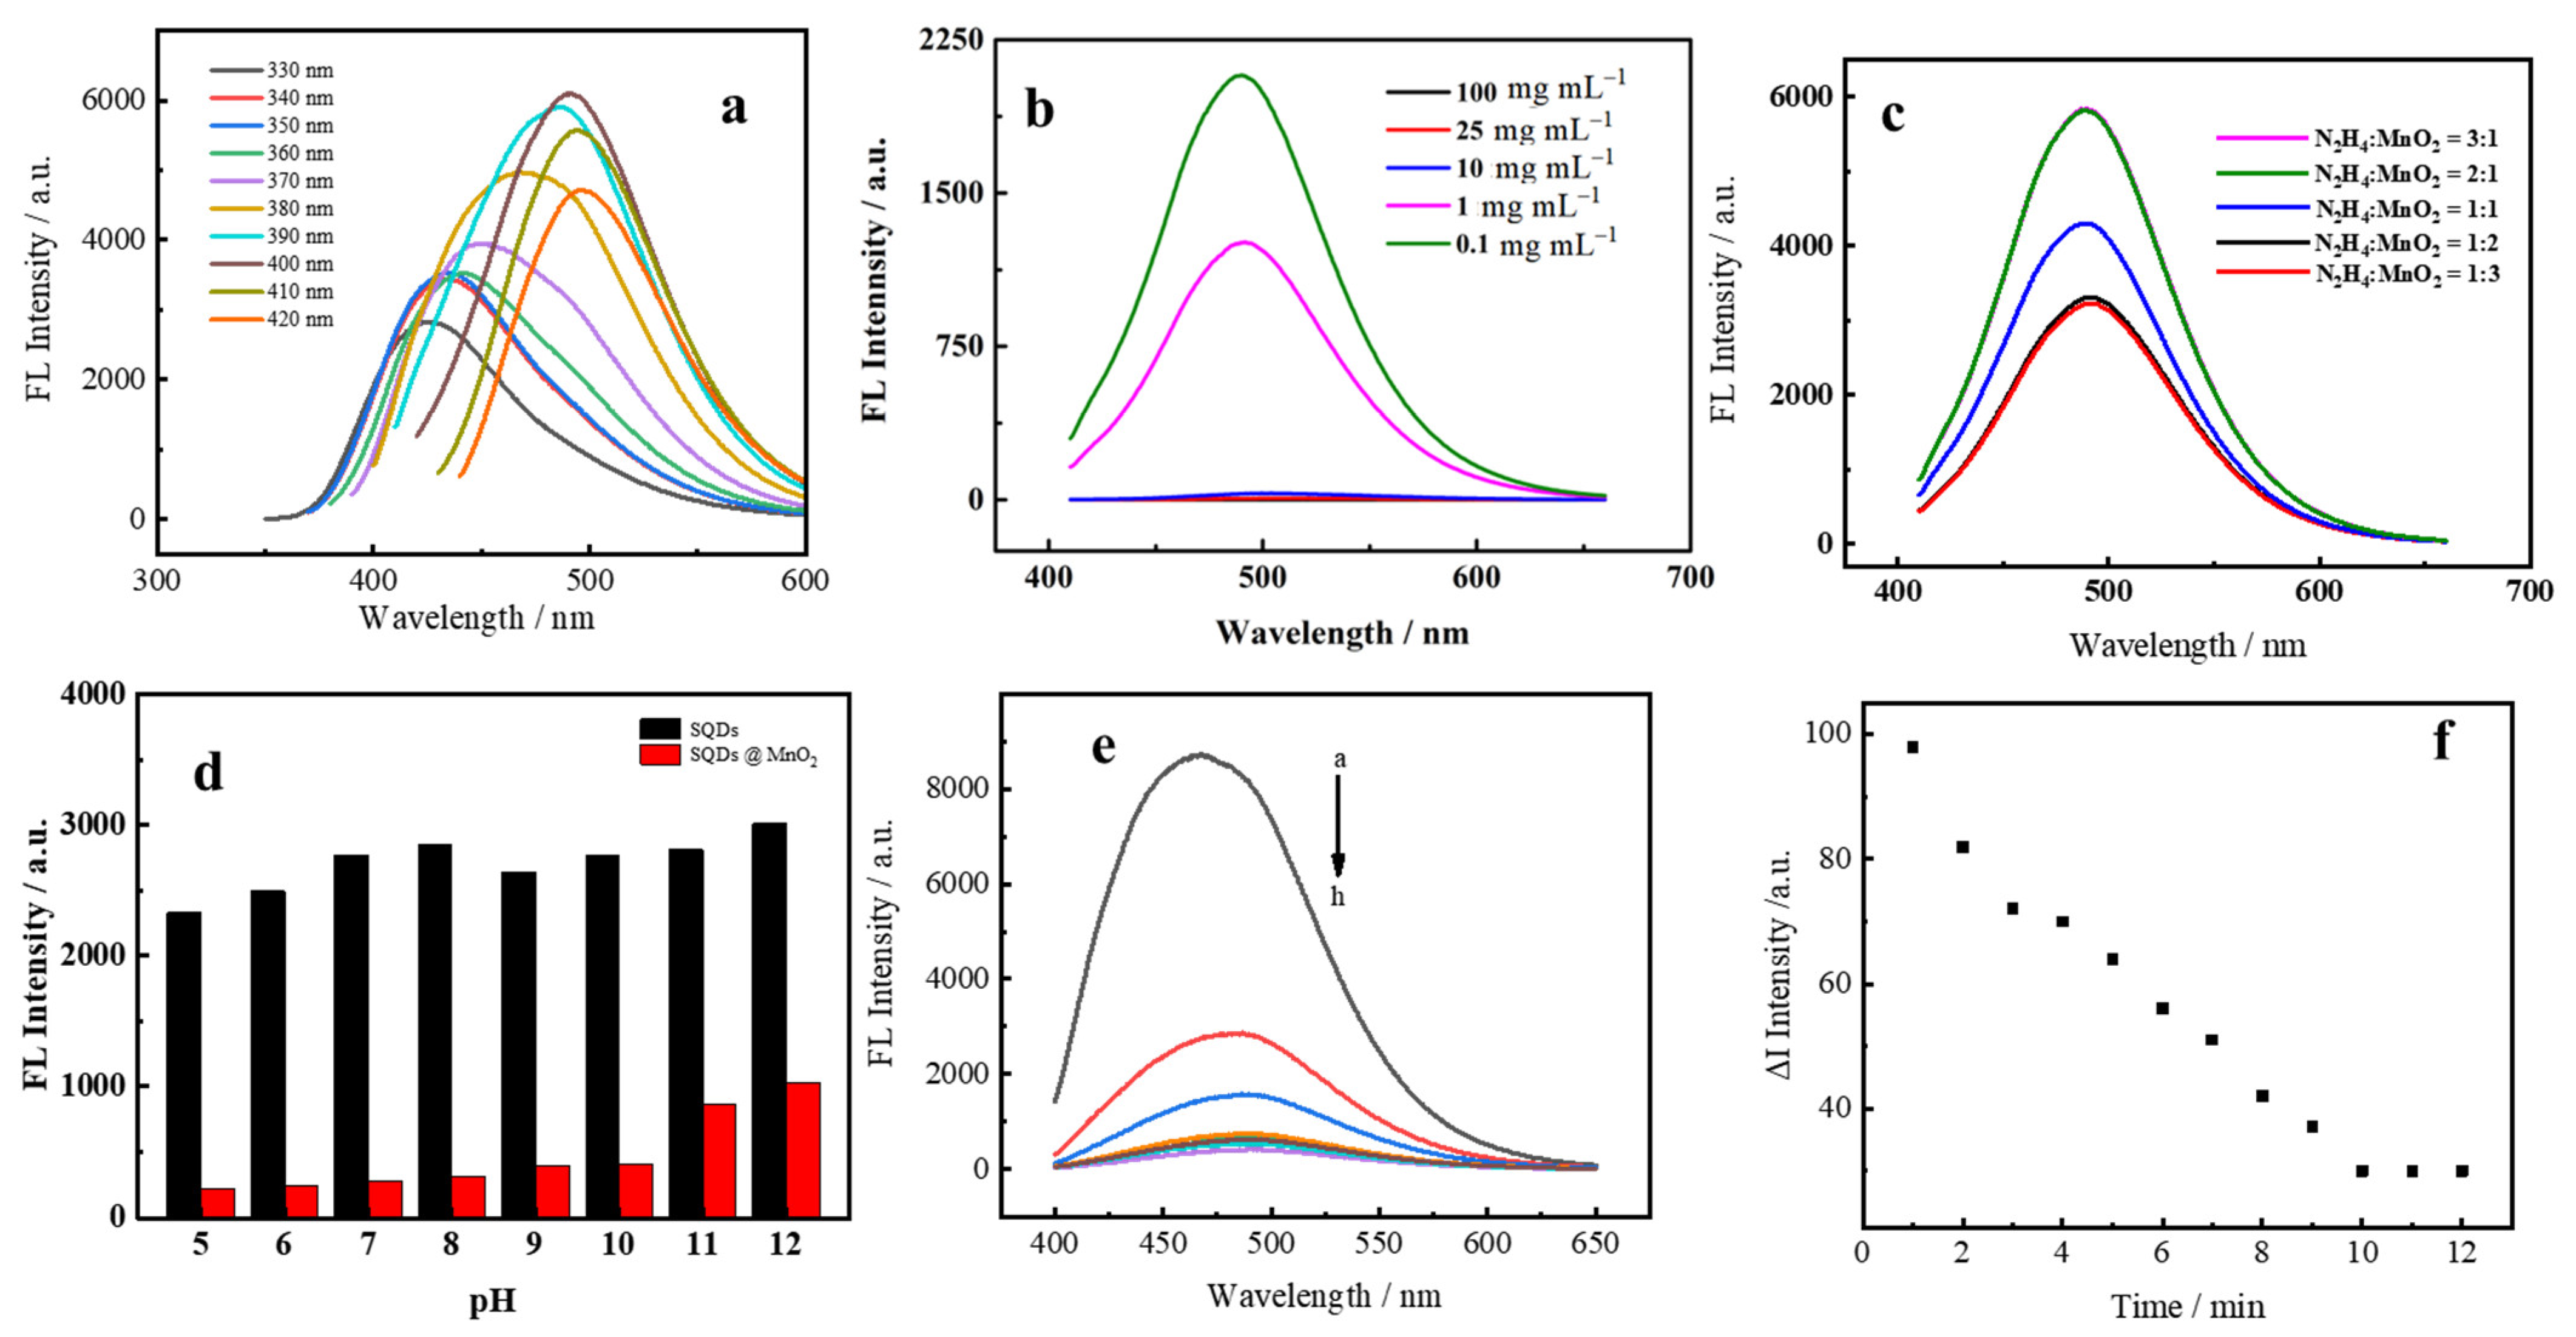
3.2. Optimization of Experimental Parameters

We have investigated the experimental parameters to acquire the optimal conditions, including the excitation wavelength for SQDs, the concentration of MnO2 NS, the volume ratio of N2H4 to MnO2 NS, and the pH of the SQDs and SQDs@MnO2 NS solution. As illustrated in Figure 5a, the synthesized of SQDs detected under the different excitation wavelengths at 330–420 nm, the intensity of fluorescent behaved a general trend of rising first and then falling, and the maximum emission at 400 nm. Thus, the excitation wavelength of SQDs at 400 nm was chosen as the optimal wavelength. As shown in Figure 5b, with the increase of the concentration of MnO2 NS, the quenching emission values of SQDs were increased, and the fluorescent intensity of SQDs was nearly all the quenched at the concentration of MnO2 NS at 10 mg mL−1. Hence, 10 mg mL−1 was selected as the optimum concentration of MnO2 NS for the next use. In addition, the quenching behavior of SQDs@MnO2 about different concentrations of MnO2 NS for better visualization in Figure S2, which obviously noted that the MnO2 NS possesses a huge surface that could package the SQDs. The volume ratio of N2H4 to MnO2 NS was shown in Figure 5c, the N2H4 volume-specific gravity increased the emission was gradually recovered, and the volume ratio reached 2:1 of N2H4 to MnO2 NS the emission intensity reached the maximum recovery values. Furthermore, the SQDs increased with pH from 5 to 12, which had no influence on its emission, while introducing the MnO2 NS the emission of SQDs values significantly decreased (Figure 5d). However, with the increased pH, the quench of emission degree was decreased. On this basis, we selected the pH = 7 as the experiment condition, considering the pH of the environment water. As shown in Figure 5e, the fluorescence of SQDs intensity was decreasing when the MnO2 was added. The molar ratio of SQDs@MnO2 was increased to 10:4 the fluorescence intensity reached its lowest. After, the molar ratio of SQDs@MnO2 over 10:4 the fluorescence intensity was a tiny increase. Thus, the molar ratio of 10:4 has been chosen for the further experiment. In addition, the response time of SQDs@MnO2 with N2H4 was recorded in Figure 5f, when 10 min of reaction was the ∆I = 30 (∆I = intensity (2 min)-intensity (1 min)), and the value of ∆I was nearly stable. Therefore, the SQDs@MnO2 with N2H4 10 min of reaction as the optimal react time.

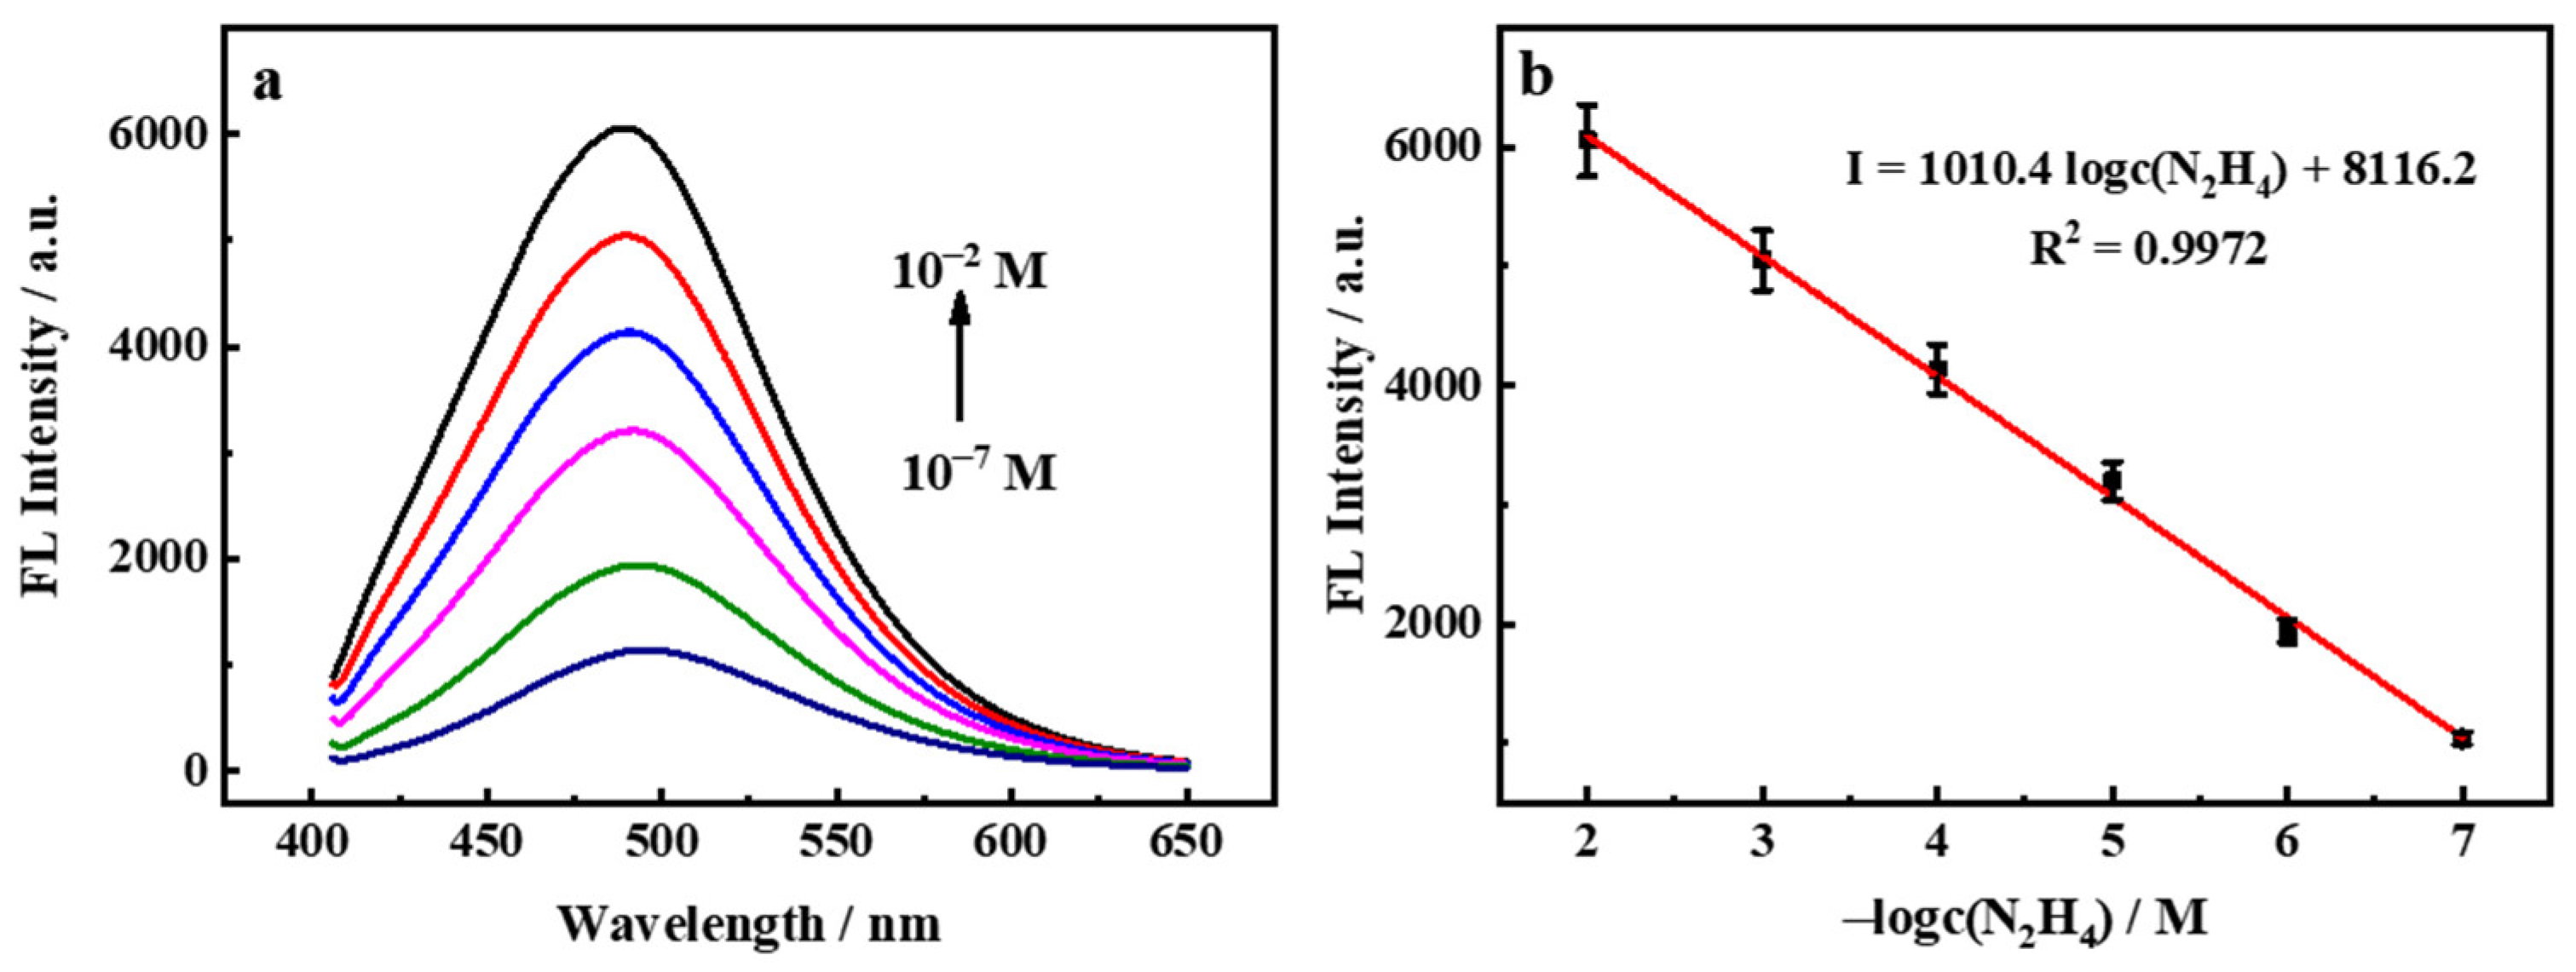
3.3. Fluorescence Spectra Analysis of N2H4 Sensing

The MnO2 NS nearly a total absorption in UV-Vi’s spectrum at the 280 nm to 650 nm in this study, which could effectively quench the fluorescence of SQDs due to the IFE mechanism. However, with the N2H4 was introduced once the emission was recovered, demonstrating that the MnO2 NS was reduced to Mn2+ in the presence of N2H4. Beneficial from this result, a simply “turn-on” sensor was constructed.
Under the optimum experiment condition, the analytical performance of the fluorescent sensor was investigated to detect N2H4 with various concentrations. As exhibited in Figure 6a, the fluorescence intensity was increased with the N2H4 concentration gradually added, indicating that the more reduction matter the more Mn2+ in the detected solution. The recovery values of fluorescence intensity of the logarithm of N2H4 concentration in the range from 0.1 µM to 10 mM, with a limit of detection (LOD) were calculated to be 0.072 µM according to the 3σ/s. Figure 6b demonstrates that the linear equation was I = 1010.4 logc(N2H4) + 8116.2 with a correlation coefficient of 0.9972, where I was the recovery intensity value of fluorescence. The comparison of the proposed methods to detect N2H4 with previous reports was listed in Table 1. It was significantly observed that the SQDs@MnO2 NS probe possessed the lower LOD and satisfactory linear range over other approaches.

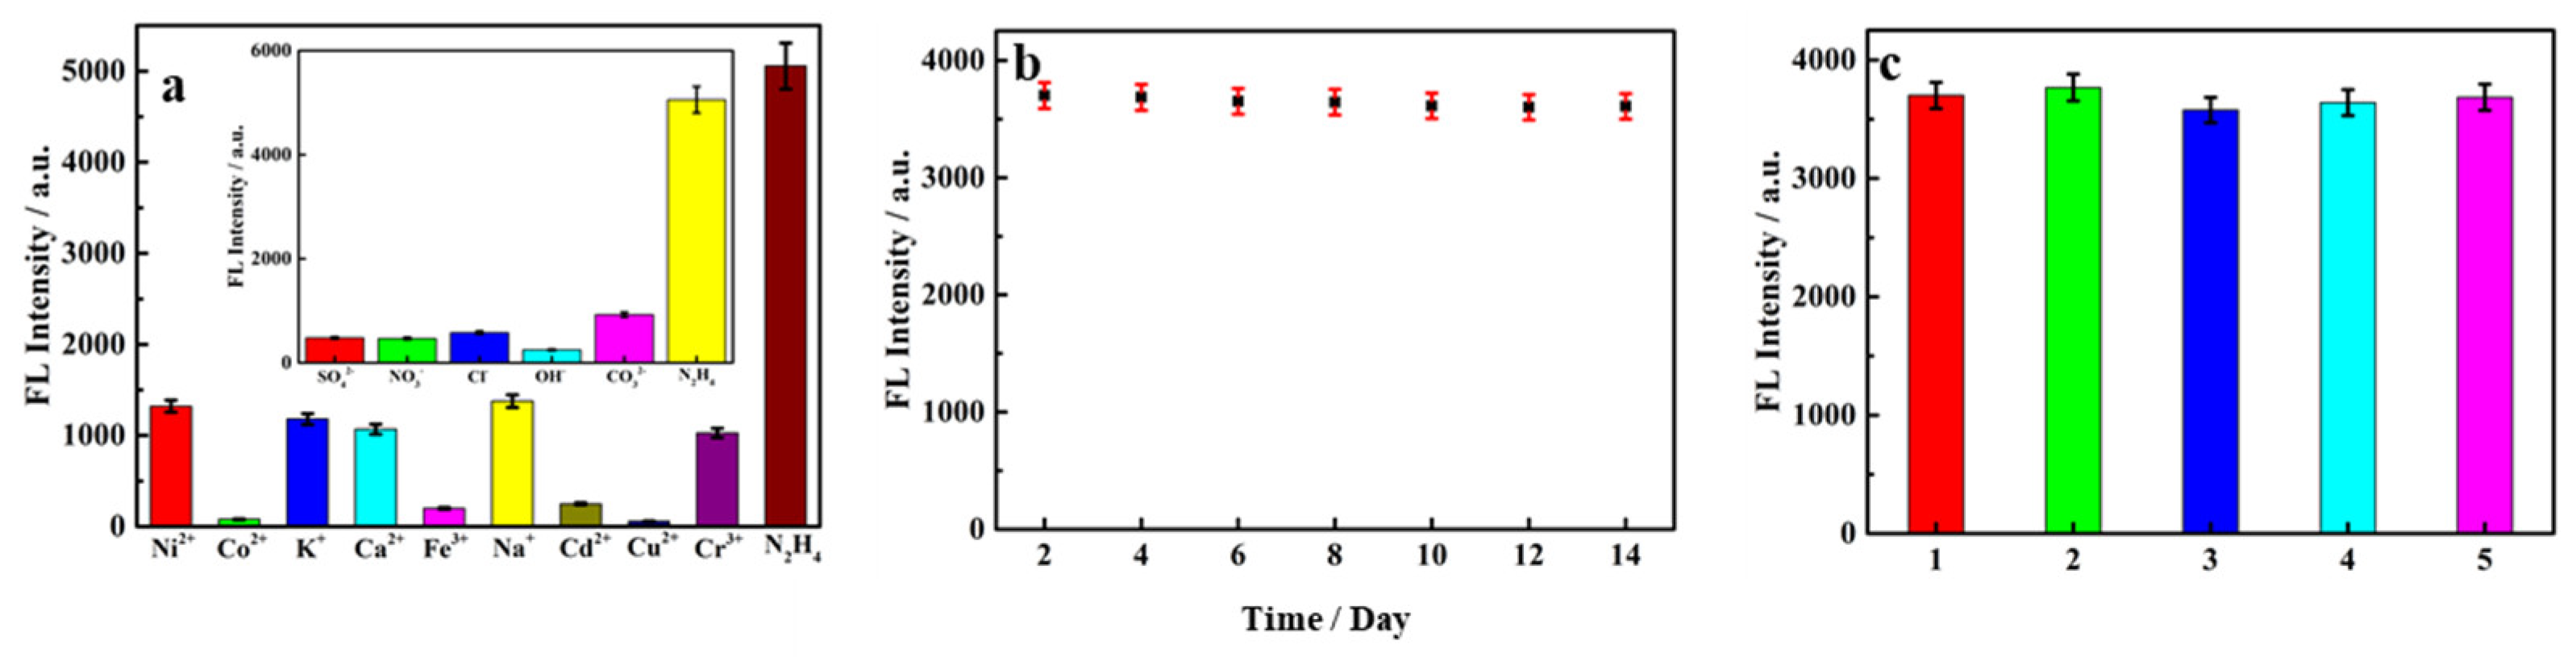
3.4. Selectivity, Stability, and Repeatability

To evaluate the specificity of the probe of SQDs@MnO2 NS, the selective as one of the most important factors was investigated under similar reaction conditions. The various ions including Ni2+, Co2+, K+, Ca2+, Fe2+, Na+, Cd2+, Cu2+, Cr2+, SO42−, NO3−, Cl, OH, CO32− were used as interference agents, these ions are the common positive ions and anions present in the environment. As shown in Figure 7a, the fluorescence intensity was negligible present the interference agents compared to have N2H4, indicating that the preparation probe has a strong anti-interference ability and accuracy detect N2H4 in environment water.
In addition, to further assess the stability of the SQDs@MnO2 NS fluorescent probe, the good stability of SQDs was an important means to verify. As depicted in Figure 7b, the fluorescence intensity of SQDs was continuous detection for 14 days under similar experimental conditions, it was noticed that the intensity have a slow decrease and the degree was insignificant. Interestingly enough, after a month of observing the intensity of SQDs was only a tiny different compared with them before a month, illustrating that the SQDs@MnO2 NS possessed a high stable fluorescence performance. For reproducibility, as can be seen from Figure 7c, the test was performed under the five sets of parallel solutions of SQDs in the same environment, all of the measured fluorescence intensities possess the semblable value with an outstanding RSD of 1.1%. This result was successful in confirming that the SQDs have preeminent reproducibility. Meanwhile, they have the potential benefit to the synthesis and application of the SQDs@MnO2 NS. These results demonstrated that the proposed sensor has good selectivity, stability, and repeatability for the analysis of N2H4.

3.5. Detection of N2H4 in Real Water Samples

To investigate the practicability of the probe of SQDs@MnO2 NS, it was applied to detect N2H4 in real samples. Three parallel water samples were obtained from the local lake and river for conducting the standard recovery test. The results were shown in Table 2, the N2H4 was detected in the lake, river, serum, and saliva, where the recovery ranged from 90.21% to 109.1%, and the RSD was 0.9% to 4.5%, demonstrating that the fluorescent probe possesses practicability with promise for future applications.

4. Conclusions

In summary, we have developed a “turn-on” fluorescent sensor based on the SQDs@MnO2 NS architectures for the detection of N2H4. The MnO2 NS has a broad absorption band of MnO2 NS at 280 to 650 nm, which could effectively quench the emission of fluorescence of SQDs, owing to the IFE mechanism. However, the fluorescent emission was recovered presenting the N2H4 analysis target with a concentration in the range of 0.1 µM to 10 mM, with a LOD of 0.072 µM. In addition, the fluorescent sensor was successfully applied in real samples indicating the SQDs@MnO2 NS probe was possess the potential ability to detect the N2H4 in the environmental water samples.

Supplementary Materials

The following supporting information can be downloaded at: https://0-www-mdpi-com.brum.beds.ac.uk/article/10.3390/nano12132207/s1, Figure S1: (a) XPS survey spectrum of MnO2 NS and SQDs; Figure S2: The quenching behavior of SQDs@MnO2 about the concentrations of MnO2 NS.

Author Contributions

Conceptualization: X.L. and X.W.; methodology: X.L. and X.W.; software: X.L., W.G., F.L., C.T., and X.Z. validation: X.L., X.W., F.L., C.T., and X.Z.; formal analysis: X.L., and X.W.; investigation: C.T., L.Z., W.G., and X.Z.; resources: C.T., L.Z., and X.Z.; writing—original draft preparation: X.L and X.Z.; writing—review and editing: F.L., C.T., and X.Z. All authors have read and agreed to the published version of the manuscript.

Funding

This research was financially supported by the National Natural Science Foundation of China (21778047), and the Natural Science Foundation of Shandong Province (grant no. ZR2021MB024).

Institutional Review Board Statement

Not applicable.

Informed Consent Statement

Not applicable.

Data Availability Statement

Not applicable.

Conflicts of Interest

There are no conflict to declare.

References

  1. Khushboo; Umar, A.; Kansal, S.K.; Mehta, S.K. Highly-sensitive and selective detection of hydrazine at gold electrode modified with PEG-coated CdS nanoparticles. Sens. Actuators B Chem. 2013, 188, 372–377. [Google Scholar] [CrossRef]
  2. Chen, S.; Hou, P.; Wang, J.; Liu, L.; Zhang, Q. A highly selective fluorescent probe based on coumarin for the imaging of N2H4 in living cells. Spectrochim. Acta Part A Mol. Biomol. Spectrosc. 2017, 173, 170–174. [Google Scholar] [CrossRef] [PubMed]
  3. Mazloum-Ardakani, M.; Khoshroo, A.; Hosseinzadeh, L. Simultaneous determination of hydrazine and hydroxylamine based on fullerene-functionalized carbon nanotubes/ionic liquid nanocomposite. Sens. Actuators B Chem. 2015, 214, 132–137. [Google Scholar] [CrossRef]
  4. He, Y.P.; Zheng, J.B.; Dong, S.Y. Ultrasonic-electrodeposition of hierarchical flower-like cobalt on petalage-like graphene hybrid microstructures for hydrazine sensing. Analyst 2012, 137, 4814–4818. [Google Scholar] [CrossRef] [PubMed]
  5. Haghighi, B.; Hamidi, H.; Bozorgzadeh, S. Sensitive and selective determination of hydrazine using glassy carbon electrode modified with Pd nanoparticles decorated multiwalled carbon nanotubes. Anal. Bioanal. Chem. 2010, 398, 1411–1416. [Google Scholar] [CrossRef]
  6. He, Y.P.; Zheng, J.B.; Sheng, Q.L. Cobalt nanoparticles as sacrificial templates for the electrodeposition of palladium nanomaterials in an ionic liquid, and its application to electrochemical sensing of hydrazine. Microchim. Acta 2012, 177, 479–484. [Google Scholar] [CrossRef]
  7. Koçak, S.; Aslışen, B. Hydrazine oxidation at gold nanoparticles and poly (bromocresol purple) carbon nanotube modified glassy carbon electrode. Sens. Actuators B Chem. 2014, 196, 610–618. [Google Scholar] [CrossRef]
  8. Do Nascimento, A.S.; Cabral, P.E.; Fontes, A.; Santos, B.S.; de Carvalho, F.R.; Stragevitch, L.; Leite, E.S. CdSe quantum dots as fluorescent nanomarkers for diesel oil. Fuel 2019, 239, 1055–1060. [Google Scholar] [CrossRef]
  9. Liu, M.P.; Liu, T.; Xiao, D. A FRET chemsensor based on graphene quantum dots for detecting and intracellular imaging of Hg2+. Talanta 2015, 143, 442–449. [Google Scholar] [CrossRef]
  10. Bogomolova, A.; Aldissi, M. Real-time aptamer quantum dot fluorescent flow sensor. Biosens. Bioelectron. 2011, 26, 4099–4103. [Google Scholar] [CrossRef]
  11. Li, X.C.; Zhao, Y.P.; Yin, J.L.; Lin, W.Y. Organic fluorescent probes for detecting mitochondrial membrane potential. Coord. Chem. Rev. 2020, 420, 213419. [Google Scholar] [CrossRef]
  12. Zhao, X.J.; Huang, C.Z. Small organic molecules as fluorescent probes for nucleotides and their derivatives. Trend. Anal. Chem. 2010, 29, 354–367. [Google Scholar] [CrossRef]
  13. Wang, Q.Y.; Ke, W.Q.; Lou, H.Y.; Han, Y.H.; Wan, J.M. A novel fluorescent metal-organic framework based on porphyrin and AIE for ultra-high sensitivity and selectivity detection of Pb2+ ions in aqueous solution. Dyes Pigment. 2021, 196, 109802. [Google Scholar] [CrossRef]
  14. He, R.; Wang, Y.L.; Ma, H.F.; Yin, S.G.; Liu, Q.Y. Eu3+-functionalized metal-organic framework composite as ratiometric fluorescent sensor for highly selective detecting urinary 1-hydroxypyrene. Dyes Pigment. 2018, 151, 342–347. [Google Scholar] [CrossRef]
  15. Zhou, Z.D.; Wang, C.Y.; Zhu, G.S.; Du, B.; Yu, B.Y.; Wang, C.C. Water-stable europium(III) and terbium(III)-metal organic frameworks as fluorescent sensors to detect ions, antibiotics and pesticides in aqueous solutions. J. Mol. Struct. 2022, 1251, 132009. [Google Scholar] [CrossRef]
  16. Halawa, M.I.; Lai, J.; Xu, G. Gold nanoclusters: Synthetic strategies and recent advances in fluorescent sensing. Mater. Today Nano 2018, 3, 9–27. [Google Scholar] [CrossRef]
  17. Wang, C.X.; Wu, J.P.; Jiang, K.L.; Humphrey, M.G.; Zhang, C. Stable Ag nanoclusters-based nano-sensors: Rapid sonochemical synthesis and detecting Pb2+ in living cells. Sens. Actuators B Chem. 2017, 238, 1136–1143. [Google Scholar] [CrossRef]
  18. Li, S.X.; Chen, D.J.; Zheng, F.Y.; Zhou, H.F.; Jiang, S.X.; Wu, Y.J. Water-Soluble and Lowly Toxic Sulphur Quantum Dots. Adv. Funct. Mater. 2015, 24, 7133–7138. [Google Scholar] [CrossRef]
  19. Duan, Y.X.; Tan, J.S.; Huang, Z.M.; Deng, Q.M.; Liu, S.J.; Wang, G.; Li, L.G.; Zhou, L. Facile synthesis of carboxymethyl cellulose sulfur quantum dots for live cell imaging and sensitive detection of Cr(VI) and ascorbic acid. Carbohydr. Polym. 2020, 249, 116882. [Google Scholar] [CrossRef]
  20. Gao, P.X.; Wang, G.; Zhou, L. Luminescent Sulfur Quantum Dots: Synthesis, Properties and Potential Applications. ChemPhotoChem 2020, 4, 5235–5244. [Google Scholar] [CrossRef]
  21. Lei, J.H.; Huang, Z.M.; Gao, P.X.; Sun, J.H.; Zhou, L. Polyvinyl Alcohol Enhanced Fluorescent Sulfur Quantum Dots for Highly Sensitive Detection of Fe3+ and Temperature in Cells. Part. Part. Syst. Charact. 2021, 38, 2000332. [Google Scholar] [CrossRef]
  22. Li, X.Q.; Li, M.Q.; Chen, Y.Z.; Qiao, G.X.; Liu, Q.; Zhou, Z.; Liu, W.Q.; Wang, Q.M. Chemical sensing failed by aggregation-caused quenching? A case study enables liquid/solid two-phase determination of N2H4. Chem. Eng. J. 2021, 415, 128975. [Google Scholar] [CrossRef]
  23. Li, D.D.; Zhang, Y.P.; Fan, Z.Y.; Chen, J.; Yu, J.H. Coupling of chromophores with exactly opposite luminescence behaviours in mesostructured organosilicas for high-efficiency multicolour emission. Chem. Sci. 2015, 6, 6097–6101. [Google Scholar] [CrossRef] [Green Version]
  24. Li, D.H.; Liu, L.; Yang, H.G.; Ma, J.; Wang, H.L.; Pan, J.M. A novel dual-response triphenylamine-based fluorescence sensor for special detection of hydrazine in water, Mater. Sci. Eng. B Adv. 2022, 276, 115556. [Google Scholar] [CrossRef]
  25. Xie, Y.; Yan, L.Q.; Tang, Y.J.; Tang, M.H.; Wang, S.Y.; Bi, L.; Sun, W.Y.; Li, J.P. A Smart Fluorescent Probe Based on Salicylaldehyde Schiff’s Base with AIE and ESIPT Characteristics for the Detections of N2H4 and ClO. J. Fluoresc. 2019, 29, 399–406. [Google Scholar] [CrossRef] [PubMed]
  26. Kong, X.Q.; Li, M.; Zhang, Y.Y.; Yin, Y.G.; Lin, W.Y. Engineering an AIE N2H4 fluorescent probe based on alpha-cyanostilbene derivative with large Stokes shift and its versatile applications in solution, solid-state and biological systems. Sens. Actuators B Chem. 2021, 329, 129232. [Google Scholar] [CrossRef]
  27. Wu, H.; Wang, Y.; Wu, W.N.; Xu, Z.Q.; Xu, Z.H.; Zhao, X.L.; Fan, Y.C. A novel ‘turn-on’ coumarin-based fluorescence probe with aggregation-induced emission (AIE) for sensitive detection of hydrazine and its imaging in living cells. Spectrochim. Acta Part A Mol. Biomol. Spectrosc. 2019, 222, 117272. [Google Scholar] [CrossRef]
  28. Chen, Z.Z.; Deng, Y.H.; Zhang, T.; Dong, W.K. A novel bifunctional-group salamo-like multi-purpose dye probe based on ESIPT and RAHB effect: Distinction of cyanide and hydrazine through optical signal differential protocol. Spectrochim. Acta Part A Mol. Biomol. Spectrosc. 2021, 262, 120084. [Google Scholar] [CrossRef]
  29. Li, X.; Yin, J.W.; Liu, W.Y.; Yang, Y.T.; Xu, W.Z.; Li, W. A Novel Double Fluorescence-Suppressed Probe for the Detection of Hydrazine. ChemistrySelect 2020, 4, 14069–14074. [Google Scholar] [CrossRef]
  30. Chen, Z.; Zhong, X.X.; Qu, W.B.; Shi, T.; Liu, H.; He, H.P.; Zhang, X.H.; Wang, S.F. A highly selective HBT-based “turn-on” fluorescent probe for hydrazine detection and its application. Tetrahedron Lett. 2017, 58, 2596–2601. [Google Scholar] [CrossRef]
  31. Jiang, X.Z.; Zhen, L.; Mingqin, S.G.; Yi, S.L.; Zeng, X.Y.; Zhang, Y.L.; Hou, L.X. A fluorescence “turn-on” sensor for detecting hydrazine in environment. Microchem. J. 2020, 152, 104376. [Google Scholar] [CrossRef]
  32. Das, A.K.; Goswami, S. 2-Hydroxy-1-naphthaldehyde: A versatile building block for the development of sensors in supramolecular chemistry and molecular recognition. Sens. Actuators B Chem. 2017, 245, 1062–1125. [Google Scholar] [CrossRef]
  33. Ping, Y.; David, R.W. Calculation for Fluorescence Modulation by Absorbing Species and Its Application to Measurements Using Optical Fibers. Anal. Chem. 1987, 59, 2391–2394. [Google Scholar]
  34. Wang, H.G.; Wang, Z.G.; Xiong, Y.; Kershaw, S.V.; Li, T.Z.; Wang, Y.; Zhai, Y.Q.; Rogach, A.L. Hydrogen Peroxide Assisted Synthesis of Highly Luminescent Sulfur Quantum Dots. Angew. Chem. Int. Ed. 2019, 58, 7040–7044. [Google Scholar] [CrossRef] [PubMed]
  35. He, Y.; Huang, W.; Liang, Y.; Yu, H.L. A low-cost and label-free assay for hydrazine using MnO2 nanosheets as colorimetric probes. Sens. Actuators B Chem. 2015, 220, 927–931. [Google Scholar] [CrossRef]
  36. He, L.Y.; Lu, Y.X.; Wang, F.Y.; Jing, W.J.; Chen, Y.; Liu, Y.Y. Colorimetric sensing of silver ions based on glutathione-mediated MnO2 nanosheets. Sens. Actuators B Chem. 2018, 254, 468–474. [Google Scholar] [CrossRef]
  37. Amjadi, M.; Hallaj, T.; Kouhi, Z. An enzyme-free fluorescent probe based on carbon dots-MnO2 nanosheets for determination of uric acid. J. Photochem. Photobiol. A Chem. 2018, 356, 603–609. [Google Scholar] [CrossRef]
  38. Zhang, Y.Y.; Li, Y.X.; Zhang, C.Y.; Zhang, Q.F.; Huang, X.A.; Yang, M.D.; Shahzad, S.A.; Lo, K.K.W.; Yu, C.; Jiang, S.C. Fluorescence turn-on detection of alkaline phosphatase activity based on controlled release of PEI-capped Cu nanoclusters from MnO2 nanosheets. Anal. Bioanal. Chem. 2017, 409, 4771–4778. [Google Scholar] [CrossRef]
  39. Zhang, Y.; Liu, J.F.; Yi, R.H.; Ai, S.F.; Cheng, H.R.; Jia, W.Z. Synthesis and Application of a Flavone-based Fluorescent Probe for Detection of Hydrazine. Chin. J. Anal. Chem. 2019, 46, 511–516. [Google Scholar]
  40. Jiang, Q.; Wang, Z.L.; Li, M.X.; Song, J.; Yang, Y.Q.; Xu, X.; Xu, H.J.; Wang, S.F. A novel dual-response fluorescent probe based on nopinone for discriminative detection of hydrazine and bisulfate from different emission channels. Tetrahedron Lett. 2020, 61, 152103. [Google Scholar] [CrossRef]
Figure 1. Mechanism of “turn-on” fluorescence sensor based on SQDs@MnO2 NS for detecting N2H4.
Nanomaterials 12 02207 g001
Figure 2. (a) HR-TEM images of SQDs; (b) the diameter distribution of the SQDs; (c) TEM images of MnO2 NS with HR-TEM images of MnO2 NS (inset); (d) TEM images of SQDs@MnO2 NS with HR-TEM images of SQDs@MnO2 NS (inset).
Nanomaterials 12 02207 g002
Figure 3. (a) XPS survey spectrum and (b) high-resolution Mn 2p, and (c) high-resolution S 2p XPS spectrum of SQDs@MnO2 NS.
Nanomaterials 12 02207 g003
Figure 4. (a) UV-Vis spectra of SQDs, MnO2 NS, and SQDs@MnO2 NS; (b) the excitation and emission spectra of SQDs@MnO2.
Nanomaterials 12 02207 g004
Figure 5. Optimization of conditions: (a) optimal excitation wavelength for SQDs; (b) concentrations of MnO2 NS; (c) volume ratio of N2H4 to MnO2 NS; (d) Different pH; (e) the molar ratio of SQDs@MnO2 (a–h (SQDs: MnO2 = 10:0, 10:1, 10:2, 10:3, 10:4, 10:5, 10:6, 10:7)); (f) the response time of SQDs@MnO2 with N2H4.
Nanomaterials 12 02207 g005
Figure 6. (a) The response of SQDs@MnO2 NS fluorescent probe to N2H4 solution with different concentrations (0.1 µM–10 mM); (b) The linear relationship between fluorescence intensity and N2H4 concentrations.
Nanomaterials 12 02207 g006
Figure 7. (a) The effect of different cations and anions on the fluorescence intensity of SQDs@MnO2 NS fluorescent probe; (b) the fluorescence intensity stability of SQDs in two weeks; (c) the reproducibility of SQDs in 5 groups.
Nanomaterials 12 02207 g007
Table 1. Comparison of several different methods for N2H4 detection.
MethodLinear Range (M)Detection Limit (M)Ref.
ZY8 a1.6 × 10−7–6.2 × 10−51.6 × 10−7[39]
PBAS b0–2 × 10−54.1 × 10−7[25]
CEFN c0–6 × 10−59.6 × 10−8[40]
HBTM d0–1.4 × 10−42.9 × 10−7[30]
SQDs@MnO2 NS10−7–10−27.2 × 10⁻⁸This work
a 3-hydroxyflavone; b Salicylaldehyde Schiff’s bases; c nopinone; d 5-acetyl-2-hydroxybenzaldehyde and 2-aminothiophenol.
Table 2. Recoveries for detecting N2H4 in real samples (n = 3).
SampleAdded (M)Found (M)Recovery (%)RSD (%)
10−21.073 × 10−2107.31.4
Lake water10−50.9021 × 10−590.212.1
10−70.9624 × 10−796.241.1
10−21.091 × 10−2109.12.2
River water10−51.032 × 10−5103.20.9
10−70.9254 × 10−792.541.7
10−20.9691 × 10−296.914.5
Serum10−50.9967 × 10−599.671.9
10−71.027 × 10−7102.72.8
10−20.9851 × 10−298.513.1
Saliva10−50.9741 × 10−597.411.6
10−71.016 × 10−7101.62.9
Publisher’s Note: MDPI stays neutral with regard to jurisdictional claims in published maps and institutional affiliations.

