Article

pH-Driven Intracellular Nano-to-Molecular Disassembly of Heterometallic [Au2L2]{Re6Q8} Colloids (L = PNNP Ligand; Q = S2− or Se2−)

1
Arbuzov Institute of Organic and Physical Chemistry, FRC Kazan Scientific Center of RAS, 8 Arbuzov Street, 420088 Kazan, Russia
2
Department of Nanotechnology in Electronics, Kazan National Research Technical University Named after A.N. Tupolev-KAI, 10 K. Marx Street, 420111 Kazan, Russia
3
Nikolaev Institute of Inorganic Chemistry, SB RAS, 3 Academician Lavrentiev Avenue, 630090 Novosibirsk, Russia
4
Kazan Institute of Biochemistry and Biophysics, FRC Kazan Scientific Center of RAS, 2/31 Lobachevski Street, 420111 Kazan, Russia
5
Institute for Radio-Electronics and Telecommunications, Kazan National Research Technical University Named after A.N. Tupolev-KAI, 10 K. Marx Street, 420111 Kazan, Russia
*
Author to whom correspondence should be addressed.
Nanomaterials 2022, 12(18), 3229; https://0-doi-org.brum.beds.ac.uk/10.3390/nano12183229
Submission received: 22 August 2022 / Revised: 12 September 2022 / Accepted: 14 September 2022 / Published: 17 September 2022
(This article belongs to the Special Issue Functional Nanocomposite Material Based on Metal Atom Clusters)

Abstract

:
The present work introduces a simple, electrostatically driven approach to engineered nanomaterial built from the highly cytotoxic [Au2L2]2+ complex (Au2, L = 1,5-bis(p-tolyl)−3,7-bis(pyridine-2-yl)−1,5-diaza-3,7-diphosphacyclooctane (PNNP) ligand) and the pH-sensitive red-emitting [{Re6Q8}(OH)6]4− (Re6-Q, Q = S2− or Se2−) cluster units. The protonation/deprotonation of the Re6-Q unit is a prerequisite for the pH-triggered assembly of Au2 and Re6-Q into Au2Re6-Q colloids, exhibiting disassembly in acidic (pH = 4.5) conditions modeling a lysosomal environment. The counter-ion effect of polyethylenimine causes the release of Re6-Q units from the colloids, while the binding with lysozyme restricts their protonation in acidified conditions. The enhanced luminescence response of Re6-S on the disassembly of Au2Re6-S colloids in the lysosomal environment allows us to determine their high lysosomal localization extent through the colocalization assay, while the low luminescence of Re6-Se units in the same conditions allows us to reveal the rapture of the lysosomal membrane through the use of the Acridine Orange assay. The lysosomal pathway of the colloids, followed by their endo/lysosomal escape, correlates with their cytotoxicity being on the same level as that of Au2 complexes, but the contribution of the apoptotic pathway differentiates the cytotoxic effect of the colloids from that of the Au2 complex arisen from the necrotic processes.

1. Introduction

The wide and personalized differences between tumors and their ability to evolve over time or acquire multidrug resistance (MDR) warrant a diverse plethora of treatment options. The treatment of drug-resistant cancer is a challenging problem for which alternative approaches to chemotherapy are being developed. In this regard, it is worth noting the silencing of the expression of tumor-associated genes as an alternative or complementary route to the use of chemotherapeutic agents [1,2,3,4]. However, the present work is devoted to nanomaterial’s engineering strategy aimed at damaging specific cellular compartments as an alternative approach to overcoming drug resistance. Lysosomes are biorelevant cell compartments that are well-known to be overdeveloped in cancer versus normal cells [5,6]. Damage to lysosomes due to lysosome membrane permeabilization (LMP) can derive from swelling [7], agglomeration [8,9], or the dissolution of a nanomaterial within lysosomes [10,11,12,13,14,15,16,17], in turn resulting from specific lysosomal acidity (pH < 5.0). The aforesaid behavior of the nanomaterial can be achieved through developing specific nanoarchitectures exhibiting either pH-dependent aggregation or dissolution behavior and high affinity to lysosomal compartments. The literature data represent excellent examples of the nanoarchitectures generating specific cancer versus normal cell death [7,8,9,10,11,12,13,14,15,16,17], although the main structural or morphological features required for such specificity are not well recognized.
The artificial inorganic nanoparticles built from metal oxides, sulfides, and noble metals designated as engineered nanomaterials (ENs) have gained growing attention as a promising basis for anticancer therapeutic agents [18,19]. The bottom-up approach in the development of ENs through the use of metal complexes as building blocks in developing either crystalline or gel-like nanomaterial is gaining growing attention since the approach can provide an additional tool to develop anticancer treatment through the controlled release of metal complexes instead of metal ions in the lysosomal environment [20,21,22,23,24]. Thus, the present work is aimed at the application of the already-documented smart delivery strategy involving the acidity-triggered dissolution [10,11,12,13,14,15,16,17,25,26,27,28] of the metal complex-based ENs.
Au(I) complexes with phosphine derivatives have been already well recognized as a promising basis for anticancer therapeutic agents due to the cascade of chemical transformations triggered by their interactions with biothiols and the enzymes responsible for the intracellular redox balance [29,30,31,32,33]. The Au(I) complexes combining positive charging with enough hydrophobicity are of particular importance from the viewpoint of cytotoxicity due to their potential for mitochondrial localization [29,34]. However, it is well-known that both the entrance and cytotoxicity mechanisms of molecular complexes significantly differ from those of their nanoparticulate forms. Moreover, it has already been demonstrated that the cytotoxicity of [Au2L2]2+ (L is a cyclic PNNP ligand) complexes can be significantly modified through their incorporation into heterometallic colloids based on the counter-ion binding with the anionic hexamolybdenum cluster complexes [35]. It is worth assuming that a similar strategy can be applied in the development of ENs with the controllable release of [Au2L2]2+ triggered by the acidic lysosomal environment.
The previous reports highlight the hexarhenium chalcohydroxo cluster complex [{Re6Q8}(OH)6]4− (Q = S2− or Se2−) as the pH-sensitive luminophore due to the pH-driven protonation/deprotonation of the apical ligands [36]. Moreover, the anionic cluster units [{Re6Q8}(OH)6]4− (Re6-Q) are able to assemble with [Au2L2]2+ (Au2) in aqueous solutions, resulting in the formation of heterometallic colloids exhibiting pH-induced transformations [37].
Thus, the present work introduces [{Re6Q8}(OH)6]4− (Q = S2− or Se2−) as the anionic pH-dependent blocks for self-assembly with Au2 complexes at pH above 8.0 and disassembly at pH below 5.0. The electrostatically driven pH-dependent assembly/disassembly of Au2 complexes with Re6-S or Re6-Se cluster units is introduced as a proof-of-concept of the rational design of a heterometallic EN able to undergo disassembly in the specific pH conditions of lysosomal compartments. The modes of surface decoration of the as-engineered heterometallic colloids and their cytotoxicity towards cancer and normal cells in correlation with the intracellular trafficking through the lysosomal pathway of the colloids are also discussed in the present work.

2. Materials and Methods

2.1. Reagents and Materials

Commercial chemicals: Polyethylenimine (PEI branched, MMaveraged = 25,000 Da) was purchased from Aldrich Chemistry (Burlington, MA, USA) and lysozyme was purchased from AppliChem (Darmstadt, Germany). Distilled water was used as a solvent. Tris-(hydroxymethyl)-aminomethane (TRIS) extra pure (pH = 8.8) from Scharlau, acetic-acetate (pH = 4.0–5.5), phosphate (pH = 6.0–7.4), and sodium tetraborate (Na2B4O7·10 H2O) (pH = 10.1) buffers were used as the buffers.
The salts K4[{Re6S8}(OH)6]·8 H2O and K4[{Re6Se8}(OH)6]·8 H2O were synthesized and purified in accordance with previously published procedures [38].
Complex [Au2L2]Cl2 was synthesized by the reaction of 1,5-bis(p-tolyl)−3,7-bis(pyridine-2-yl)−1,5-diaza-3,7-diphosphacyclooctane (PNNP ligand) with gold (I) tetrahydrothiophene (tht) chloride [(tht)AuCl] in 1:1 ligand-to-metal molar ratio [37]. The PNNP ligand was synthesized through a previously published procedure [39].
The aqueous colloids Au2Re6-S and Au2Re6-Se were synthesized by the drop-wise addition of 0.3 mL of the aqueous [Au2L2]Cl2 solution (C = 0.6 mM) to 2.7 mL (C = 0.033 mM) of aqueous K4[{Re6S8}(OH)6]·8H2O (pH = 8.8 adjusted by 0.1 M TRIS) and K4[{Re6Se8}(OH)6]·8H2O (pH = 10.1 adjusted by 0.02 M borate buffer) solutions, correspondingly, under vigorous stirring. The pH values of the synthetic solutions were adjusted to 8.8 for Re6-S, while higher pH (10.1) was applied for Re6-Se to control the negative charge of the cluster units for their assembly with Au2 through electrostatic attraction with the simultaneous monitoring of the stability of the Au2 complex at the applied pH values (Figure S1).The turbid solutions were then subjected to ultrasonic treatment within 20 min at room temperature with the subsequent separation of colloids through centrifugation (15,000 rpm for 30 min at 5 °C). The ultrasonication-centrifugation procedure was repeated twice in order to remove the excess initial components.
The loss of the Re6-S and Re6-Se clusters during the synthesis, determined by the luminescence data, is 27% and 26%, respectively.

2.2. Methods

2.2.1. Dynamic Light Scattering

Dynamic light scattering (DLS) and electrokinetic potential experiments were performed on a Zetasizer Nano instrument (Malvern Instruments, Malvern, UK). Electrokinetic potential values were calculated by the Smoluchowski–Helmholtz equation [40]. Experimental autocorrelation functions were analyzed with the Malvern DTS software (v1.41, Malvern, UK) and the second-order cumulant expansion methods. The average error was ca. 4%. All samples were prepared in deionized water filtered through a PVDF membrane with a Syringe Filter (0.45 µm). All measurements were performed at least in triplicate at 25 °C.

2.2.2. UV-Vis Absorption Spectra

UV-VIS spectra were recorded on Specord 50 Plus (Analytik Jena AG, Jena, Germany) spectrophotometer in 10 mm quartz cuvettes.

2.2.3. Fluorescence Spectroscopy

The emission spectra were recorded on a fluorescence spectrophotometer Hitachi F-7100 (Tokyo, Japan) with stigmatic concave diffraction grating. The excitation of samples was performed at 400 nm and emission was detected at 500–750 nm.

2.2.4. IR Spectroscopy

The infrared spectra were recorded on a Tensor 27 Fourier-transform spectrometer Bruker (Ettlingen, Germany) in a range of 4000–400 cm−1 with an optical resolution of 4 cm−1 and an accumulation of 32 scans using KBr pressed pellets.

2.2.5. ICP-OES

Re, Au, and P ion concentrations in colloids were identified using a simultaneous inductively coupled plasma optical emission spectrometer (ICP-OES), model iCAP 6300 DUO by Varian Thermo Scientific Company, equipped with a CID detector (168 Third Avenue, Waltham, MA, USA). Together, the radial and axial view configurations enable optimal peak height measurements with suppressed spectral noises. The concentrations of Re, Au, and P ions were determined, respectively, by the spectral lines: 221.426, 242.795, and 178.284 nm. Sc standard was used as the internal standard (10 ppm in each sample) and standards of Re, Au, and P as calibration standards (five-point calibration).

2.2.6. TEM Measurements

Samples were prepared as follows: a drop of 6 μL was taken from the middle of a freshly prepared solution using a dispenser (Biohit Proline Plus, Göttingen, Germany) and applied to a 300 mesh copper grid with a carbon-formvar support film (Agar Scientific, Essex, UK). A drop completely covers the grid. The sample preparation process was carried out at room temperature. Next, the sample was dried in a muffle furnace at 80 °C. TEM images were obtained on a Hitachi HT7700 transmission electron microscope (Tokyo, Japan) at an accelerating voltage of 100 kV (direct observation state).

2.2.7. Powder X-ray Diffraction (PXRD)

PXRD measurements were performed on an automatic Bruker D8 Advance diffractometer equipped with a Vario attachment and Vantec linear PSD using Cu radiation (40 kV, 40 mA) monochromated by a curved Johansson monochromator (λ CuKα1 1.5406 Å) (Bruker Optik GmbH, Ettlingen, Germany). Room temperature data were collected in the reflection mode with a flat-plate sample.
A colloidal solution in water was applied to a silicon plate for the study. To increase the total amount of the sample, several more layers were applied on top of the first one after it dried. Patterns were recorded in the 2θ range between 3° and 90° in 0.008° steps with a step time of 1s. The samples were spun (15 rpm) throughout the data collection. Processing of the obtained data was performed using EVA [41] and TOPAS [42] software packages.

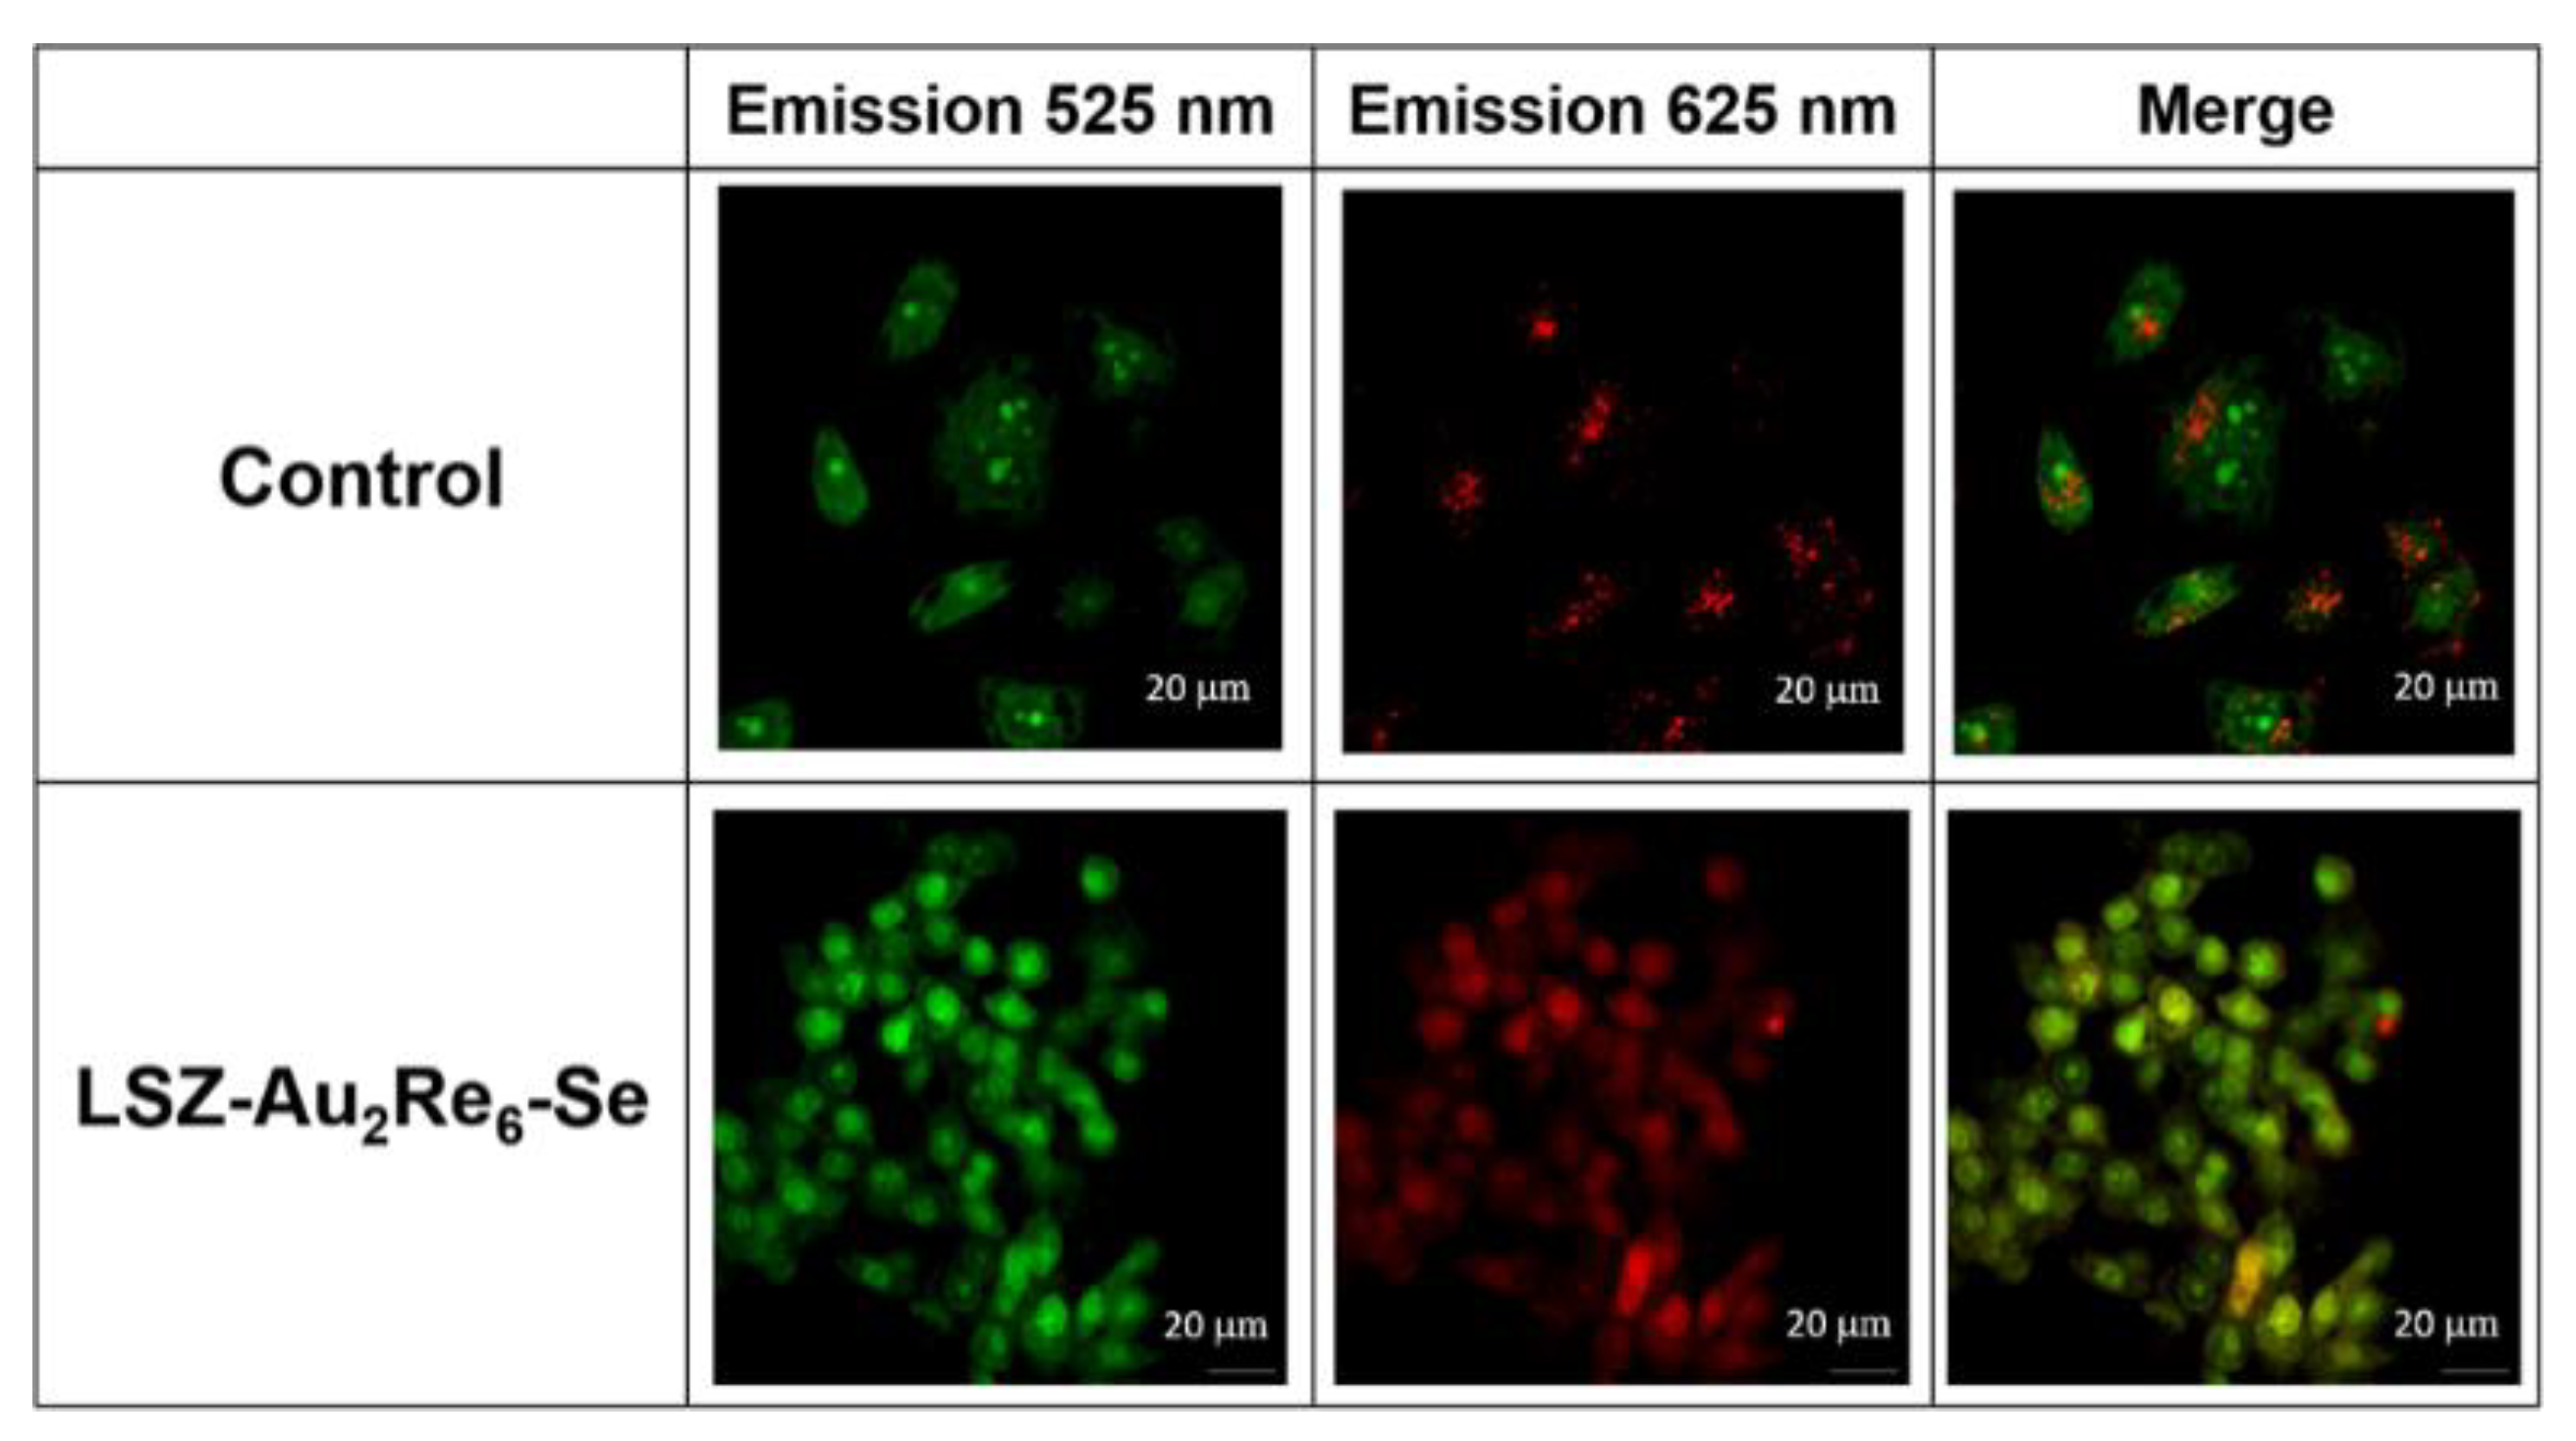
2.2.8. Confocal Laser Microscopy

M-HeLa cells in the amount of 1 × 10⁶ cells/well at a final volume of 2 mL were sown in 6-well plates (Eppendorf AG, Hamburg, Germany) in DMEM (PanEco, St. Petersburg, Russia) supplemented with 1% L-glutamine, 0.1% gentamicin, and 10% FBS (Gibco, Life Technologies, Eugene, OR, USA). After 24-h incubation in a CO2 incubator (37 °C, 5% CO2) LSZ-Au2Re6-S and LSZ-Au2Re6-Se colloids at a final concentration of 1 and 3 µM, respectively, were added to the wells and incubated for 24 h. Untreated M-HeLa cells were used as a negative control.
For lysosomes imaging, M-HeLa cells after incubation with colloids were washed twice with PBS and then the cells were incubated for 30 min with LysoTracker Blue DND 22 (1 μM; Invitrogen, Life Technologies Corp., Eugene, OR, USA). Cells were imaged using a Laser Scanning Confocal Microscope Leica TCS SP5 MP (Leica Microsystems, Wetzlar, Germany). Colloids were excited at 405 nm and the fluorescence emission was collected from 620 to 670 nm. LysoTracker Blue DND 22 was excited at 373 nm and the fluorescence emission was collected from 421 nm to 527 nm. Image analysis was performed in LAS AF software (version 2.2.1 Build 4842, SP5, Leica Microsystems CMS GmbH, Mannheim, Germany) with a colocalization tool. Pearson’s correlation coefficient was used to quantify the correlation between the fluorescence intensities of the LysoTracker Blue DND 22 and colloids.
The lysosomal disruption study was investigated using AO as the indicator. After incubation with NPs, M-HeLa cells were stained with AO (5 μM) for 5 min, followed by three washes with PBS. Finally, the cells were imaged by CLSM (Leica TCS SP5 MP (Leica Microsystems, Wetzlar, Germany)). The excitation of AO was 488 nm, and the emission was 525 nm for green and 625 nm for red.

2.2.9. Statistical Analyses

Pearson’s correlation coefficient was calculated for each captured field of vision (n = 50), and at least 50 cells were taken into account for each field. Data are expressed as means ± SE. The significance of differences in normally distributed data was analyzed with Student’s t-test. Differences were regarded to be statistically significant at p < 0.05.

2.2.10. Cytotoxicity Assay

The cytotoxic effects of the colloids on human cancer and normal cells were assessed by means of the multifunctional Cytell Cell Imaging system (GE Health Care Life Science, Uppsala, Sweden) using the Cell Viability Bio App, which precisely counts cell numbers and evaluates their viability based on the fluorescence intensity of the dyes 4’,6-diamidine-2-phenylindole (DAPI) and propidium iodide (PI) [43]. Intercalating fluorochrome DAPI penetrates intact membranes of living cells and stains nuclei blue. The high molecular weight dye PI passes only into dead cells with altered membranes, staining them orange. Human clone M-HeLa 11, epithelioid carcinoma of the cervix, strain HeLa, clone M-HeLa from the Collection of type cultures of the Institute of Cytology of the Russian Academy of Sciences, and the Chang liver cell line (human liver cells) by N. F. Gamalei microbiology were used in experiments. The cells were cultured in a standard Eagle’s nutrient medium (PanEco company, Moscow, Russia), supplemented with 10% fetal calf serum and 1% nonessential amino acids. The cells at a concentration of 100,000 cells/mL were plated into a 96-well plate (Eppendorf) (150 μL of medium per well) and incubated under CO2 at 37 °C. After incubation for 24 h, the colloids were added at different concentrations (150 μL to each well). The dilutions of the colloids were prepared immediately in nutrient media. The experiments were repeated three times. The untreated M-HeLa and Chang Liver cells were used as controls.
The IC50 values were calculated using the online calculator MLA-Quest Graph™ IC50 Calculator (AAT Bioquest, Inc., Sunnyvale, CA, USA) (Version 2021) [44]. The values calculated from the triplicate measurements were averaged.

2.2.11. Cellular Uptake Study

M-HeLa cells (1 × 10⁵ cells/well) at a final volume of 500 µL were sown in a 24-well plate (Eppendorf, Tokyo, Japan). After 24-hour incubation, 1 μM of testing compounds were added to the wells and incubated for 24 h under CO2. Cellular uptake was analyzed by flow cytometry (Guava easy Cyte 8HT, MERCK, Kenilworth, NJ, USA). Studies were performed with irradiation by laser V 405 nm, filter 583/26. Untreated cells were used as a negative control. A detailed description of the procedure is introduced in [45]. The studies were carried out in triplicate.

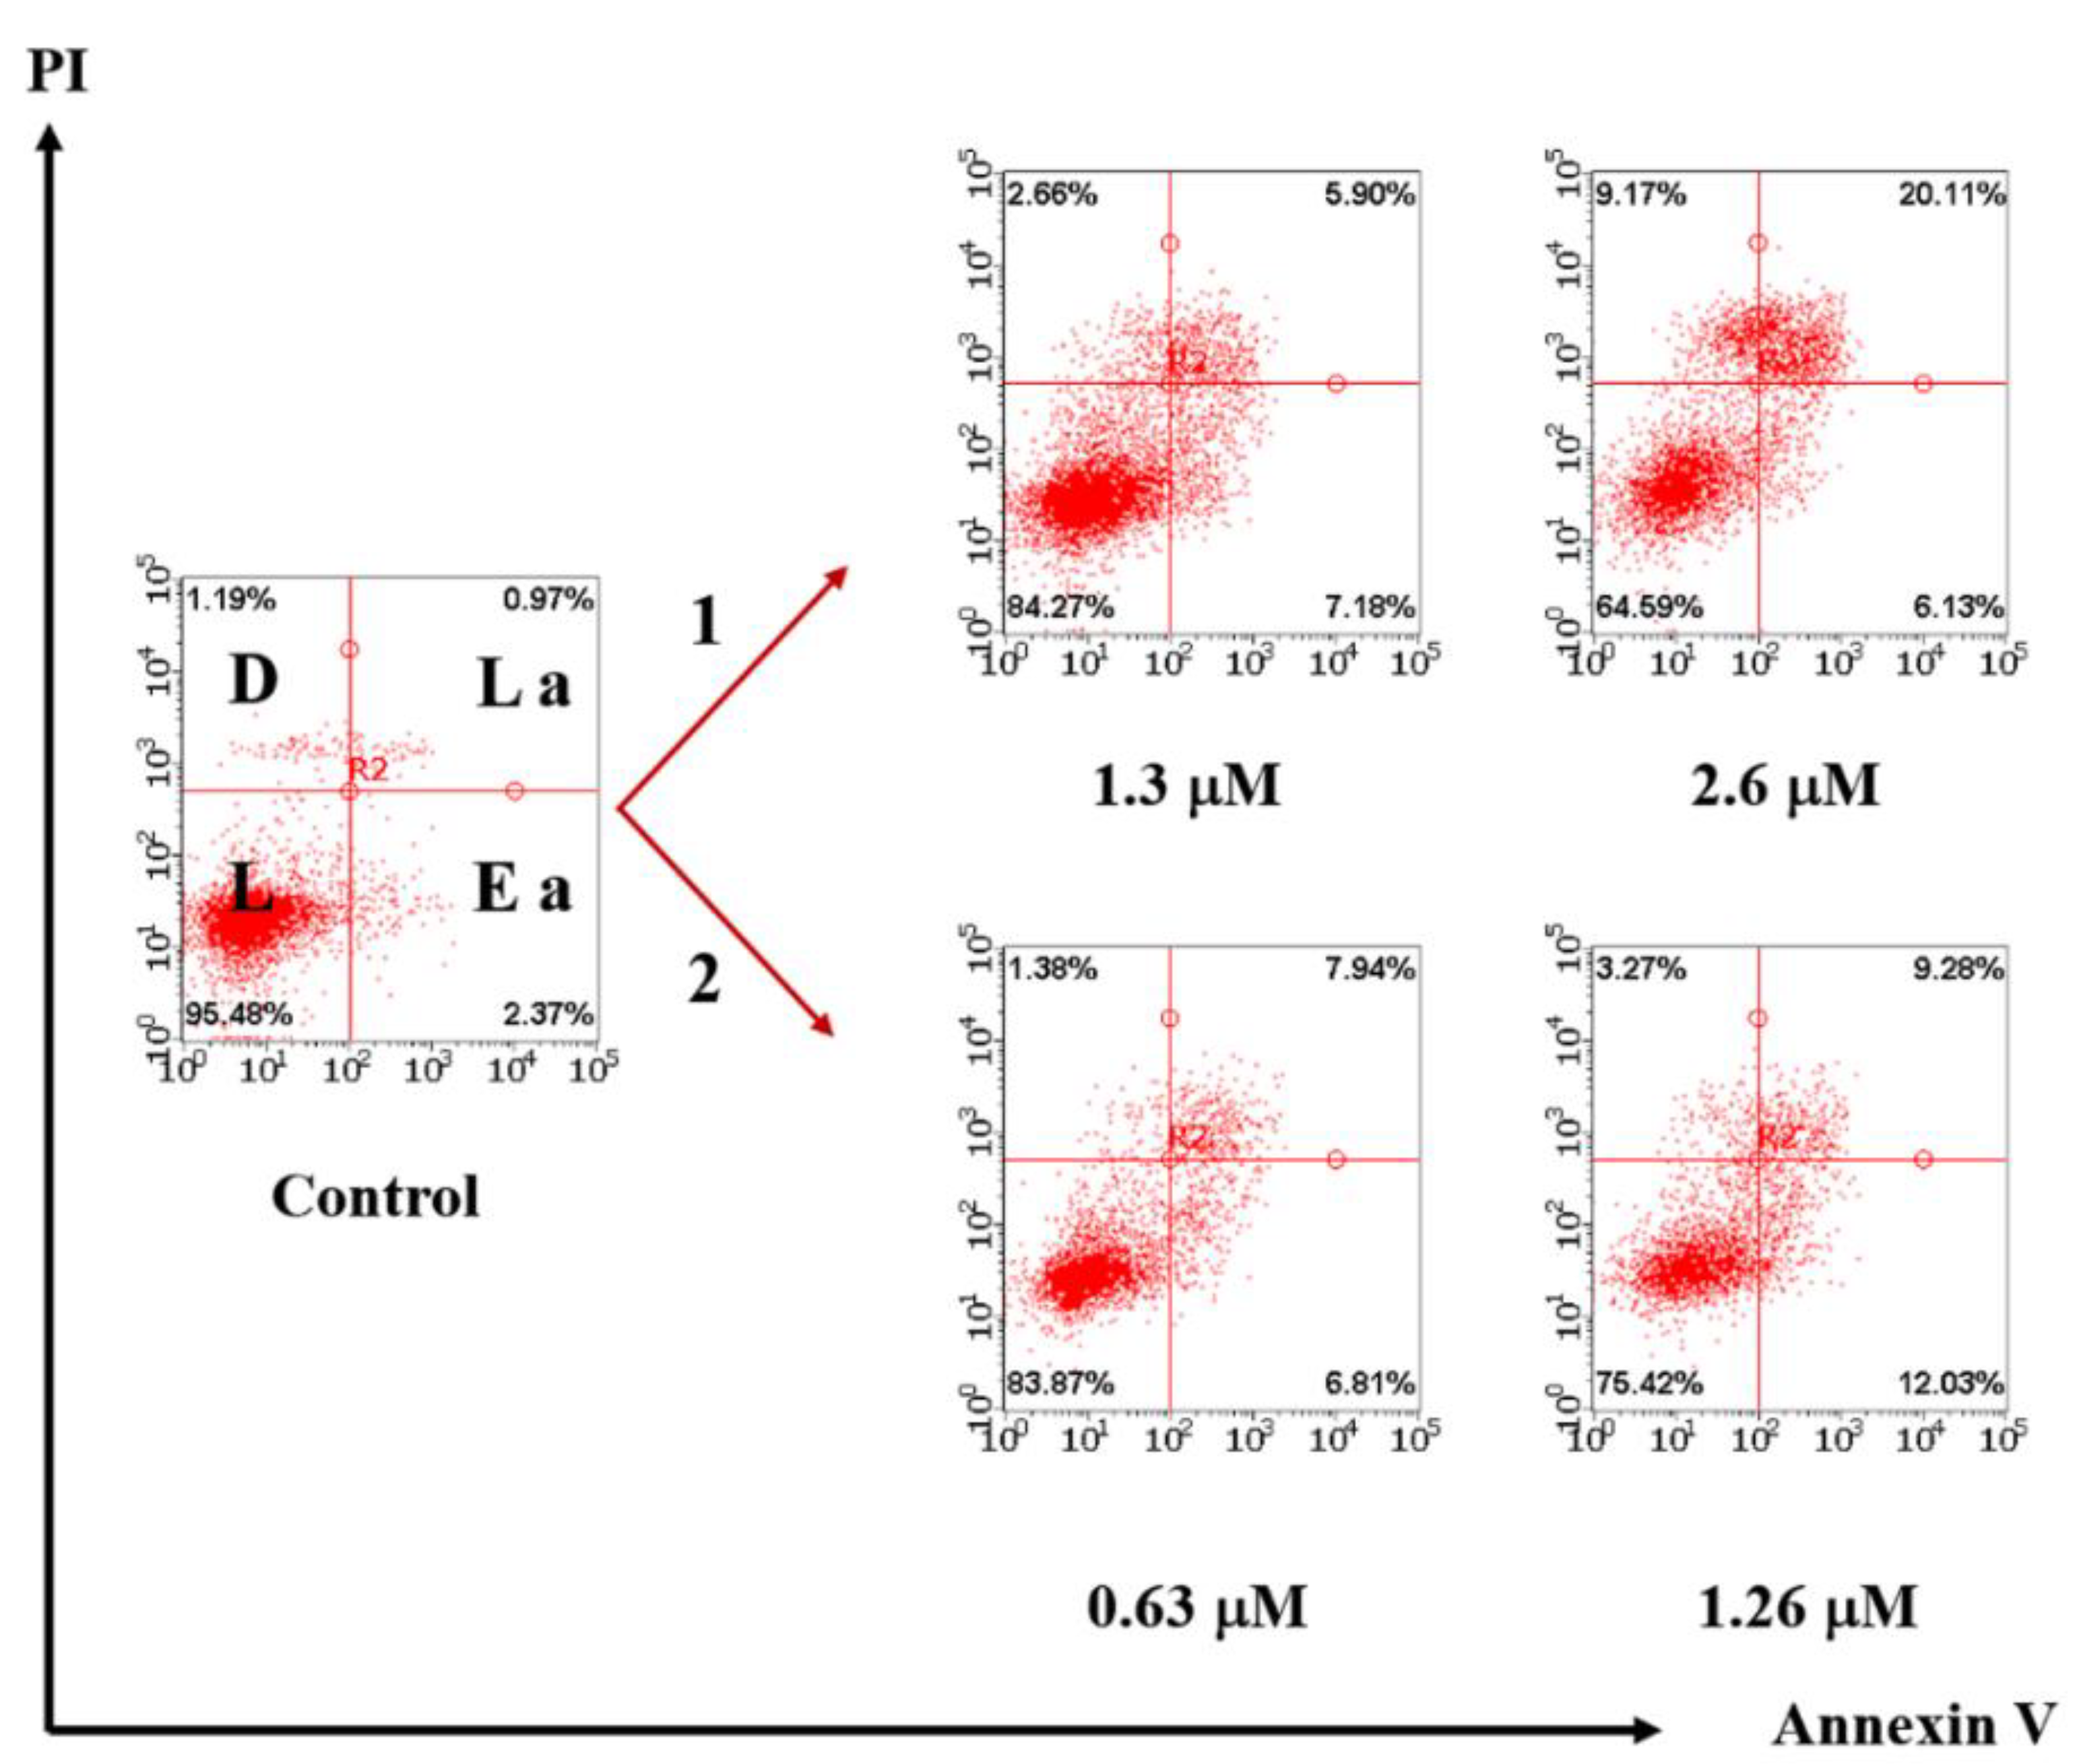
2.2.12. Cell Apoptosis Analysis

M-HeLa cells (1 × 10⁶ cells/well) at a final volume of 2 mL were sown in a 6-well plate. After 24-hour incubation, testing compounds were added to wells. The cells were harvested at 2000 rpm for 5 min and then washed twice with ice-cold PBS (4 °C), followed by resuspension in binding buffer 100 μL. Next, the samples were incubated with 0.35 μL of Annexin V-Alexa Fluor 647 and 0.1 μL of PI for 40 min at room temperature in the dark. Finally, the cells were analyzed by flow cytometry (Guava easy Cyte, MERCK, Kenilworth, NJ, USA). Untreated cells were used as control. A detailed description of the procedure is introduced in [46]. The 20,000 events have been analyzed in the apoptotic assay. The studies were carried out in triplicate.

3. Results and Discussion

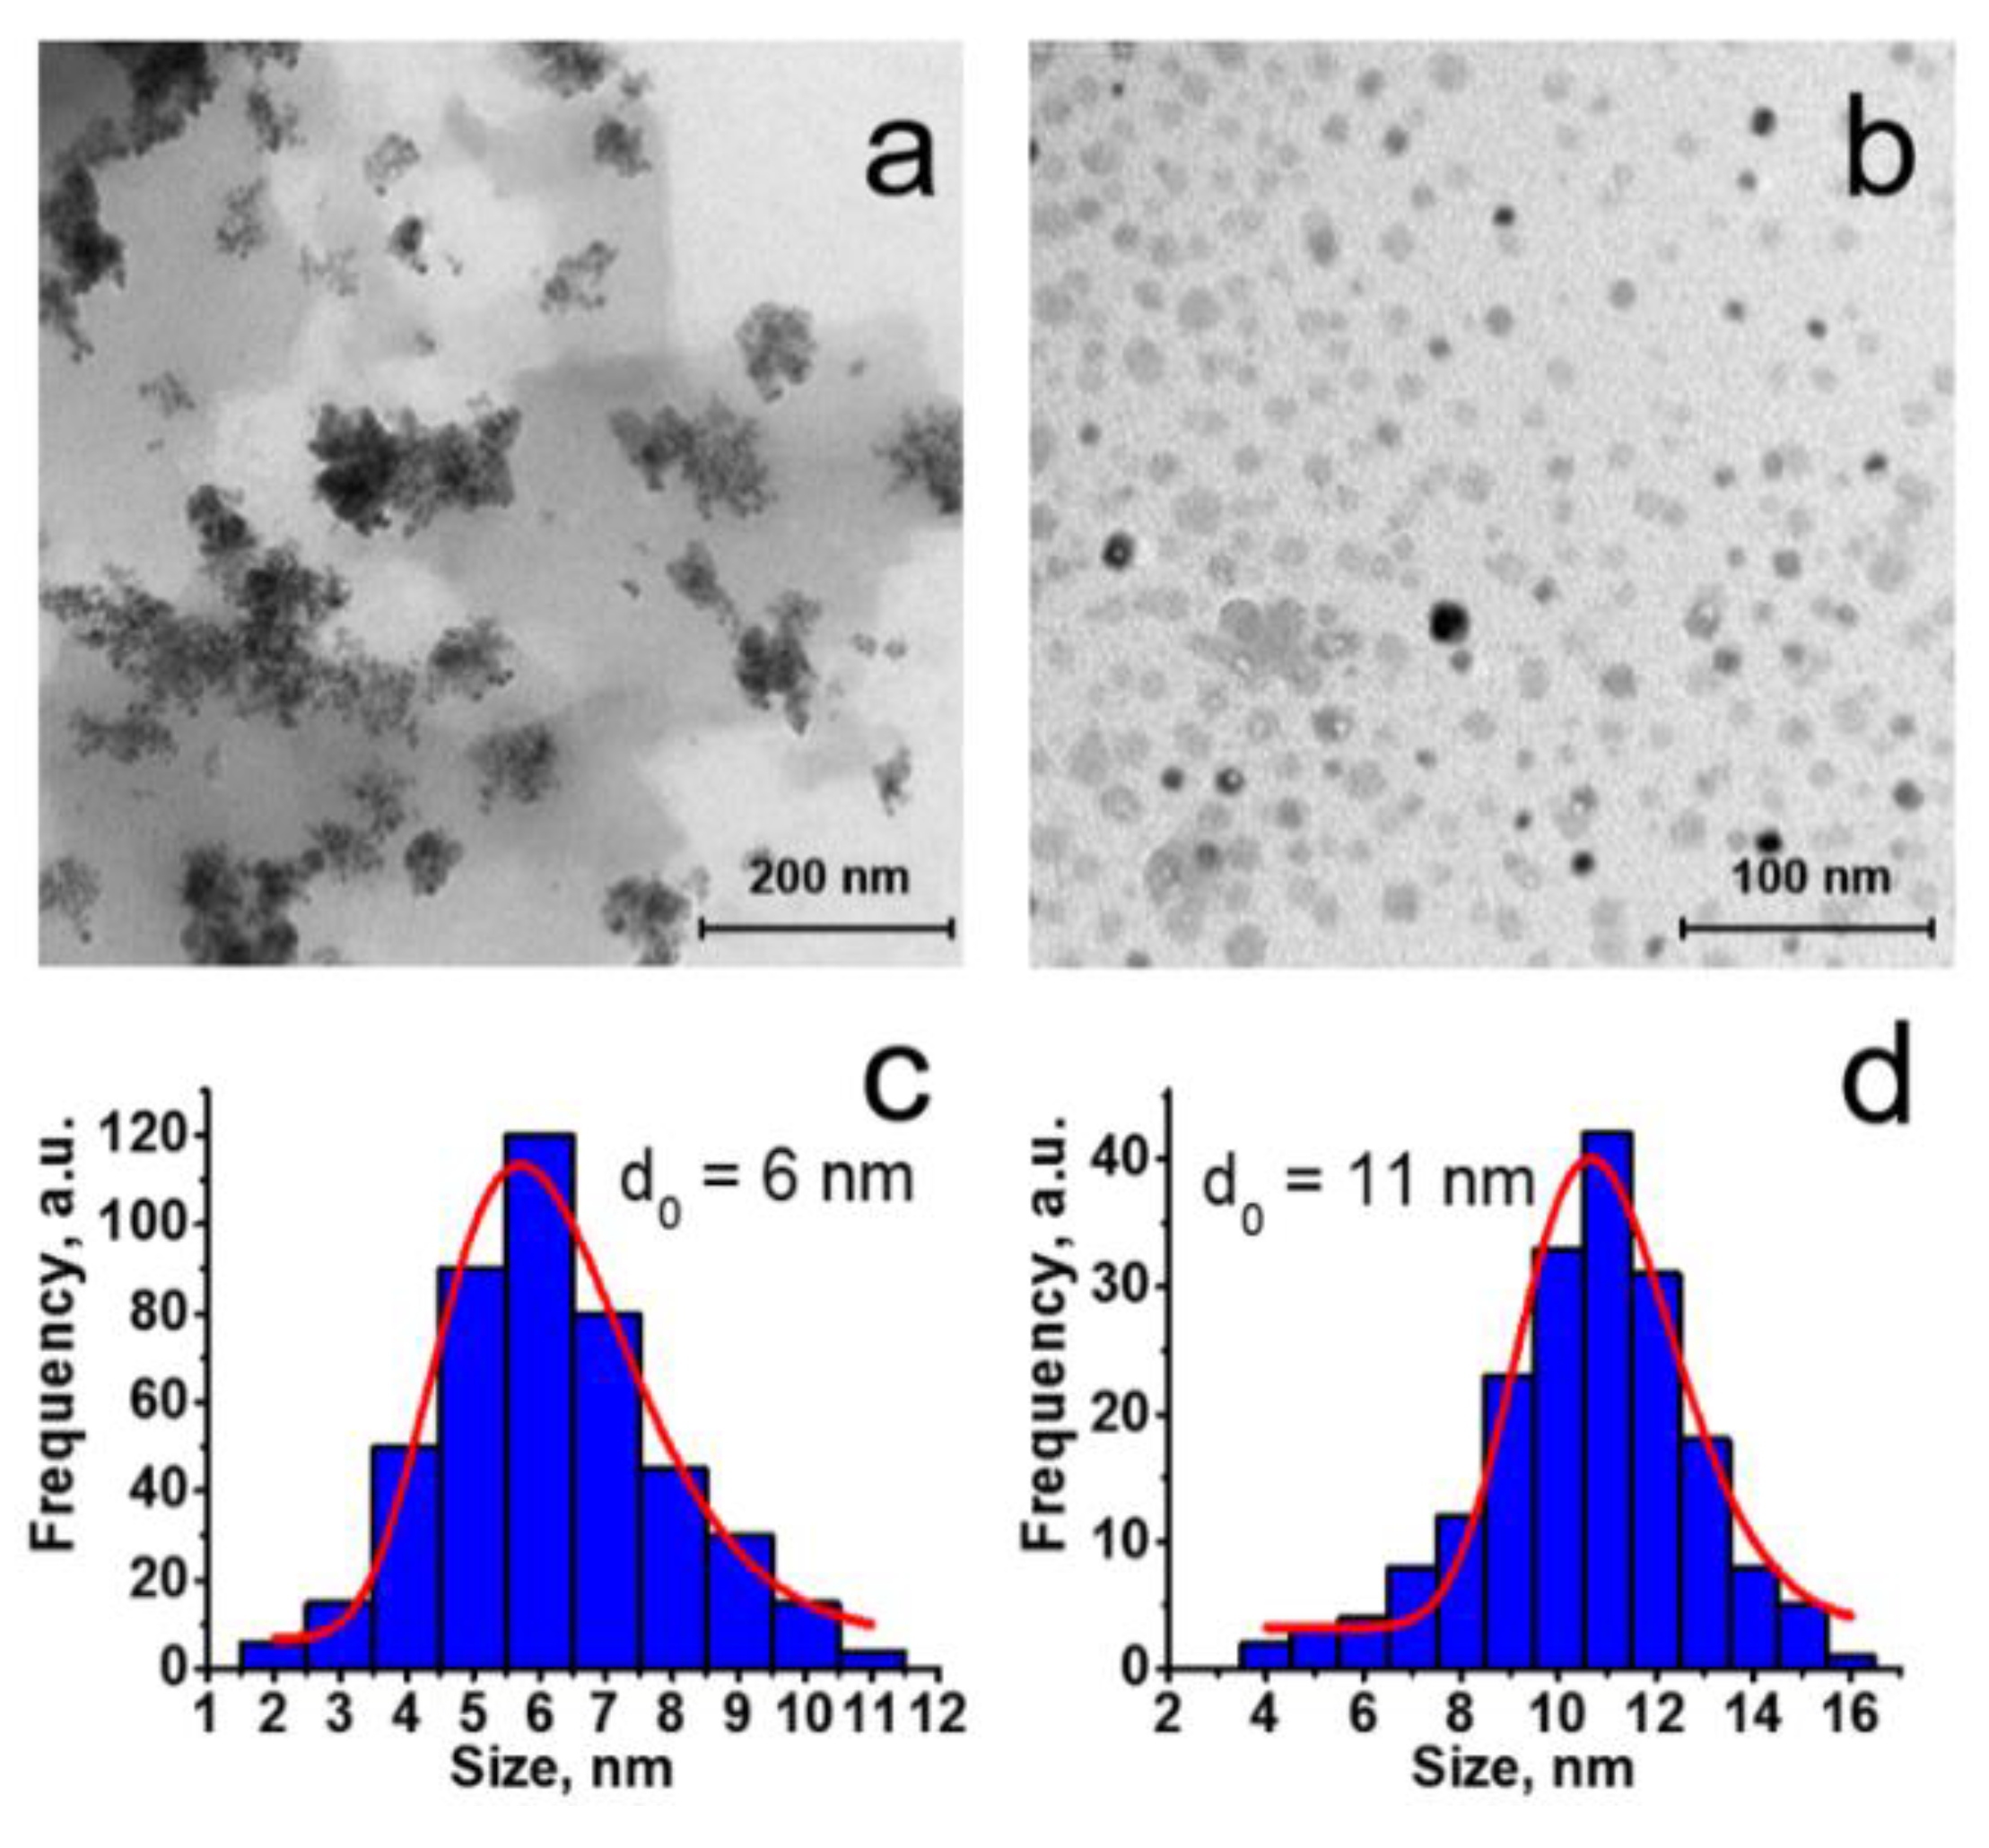
3.1. Synthesis and Characterization of Au2Re6-Q Colloids

The presentation of the results on the assembly of Au2- and Re6-Q-blocks should be preceded by a discussion of the pH-dependent transformations of the latter units. The pH-triggered step-wise protonation/deprotonation of the apical OH/H2O ligands through the equilibrium (1) is followed by the changing of the cluster’s charge from “–4” in highly alkaline conditions, coming through “–2” in weak alkaline to “0” in neutral with further recharging up to “+2” in acidic solutions [36]. The aforesaid charge transformation affects the water solubility of the cluster forms. In particular, the lowest water solubility is observed for the neutral [{Re6Q8}(H2O)4(OH)2] form. The nature of Q (Q = S2− or Se2−) is another factor in the shifting of the equilibrium (1) [36]. In particular, the equilibrium (1) is shifted to the right in going from Q = S2− to Se2− due to the lower water solubility of [{Re6Se8}(H2O)4(OH)2] in comparison with [{Re6S8}(H2O)4(OH)2] [36].
[{Re6Q8}(OH)6]4 + nH+ ↔ [{Re6Q8}(H2O)n(OH)6−n]n−4
The as-prepared colloids were separated from the supernatants by centrifugation to wash out the residual Re6-Q and Au2. The extraction of both Re6-Q and Au2 components from the aqueous to the colloidal phase is evident from the spectral analysis of the supernatants (Figure S2). The content of the colloids evaluated by the ICP-EOS method is close to 6:2:4 (Re:Au:P), while the deviations from the ratio being 6:1.6:3.4 for Re6-S and 6:2.3:4.0 for Re6-Se can be explained by the admixture of residual components. Nevertheless, herein and further the colloids will be designated as Au2Re6-S and Au2Re6-Se.
The comparative analysis of the IR spectra of the dried Au2Re6-Q colloids, [Au2L2]Cl2, K4[{Re6S8}(OH)6]·8 H2O, and K4[{Re6Se8}(OH)6]·8 H2O indicates the presence of the bands peculiar for the initial [Au2L2]Cl2 complex with broad additional bands of Re6-Q clusters (Figure S3). The dried Au2Re6-Q colloids are manifested in the TEM images (Figure 1a,b) by the aggregates of ultra-small nanoparticles (NPs) with sizes of about 6 and 11 nm, respectively, as is evident from the size distribution histograms (Figure 1c,d), which were made on the basis of the higher-resolution TEM images of the colloids (Figure S4). The aggregation in the dried state is more pronounced for the smaller-sized Au2Re6-S colloids (Figure 1a).
The PXRD patterns of the dried Au2Re6-Q colloids (Figure S4) reveal the amorphous nature of the colloids at Q = S2−, while the crystallinity extent is greater for the colloids at Q = Se2−. This correlates with the nanoparticle size, which is greater in the case of selenide than sulfide counterparts (Figure 1c,d).
The DLS measurements indicate both high polydispersity and the formation of the large-sized aggregates of Au2Re6-Q colloids in the aqueous and buffered solutions (Table 1). The electrokinetic potentials (ζ) of Au2Re6-Q colloids are far above –30 mV, which agrees well with their high aggregation in the aqueous solutions (Table 1). However, the hydrophobic nature of the Au2 block at the interface of the Au2Re6-Q colloidal nanoparticles should be noted as one more reason for their enhanced aggregation.

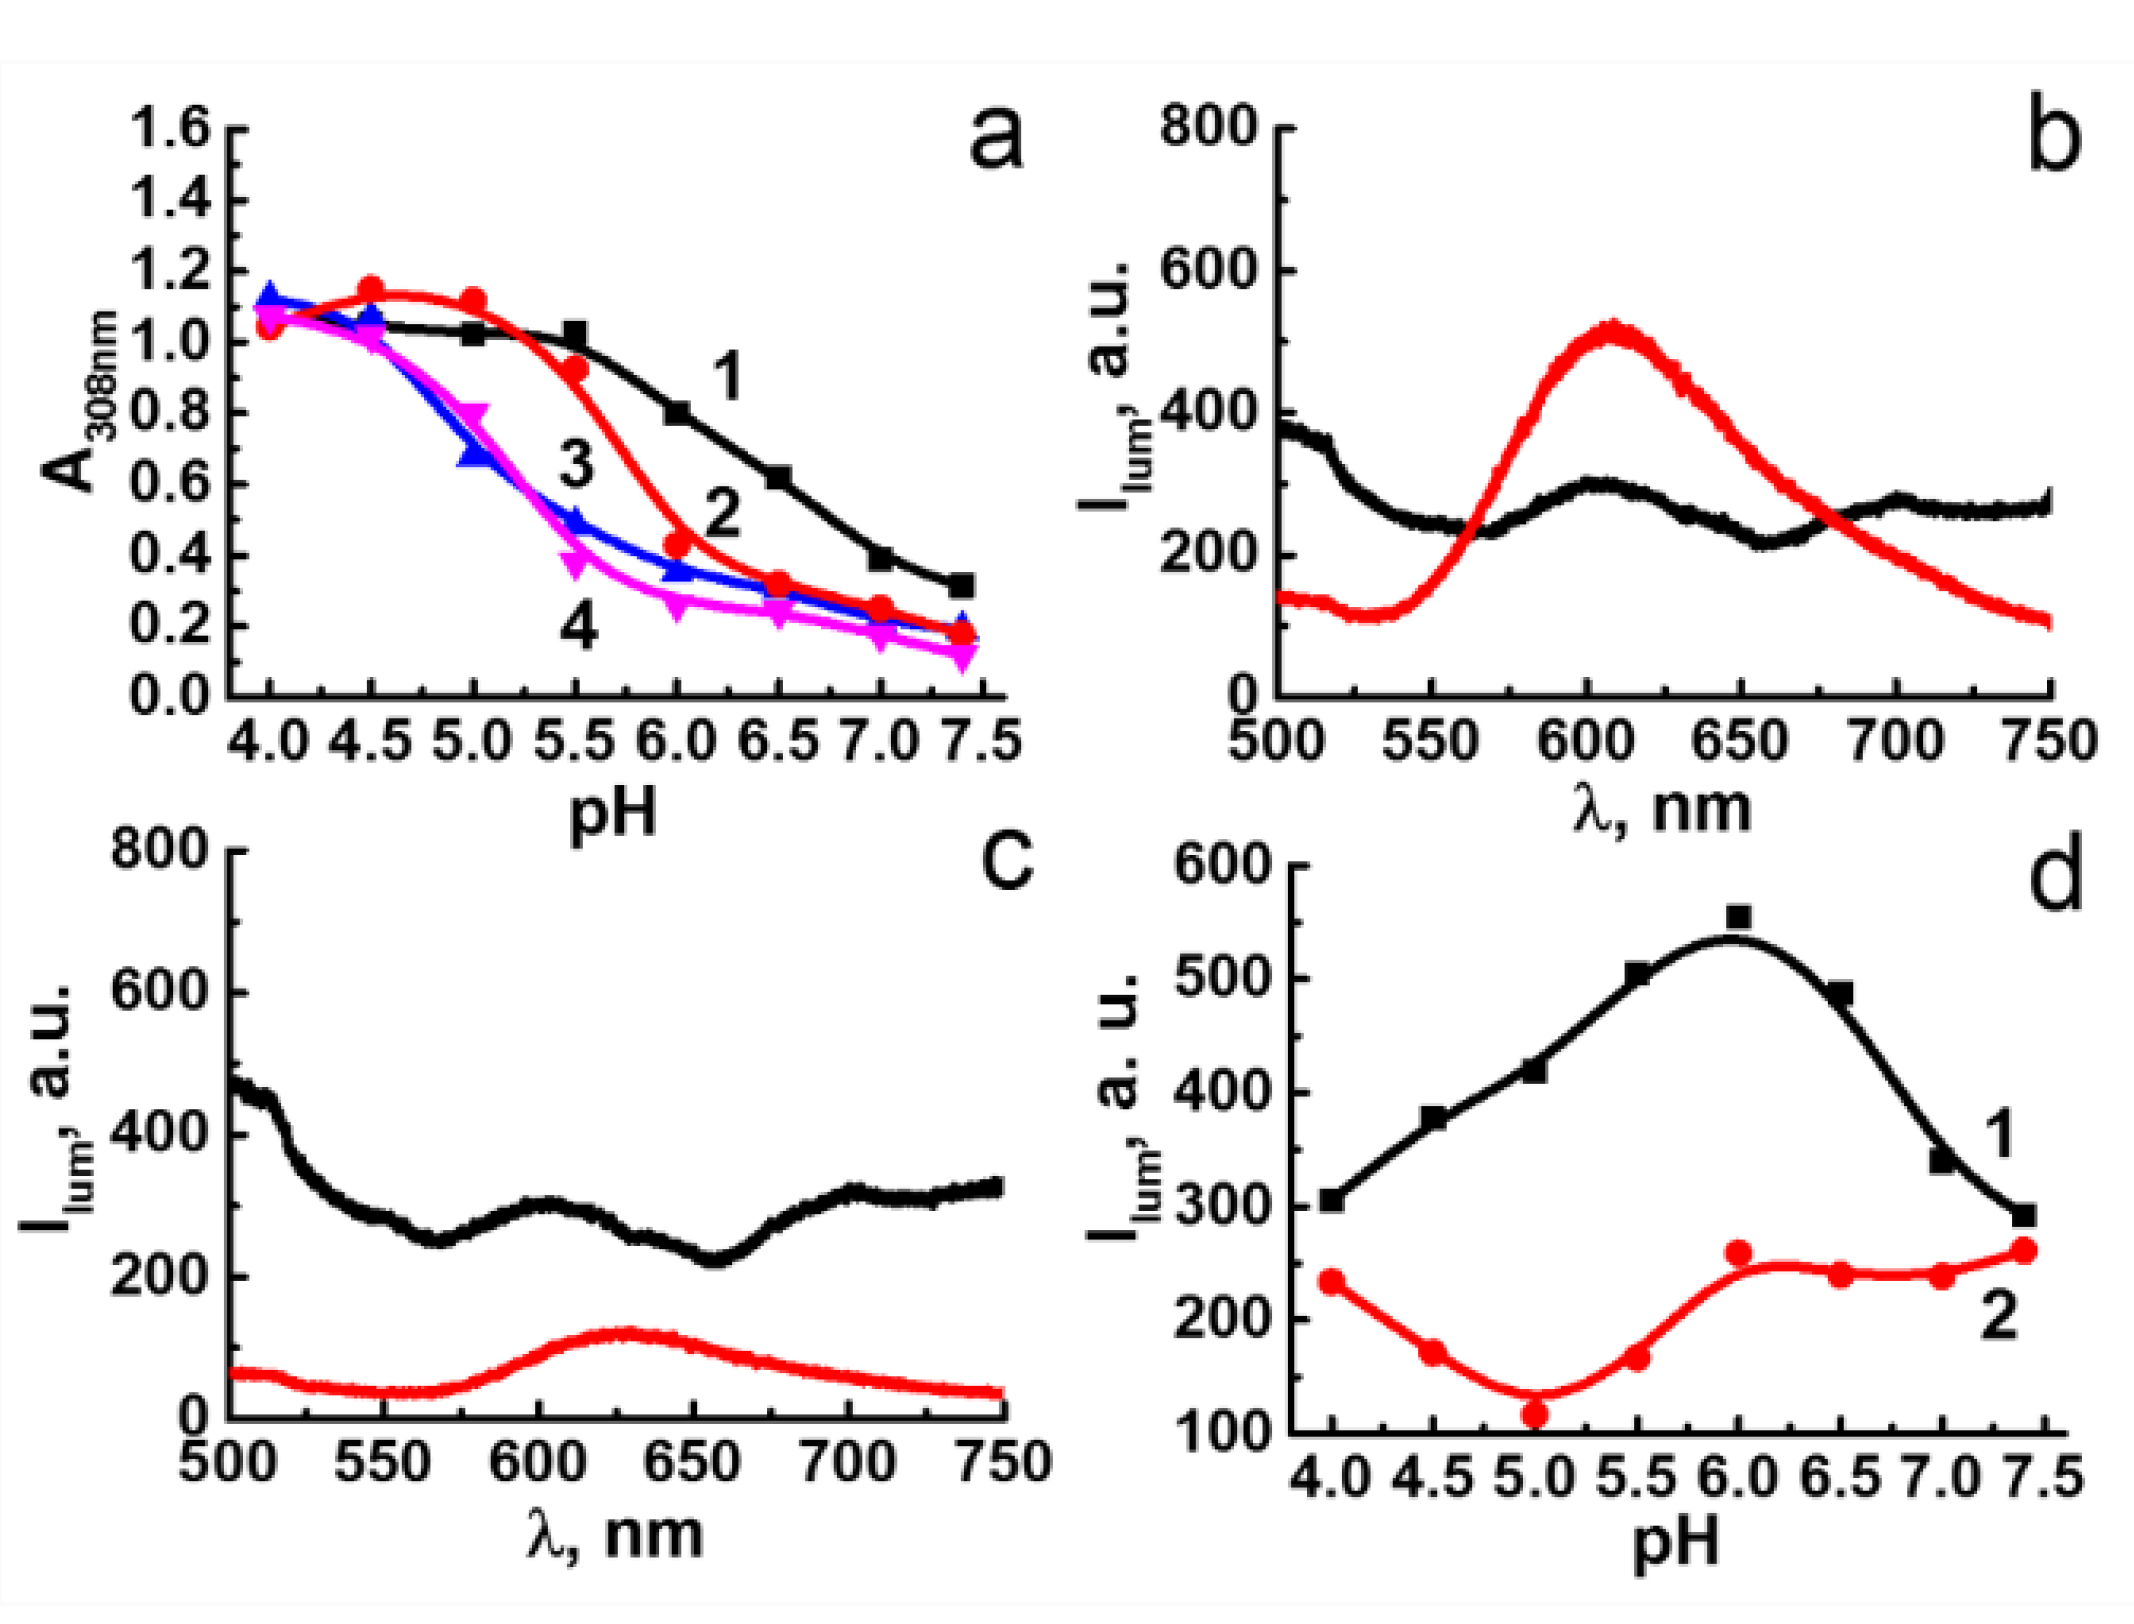
3.2. pH-Dependent Leaching of Au2 and Re6-Q Units

As it was previously reported, the Au2 complex exhibits high cytotoxicity [35], much higher than that reported for the Re6 units [47]. Thus, the extent of the Au2 complex leached from Au2Re6-Q colloids is of great impact on the cytotoxicity of the colloids. The pH-dependent leaching of Au2 from Au2Re6-Q NPs was monitored through the redispersion of the as-synthesized colloids in the buffer solutions at various pHs with the further centrifugation-facilitated phase separation and spectral monitoring of the supernatants (Figure 2). The latter is based on the electronic absorption of Au2 in aqueous solutions (Figure S1) manifested by two bands at 250 and 308 nm, where the former interferes with the electronic absorption spectra of Re6-Q. Thus, the absorbance values (A) at 308 nm of the supernatant solutions evaluated at different pHs (Figure 2a) allow the quantitative monitoring of the leached Au2 complex. The analysis of the A-values plotted vs. pH reveals the disassembly of Au2Re6-S followed by the leaching of Au2 at pH below 7.4, while the disassembly of Au2Re6-Se requires more acidic conditions (pH < 6.0) (Figure 2a). The enhanced disassembly of Au2Re6-S vs. Au2Re6-Se at pH range 6.0–7.4 (Figure 2a) correlates with the higher water solubility of Re6-S vs. Re6-Se [36]. The extent of the leached Au2 complex comes to the same level for Au2Re6-Q at pH below 5.5, which correlates with the evidence by a naked-eye conversion of Au2Re6-Q colloids into the true solutions (Figure S5). The disassembly of the colloids can be represented by the equilibrium (2):
[Au2L2][{Re6Q8}(H2O)2(OH)4] + 2H+ = [{Re6Q8}(H2O)4(OH)2] + [Au2L2]2
The red cluster-centered luminescence of Au2Re6-S is rather low at pHs 6.5–7.4 (Figure 2b,d), while the appearance at pH = 5.5 of the luminescence band peculiar for the “free” Re6-S cluster units (Figure 2b) confirm the disassembly of the colloids. The luminescence intensity of Au2Re6-Se remains unchanged in the wider pH range (Figure 2c,d), being followed by the appearance of the lower intensity luminescence band at pH = 5.0 (Figure 2c). The luminescence intensity (I) of Re6-Se units plotted vs. pH (Figure 2d) follows a similar trend as the leaching of Au2 (Figure 2a). However, unlike the disassembly of Au2Re6-S resulting in the high luminescence of the released cluster form [{Re6S8}(H2O)4(OH)2], the disassembly of Au2Re6-Se results in poor luminescence at pH = 5.0. This agrees well with the previously reported water solubility of [{Re6S8}(H2O)4(OH)2] and the insignificant solubility of [{Re6Se8}(H2O)4(OH)2] [36]. The increase in the luminescence intensity of Au2Re6-S under acidification from pH 7.4 to 6.0 correlates with the increased leaching of the Au2 complex (Figure 2a,d). The luminescence decrease in Re6-S at pH below 5.5 derives from the pH-dependent spectral behavior of the cluster itself [36]. Indeed, the profiles of I plotted vs. pH measured for Au2Re6-Q colloids (Figure 2d) agree with the similar profiles reported for the “free” Re6-Q cluster units at similar pHs [36].

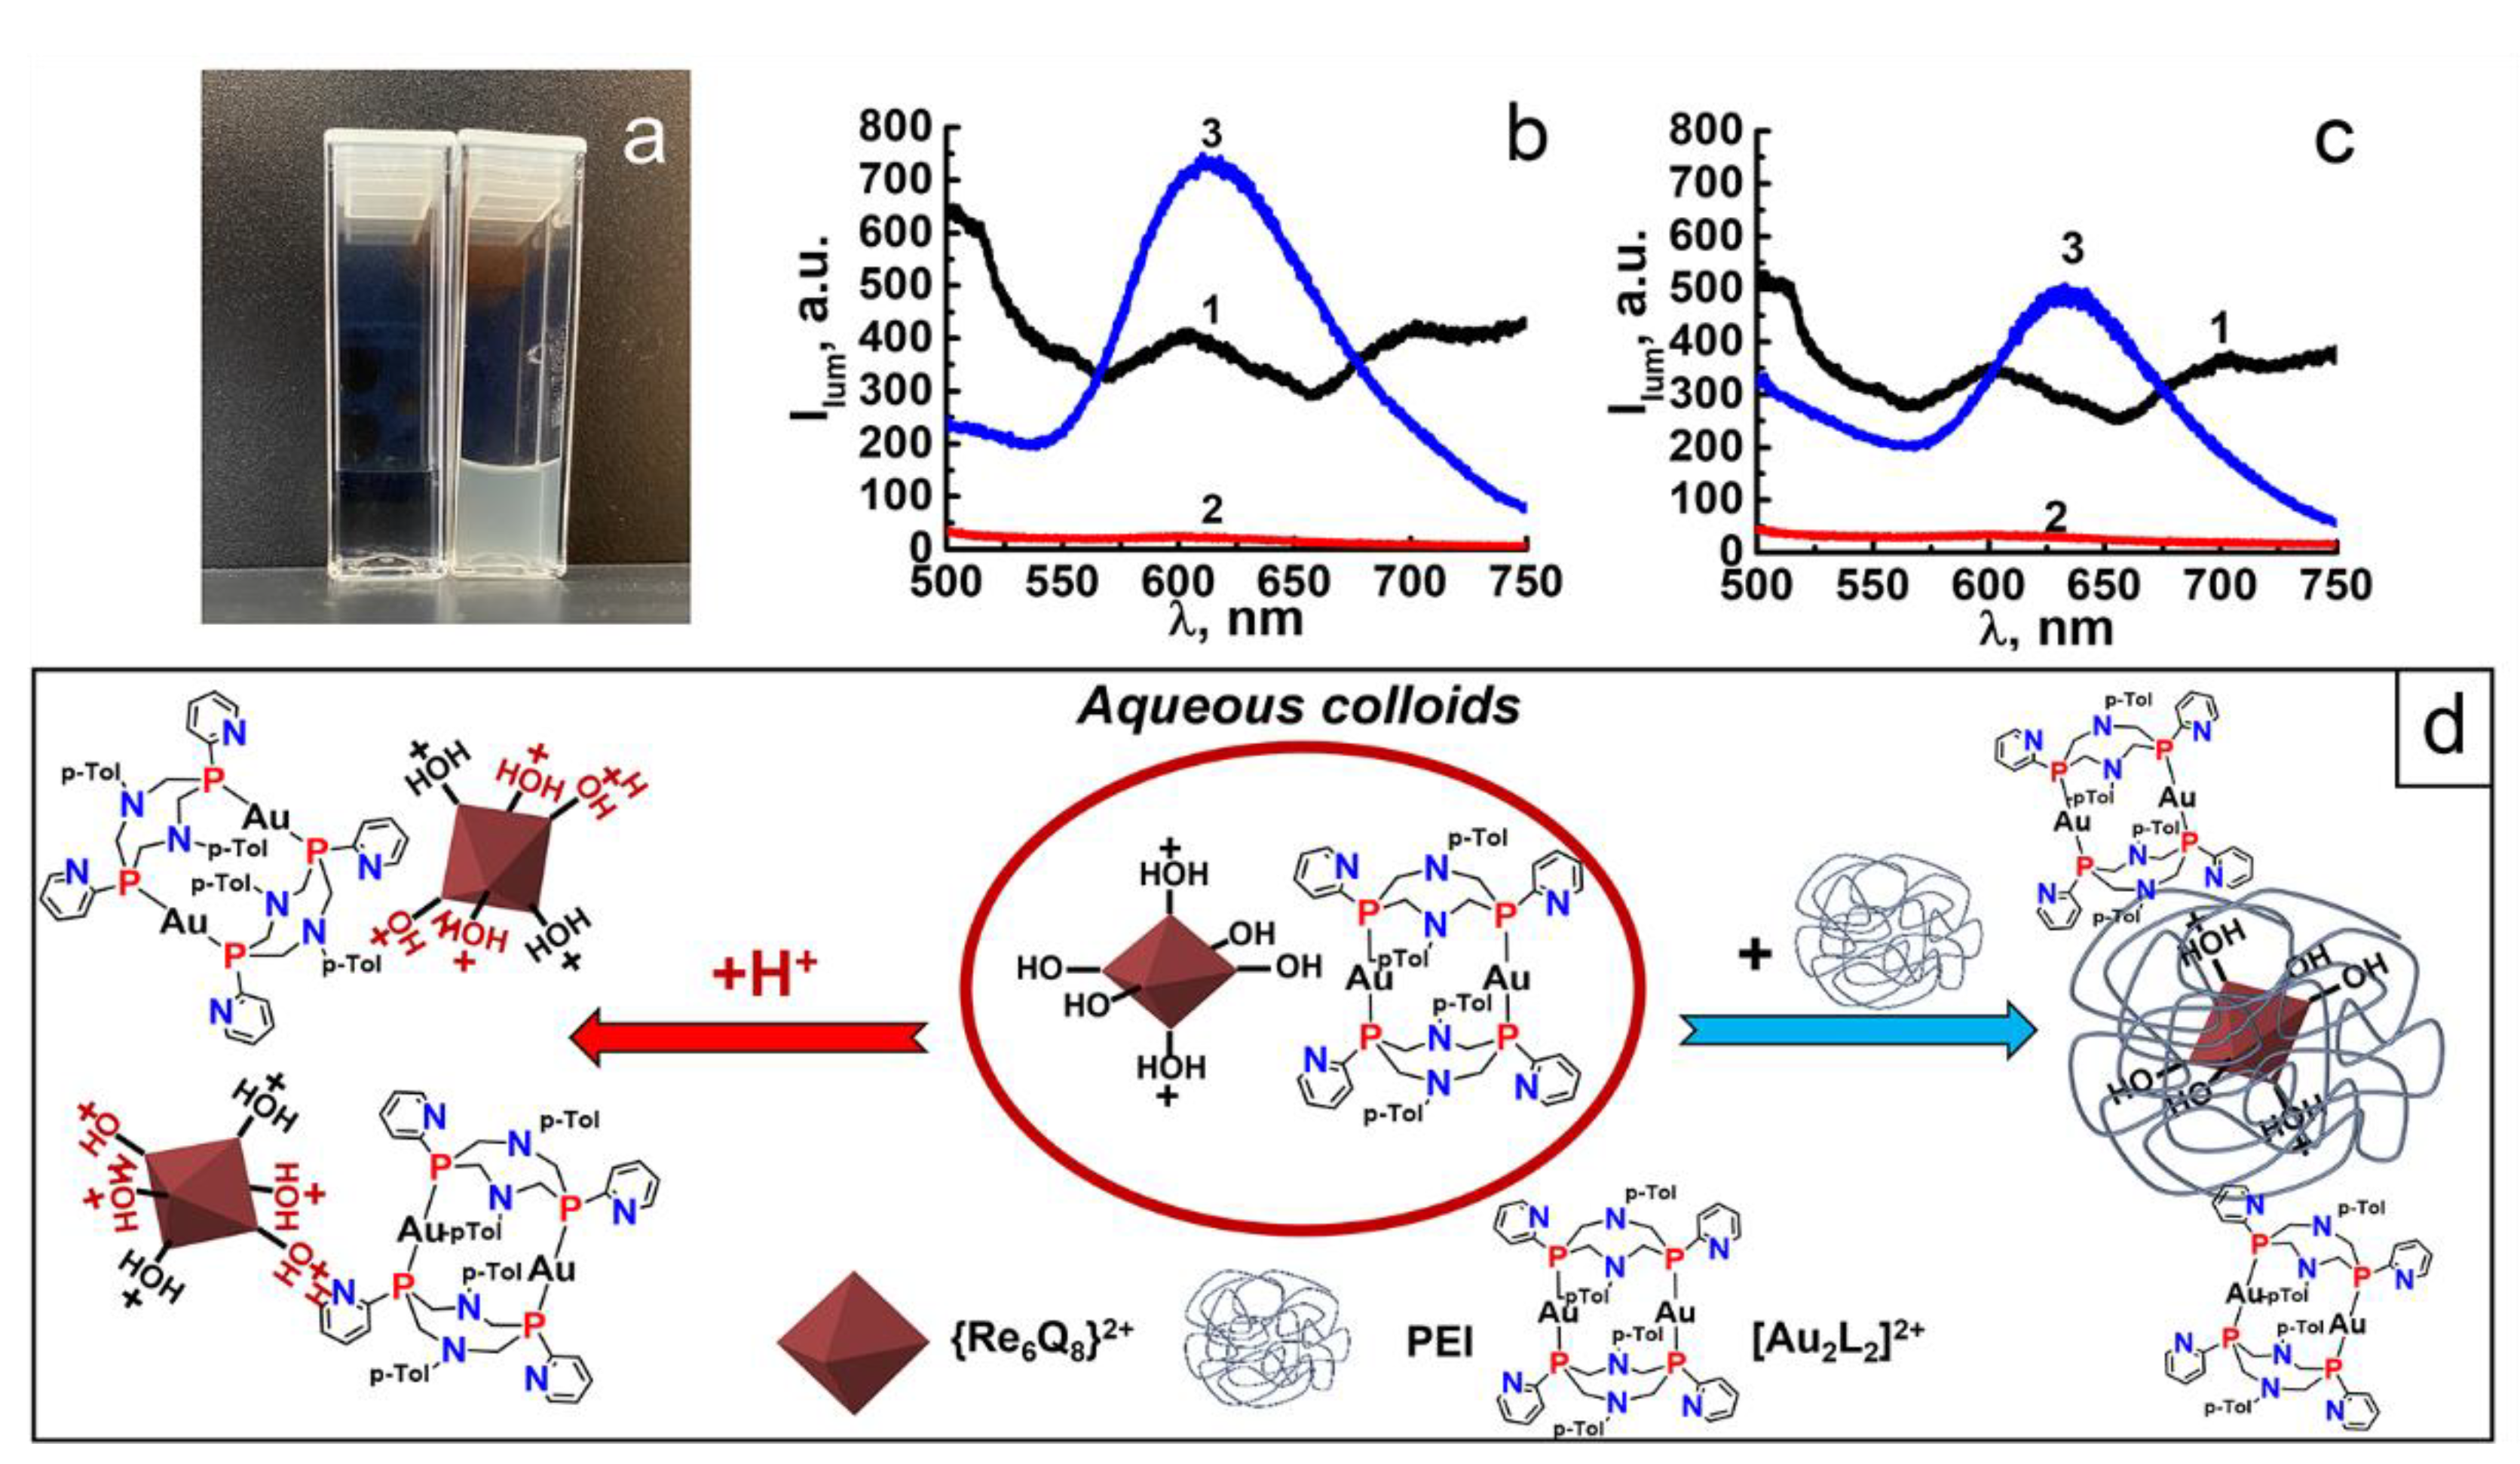
3.3. PEI-Induced Disassembly of Au2Re6-Q Colloids and Their Surface Decoration by LSZ

It is worth considering the surface decoration of NPs as the factor influencing their disassembly. The negative ζ–values of Au2Re6-Q colloids (Table 1) derived from their loading with the Re6-Q units can be a reason for their interaction with polycationic polyelectrolytes, such as polyethylenimine (PEI) [48]. However, the mixing of the preliminary separated through centrifugation colloids with the solution of PEI (1g∙L−1) results in the whole disassembly of Au2Re6-Q colloid species, as illustrated in Figure 3a. The spectral analysis of the supernatants after the phase separation reveals high luminescence intensity (Figure 3b,c) derived from the Re6-Q cluster units wrapped by PEI chains, as schematically demonstrated by Figure 3d [47,48].
The effect of PEI on Au2Re6-Q colloids prompts searching for another mode of surface decoration. The surface-exposed amino groups of LSZ are a prerequisite for its efficient binding with the inorganic or composite NPs, which, in turn, can affect the interfacial destruction of the NPs [49,50]. The role of LSZ on the acidification-induced disassembly of Au2Re6-Q colloids is revealed through the spectrophotometric analysis of the supernatants at various pHs (Figure 2a). In accordance with a previous report [50], the concentration level of LSZ required to bind with the colloidal species is about 1.6 µM. The results indicate that the addition of LSZ (1.6 µM) to Au2Re6-Q colloids affects the pH-dependent leaching of Au2, which becomes insignificant within a pH range of 6.0–7.4 for the colloids (Figure 2a). It is worth assuming that the interfacial deposition of LSZ onto Au2Re6-Q NPs restricts the protonation of the NPs; thus, the disassembly of LSZ-Au2Re6-Q requires greater acidification than their untreated analogs.

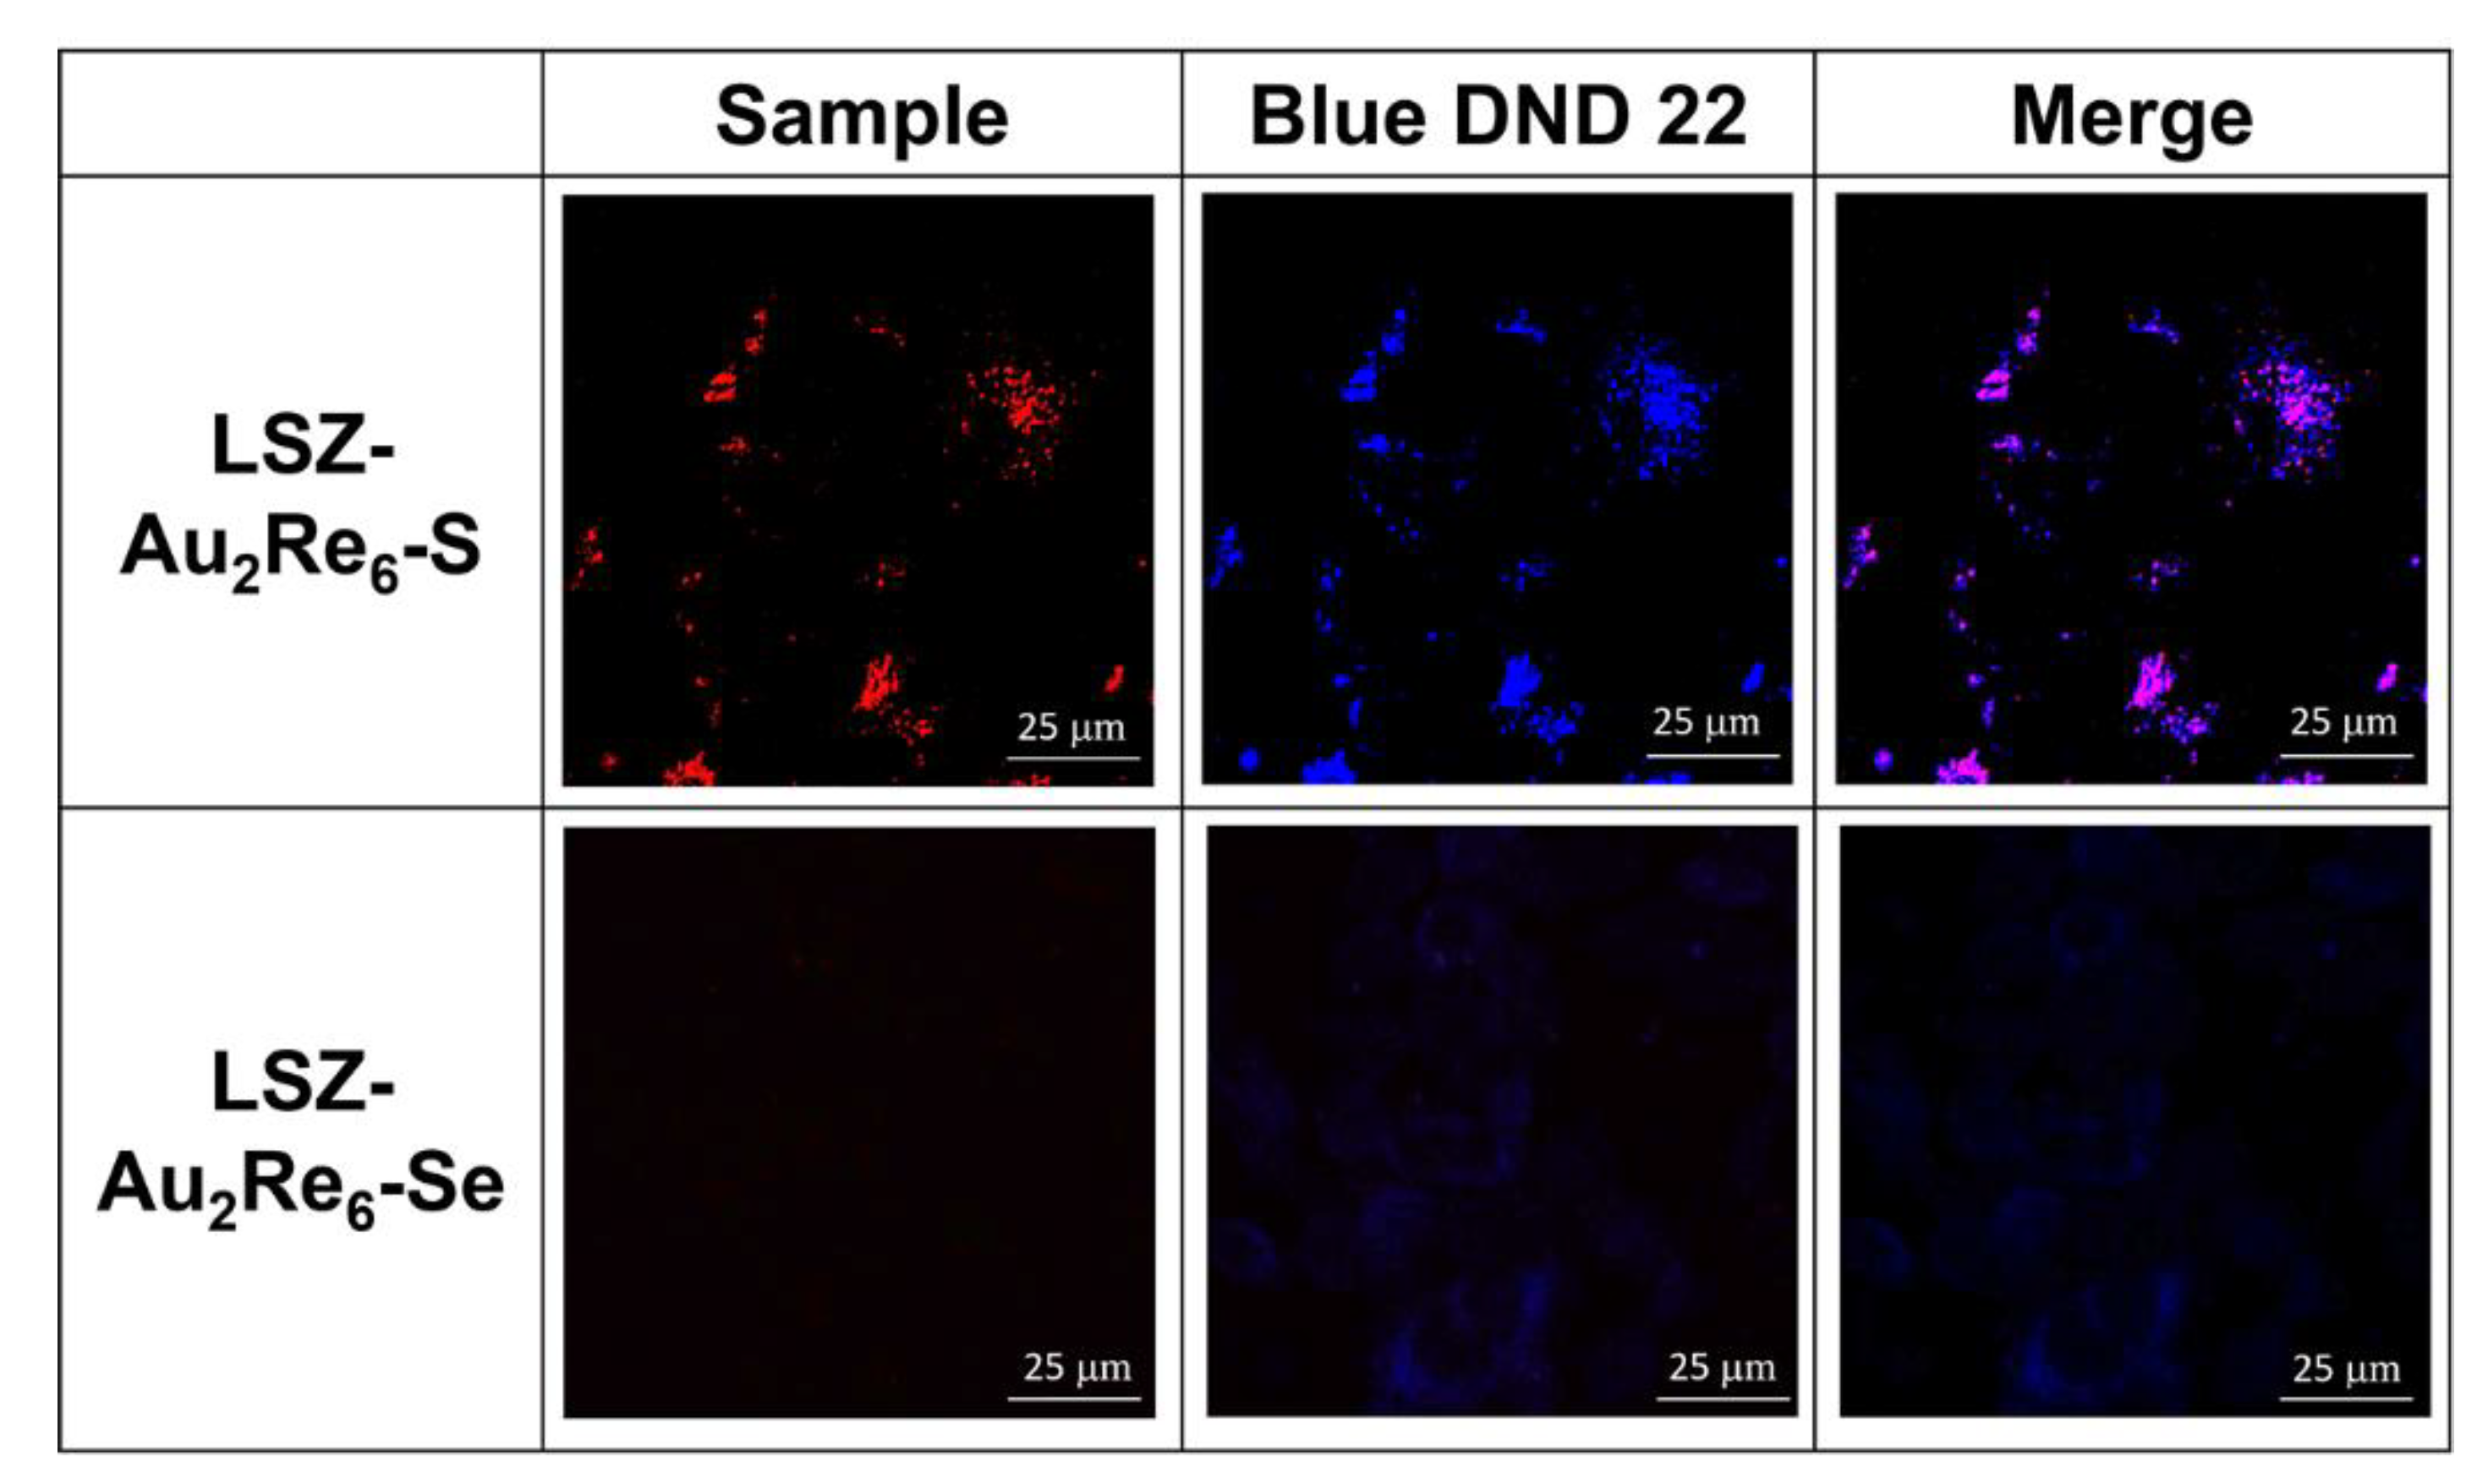
3.4. Cytotoxicity and Cell Internalization of Au2Re6-Q and LSZ-Au2Re6-Q Colloids

The red luminescence of Au2Re6-Q and their LSZ-treated analogs is prerequisite for the visualization of the NP cellular uptake behavior. The imaging experiments were preceded by cytotoxicity measurements. The IC50 values calculated from the cell viability data of M-HeLa and Chang Liver cell lines incubated by Au2Re6-Q and LSZ-Au2Re6-Q (Figure S6) are collected in Table 2.
The presentation of the results on the cell internalization and intracellular localization of LSZ-Au2Re6-Q colloids is worth preceding by notification of the factors such as size, aggregation, surface charge, and protein corona influencing the endocytic pathway of the nanoparticles [51,52,53]. The large aggregates of Au2Re6-Q colloids in the buffered solutions amplify their cell internalization through micropinocytosis rather than receptor-mediated endocytosis [54], although the polydispersity of the aggregates (Table 1) indicates the great diversity in their size. Thus, some of the NPs can be internalized through another endocytic mechanism. However, the flow cytometry measurements at the colloids’ concentration below IC50 do not visualize the cell internalization of Au2Re6-Q and their LSZ-treated analogs, since the fluorescence intensity values measured for the incubated cells differ from the negative control value by no more than 5%, which is within the standard error of the method (Figure S7). This can be explained by the low luminescence intensity of the colloids at these concentration conditions. Nevertheless, the IC50 values represented in Table 2 indicate the rather high cytotoxic effect of the colloids, which argues for their efficient cell internalization. Moreover, the IC50-values of Au2Re6-Q are on the same level or even smaller than those of [Au2L2]Cl2 (Table 2), while their incorporation into the heterometallic colloids must be the reason for the lower cytotoxicity, as previously reported [35]. This argues for the disassembly of the colloids within the cells, which, in turn, requires the lysosomal pathway of the colloids.
Although the cell viability of both cancer (M-HeLa) and normal (Chang Liver) cell lines is suppressed after incubation with Au2Re6-Q and LSZ-Au2Re6-Q colloids (Table 2, Figure S6), the cytotoxic effect of the colloids on the normal cells is detectably decreased after their treatment by LSZ (Table 2). Thus, the LSZ-treated colloids are chosen for the further evaluation of their intracellular pathways.
The specificity of the confocal microscopy technique provides a greater opportunity to visualize the endocytic pathway of low-emitting nanomaterial. The cell internalization and intracellular localization of LSZ-Au2Re6-S colloids in the M-HeLa cells have been successfully visualized through the red luminescence of the Re6-S units by means of the confocal microscopy technique, focusing on their lysosomal localization. The latter has been determined through the staining of the cells incubated with the colloids with LysoTracker Blue DND 22, followed by the quantitative evaluation of the colocalization of the red-emitting NPs and blue emitting LysoTracker within lysosomes by the calculation of Pearson’s correlation coefficient (PCC) [15]. The confocal imaging of the cells incubated with the colloids indicates a high contrasting effect of LSZ-Au2Re6-S colloids, but a poor one in the case of LSZ-Au2Re6-Se colloids (Figure 4). In turn, the high contrasting effect of LSZ-Au2Re6-S allows the evaluation of the PCC value, which is 0.79 ± 0.01 (Figure 4). The high (above 0.5) PCC value of LSZ-Au2Re6-S colloids indicates their lysosomal localization [15], while the latter is a prerequisite for disassembly in the acidic environment followed by the release of the highly luminescent Re6-S units. In this connection, it is worth noting that LSZ-Au2Re6-Q colloids exhibit rather low luminescence at neutral pH, while the acidification to pH = 5.0 results in the different luminescence response of the colloids arising from the release of bright-emitting Re6-S and low-emitting Re6-Se cluster units (Figure 2d). This allows for assuming the lysosomal pathway of both NPs as the reason for the different contrasting effects of LSZ-Au2Re6-S and LSZ-Au2Re6-Se colloids.
As above-mentioned, the dissolution of the nanomaterial within lysosomes is the prerequisite for lysosome membrane rapture [10,11,12,13,14,15,16,17]. In turn, the cargo-induced rapture of lysosomal compartments can be efficiently monitored through the assay based on Acridine Orange (AO) [22]. The lysosomal localization of AO is followed by the red emission, while its release from the lysosomal compartments into the cytoplasm is visualized by the green emission [22]. The poor contrasting effect of LSZ-Au2Re6-Se allows for following the rapture of endo/lysosomal membranes in M-HeLa cell samples through the AO assay, while the red emission of LSZ-Au2Re6-S interferes with the red emission of AO. Figure 5 demonstrates the red spots in the intact cells derived from the localization of AO in the lysosomal compartments, while more blurred green spots derive from the cytosolic distribution of AO. The AO assay reveals the specificity in the localization of the red and green spots in the cells incubated with LSZ-Au2Re6-Se colloids. The specificity manifested by the blurred red spots interfering with the green ones argues for the enhanced rapture of the cell lysosomes, in turn, derived from the disassembly of LSZ-Au2Re6-Se colloids. Most likely, the lysosomal localization of LSZ-Au2Re6-S is also followed by the rapture of the lysosomal membrane, as observed for LSZ-Au2Re6-Se. Thus, the confocal microscopy results provide both direct evidence of the cell internalization followed by the lysosomal pathway for LSZ-Au2Re6-S (Figure 4) and indirect evidence of the lysosomal pathway for LSZ-Au2Re6-Se colloids (Figure 5). This, along with the aforesaid disassembly of LSZ-Au2Re6-Q colloids in acidified solutions, is the reason for the release of toxic [Au2L2]2+ complex into the cell cytoplasm, which correlates with the high cytotoxicity of the colloids (Table 2).
Indeed, the IC50-values of Au2Re6-Q are on the same level or even smaller than those of [Au2L2]Cl2 (Table 2), while their incorporation into the heterometallic colloids must be the reason for the lower cytotoxicity, as previously reported [35]. Thus, the lysosomal pathway of Au2Re6-Q colloids and their LSZ-treated counterparts results from a fusing of late endosomes with lysosomes [55], followed by their disassembly in the acidic lysosomal environment, and the release of the toxic [Au2L2]2+ complex into the cell cytoplasm is responsible for the observed high cytotoxicity of the colloids (Table 2). The above-mentioned difference in the leaching extents of Au2Re6-S and Au2Re6-Se colloids is of insignificant impact on the IC50-values, while the cytotoxicity of the LSZ-treated colloids differs from that of their untreated analogs (Table 2). The IC50-values of LSZ-Au2Re6-Se colloids are detectably higher than those of Au2Re6-Se, which agrees well with the restricted leaching of the Au2 units at pH range 5.0–7.0, while the cytotoxicity of Au2Re6-S colloids remains unchanged in the case of the Chang Liver cell samples and somewhat increases towards the cancer cells (Table 2). This can be explained by the so-called “protein corona” effect [56,57,58], which influences various aspects of the intracellular behavior of nanoparticles.
The selective lysosomal localization of the colloids followed by their pH-induced disassembly results in the lysosomes rapturing, which can be a reason for the apoptotic cell death mechanism [11]. The apoptotic assay indicates that the apoptotic pathway detectably contributes to the M-HeLa cells’ death under their incubation by both Au2Re6-Q colloids and their LSZ-treated counterparts (Figure 6 and Figure S8), while only the necrotic processes are visualized for Au2 complexes [35]. The comparative analysis of the apoptotic assay results reveals the greater contribution of the necrotic processes up to 36% in the case of Au2Re6-Se colloids, although even the aforesaid value is below that reported for the Au2 complex [35]. This differentiates Au2Re6-Q colloids from the Au2 complex, although their IC50 values are close to each other. Thus, to the best of our knowledge, this work for the first time demonstrates the pH-driven release of both luminescent and toxic metal complex blocks from metal complex-based ENs as the application of the smart delivery strategy that has already been documented for the inorganic nanomaterials [10,11,12,13,14,15,16,17].

4. Conclusions

The ability of [{Re6Q8}(OH)6]4− (Q = S2− or Se2−) cluster complexes to undergo the protonation/deprotonation of the apical hydroxo/aqua ligands followed by the change of their charge under acidic or basic environment highlights the clusters as promising units for the pH-dependent assembly with [Au2L2]2+ (Au2) cationic complex resulting in the development of heterometallic Au2Re6-Q colloids. The disassembly of Au2Re6-Q colloids in acidic (pH = 4.5) conditions modeling a lysosomal environment is followed by the release of the red-emitting Re6-Q and the cytotoxic Au2 units. The highly basic microenvironment of polyethylenimine chains triggers the disassembly of Au2Re6-Q colloids, while their interaction with the protein LSZ shifts the pH values required for the disassembly of colloids to more acidic conditions. The high luminescence intensity of Re6-S units revealed under the disassembly of LSZ-Au2Re6-S is a prerequisite for the determination of their high lysosomal localization extent through the colocalization assay. In turn, the low luminescence of Re6-Se units in the same acidified conditions allows us to reveal the rapture of the lysosomal membrane in the cells incubated with LSZ-Au2Re6-Se through the use of the Acridine Orange-based assay. The lysosomal pathway of the colloids followed by their endo/lysosomal escape correlates with the cytotoxicity of LSZ-Au2Re6-Q being on the same level as that of Au2 complexes. However, the significant contribution of the apoptotic pathway differentiates the cytotoxic effect of the colloids from that of the Au2 complex, which predominantly arises from the necrotic processes.

Supplementary Materials

The following supporting information can be downloaded at: https://0-www-mdpi-com.brum.beds.ac.uk/article/10.3390/nano12183229/s1, Figure S1: (a) UV-Vis spectra of Au2 complex at 4 (black), 7 (red) and 10.1 (blue) pH values. C= 0.01 mM. (b) UV-Vis spectra of Re6-S (black) and Re6-Se (red) clusters at 8.8 and 10.1 pH values, respectively. C= 0.03 mM; Figure S2: (a, b) Luminescence of aqueous solutions of Re6-S (a) and Re6-Se (b) clusters (C=22 μM, blue lines), Au2Re6-S (a) and Au2Re6-Se (b) colloids (C=22 μM, black lines) and supernatants (red lines); Figure S3: Infrared spectra of initial K4[{Re6S8}(OH)6] (black) and K4[{Re6Se8}(OH)6] (magenta) clusters, Au2 complex (red) and dried Au2Re6-S (blue) and Au2Re6-Se (green) colloids. The spectra of dried Au2Re6-S / Au2Re6-Se colloids represent the sum of spectra of initial K4[{Re6S8}(OH)6]/K4[{Re6Se8}(OH)6] clusters (1637, 904, 845 and 475 cm−1) and Au2 complex (1612, 1572, 1514, 1193, 1040 cm−1). The higher intensity of band at ~1040 cm−1 in the spectrum of Au2Re6-S (blue) in comparison with initial Au2 complex (red) is related to the presence of residual amounts of TRIS buffer used in the synthesis; Figure S4: (a) TEM image of Au2Re6-S with a magnification of 120K: a fragment of the analyzed area for plotting the particle size distribution. (b) Experimental diffraction patterns from Au2Re6-S (1) and Au2Re6-Se (2). The curves are shifted relative to each other along the intensity axis for visual clarity; Figure S5: Photos of pH-dependent dissolution of Au2Re6-S (left) and Au2Re6-Se (right) colloids. Ccolloids= 22 μM, Cbuffers= 0.01 M; Figure S6: Viability of M-HeLa (a) and Chang Liver (b) cells incubated with different concentrations of Au2Re6-S (black lines), LSZ-Au2Re6-S (red lines), Au2Re6-Se (blue lines), LSZ-Au2Re6-Se (magenta lines). (c) Viability of M-HeLa (black line) and Chang Liver (red line) cells incubated with different concentrations of LSZ. The error bars represent standard deviation of the mean values; Figure S7: (a) Cellular uptake study in M-HeLa cells: control (white), Au2Re6-S (red) and LSZ-Au2Re6-S (blue) colloids. (b) Cellular uptake study in M-HeLa cells: control (white), Au2Re6-Se (red) and LSZ-Au2Re6-Se (blue) colloids. Ccolloids = 1 μM; Figure S8: Flow cytometry analysis of M-HeLa cells treated with different concentrations of Au2Re6-Se (1) and LSZ-Au2Re6-Se (2) after Annexin V and PI staining. The values are presented as the mean ± SD (n = 3): * p < 0.01 vs. the control group. L—living cells; D—dead cells; E. a.—early apoptotic cells; L. a.—late apoptotic cells.

Author Contributions

Conceptualization, A.M.; formal analysis, B.F., K.K., I.N., A.G., A.V., T.G., G.S., D.S. and K.P.; investigation, B.F., I.S., K.K., I.N., A.G., A.V. and T.G.; methodology, B.F.; project administration, A.K.; resources, I.D., I.S., I.K., K.B., E.M. and A.K.; supervision, A.M.; validation, K.P., E.M. and A.K.; visualization, B.F.; writing—original draft, B.F. and A.M.; writing—review and editing, B.F., K.B. and A.M. All authors have read and agreed to the published version of the manuscript.

Funding

This research was funded by the RUSSIAN SCIENCE FOUNDATION, grant No. 22-13-00147.

Data Availability Statement

Not applicable.

Acknowledgments

The authors gratefully acknowledge CSF-SAC FRC KSC RAS for providing necessary facilities to carry out this work.

Conflicts of Interest

The authors declare no conflict of interest.

References

  1. Gwili, N.; Jones, S.J.; Amri, W.A.; Carr, I.M.; Harris, S.; Hogan, B.V.; Hughes, W.E.; Kim, B.; Langlands, F.E.; Millican-Slater, R.A.; et al. Transcriptome profiles of stem-like cells from primary breast cancers allow identification of ITGA7 as a predictive marker of chemotherapy response. Br. J. Cancer 2021, 125, 983–993. [Google Scholar] [CrossRef]
  2. Hutchinson, S.A.; Websdale, A.; Cioccoloni, G.; Røberg-Larsen, H.; Lianto, P.; Kim, B.; Rose, A.; Soteriou, C.; Pramanik, A.; Wastall, L.M.; et al. Liver x receptor alpha drives chemoresistance in response to side-chain hydroxycholesterols in triple negative breast cancer. Oncogene 2021, 40, 2872–2883. [Google Scholar] [CrossRef]
  3. Artzi, N. Trojan siRNA Opens the Door to Chemotherapy. Sci. Transl. Med. 2013, 5, ec186–ec211. [Google Scholar] [CrossRef]
  4. Teng, L.; Song, G.; Liu, Y.; Han, X.; Li, Z.; Wang, Y.; Huan, S.; Zhang, X.-B.; Tan, W. Nitric oxide-activated “Dual-Key–One-Lock” nanoprobe for in vivo molecular imaging and high-specificity cancer therapy. J. Am. Chem. Soc. 2019, 141, 13572–13581. [Google Scholar] [CrossRef]
  5. Degors, I.M.; Wang, C.; Rehman, Z.U.; Zuhorn, I.S. Carriers break barriers in drug delivery: Endocytosis and endosomal escape of gene delivery vectors. Acc. Chem. Res. 2019, 52, 1750–1760. [Google Scholar] [CrossRef]
  6. Saftig, P.; Sandhoff, K. Killing from the inside. Nature 2013, 502, 312–313. [Google Scholar] [CrossRef]
  7. Hu, Y.; Litwin, T.; Nagaraja, A.R.; Kwong, B.; Katz, J.; Watson, N.; Irvine, D.J. Cytosolic delivery of membrane-impermeable molecules in dendritic cells using pH-responsive core− shell nanoparticles. Nano Lett. 2007, 7, 3056–3064. [Google Scholar] [CrossRef]
  8. Siek, M.; Kandere-Grzybowska, K.; Grzybowski, B.A. Mixed-Charge, pH-Responsive Nanoparticles for Selective Interactions with Cells, Organelles, and Bacteria. Acc. Mater. Res. 2020, 1, 188–200. [Google Scholar] [CrossRef]
  9. Manshian, B.B.; Soenen, S.J.; Brown, A.; Hondow, N.; Wills, J.; Jenkins, G.J.; Doak, S.H. Genotoxic capacity of Cd/Se semiconductor quantum dots with differing surface chemistries. Mutagenesis 2016, 31, 97–106. [Google Scholar] [CrossRef]
  10. Hu, Y.; Zhang, H.R.; Dong, L.; Xu, M.R.; Zhang, L.; Ding, W.P.; Zhang, J.-Q.; Lin, J.; Zhang, Y.-J.; Qiu, B.-S.; et al. Enhancing tumor chemotherapy and overcoming drug resistance through autophagy-mediated intracellular dissolution of zinc oxide nanoparticles. Nanoscale 2019, 11, 11789–11807. [Google Scholar] [CrossRef]
  11. Li, Y.; Wang, W.X. Uptake, intracellular dissolution, and cytotoxicity of silver nanowires in cell models. Chemosphere 2021, 281, 130762. [Google Scholar] [CrossRef]
  12. Abdelkhaliq, A.; van der Zande, M.; Undas, A.K.; Peters, R.J.; Bouwmeester, H. Impact of in vitro digestion on gastrointestinal fate and uptake of silver nanoparticles with different surface modifications. Nanotoxicology 2020, 14, 111–126. [Google Scholar] [CrossRef]
  13. De Jong, W.H.; De Rijk, E.; Bonetto, A.; Wohlleben, W.; Stone, V.; Brunelli, A.; Badetti, E.; Marcomini, A.; Gosens, I.; Cassee, F.R. Toxicity of copper oxide and basic copper carbonate nanoparticles after short-term oral exposure in rats. Nanotoxicology 2019, 13, 50–72. [Google Scholar] [CrossRef]
  14. Latvala, S.; Hedberg, J.; Di Bucchianico, S.; Möller, L.; Odnevall Wallinder, I.; Elihn, K.; Karlsson, H.L. Nickel release, ROS generation and toxicity of Ni and NiO micro-and nanoparticles. PLoS ONE 2016, 11, e0159684. [Google Scholar] [CrossRef]
  15. Zhu, J.; He, K.; Dai, Z.; Gong, L.; Zhou, T.; Liang, H.; Liu, J. Self-assembly of luminescent gold nanoparticles with sensitive pH-stimulated structure transformation and emission response toward lysosome escape and intracellular imaging. Anal. Chem. 2019, 91, 8237–8243. [Google Scholar] [CrossRef]
  16. Naatz, H.; Manshian, B.B.; Rios Luci, C.; Tsikourkitoudi, V.; Deligiannakis, Y.; Birkenstock, J.; Pokhrel, S.; Madler, L.; Soenen, S.S. Model-based nanoengineered pharmacokinetics of iron-doped copper oxide for nanomedical applications. Angew. Chem. Int. Ed. 2020, 59, 1828–1836. [Google Scholar] [CrossRef]
  17. Sousa, C.A.; Soares, H.M.; Soares, E.V. Nickel oxide (NiO) nanoparticles disturb physiology and induce cell death in the yeast Saccharomyces cerevisiae. Appl. Microbiol. Biotechnol. 2018, 102, 2827–2838. [Google Scholar] [CrossRef]
  18. Cai, X.; Liu, X.; Jiang, J.; Gao, M.; Wang, W.; Zheng, H.; Xu, S.; Li, R. Molecular mechanisms, characterization methods, and utilities of nanoparticle biotransformation in nanosafety assessments. Small 2020, 16, 1907663. [Google Scholar] [CrossRef]
  19. Xiong, Y.; Xiao, C.; Li, Z.; Yang, X. Engineering nanomedicine for glutathione depletion-augmented cancer therapy. Chem. Soc. Rev. 2021, 50, 6013–6041. [Google Scholar] [CrossRef]
  20. Zhang, K.; Meng, X.; Yang, Z.; Dong, H.; Zhang, X. Enhanced cancer therapy by hypoxia-responsive copper metal-organic frameworks nanosystem. Biomaterials 2020, 258, 120278. [Google Scholar] [CrossRef]
  21. Zhao, R.M.; Guo, Y.; Yang, H.Z.; Zhang, J.; Yu, X.Q. Zn-Promoted gene transfection efficiency for non-viral vectors: A mechanism study. New J. Chem. 2021, 45, 13549–13557. [Google Scholar] [CrossRef]
  22. Lin, G.; Zhang, Y.; Zhang, L.; Wang, J.; Tian, Y.; Cai, W.; Tang, S.; Chu, C.; Zhou, J.; Mi, P.; et al. Metal-organic frameworks nanoswitch: Toward photo-controllable endo/lysosomal rupture and release for enhanced cancer RNA interference. Nano Res. 2020, 13, 238–245. [Google Scholar] [CrossRef]
  23. Tsai, J.L.L.; Zou, T.; Liu, J.; Chen, T.; Chan, A.O.Y.; Yang, C.; Lok, C.N.; Che, C.M. Luminescent platinum (II) complexes with self-assembly and anti-cancer properties: Hydrogel, pH dependent emission color and sustained-release properties under physiological conditions. Chem. Sci. 2015, 6, 3823–3830. [Google Scholar] [CrossRef]
  24. Pramanik, A.; Xu, Z.; Shamsuddin, S.H.; Khaled, Y.S.; Ingram, N.; Maisey, T.; Tomlinson, D.; Coletta, P.L.; Jayne, D.; Hughes, T.A.; et al. Affimer Tagged Cubosomes: Targeting of Carcinoembryonic Antigen Expressing Colorectal Cancer Cells Using In Vitro and In Vivo Models. ACS Appl. Mater. Interfaces 2022, 14, 11078–11091. [Google Scholar] [CrossRef]
  25. Zhang, Y.; Zhao, R.; Liu, J.; Kong, H.; Zhang, K.; Zhang, Y.N.; Kong, X.; Zhang, Q.; Zhao, Y. Hierarchical nano-to-molecular disassembly of boron dipyrromethene nanoparticles for enhanced tumor penetration and activatable photodynamic therapy. Biomaterials 2021, 275, 120945. [Google Scholar] [CrossRef]
  26. Kongkatigumjorn, N.; Smith, S.A.; Chen, M.; Fang, K.; Yang, S.; Gillies, E.R.; Johnston, A.P.R.; Such, G.K. Controlling endosomal escape using pH-responsive nanoparticles with tunable disassembly. ACS Appl. Nano Mater. 2018, 1, 3164–3173. [Google Scholar] [CrossRef]
  27. Zhang, M.; Saint-Germain, C.; He, G.; Sun, R.W.Y. Drug delivery systems for anti-cancer active complexes of some coinage metals. Curr. Med. Chem. 2018, 25, 493–505. [Google Scholar] [CrossRef]
  28. Gou, Y.; Huang, G.; Li, J.; Yang, F.; Liang, H. Versatile delivery systems for non-platinum metal-based anticancer therapeutic agents. Coord. Chem. Rev. 2021, 441, 213975. [Google Scholar] [CrossRef]
  29. Rousselle, B.; Bouyer, F.; Bayardon, J.; Laly, M.; Ghiringhelli, F.; Rousselin, Y.; Bodio, E.; Malacea-Kabbara, R. Development of a novel highly anti-proliferative family of gold complexes: Au (i)-phosphonium-phosphines. Dalton Trans. 2021, 50, 4880–4889. [Google Scholar] [CrossRef]
  30. Rouco, L.; Sánchez-González, Á.; Alvariño, R.; Alfonso, A.; Vázquez-López, E.M.; García-Martínez, E.; Maneiro, M. Combined effect of caspase-dependent and caspase-independent apoptosis in the anticancer activity of gold complexes with phosphine and benzimidazole derivatives. Pharmaceuticals 2020, 14, 10. [Google Scholar] [CrossRef]
  31. Kim, J.H.; Reeder, E.; Parkin, S.; Awuah, S.G. Gold (I/III)-phosphine complexes as potent antiproliferative agents. Sci. Rep. 2019, 9, 1–18. [Google Scholar] [CrossRef]
  32. Quero, J.; Ruighi, F.; Osada, J.; Gimeno, M.C.; Cerrada, E.; Rodriguez-Yoldi, M.J. Gold (I) Complexes Bearing Alkylated 1, 3, 5-Triaza-7-phosphaadamantane Ligands as Thermoresponsive Anticancer Agents in Human Colon Cells. Biomedicines 2021, 9, 1848. [Google Scholar] [CrossRef]
  33. Mirzadeh, N.; Reddy, T.S.; Bhargava, S.K. Advances in diphosphine ligand-containing gold complexes as anticancer agents. Coord. Chem. Rev. 2019, 388, 343–359. [Google Scholar] [CrossRef]
  34. Barnard, P.J.; Berners-Price, S.J. Targeting the mitochondrial cell death pathway with gold compounds. Coord. Chem. Rev. 2007, 251, 1889–1902. [Google Scholar] [CrossRef]
  35. Faizullin, B.A.; Strelnik, I.D.; Dayanova, I.R.; Gerasimova, T.P.; Kholin, K.V.; Nizameev, I.R.; Voloshina, A.D.; Gubaidullin, A.T.; Fedosimova, S.V.; Mikhailov, M.A.; et al. Structure impact on photodynamic therapy and cellular contrasting functions of colloids constructed from dimeric Au (I) complex and hexamolybdenum clusters. Mat. Sci. Eng. C 2021, 128, 112355. [Google Scholar] [CrossRef]
  36. Brylev, K.A.; Mironov, Y.V.; Yarovoi, S.S.; Naumov, N.G.; Fedorov, V.E.; Kim, S.-J.; Kitamura, N.; Kuwahara, Y.; Yamada, K.; Ishizaka, S.; et al. A Family of Octahedral Rhenium Cluster Complexes [Re6Q8(H2O)n(OH)6−n]n−4 (Q = S, Se; n = 0–6): Structural and pH−Dependent Spectroscopic Studies. Inorg. Chem. 2007, 46, 7414–7422. [Google Scholar] [CrossRef]
  37. Elistratova, J.; Strelnik, I.; Brylev, K.; Shestopalov, M.A.; Gerasimova, T.; Babaev, V.; Kholin, K.; Dobrynin, A.; Musina, E.; Katsyuba, S.; et al. Novel Water Soluble Cationic Au (I) Complexes with Cyclic PNNP Ligand as Building Blocks for Heterometallic Supramolecular Assemblies with Anionic Hexarhenium Cluster Units. J. Lumin. 2018, 196, 485–491. [Google Scholar] [CrossRef]
  38. Yarovoi, S.S.; Mironov, Y.V.; Naumov, D.Y.; Gatilov, Y.V.; Kozlova, S.G.; Kim, S.-J.; Fedorov, V.E. Octahedral Hexahydroxo Rhenium Cluster Complexes [Re6Q8(OH)6]4–·(Q = S, Se): Synthesis, Structure, and Properties. Eur. J. Inorg. Chem. 2005, 2005, 3945–3949. [Google Scholar] [CrossRef]
  39. Musina, E.I.; Khrizanforova, V.V.; Strelnik, I.D.; Valitov, M.I.; Spiridonova, Y.S.; Krivolapov, D.B.; Litvinov, I.A.; Kadirov, M.K.; Lönnecke, P.; Hey-Hawkins, E.; et al. New functional cyclic aminomethylphosphine ligands for the construction of catalysts for electrochemical hydrogen transformations. Chem. Eur. J. 2014, 20, 3169–3182. [Google Scholar] [CrossRef]
  40. Delgado, A.V.; Gonzalez-Caballero, F.; Hunter, R.J.; Koopal, L.K.; Lyklema, J. Measurement and interpretation of electrokinetic phenomena. J. Colloid Interface Sci. 2007, 309, 194–224. [Google Scholar] [CrossRef]
  41. DIFFRAC Plus Evaluation Package EVA, Version 11; User’s Manual; Bruker AXS: Karlsruhe, Germany, 2005; 258p.
  42. TOPAS V3: General Profile and Structure Analysis Software for Powder Diffraction Data; Technical Reference; Bruker AXS: Karlsruhe, Germany, 2005; 117p.
  43. Voloshina, A.D.; Sapunova, A.S.; Kulik, N.V.; Belenok, M.G.; Strobykina, I.Y.; Lyubina, A.; Gumerova, S.K.; Kataev, V.E. Antimicrobial and cytotoxic effects of ammonium derivatives of diterpenoids steviol and isosteviol. Bioorg. Med. Chem. 2021, 32, 115974. [Google Scholar] [CrossRef]
  44. Quest Graph™ IC50 Calculator, AAT Bioquest, Inc. Available online: https://www.aatbio.com/tools/ic50-calculator (accessed on 17 May 2022).
  45. Kashapov, R.; Razuvayeva, Y.; Ziganshina, A.; Sapunova, A.; Lyubina, A.; Amerhanova, S.; Kulik, N.; Voloshina, A.; Nizameev, I.; Salnikov, V.; et al. Effect of preorganization and amphiphilicity of calix[4]arene platform on functional properties of viologen derivatives. J. Mol. Liq. 2022, 345, 117801. [Google Scholar] [CrossRef]
  46. Strobykina, I.Y.; Voloshina, A.D.; Andreeva, O.V.; Sapunova, A.S.; Lyubina, A.P.; Amerhanova, S.K.; Belenok, M.G.; Saifina, L.F.; Semenov, V.E.; Kataev, V.E. Synthesis, antimicrobial activity and cytotoxicity of triphenylphosphonium (TPP) conjugates of 1,2,3-triazolyl nucleoside analogues. Bioorg. Chem. 2021, 116, 105328. [Google Scholar] [CrossRef]
  47. Elistratova, J.G.; Brylev, K.A.; Solovieva, A.O.; Pozmogova, T.N.; Mustafina, A.R.; Shestopalova, L.V.; Shestopalov, M.A.; Syakayev, V.V.; Karasik, A.A.; Sinyashin, G. Supporting effect of polyethylenimine on hexarhenium hydroxo cluster complex for cellular imaging applications. J. Photochem. Photobiol. A 2017, 340, 46–52. [Google Scholar] [CrossRef]
  48. Khazieva, A.; Kholin, K.; Nizameev, I.; Brylev, K.; Kashnik, I.; Voloshina, A.; Lyubina, A.; Gubaidullin, A.; Daminova, A.; Petrov, K.; et al. Surface modification of silica nanoparticles by hexarhenium anionic cluster complexes for pH-sensing and staining of cell nuclei. J. Colloid Interface Sci. 2021, 594, 759–769. [Google Scholar] [CrossRef]
  49. Zhang, Y.; Xu, J.; Yang, Y.; Sun, B.; Wang, K.; Zhu, L. Impacts of proteins on dissolution and sulfidation of silver nanowires in an aquatic environment: Importance of surface charges. Environ. Sci. Technol. 2020, 54, 5560–5568. [Google Scholar] [CrossRef]
  50. Elistratova, J.; Faizullin, B.; Strelnik, I.; Gerasimova, T.; Khairullin, R.; Sapunova, A.; Voloshina, A.; Mukhametzyanov, T.; Musina, E.; Karasik, A.; et al. Impact of oppositely charged shell and cores on interaction of core-shell colloids with differently charged proteins as a route for tuning of the colloids cytotoxicity. Colloids Surf. B 2020, 196, 111306. [Google Scholar] [CrossRef]
  51. Ding, L.; Yao, C.; Yin, X.; Li, C.; Huang, Y.; Wu, M.; Wang, B.; Guo, X.; Wang, Y.; Wu, M. Size, shape, and protein corona determine cellular uptake and removal mechanisms of gold nanoparticles. Small 2018, 14, 1801451. [Google Scholar] [CrossRef]
  52. Foroozandeh, P.; Aziz, A.A. Insight into cellular uptake and intracellular trafficking of nanoparticles. Nanoscale Res. Lett. 2018, 13, 1–12. [Google Scholar] [CrossRef]
  53. Donahue, N.D.; Acar, H.; Wilhelm, S. Concepts of nanoparticle cellular uptake, intracellular trafficking, and kinetics in nanomedicine. Adv. Drug Delivery Rev. 2019, 143, 68–96. [Google Scholar] [CrossRef]
  54. Manzanares, D.; Ceña, V. Endocytosis: The nanoparticle and submicron nanocompounds gateway into the cell. Pharmaceutics 2020, 12, 371. [Google Scholar] [CrossRef]
  55. Behzadi, S.; Serpooshan, V.; Tao, W.; Hamaly, M.A.; Alkawareek, M.Y.; Dreaden, E.C.; Brown, D.; Alkilany, A.M.; Farokhzad, O.C.; Mahmoudi, M. Cellular uptake of nanoparticles: Journey inside the cell. Chem. Soc. Rev. 2017, 46, 4218–4244. [Google Scholar] [CrossRef]
  56. Bilardo, R.; Traldi, F.; Vdovchenko, A.; Resmini, M. Influence of surface chemistry and morphology of nanoparticles on protein corona formation. Wiley Interdiscip. Rev. Nanomed. Nanobiotechnol. 2022, 14, e1788. [Google Scholar] [CrossRef]
  57. Xiao, Q.; Zoulikha, M.; Qiu, M.; Teng, C.; Lin, C.; Li, X.; Sallam, M.A.; Xu, Q.; He, W. The effects of protein corona on in vivo fate of nanocarriers. Adv. Drug Delivery Rev. 2022, 186, 114356. [Google Scholar] [CrossRef]
  58. Ferreira, L.F.; Picco, A.S.; Galdino, F.E.; Albuquerque, L.J.C.; Berret, J.F.; Cardoso, M.B. Nanoparticle-Protein Interaction: Demystifying the Correlation Between Protein Corona and Aggregation Phenomena. ACS Appl. Mater. Interfaces 2022, 14, 28559–28569. [Google Scholar] [CrossRef]
Figure 1. TEM images (a,b) and size distribution histograms (c,d) of dried samples of Au2Re6-S (a,c) and Au2Re6-Se (b,d) colloids.
Nanomaterials 12 03229 g001
Figure 2. (a) Absorbance-pH plots for supernatant solutions of Au2Re6-S (1), Au2Re6-Se (2), LSZ-Au2Re6-S (3), and LSZ-Au2Re6-Se (4) colloids. (b,c) Luminescence of Re6-cluster unit in Au2Re6-S (b) and Au2Re6-Se (c) at pH = 7.4 (black lines), pH = 5.5 (b, red line), or pH = 5 (c, red line). Ccolloids= 22 μM. (d) Luminescence-pH plots of Au2Re6-S (1) and Au2Re6-Se (2) colloids at λmax = 607 nm (1) and λmax = 630 nm (2).
Nanomaterials 12 03229 g002
Figure 3. (a) Photos of Au2Re6-Q colloids before (right) and after (left) the addition of PEI. (b,c) Luminescence data for Au2Re6-S (b) and Au2Re6-Se (c): 1–colloids; 2–corresponding colloids after treatment by PEI; 3–supernatants. (d) Schematic representation of Au2Re6-Q colloids dissolution upon acidification and treatment by PEI.
Nanomaterials 12 03229 g003
Figure 4. Colocalization analysis of LSZ-Au2Re6-Q and LysoTracker Blue DND 22 after 24 h of M-HeLa cells incubation.
Nanomaterials 12 03229 g004
Figure 5. CLSM images showing the rapture of endo/lysosomal membranes in M-HeLa cells incubated by LSZ-Au2Re6-Se through the AO assay. Cells treated with Acridine Orange only were used as control.
Nanomaterials 12 03229 g005
Figure 6. Flow cytometry analysis of M-HeLa cells treated with different concentrations of Au2Re6-S (1) and LSZ-Au2Re6-S (2) after Annexin V and PI staining. The values are presented as the mean ± SD (n = 3): * p < 0.01 vs. the control group. L—living cells; D—dead cells; E. a.—early apoptotic cells; L. a.—late apoptotic cells.
Nanomaterials 12 03229 g006
Table 1. Evaluated through the size distribution by number (dnum) diameter values, polydispersity indices (PDI), and electrokinetic potentials (ζ) of Au2Re6-Q colloids both itself and after the addition of lysozyme (LSZ) (1.6 µM). Concentration of phosphate buffer is 0.01 M.
dnum, nmPDIζ, mV
Au2Re6-S498–520~1–10.8 ± 0.6
Au2Re6-Se400–4600.846–17.1 ± 0.8
Phosphate buffer solutions (pH = 7):
Au2Re6-S630–1100~1–5.0 ± 0.5
LSZ-Au2Re6-S620–1040~1–6.0 ± 0.6
Au2Re6-Se340–5300.9–6.9 ± 0.6
LSZ-Au2-Re6-Se460–5300.9–4.2 ± 0.7
Table 2. IC50 values determined for M-HeLa and Chang Liver cell lines after incubation by [Au2L2]Cl2 complex, Au2Re6-Q, and LSZ-Au2Re6-Q colloids.
IC50, μM
M-HeLaChang Liver
[Au2L2]Cl22.0 *3.0 *
Au2Re6-S2.24 ± 0.17 **1.85 ± 0.20 **
LSZ-Au2Re6-S1.20 ± 0.10 **2.59 ± 0.18 **
Au2Re6-Se1.70 ± 0.13 **1.70 ± 0.11 **
LSZ-Au2Re6-Se3.40 ± 0.24 **2.90 ± 0.17 **
LSZ>30>30
* Values are taken from the previously published work [35]. ** Refer to the concentration of the Re6-Q blocks.
Publisher’s Note: MDPI stays neutral with regard to jurisdictional claims in published maps and institutional affiliations.

