
Nanostructure, Plastic Deformation, and Influence of Strain Rate Concerning Ni/Al2O3 Interface System Using a Molecular Dynamic Study (LAMMPS)

Shenzhen Institute of Advanced Electronic Materials, Shenzhen Institute of Advanced Technology, Chinese Academy of Sciences, Shenzhen 518055, China
Nanomaterials 2023, 13(4), 641; https://0-doi-org.brum.beds.ac.uk/10.3390/nano13040641
Submission received: 22 November 2022
/
Revised: 31 January 2023
/
Accepted: 2 February 2023
/
Published: 6 February 2023
(This article belongs to the Special Issue Theoretical Calculation and Molecular Modeling of Nanomaterials)
Abstract
:The plastic deformation mechanisms of Ni/Al2O3 interface systems under tensile loading at high strain rates were investigated by the classical molecular dynamics (MD) method. A Rahman–Stillinger–Lemberg potential was used for modeling the interaction between Ni and Al atoms and between Ni and O atoms at the interface. To explore the dislocation nucleation and propagation mechanisms during interface tensile failure, two kinds of interface structures corresponding to the terminating Ni layer as buckling layer (Type I) and transition layer (Type II) were established. The fracture behaviors show a strong dependence on interface structure. For Type I interface samples, the formation of Lomer–Cottrell locks in metal causes strain hardening; for Type II interface samples, the yield strength is 40% higher than that of Type I due to more stable Ni-O bonds at the interface. At strain rates higher than , the formation of L-C locks in metal is suppressed (Type I), and the formation of Shockley dislocations at the interface is delayed (Type II). The present work provides the direct observation of nucleation, motion, and reaction of dislocations associated with the complex interface dislocation structures of Ni/Al2O3 interfaces and can help researchers better understand the deformation mechanisms of this interface at extreme conditions.
1. Introduction
Thermal barrier coatings (TBCs) are widely used in various energy-producing turbines such as aeronautical and utility gas turbines to protect the metallic components of the hottest part [1,2,3,4,5]. In general, these coating systems consist of ceramic coating (usually yttria-stabilized zirconia (YSZ)) for thermal insulation, bonding coating, and metal substrate (usually nickel-based superalloys). Under an elevated temperature environment, thermally grown oxide (TGO, the main component is α-Al2O3) develops between the Ni(Al) alloy bond coat and the ZrO2 thermal barrier, forming a large area of Ni/Al2O3 interfaces in the coating system [6]. Although the TGO protects the underlying superalloy from oxidation and corrosion, upon thermal cycling the growth of cracks along the Ni/Al2O3 interface may eventually cause the spalling of TBCs. Therefore, the durability of TBCs is often dictated by the adhesion of the Ni/Al2O3 interface. A deeper understanding of the mechanical properties and failure behaviors of the Ni/Al2O3 interface at the atomistic level provides insight into the underlying physics of interface decohesion.
The theoretical research on the microscopic fracture of Ni/Al2O3 interface mainly focus on interface adhesion properties, such as work of adhesion and interface strength. Extensive ab initio calculations have been carried out to investigate the atomic-level tensile and shear fracture of the stoichiometric Ni/Al2O3 interfaces [7,8,9,10,11]. The calculated adhesive energies of the most stable Al-terminated O site interface (1.44 J/m2~1.90 J/m2 [7,8,9,10]) turn out to be an order of magnitude lower than the macroscopic interface fracture toughness at room temperature. This huge difference mainly comes from the plasticity induced by the crack in the Ni alloys [12]. Molecular dynamics (MD) simulation has proven to be a powerful tool for analyzing plastic deformation mechanisms during metal/ceramic interface fracture [13,14,15,16,17,18]. MD simulations on Nb/NbC and Ti/TiN interface systems showed that plastic deformation mainly occurs in the relatively softer metals [17,18]. Moreover, the plastic deformation mechanisms and fracture strengths of the metal/ceramic interfaces are strongly affected by the crystallographic orientation and interface dislocation structures, as well as strain rate, metal layer thickness, etc.
When the imposed plastic strain rate cannot be accommodated completely by dislocation slip, twinning occurs [19]. The onset of twinning is a complex phenomenon that relies on the global stress distribution and dislocation density, as well as dislocation structure. Considerable efforts have been devoted to understanding the interplay between dislocation motion and twinning. Chen et al. [20] observed direct correlation between the spall strengths and the local Shockley partial, twinning partial, and Stair-rod densities at the spall failure process of Cu/Ta multilayered microstructures under shock loading. For polycrystal nickel of commercial purity (99.5%), twining is more prevalent in surface regions, and a rapid strained sample will accommodate the new dislocations more heterogeneously at the weakest part of the microstructure, namely the grain boundaries [21]. Decreasing the grains size reduces the area of a homogeneous deformation region (or length) where slip can occur before hitting an obstacle, so larger stress was required for twinning [22]. Moreover, the dislocation density plays a critical role in determining whether a material twins. Mahajan and Boucher [23,24] reported the suppression of twinning after pre-straining for both Fe and Nb. They hypothesized that when a material is strained to a level that produces a homogenous dislocation distribution, twinning is suppressed. Florando et al. [19] also reported no evidence of twinning in the 50% cold-rolled nickel samples that show a high density of dislocations within the grains.
Compared with other metal/ceramic interfaces, the underlying atomic-level mechanisms of plastic deformation in a Ni/Al2O3 interface system is less studied. First, the Ni/Al2O3 interface has complex interface dislocation structures. Due to lattice mismatch, relative orientation, and a wide variety of defects that can form at the interface, the Ni/Al2O3 interface at equilibrium develops unique structural characteristics. Atomistic simulations showed the Ni/Al2O3 interface is reconstructed at the terminating Ni layer, and the misfit dislocation is placed in the energy-preferred second monolayer of the metal side by a (n + 1 n + 1:n n) mismatch plane [25]. However, experimental observation by aberration-corrected transmission electron microscopy revealed the solid Ni/Al2O3 interfaces at equilibrium develop delocalized coherency in the terminating Ni layer where the misfit dislocation is introduced [26]. This unique mechanism for misfit strain reduction contradicts most simulations in the literature. Second, the Ni/Al2O3 interface lacks appropriate interface potential. For metal/oxide interfaces, the famous potential models include the discrete classical model [27,28], the fitting model [29,30], and the iterative model [31]. However, these potentials need to assume a priori in interface structure and/or potential functional form, which limits their applications in complex Ni/Al2O3 interface structure. Based on ab initio adhesive energies, Long and Chen derived a series of Rahman–Stillinger–Lemberg potentials without any prerequisite of the function forms. These potentials have proven to be successful in investigating the interface structures and adhesive properties of Ni/Al2O3 interface [25,26] and metal/MgO interfaces [32,33].
Although the microscopic fracture behaviors of metal/ceramic interfaces have been the focus of interface research for several decades, there is, however, no understanding at present of the plastic deformation mechanisms of Ni/Al2O3 interfaces with different locations of misfit plane corresponding to different possible equilibrium interface structures. In this work, we studied the tensile fracture behaviors of two kinds of Ni/Al2O3 interfaces, corresponding to the terminating Ni layer as a buckling layer and transition layer, respectively. The plastic deformation mechanisms and dislocation evolution process were investigated numerically by the molecular dynamics (MD) method. Rahman–Stillinger–Lemberg pair potential was used to describe the Ni/Al2O3 interface interaction [34]. In particular, the role of dislocation reaction and strain rate were explored.
2. Models and Methods
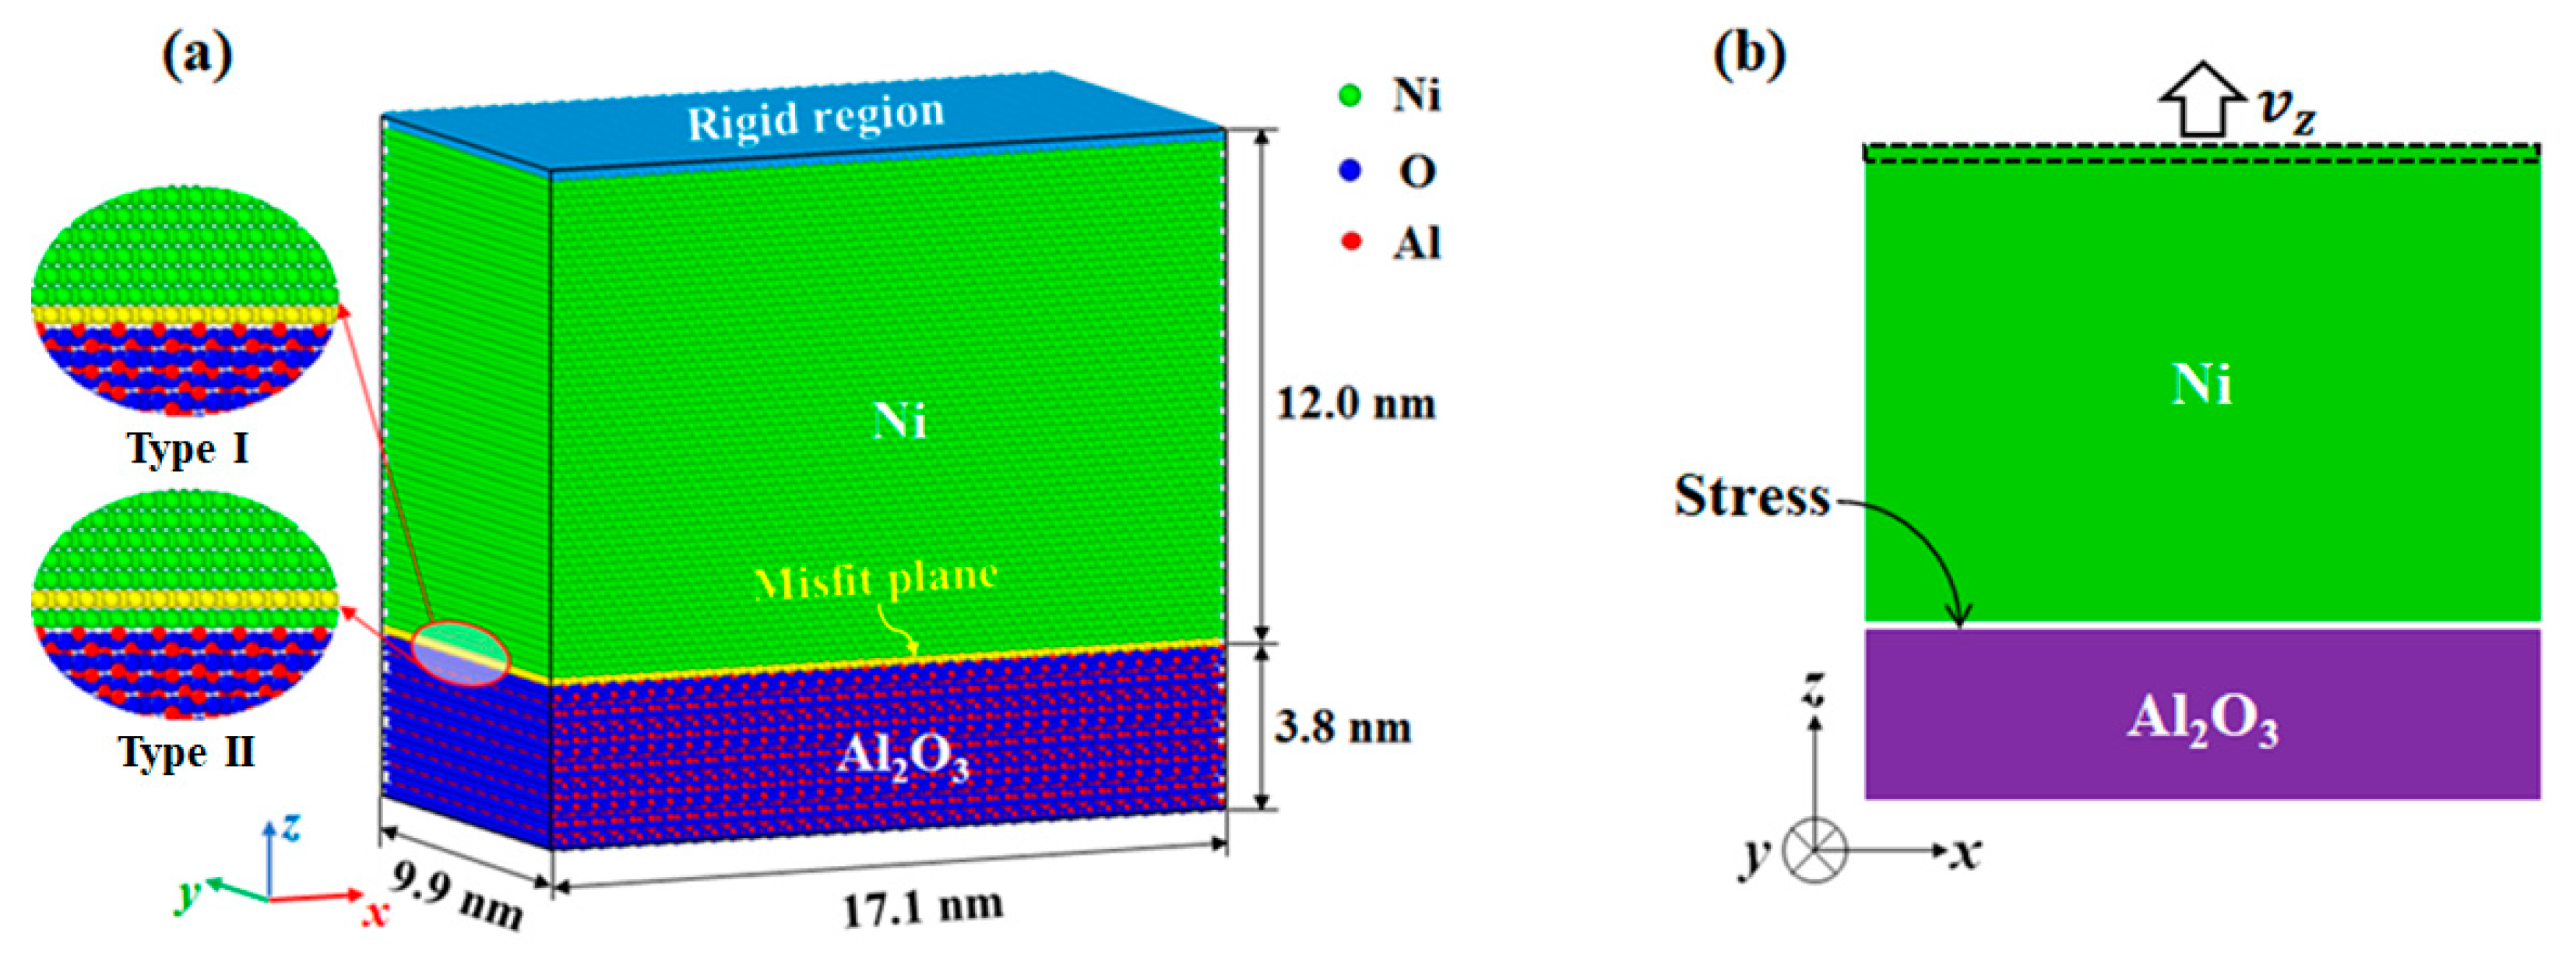
As shown in Figure 1, the most stable stoichiometric interface with Al2O3 (0001) terminated by a single Al atomic layer (nAl/nO = 2/3) was created, and the orientation relationship was Ni||Al2O3 (x-axis), Ni||Al2O3 (y-axis), Ni ||Al2O3 (z-axis). Periodic boundary conditions (PBCs) were applied along x, y, and z directions to study the behavior of the bulk material [14,18]. To avoid the spurious interaction between top Ni atoms and bottom Al2O3 atoms, a sufficient thick vacuum region was inserted between the Ni slab and the Al2O3 slab. Considering the lattice misfit between Ni and Al2O3 (9.3%), the ratio of Ni unit cells to Al2O3 unit cells in the misfit plane was set to 11:10. According to the different atomic structures of the terminating Ni layers observed in experiment [26] and atomistic simulation [11,25], two interface models with misfit planes located at the first monolayer and second monolayer of metal side were established. For convenience, we refer to the first interface structure as Type I and the second interface structure as Type II in the following text.
For the Ni/Al2O3 interface, the Ni-Al interaction and Ni-O interaction were described by the Rahman–Stillinger–Lemberg pair potential developed by Long and Chen [34]. The Ni-Ni interactions were described by the embedded atom method (EAM) potential developed by Mishin et al. [35]. The Al-O interactions in the Al2O3 were omitted by fixing the Al2O3 atoms in their crystal positions before interface relaxation. This is the primary approximation of the Ni/Al2O3 interface system but is sometimes reasonable for atomistic simulation studies on metal/ceramic interfaces [25,26,30,36]. First, Ni/Al2O3 interfaces are relatively brittle, and the plasticity accompanying interface cracking is due to generation and movement of dislocations within the metal [12]. Fixing the position of Al2O3 does not affect the main characteristics of equilibrium interface structure and the plastic deformation of the interface system. For example, Meltzman et al. [26] froze the Al2O3 atoms in their crystal positions and obtained the equilibrated interface by energy minimization via the conjugate gradient method. The simulation successfully reflects the periodicity of the equilibrium Ni/Al2O3 interface structure determined by aberration-corrected transmission electron microscopy. Second, the ionic interactions in the Al2O3 crystal include long-range Coulomb interactions, which significantly increase the amount of computation in molecular dynamics simulations. Fixing the position of Al2O3 can reduce the computation time and facilitate the simulation of interface models at larger scale.
The interface model was relaxed by quenching molecular dynamics [37]. In the tension simulation, the top rigid Ni atoms were subjected to a constant velocity . To avoid the shock wave effect, the velocities of mobile Ni atoms were linearized from 0 to as an initial condition [38]. The strain rate ranged from s−1 to s−1. The simulations were performed using NVT ensemble at low temperature (1K) via a Nose–Hoover velocity scaling algorithm [39,40]. Simulations at low temperature assist understanding the governing deformation mechanisms by reducing the kinetic effects. Moreover, the results at low temperature provide insights into dislocation motion and interaction at elevated temperatures, because the effect of the temperature on the dislocation propagation is less than that on the dislocation nucleation [14]. All the simulated samples used in molecular dynamic simulations are given in Table 1. The used molecular dynamics simulation integrates Newton’s equations of motion over time to obtain the motion of the atoms/molecules in a system. MD simulations do not use the Schrödinger equation, i.e., quantic mechanics or micro-continuum media mechanics.
The strain rate used in the molecular dynamics simulations is always several orders of magnitude higher than that used in experiments, usually less than 104 s−1 [41,42,43]. To study the interface fracture behavior under the “low strain rate” situation, quasi-static fracture simulations under 0K were commonly used [38,44,45]. This structure minimization between each strain increment allows atoms to fully relax at each strain state. The top rigid region was successively displaced by a short distance ( = 0.001 Å) along the z axis, and after each displacement loading the mobile Ni atoms were fully relaxed under the interatomic potentials.
The interface stress was calculated as Ni-Al2O3 interaction force divided by the interface area:
where denotes the stress at interface; and denote the direction of stress. is the interaction force between nickel atom and sapphire atom near the interface. is the interface area. During the tensile loading process, the interface system maintains force equilibrium, and the following four definitions of interface stress are equivalent: virial stress, interface interaction force divided by the interface area, unit area force exerted on the boundary, and derivative of total energy to the loading displacement [46].
The centro-symmetry parameter (CSP) [47] was calculated to characterize local defects (dislocation and stacking fault) and surface. The dislocation extraction algorithm (DXA) [48] was used to identify all dislocations in the plastic deformation process. We performed the MD simulations using LAMMPS [49] and visualized the atomic configurations using OVITO [50].
3. Results
3.1. Validation of the Potential and Interface Model
To validate the potential and interface models, we carried out tensile and shear tests to characterize the intrinsic adhesion of the coherent Ni(111)/Al2O3(0001) interface. Three interface models of the stoichiometric interface by a single Al atomic layer (nAl/nO = 2/3) were constructed. This aluminum-terminated Al2O3(0001) surface is the ground-state configuration [51,52,53], and Ni atoms sit on O site, Al site, or hollow site. After interface relaxation, the Ni slab and Al2O3 slab were displaced along tensile direction or shear direction. For tensile test, the adhesive energy per unit area at different interface displacement is defined as [54]
where is the total energy of the interface system at interface normal displacement relative to equilibrium interface distance. is the total energy of the isolated Ni(001) layer; is the total energy of the isolated -Al2O3(0001) layer; is the interface area.
During interface relaxation, the Ni atoms in unstable positions of the interface move along the direction parallel and/or perpendicular to the interface, causing local inelastic deformation. The generalized stacking fault energy (GSFE) of the interface was usually used to measure nonelastic deformation, especially for dislocation glide and twinning. The GSFE could be calculated by [55]
where and are the total energy of the interface system with and without a stacking fault. was the stacking fault area. The atomic positions perpendicular to the interface were fully relaxed, while those in the direction parallel to the interface were fixed to maintain stacking fault during interface relaxation.
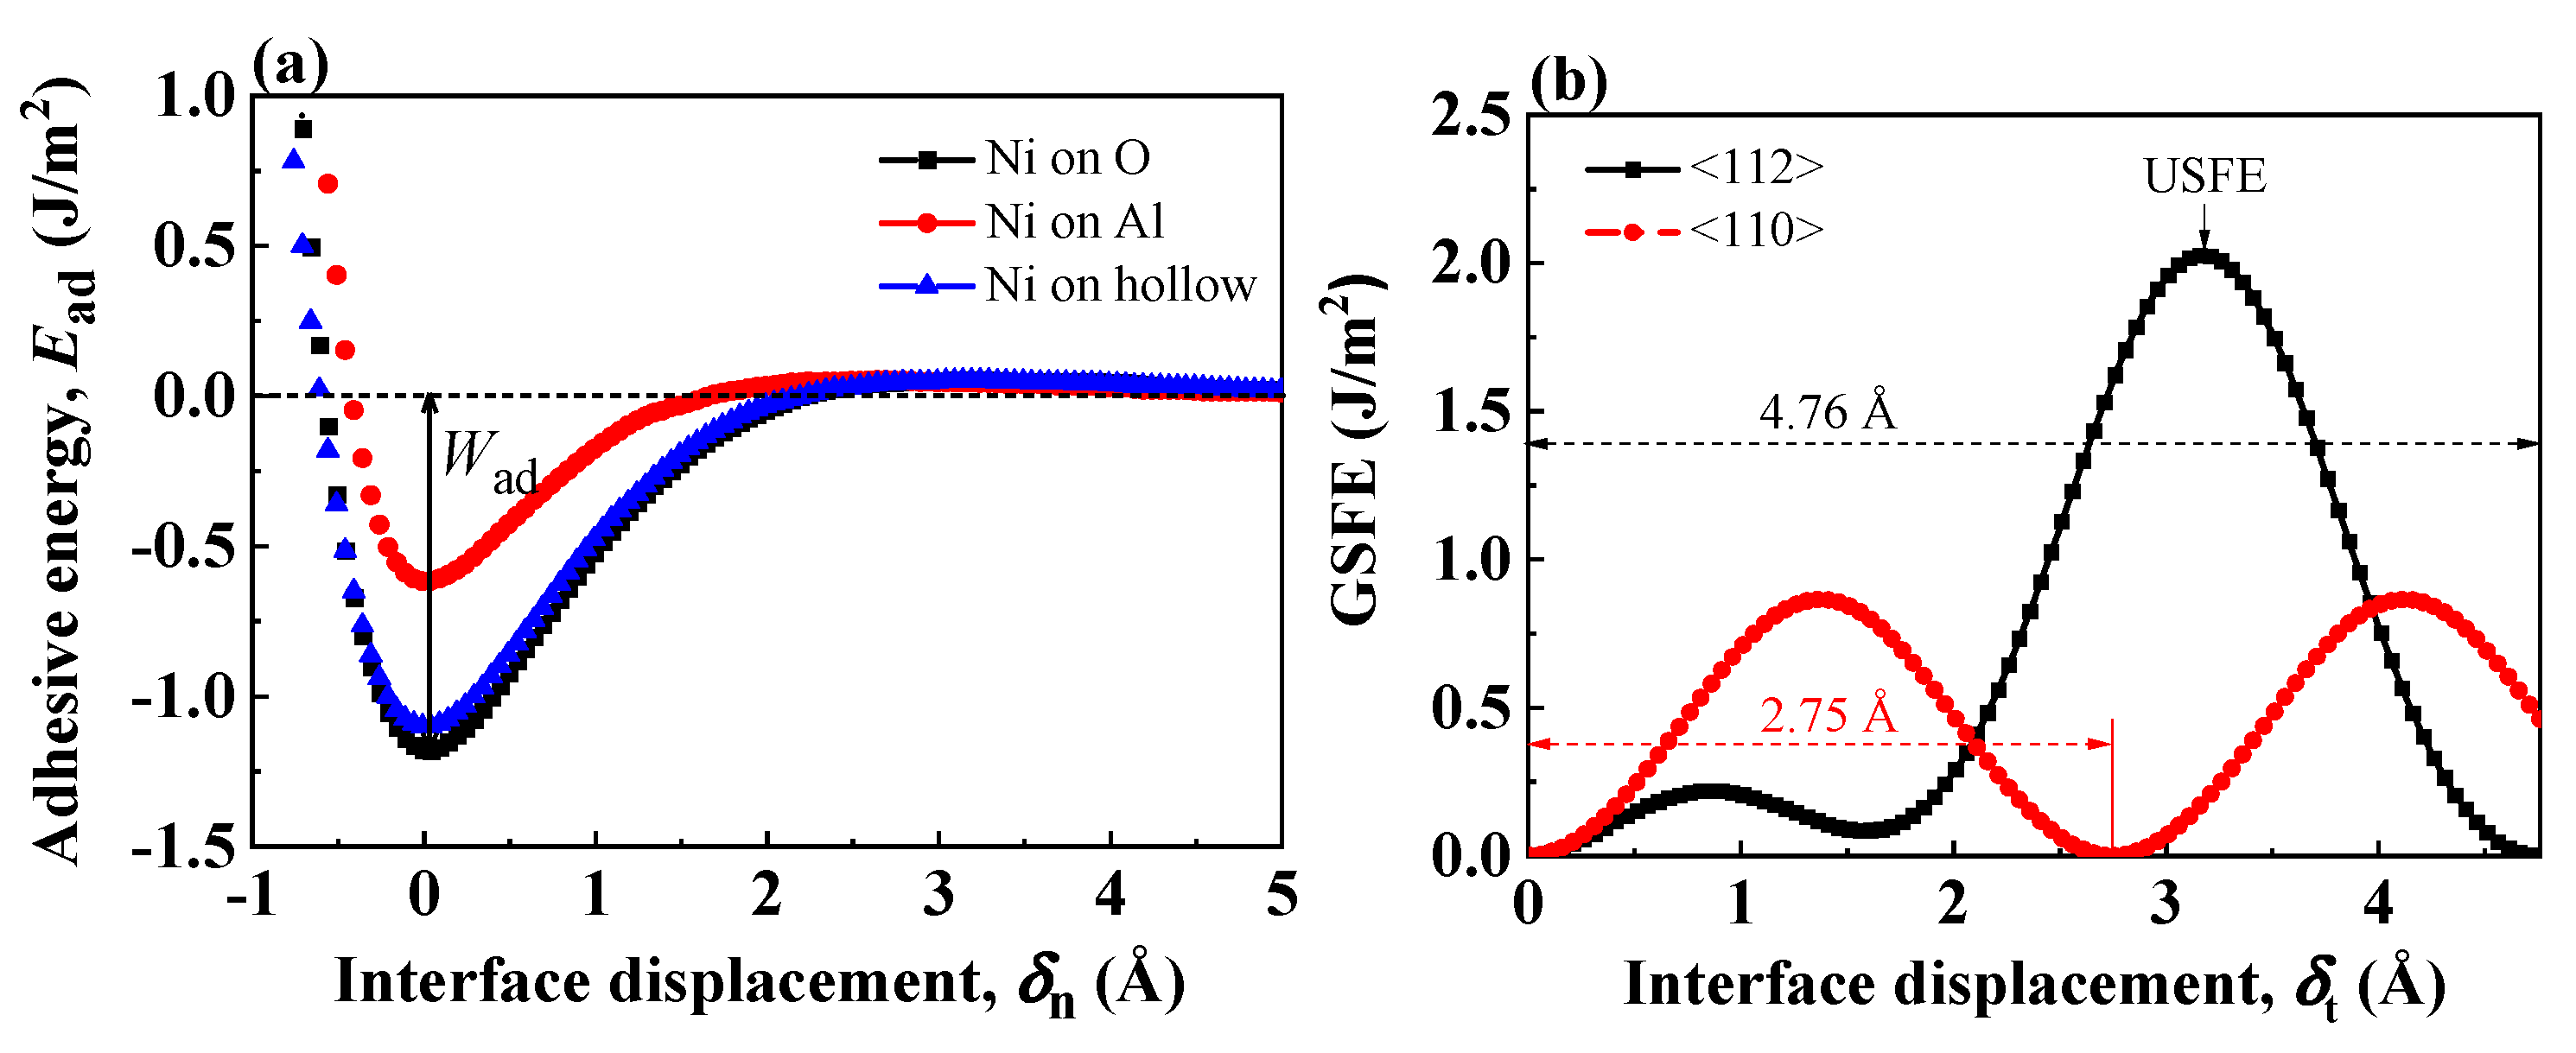
Figure 2a shows the adhesive energy curves under tensile test of three coherent Al-terminated Ni(111)/Al2O3(0001) interfaces with different atomic configurations. At the equilibrium interface state (), the system energy as well as the adhesive energy reach the lowest. As the interface is separated to form two new free surfaces, the adhesive energy increases. The work of adhesion was defined as the energy required to break down the interfacial bonds and separate the interface into two free surfaces [56]. In Figure 2a, corresponds to the well depth of the adhesive energy curves. Figure 2b shows the GSFE profile of coherent Ni(111)/Al2O3(0001) interface along <112> and <110> crystal orientations. Considering the hexagonal symmetry of Al2O3 lattice, the shear period is 4.76 Å () along <112> crystal orientation and 2.75 Å along <110> crystal orientation. As the interface is sheared apart from the equilibrium state, the GSFE increases. The energy barrier along <112> crystal orientation is larger than that along <110> crystal orientation, reflecting unfavorable atomic arrangements along <112> crystal orientations [57].
Table 2 lists the work of separation obtained from tensile tests or unstable stacking fault energy (USFE) from shear tests. The atomistic simulation results are based on the Ni-O and Ni-Al interface pair potentials in the Rahman–Stillinger–Lemberg potential (RSL2) form:
where is or . The potential parameters of and are listed in Ref. [34]. The work of adhesion by pair potential agree with ab initio calculation results, which proves the pair potential employed in this work gives a good description of the interface energetics for Al-terminated Ni(111)/Al2O3(0001) interface. The work of adhesion is an indication for the strength of the interface. Among the three coherent Al-terminated Ni(111)/Al2O3(0001) interfaces, the interface with Ni atom over O site shows the highest , indicating this interface configuration is strong and energetically favorable. This O site preference is also quite pronounced for other metal/ceramic interfaces [16]. In fact, when the metal atoms are above the O sites, the polarization of metal atoms close to the interface is more obvious, so the interface bonding becomes stronger [34].
3.2. Interface Nanostructure
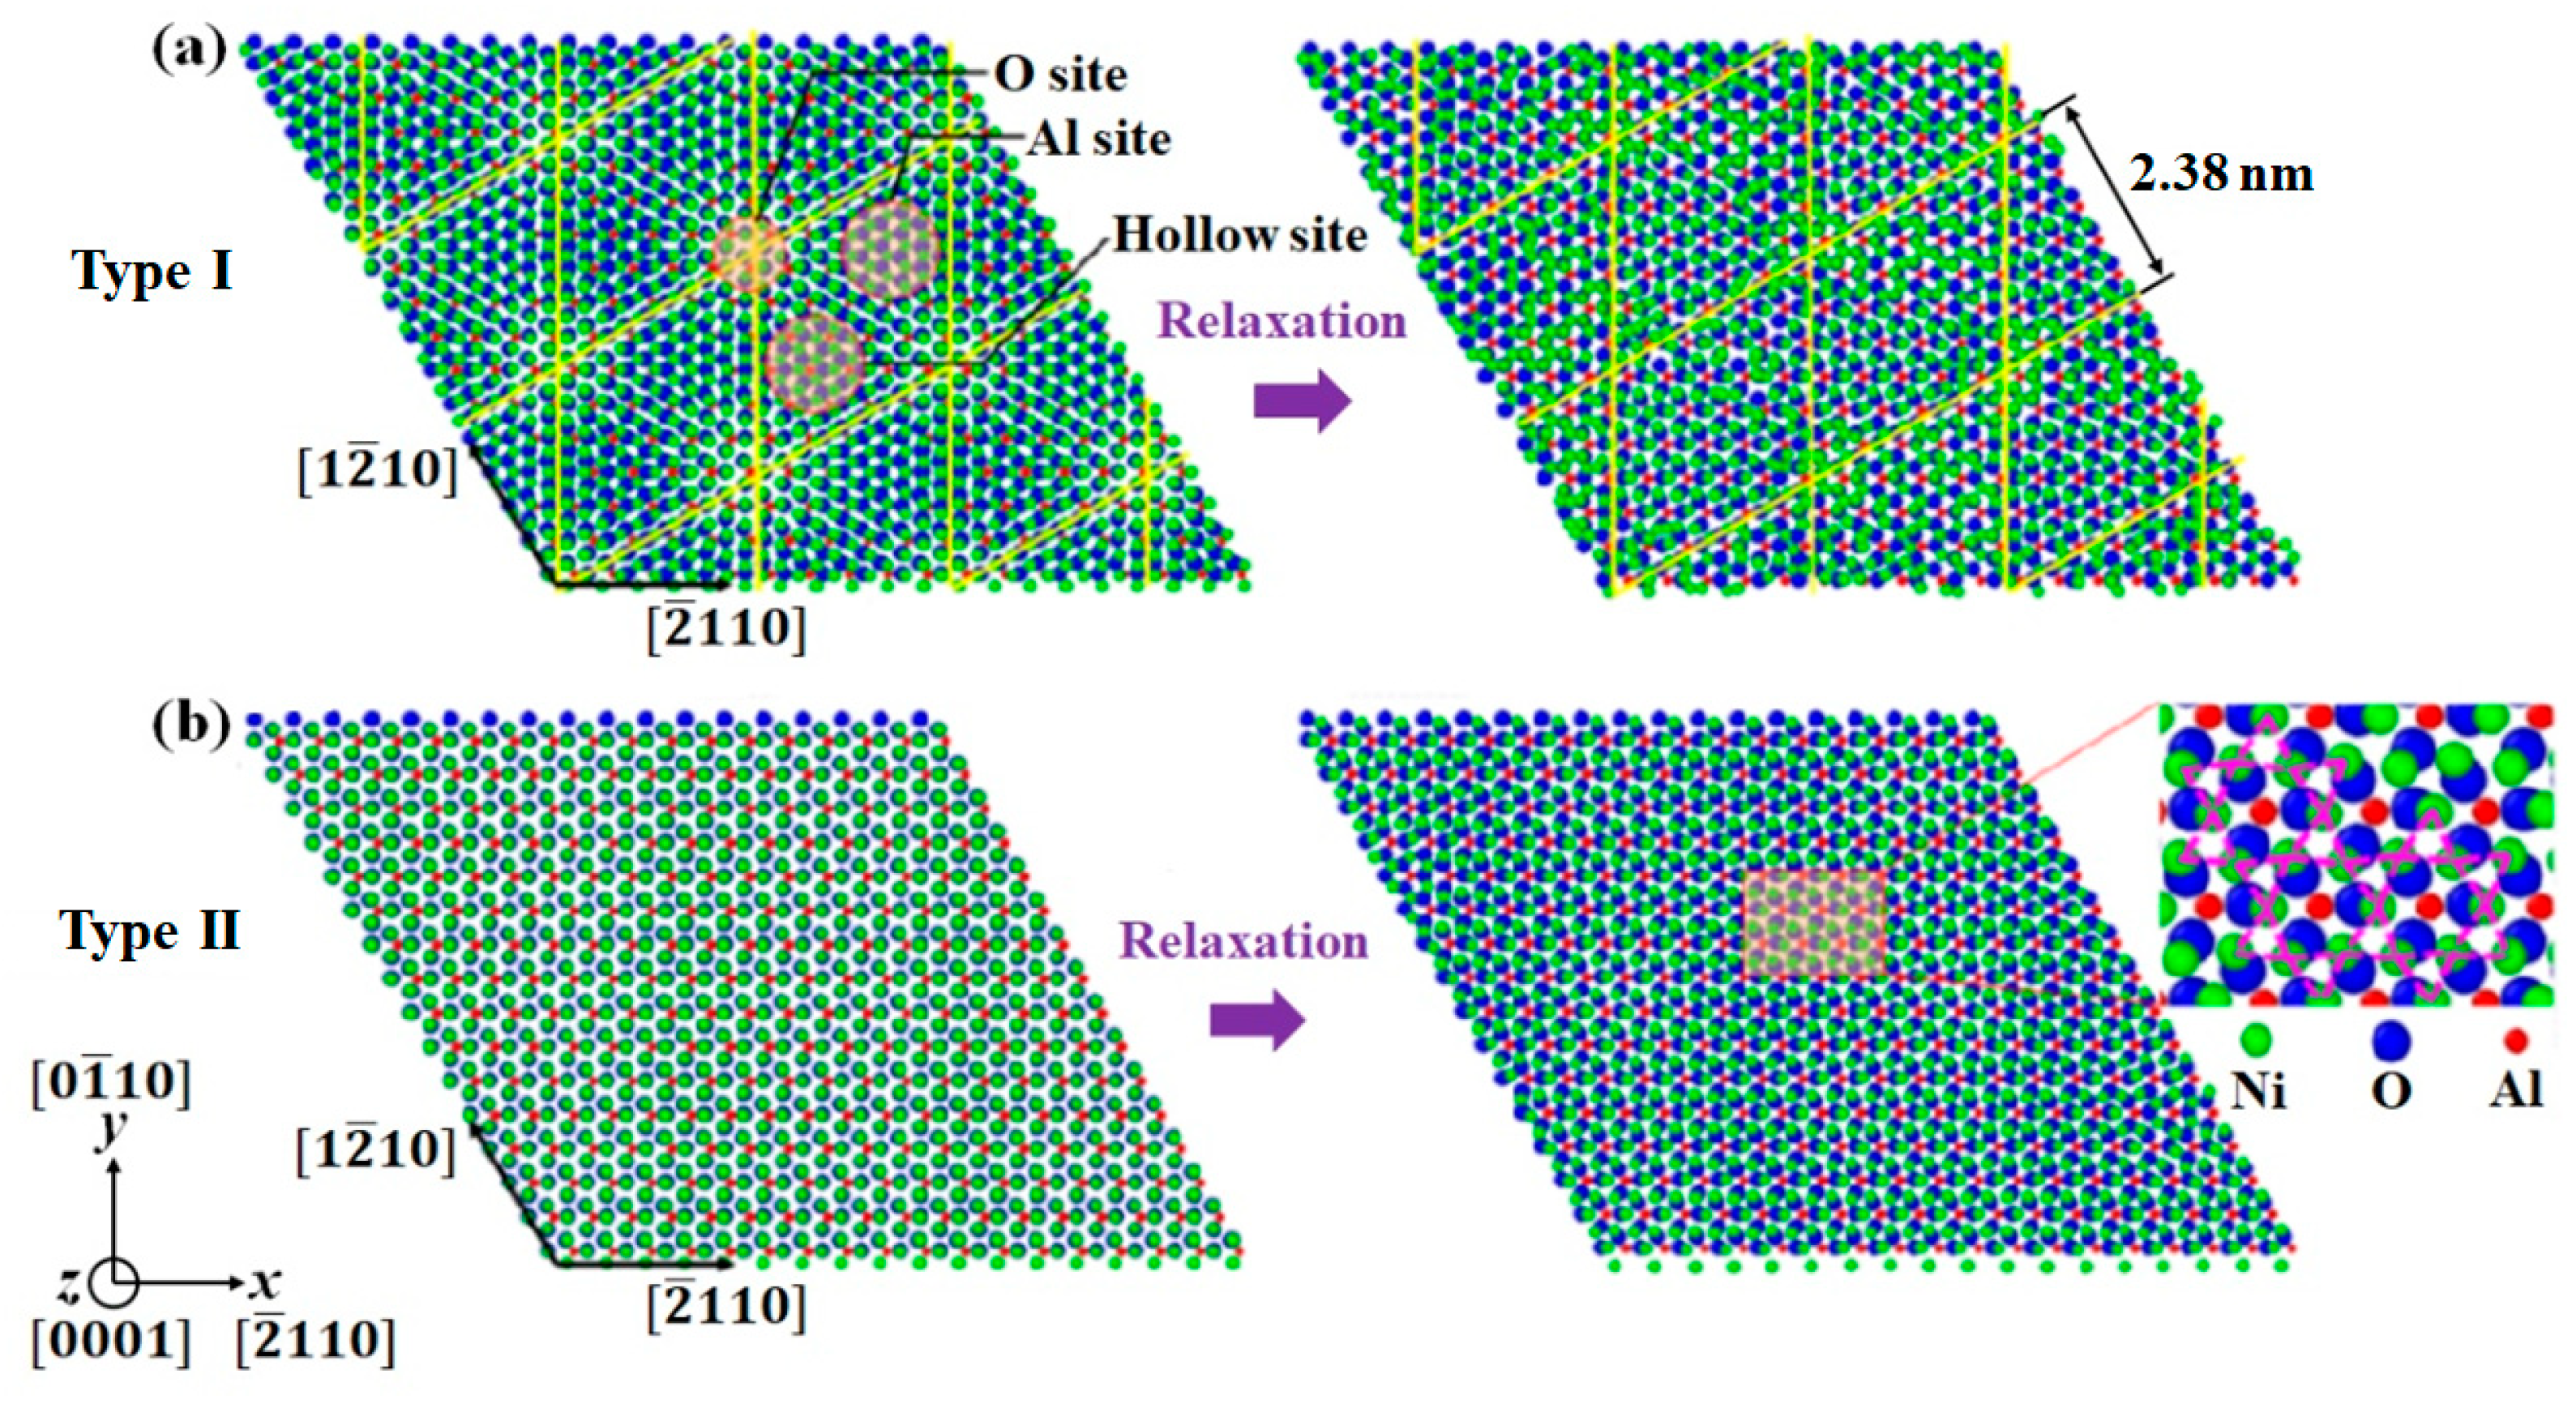
Figure 3 shows the equilibrium interface structures for both Type I and Type II Ni/Al2O3 interfaces. For Type I, the initial Ni/Al2O3 interface exhibits hexagonal symmetry, as marked by the yellow lines. After relaxation, those atoms on the Al site and O site move laterally and normally to the interface, resulting in a periodically buckled structure with a period of 2.38 nm. Concerning the atomistic structure of solid Ni-Al2O3 interfaces at equilibrium, Meltzman et al. [26] conducted TEM analysis using a monochromated and aberration-corrected TEM equipped with a post-column energy filter. The interface specimens were formed during solid-state dewetting of thin Ni film on the (0001) surface of -Al2O3. They found similar mechanism for misfit strain reduction via a reconstructed interface structure. For type II interface sample, the terminating Ni layer matches perfectly with Al2O3, and Ni atoms sit on the energy preferred O site. After relaxation, the terminating Ni layer reconstructs with a combination of regular triangle and irregular hexagon structures. This reconstructed Ni layer acts as a transition layer between Ni and Al2O3 [25].
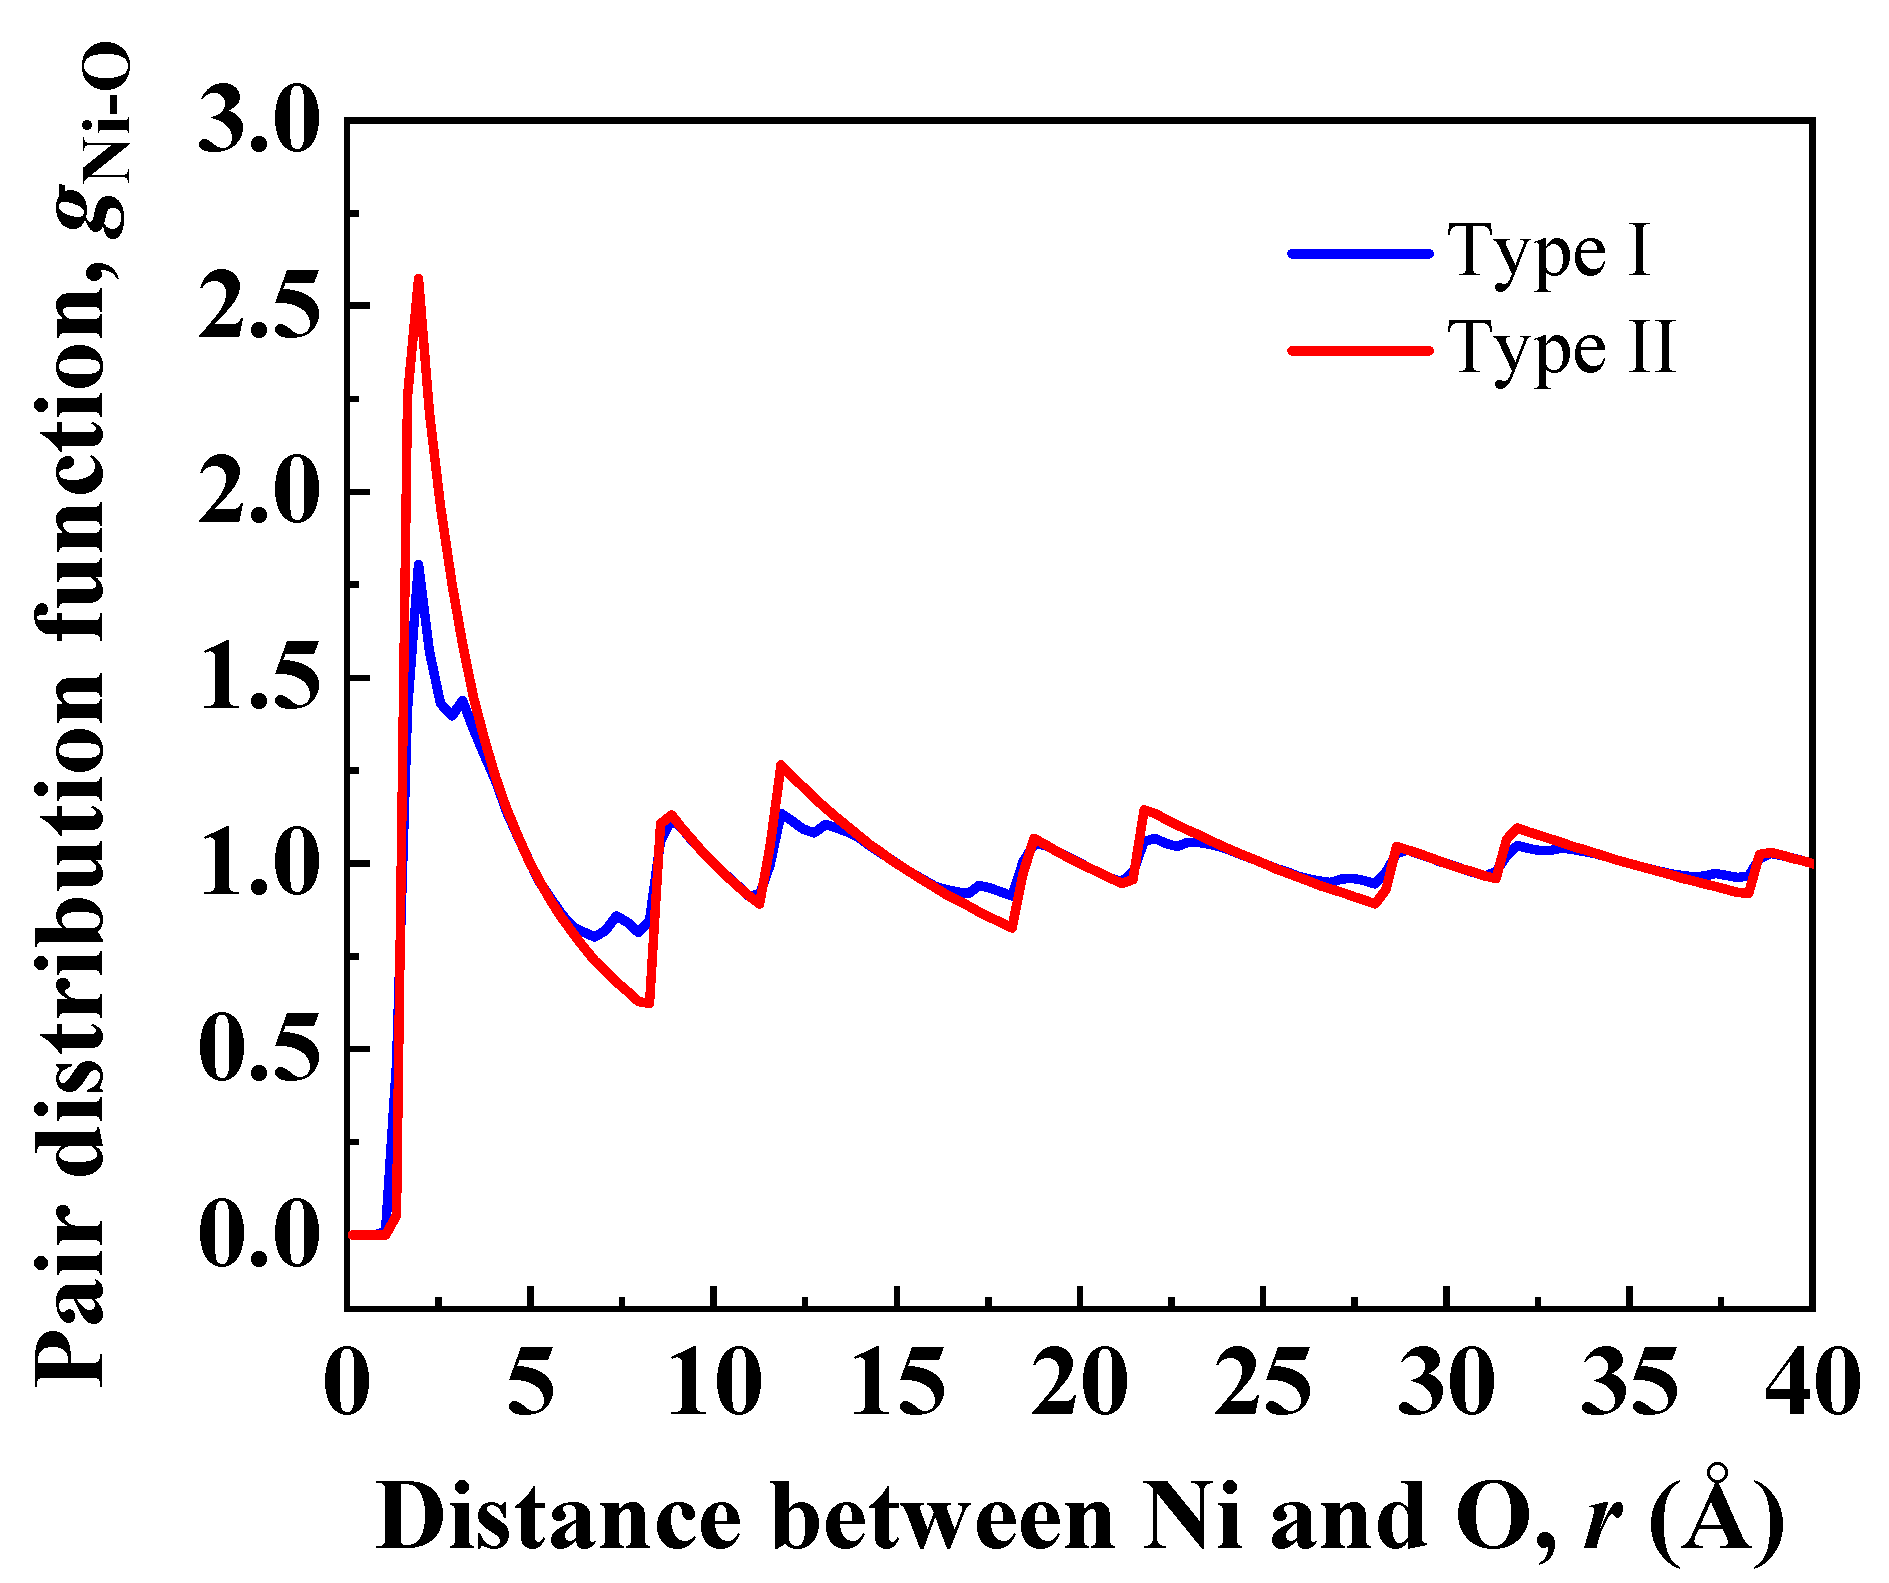
To investigate in detail the distribution of Ni-O bonds at interfacial regions, atomic configurations in Figure 3 were used to calculate pair distribution functions (PDF) of Ni/Al2O3 interfaces. Ni atoms in the nickel slab were picked to calculate distances to O atoms in sapphire. Figure 4 shows the Ni-O pair distribution function for particles at interfacial regions of Type I and Type II interfaces. The first peak corresponds to the first nearest neighbors, which represent Ni-O bonding neighbors. The height of the first peak of Type II interface is 64% higher than the height of the first peak of Type I interface, indicating more stable Ni-O bonds are formed at the Type II interface. Moreover, the position of the first peak of Type II interface is shifted to a lower value (1.95 ) relative to the position of the first peak of Type I interface (2.25 ). This suggests the Ni-O bond distance at the Type II interface is shorter than that at the Type I interface.
3.3. Tensile Fracture Mechanisms
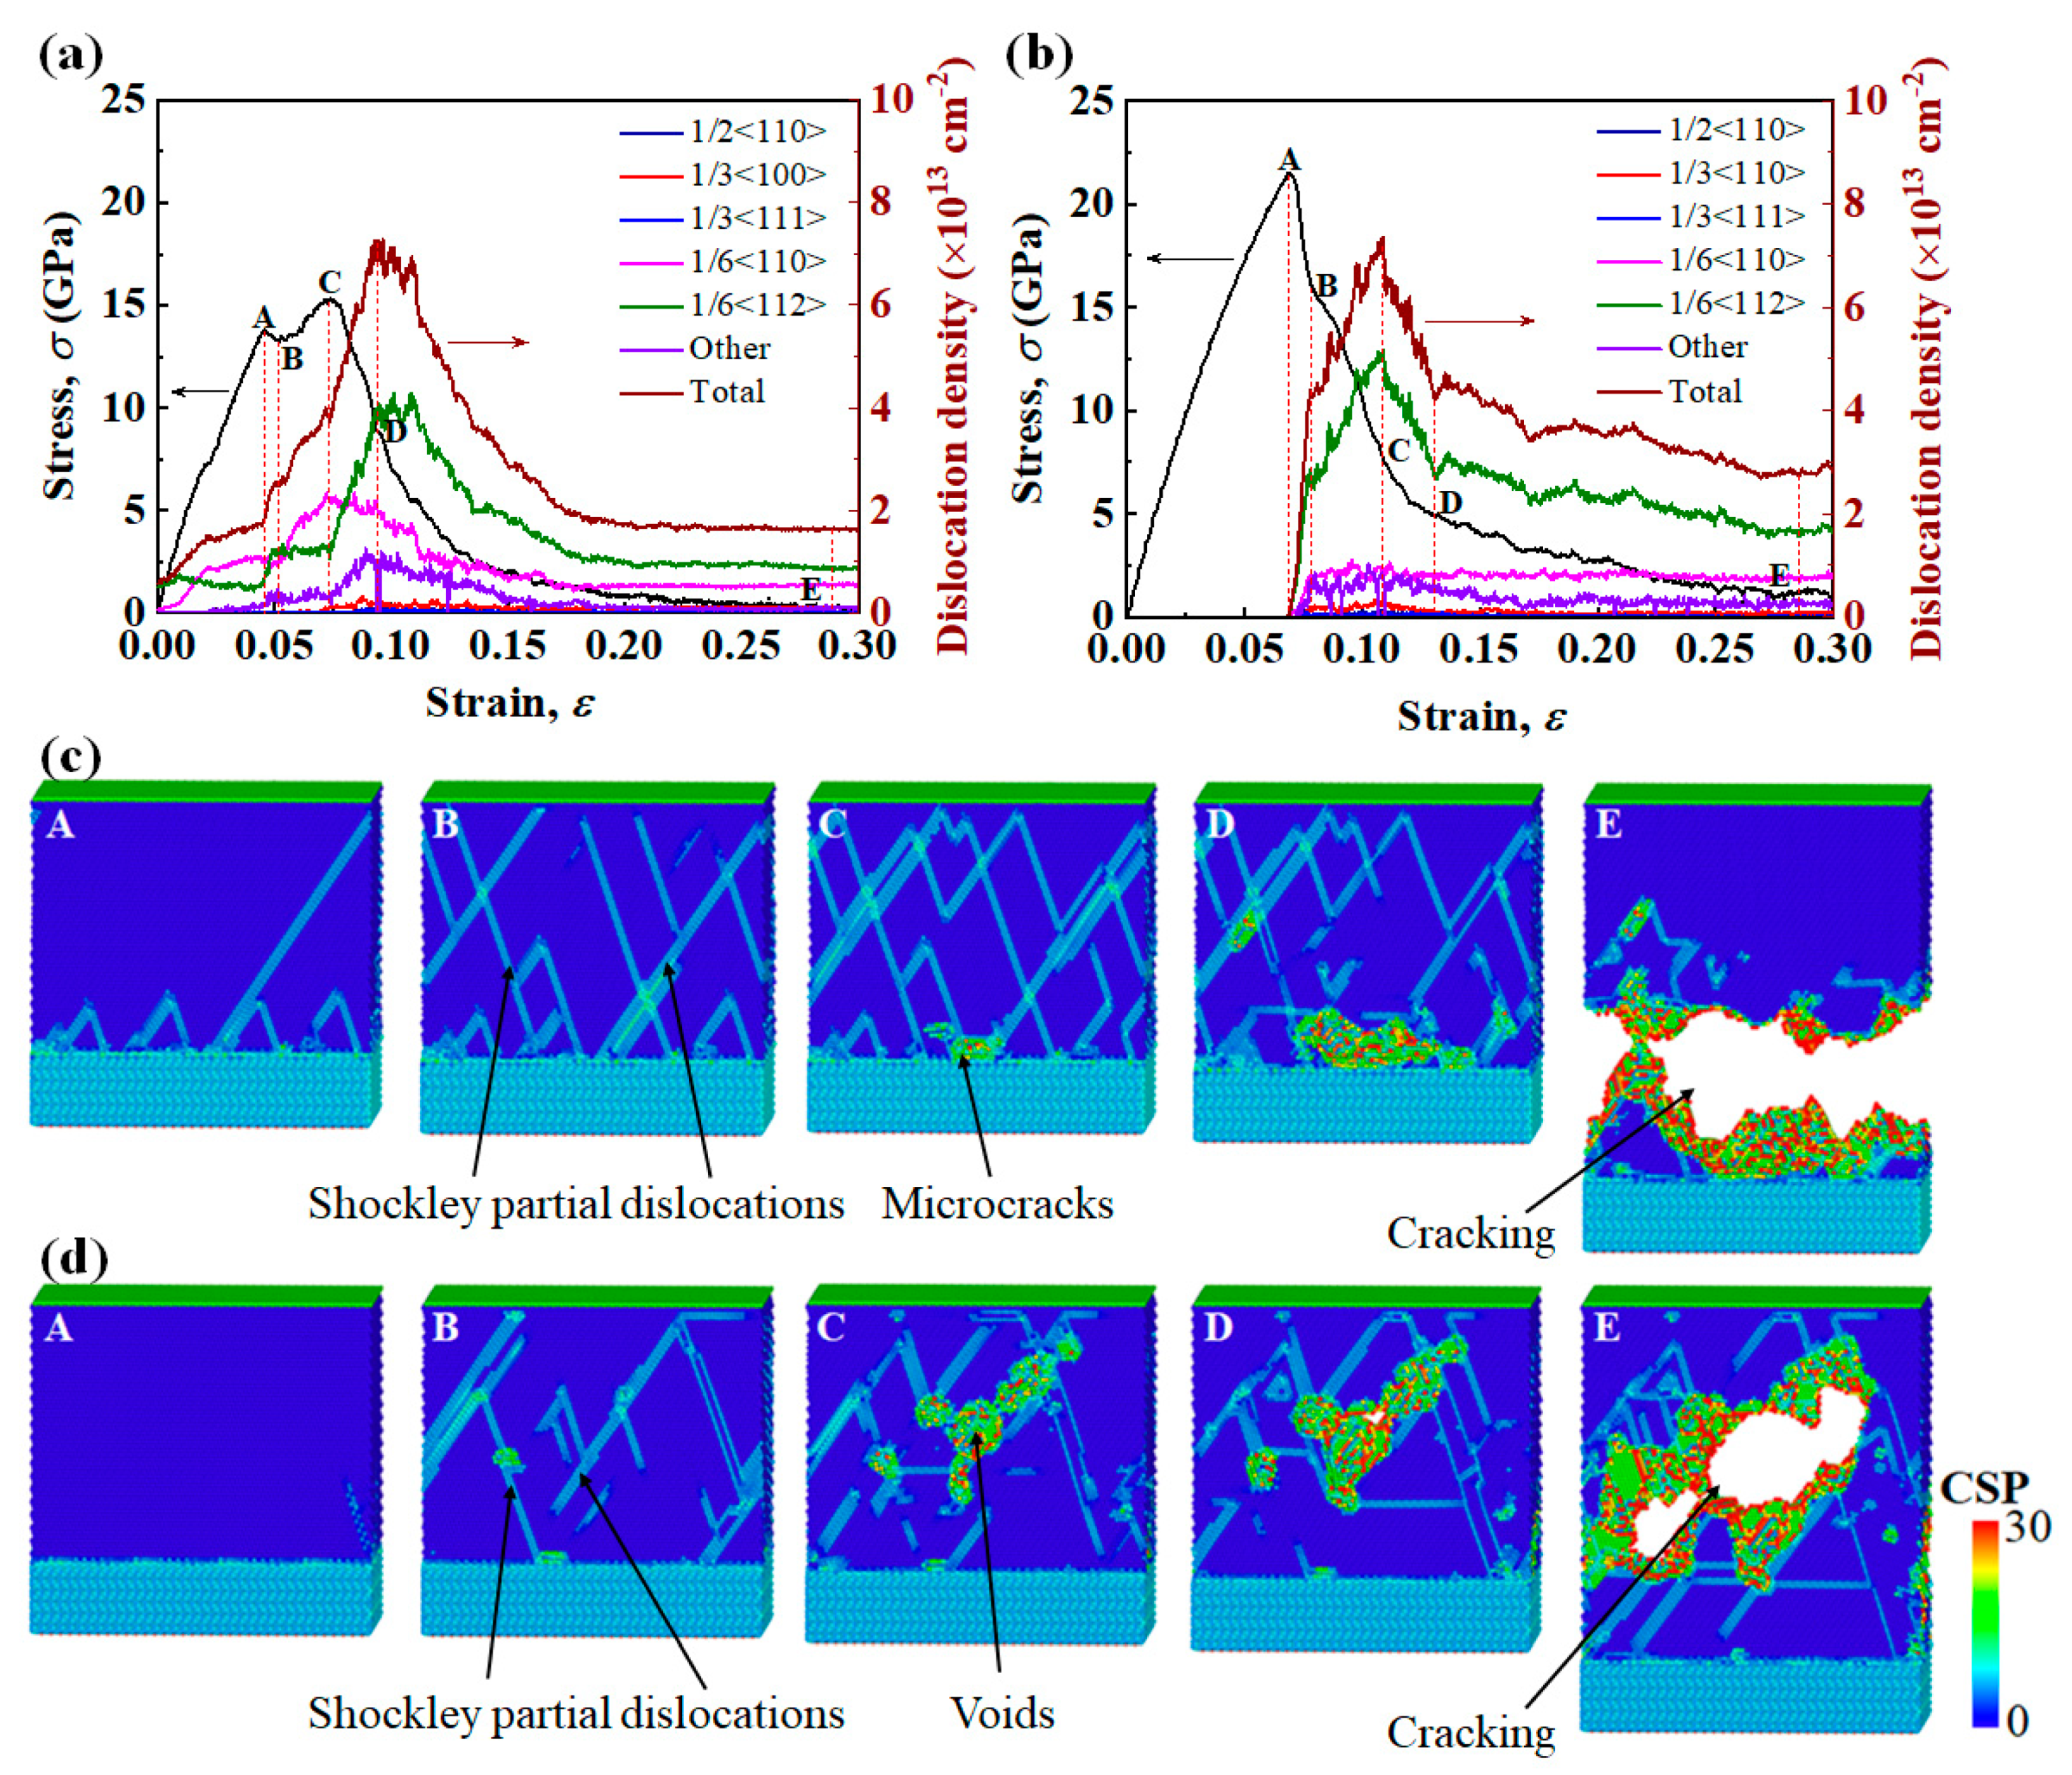
The two equilibrium interface systems were subjected to tensile loading, and the simulated interface fracture behaviors show a strong dependence on the interface structure. For Type I interface samples, Figure 5a,c show (i) a stress drop at a strain of 0.045 (point A to point B), which coincides with the nucleation of Shockley partial dislocations (1/6<112>) from the interface into the Ni layer, and (ii) strain hardening (point B to point C), which is mainly attributed to the following dislocation reaction: . Lomer–Cottrell (L-C) locks effectively obstruct the movement of mobile dislocations on the slip plane. (iii) At the yield strength of 15.31 GPa (point C), microcracks appear at the Ni/Al2O3 interface and stress begins to drop. As the microcracks propagate to form new free surfaces, a large quantity of dislocations escape from the free surfaces, and dislocation density begins to decrease (point D). (iv) Finally, the interface system is completely separated from the vicinity of the Ni/Al2O3 interface.
For Type II interface samples, Figure 5b,d show (i) in the initial elastic deformation stage, the stress increases linearly with increasing strain, and the yield strength reaches 21.46 GPa at strain of 0.070 (point A in Figure 5b). The existence of transition layer in Type II interface increases the number of stable Ni-O bonds at the interface, so of Type II interface samples is 40% higher than that of Type I interface samples. (ii) With the increase in strain, Shockley partial dislocations (1/6<112>) nucleate at the free surface of the metal layer, and the dislocation density increases significantly (point A to point B in Figure 5b). (iii) With the slipping of Shockley partial dislocations, the dislocation density saturates, and voids begin to grow within the metal (point C in Figure 5d). (iv) As strain increases further, the voids coalesce to form cracks. Finally, the interface system is separated from the middle of the metal layer (point E in Figure 5d). This fracture mode indicates that in the Ni(111)/Al2O3(0001) interface system containing the interfacial transition layer, the metal rather than the interface becomes the “weak” link.
3.4. Effect of Strain Rate
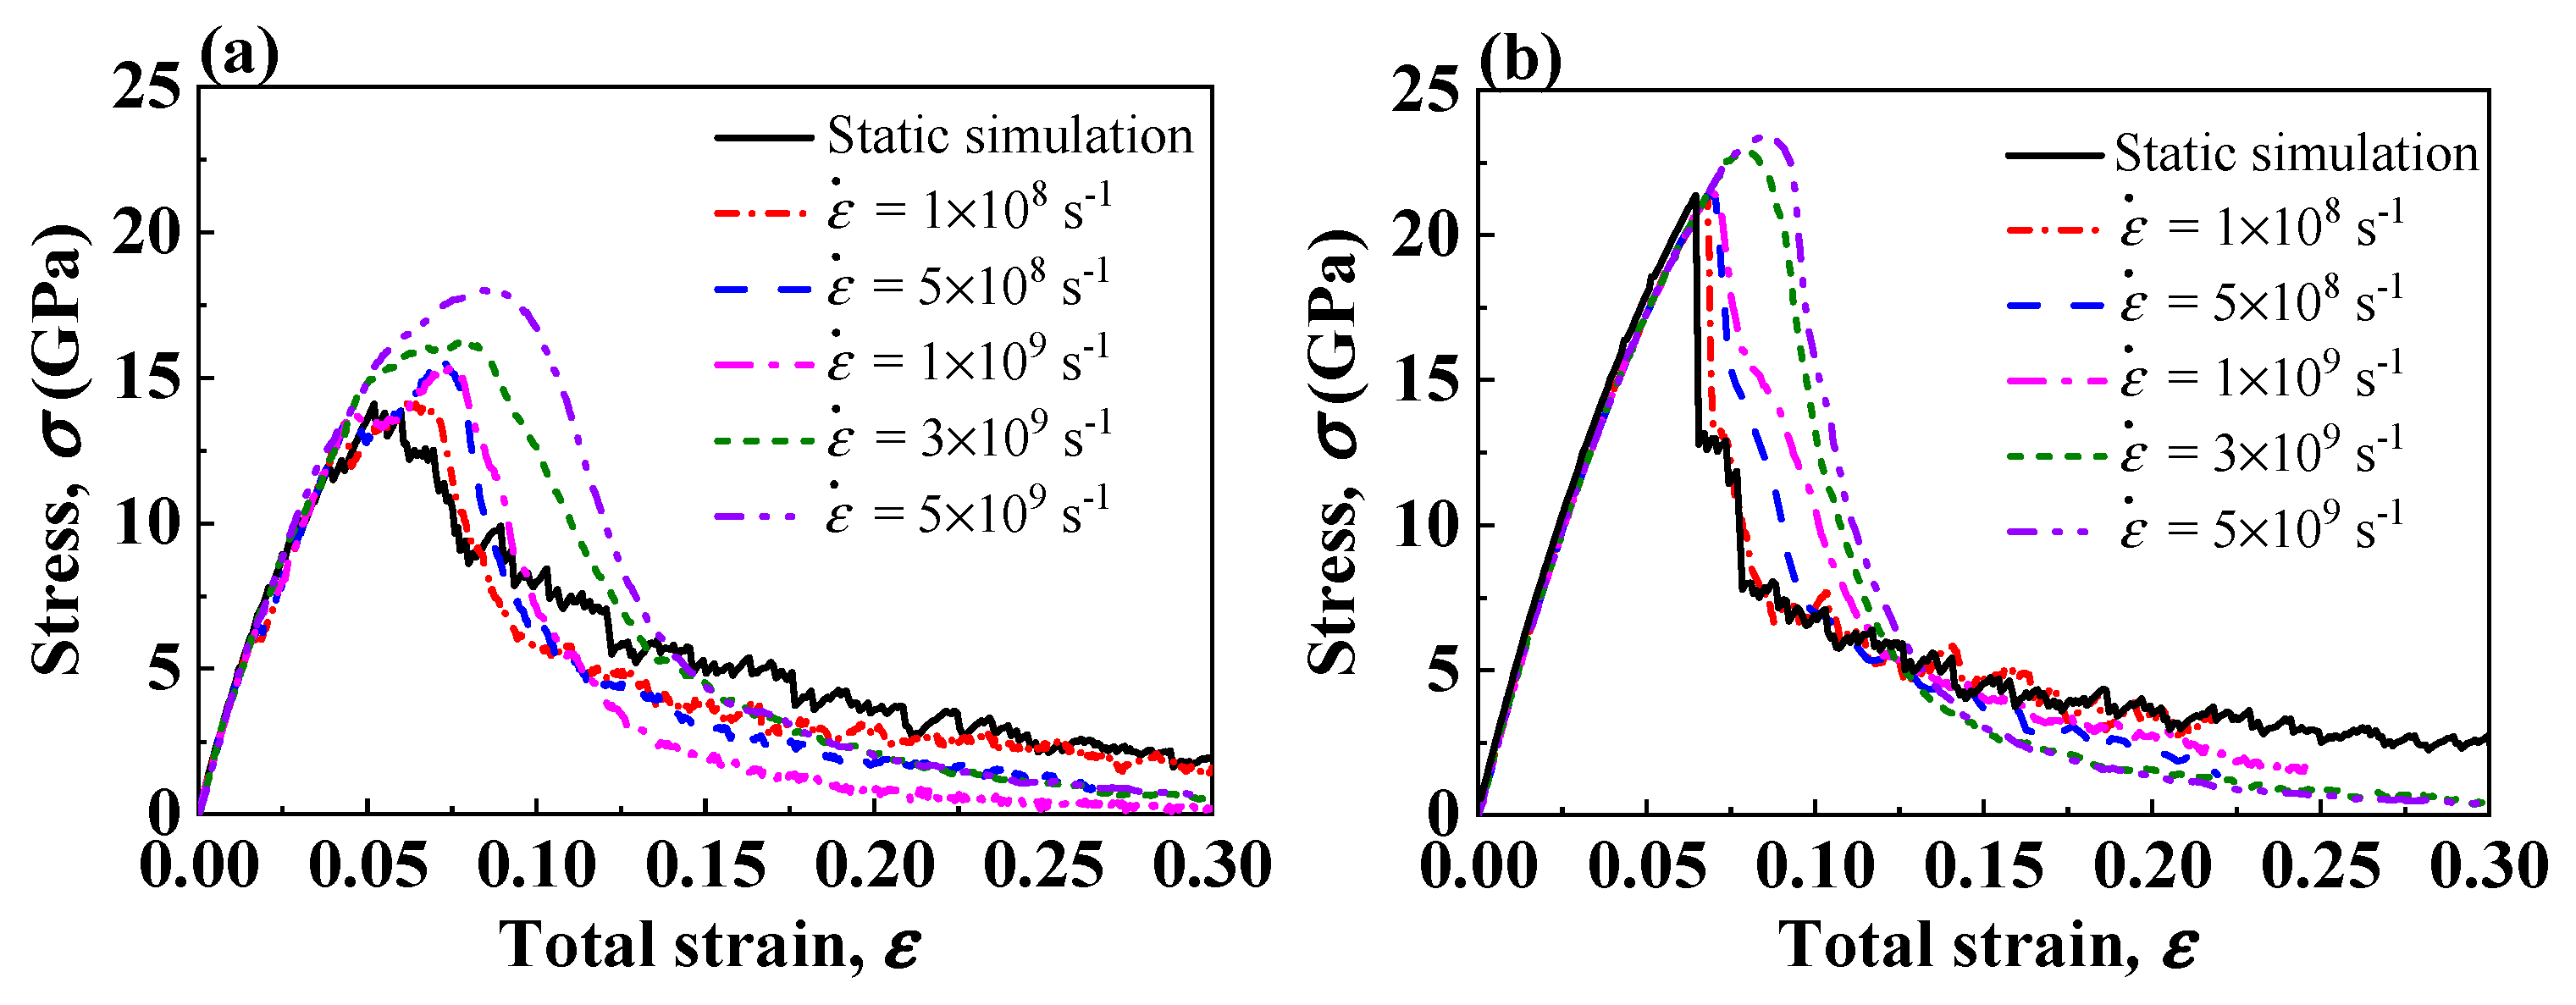
Figure 6a,b show the stress–strain curves for Type I and Type II interface samples under different strain rates. In the initial elastic deformation stage, the stress–strain responses are basically the same, indicating the elastic modulus of the interface system are irrelevant to the strain rate. When the deformation enters plastic stage, the stress–strain curves show strain rate dependence. The Type II interface systems show the yield strengths are insensitive to the strain rate unless the strain rate reaches . At a higher strain rate, the dislocation segments cannot propagate fast enough to accommodate the increasing strain, and the stress rises to stimulate the dislocation propagation [58]; thus, the high strain rate in molecular dynamic simulations may cause an overestimation of the yield strength. Note that for both Type I and Type II interface samples, the interface strengths by static simulation, i.e., a quasi-static tensile test, are comparable to the interface strengths by dynamic simulation at the strain rate of , indicating that atoms are allowed to fully relax during the tensile deformation at this strain rate. Moreover, when the strain rate is higher than , the strain hardening phenomenon after the first stress peak in Type I interface samples disappears. At such high strain rates, dislocations cannot propagate sufficiently, and the probability of dislocation reaction decreases, so the formation of L-C locks in metal is suppressed.
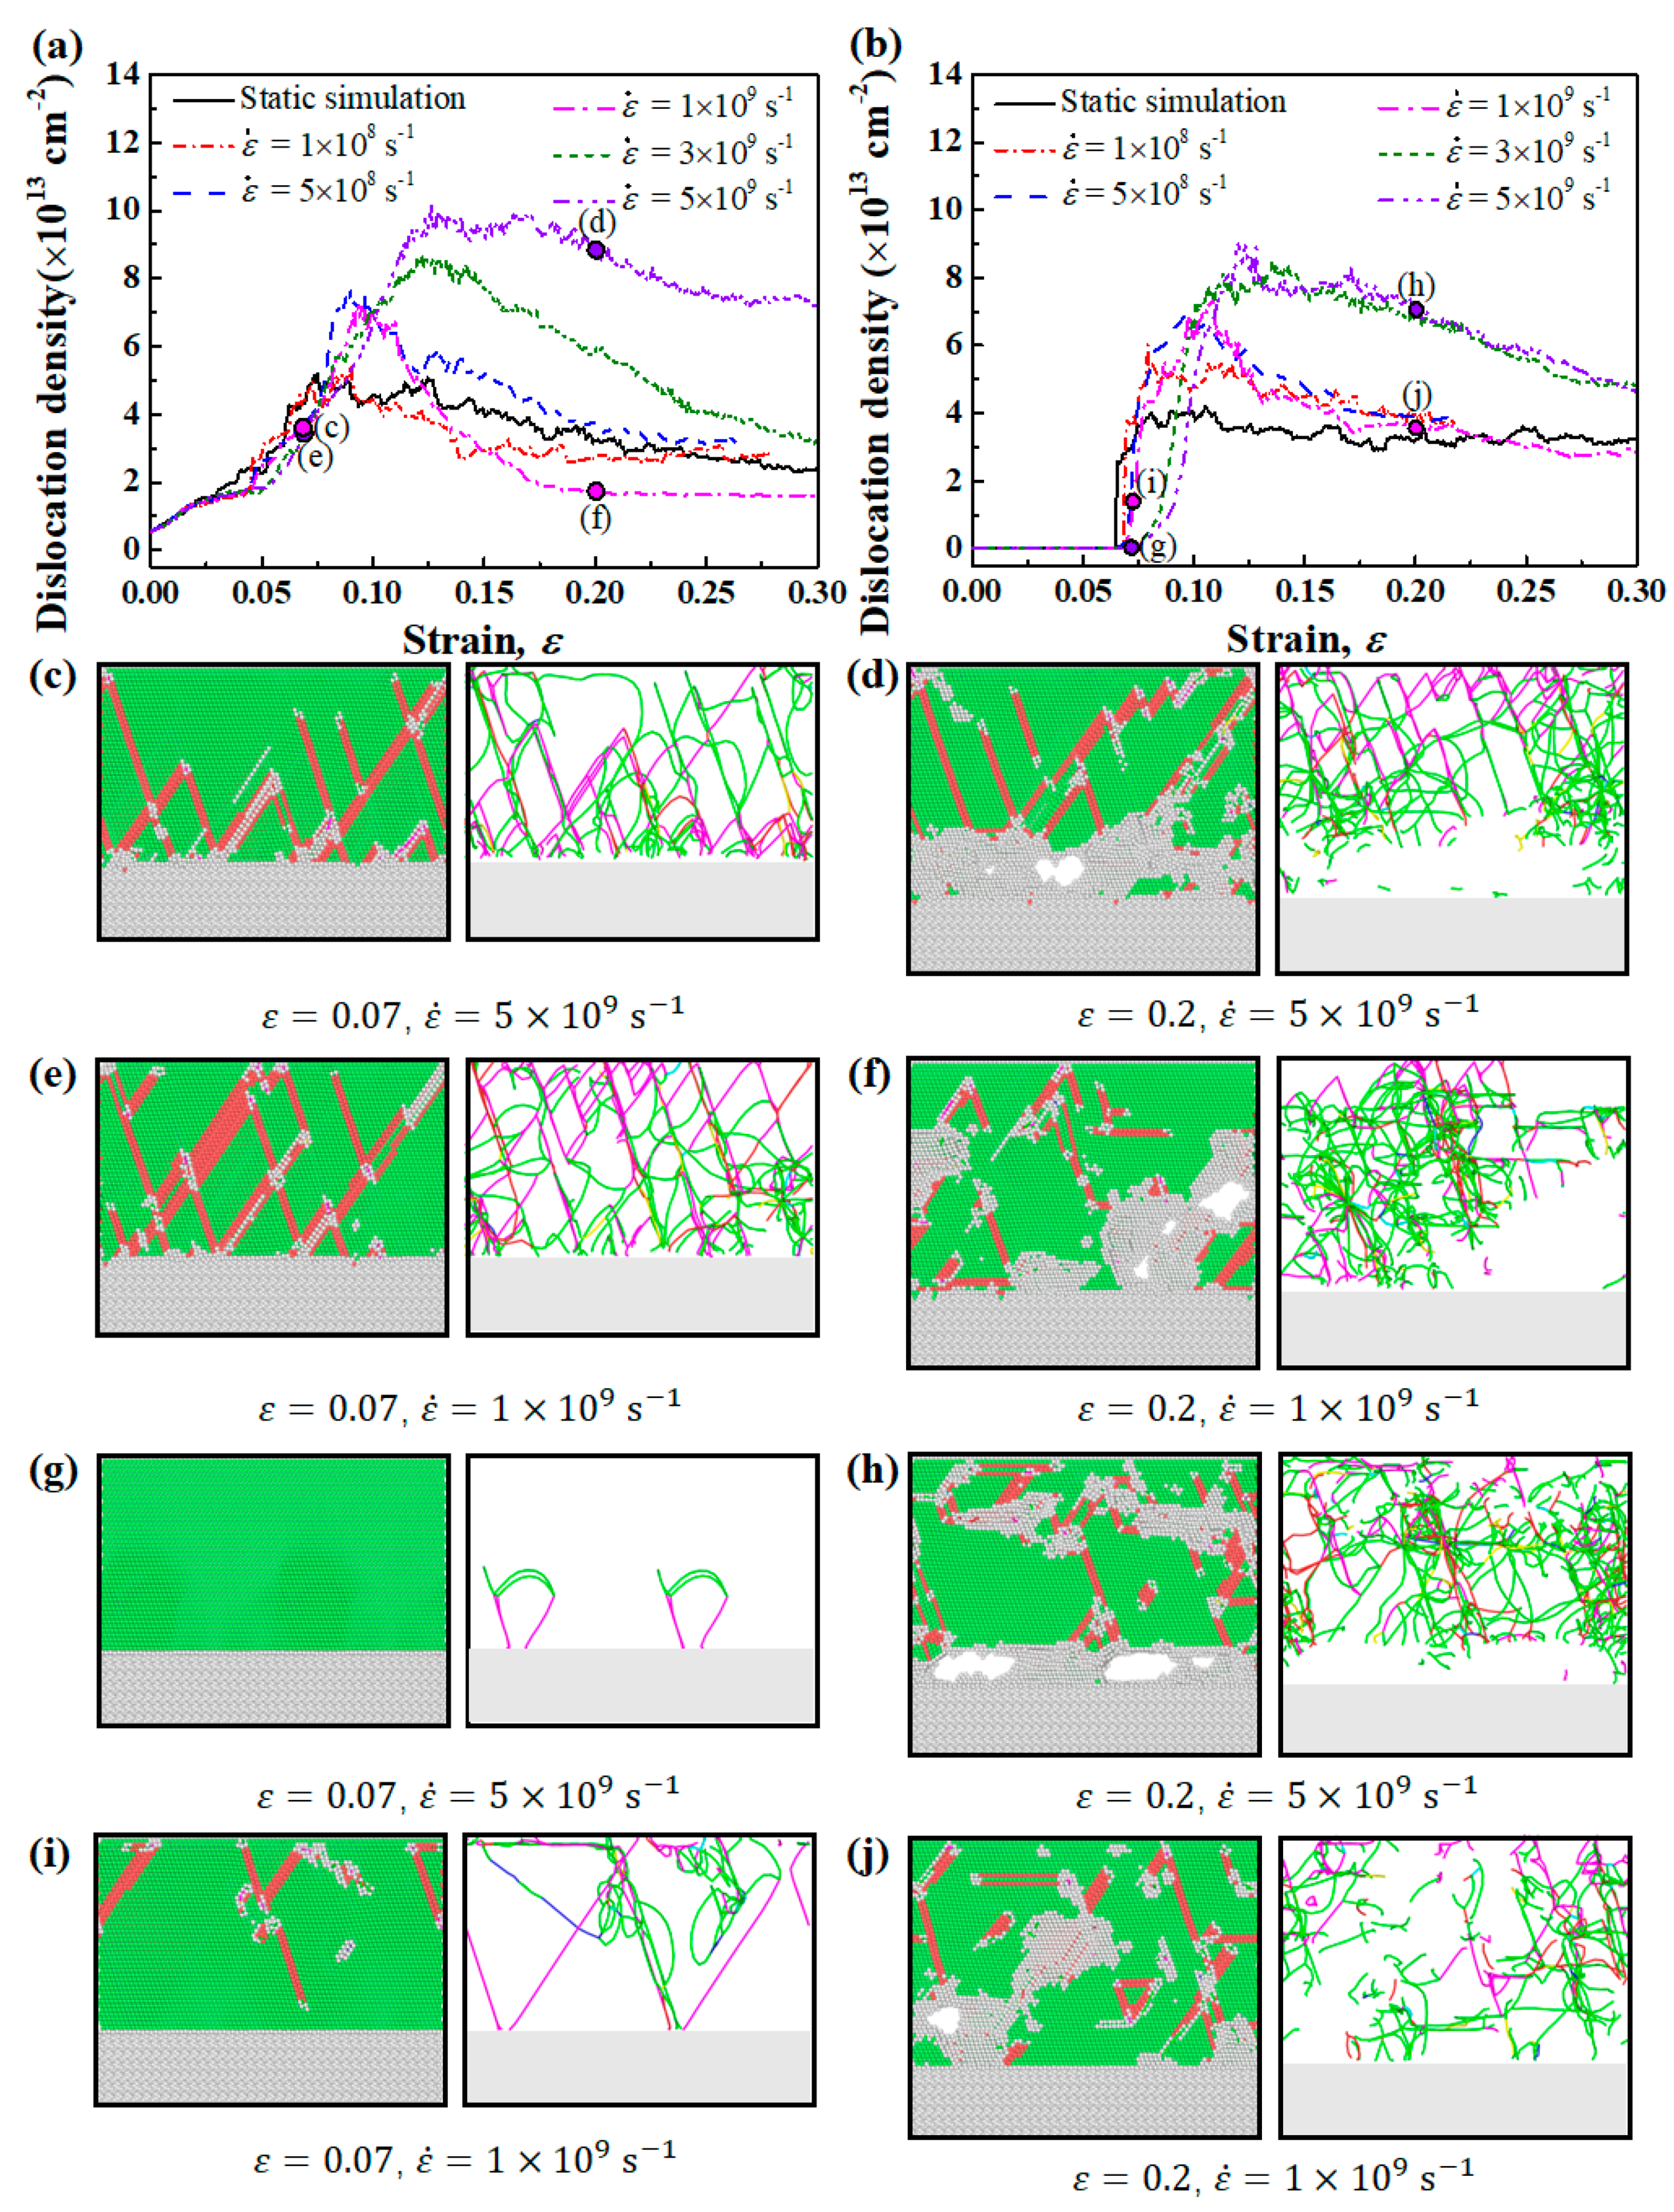
To discover the effect of strain rate on the formation and propagation of dislocations, the dislocation density of Type I and Type II Ni(111)/Al2O3(0001) interfaces at different strain rates were computed and plotted in Figure 7a,b. The dislocation density was calculated as the total length of dislocation line in a unit volume. The corresponding microstructures and dislocation distribution maps extracted by means of DXA at strains of 0.07 and 0.2 were drawn in Figure 7c–j. For both Type I and Type II interface samples, the maximum dislocation density increases with the increase in strain rate, demonstrating that higher strain rate can promote the proliferation of dislocations. As the strain rate increases, dislocations do not have sufficient time to return to the low energy state or escape from the free surfaces formed by cracks. Therefore, the annihilation of dislocations is suppressed, and the dislocation network becomes less deformed, as shown by the more homogeneous distributed dislocation lines in Figure 7d than those in Figure 7f.
Unlike the continuous increase in dislocation density in Type I interface samples, the dislocation density in Type II interface samples increases sharply when the strain reached a critical value where Shockley partial dislocations begin to nucleate at the interface. As the strain rate increases, the critical strain at which the dislocation begins to form also increases, demonstrating that the formation of Shockley dislocations at the interface is delayed, as shown by the lower dislocation density in Figure 7g than that in Figure 7i. This restriction effect of high strain rate on dislocation emission at the interface can lead to the continuous accumulation of local stress near the interface, which is manifested as an increase in yield strength [59].
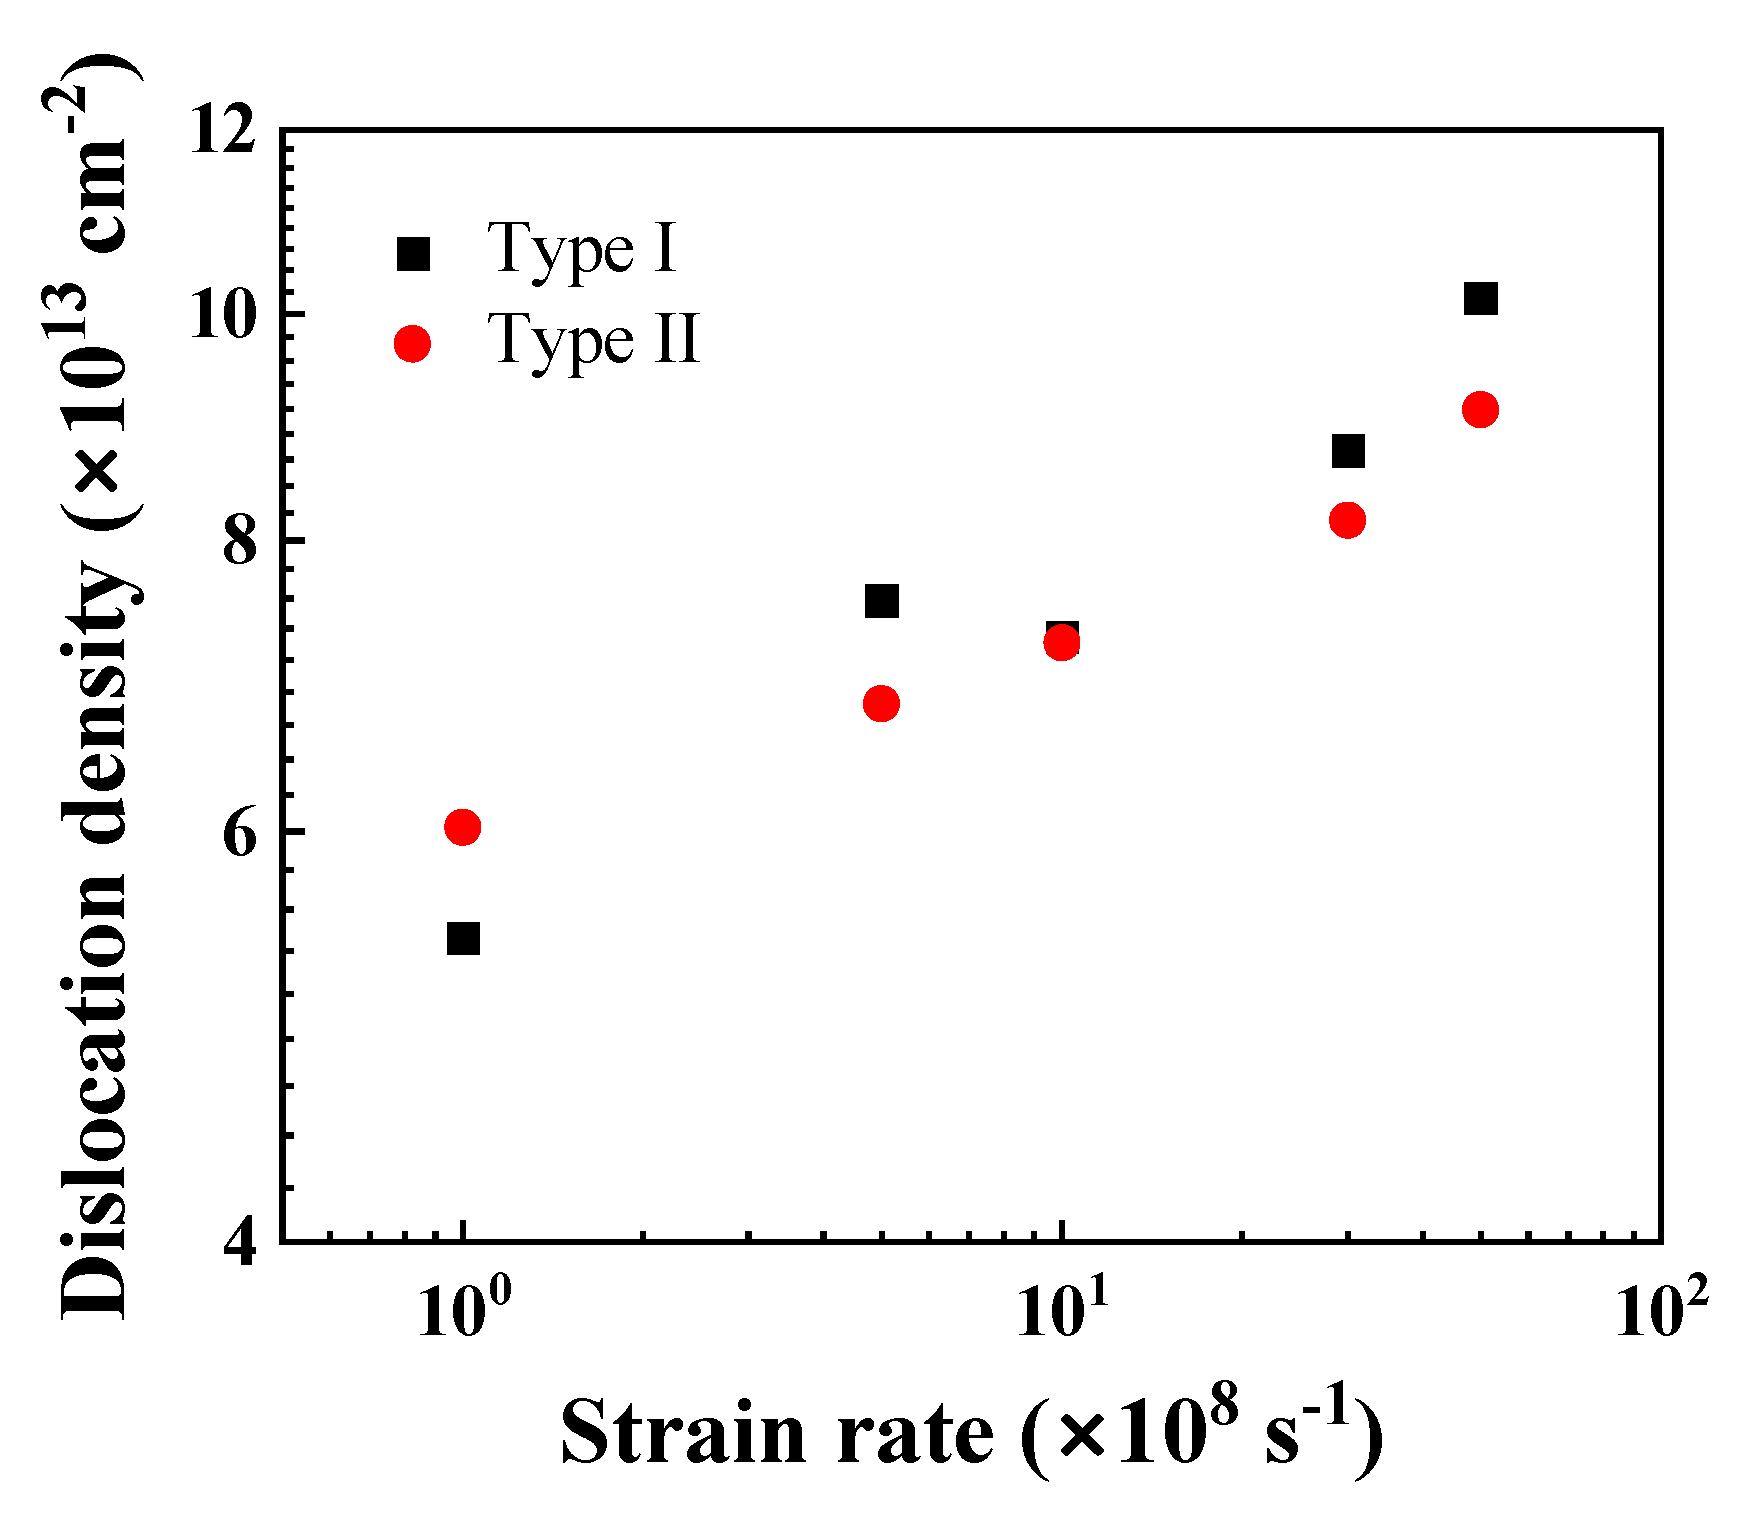
Figure 8 shows the variation of the saturated dislocation density of the Ni/Al2O3 interface systems under different strain rates. For both Type I and Type II interface samples, the saturated dislocation density increases almost exponentially with the increase in strain rate, indicating rate-dependent plasticity under high strain rates [60]. Since the local re-arrangement at a Type I interface increases the number of dislocation nuclei, the dislocation density of Type I interface samples appears to be higher than that of the Type II interface samples. Note that there is no twinning phenomenon for the high value of strain rate, which differs from the twinning-induced crack kinking out of a metal–ceramics interface [61].
At the nanometer length scale, an MD-based nucleation model has been used to predict the flow stress in nanopillars, metallic multilayers, and ceramic–metallic multilayer composites [18,62,63,64]. Based on the nucleation theory, the following constitutive equation for flow stress in nano-layers was derived [63]:
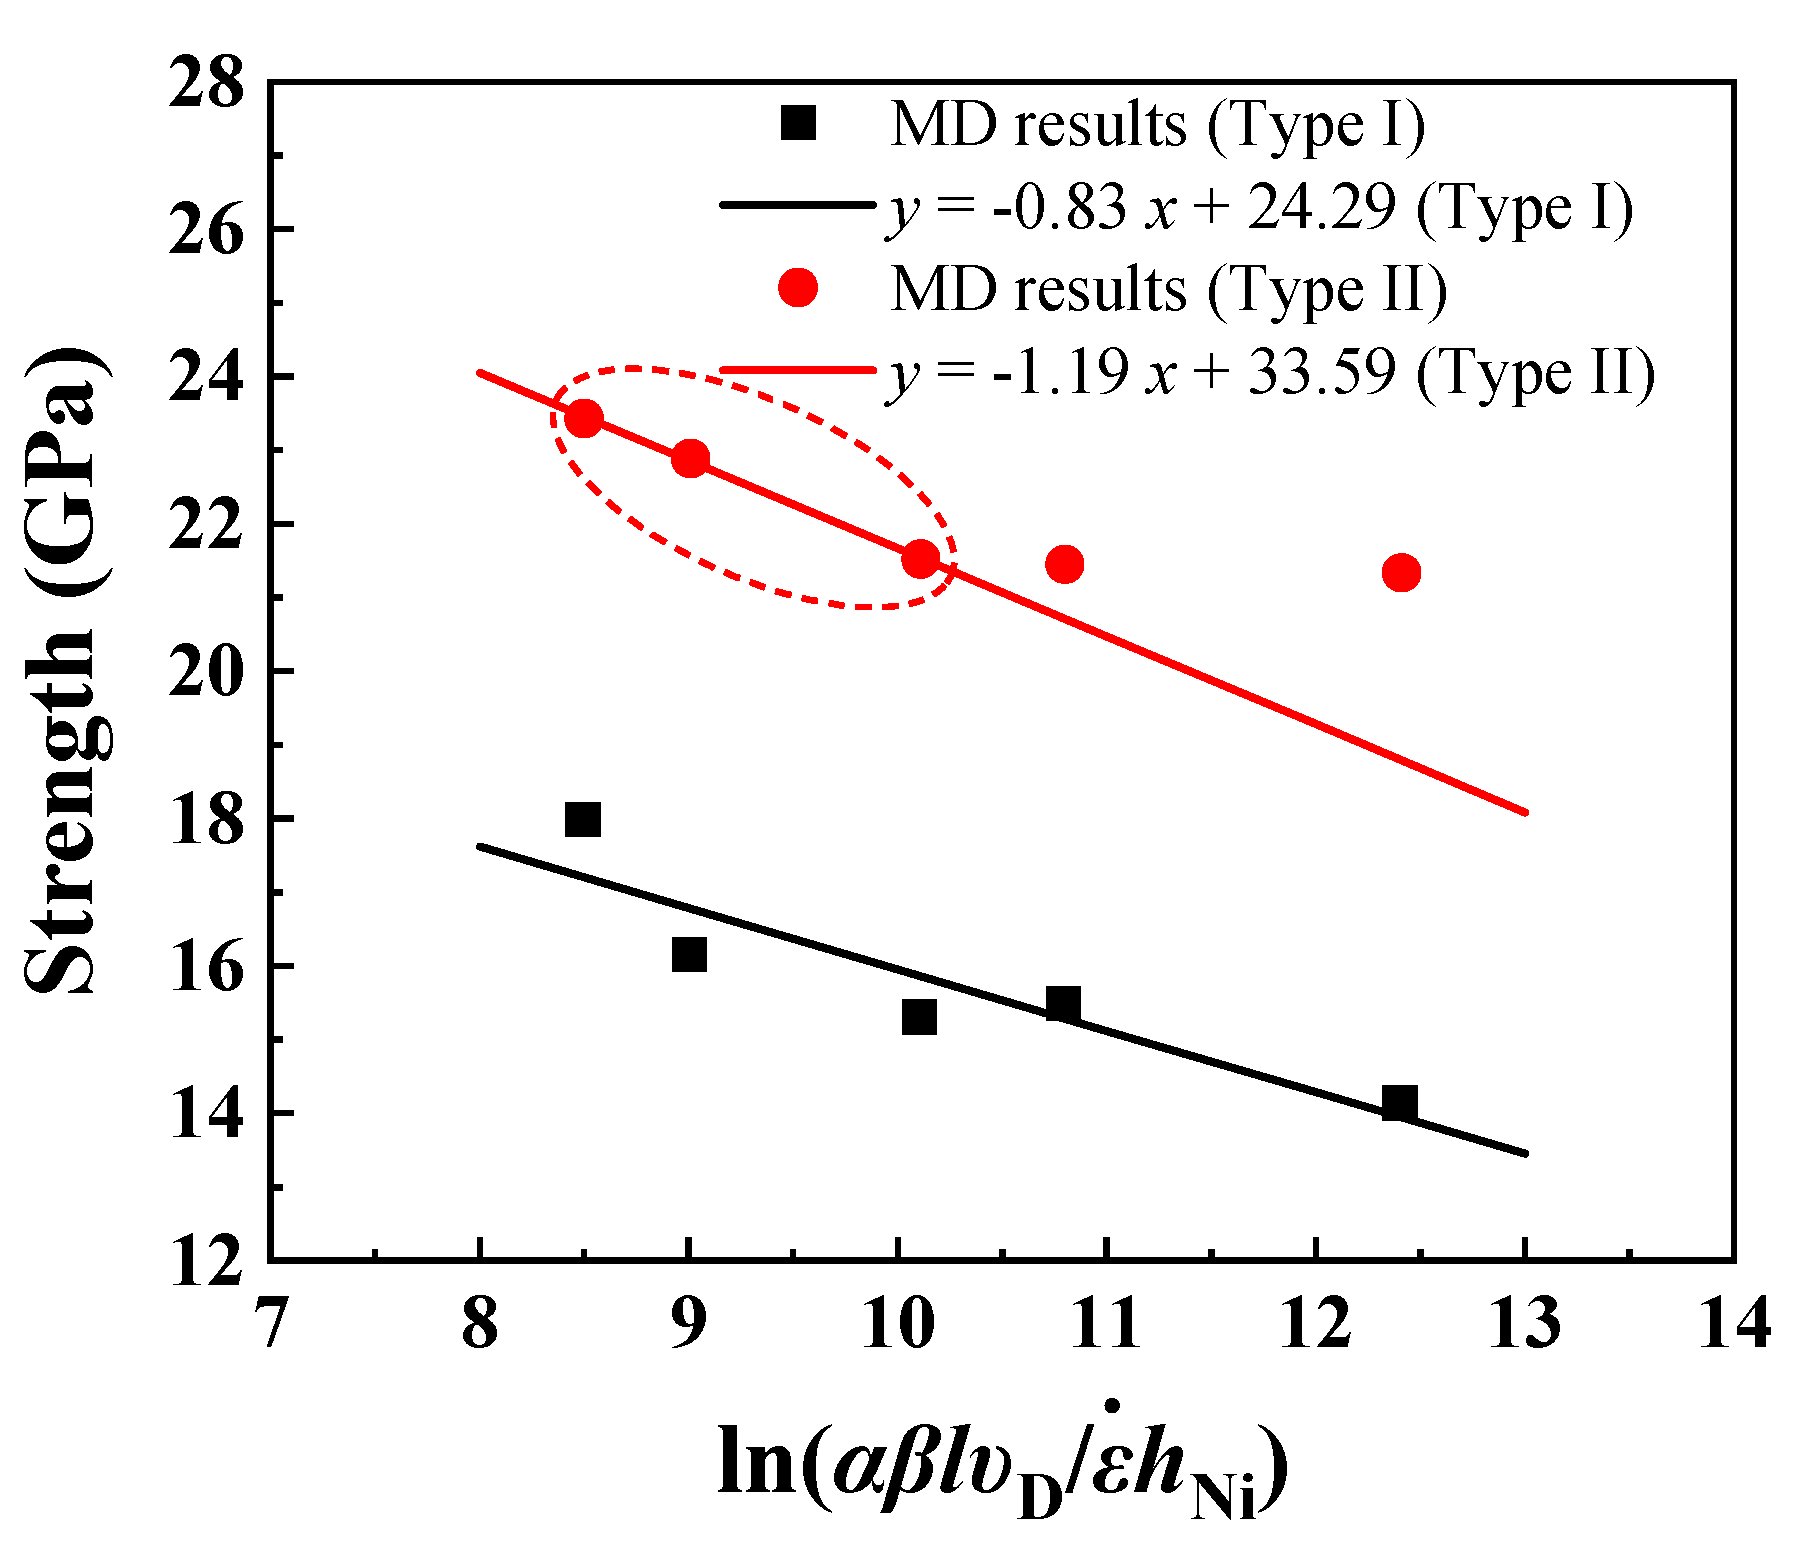
where is the athermal stress for the dislocations to nucleate. The prefactor has a stress unit and incorporates the effect of thermal fluctuations on the nucleation stress reduction. The activation parameters can be found by fitting Equation (5) with stress vs. strain rate results from MD simulations at a temperature of 1K as shown in Figure 9 (, , , and nm for Type I interface samples and nm for Type II interface samples). Considering that the yield strength of Type II interface samples is sensitive to the strain rate when the strain rate is higher than , MD results of Type II interface samples at strain rates of , , and were used for fitting. The athermal stress, thermal prefactor, and calculated activation parameters for Type I and Type II interface samples are summarized in Table 3.
At temperature as low as 1K, the effect of thermal fluctuations is negligible. The calculated nucleation stresses can be used as an approximate value of the athermal nucleation stress of the Al-terminated Ni(111)/Al2O3(0001) interface system. of type II interface samples is higher than that of type I interface samples, due to the increased effective interface area (stable Ni on O site) and stronger interface adhesion. The calculated activation volumes at 1K are two orders of magnitude lower than those computed for nucleation at room temperature from the interface in nanoscale metallic multilayers ( [63]) and ceramic-metallic multilayer composites ( [18]). Physically, the activation volume is proportional to the number of atoms involved in a thermally activated process, and decreases as the temperature decreases [65,66]. Note that in Equation (5) is a constant that accounts for the possible emission sites and depends on the interface structure. For example, in the Type I Ni(111)/Al2O3(0001) interface, those atoms that form the periodically buckled structures are the most probable sites for dislocation nucleation. Since is embedded in the logarithmic term, variation of by several order of magnitude causes little change to the activation volume. Further calculations show that changing from 0.4 to 1 results in a 0.08% change in the activation volume. Although an MD-based nucleation model has be used to predict the flow stress of quasistatic nanoscale experiments with strain rates at least 10 orders of magnitude lower than MD simulations [18,62], the MD results at high strain rate (108/s to 109/s) are usually higher than the nucleation model. This is partly because high strain rate in MD simulations may cause an overestimation of the yield strength. Moreover, the predicted yield strength by the nucleation model is usually higher compared with experiments at low strain rates since the MD simulations did not include initial defects inside the lattice such as voids and pre-existing dislocations.
4. Discussion
In this work, we provide the direct observation of nucleation, motion, and reaction of dislocations during tensile fracture of Ni(111)/Al2O3(0001) interfaces. The study demonstrates a correlation between interface structure, dislocation motion, and flow stress interdependencies. For Type I interface structures where the misfit plane is located at the first monolayer of metal side, the relatively large misfit between nickel and sapphire causes the interfacial Ni layers buckles in regions of weaker atomic interactions, i.e., the Ni on Al sites and Ni on hollow sites [26]. This interface reconstruction not only reduces the number of stable Ni-O bonds by nearly 40% but also increases the distance of Ni-O bonds (2.25 ) compared with the Type II interface structure where a translation layer exists between the misfit plane and sapphire. These local re-arrangement regions in Type I interfaces become the natural sources of Shockley partial dislocations under tensile load and increase the dislocation density as well as the strength of dislocation–dislocation interactions. On the contrary, the trigonal structure of Type II interface is rearranged as a combination of a regular triangle and an irregular hexagon, and the Ni-O distance is 1.95 . This regular interface structure makes the Type II interface a strong link, and mobile dislocations “burst” when the strain reaches a critical value. Compared with Type I interface structure, the fracture behaviors of Type II interface structure appear to be more brittle with abrupt stress drop. It is interesting to observe that the two types of interface structures both show strong rate-dependent plasticity, though the tensile failure mechanisms differ. The saturated dislocation density increases almost exponentially with the increase in strain rate. In atomistic simulations subjected to high strain rate (1 108 s−1 to 5 109 s−1), crystal strength may be over-predicted [60], and interface systems yield through mechanisms that are qualitatively different from those of bulk metals.
The methodological choices in this work were constrained by the differences between experimental conditions and simulation models in terms of model structure and loading conditions. Single crystalline models of both Ni and Al2O3 were used for simplicity. However, in thermal barrier coatings, Ni and Al2O3 are polycrystals in which grain boundary can play an important role on defect formation and hindering. Dislocation pile-up at the grain boundary makes the material harder to deform [67,68] and thus may increase interface fracture toughness. As grain sizes increase, the grain boundary acts as a source of imperfect or partial dislocations. The interaction between the propagating dislocations and the deposited and misfit dislocations may cause higher dislocation density and different hardening mechanism with the single crystalline Ni/Al2O3 interface models.
Given the complexity of the spalling process of thermal barrier coatings, the fracture of the Ni/Al2O3 interface is usually in mixed mode. This work investigated the mode I fracture to identify and quantify the major properties affecting the adhesion and fracture toughness of the Ni/Al2O3 interface. Compared with tensile failure, the interface strength corresponding to shear failure is generally lower [57], indicating less energy is required for interface shear failure. Moreover, atomistic simulations showed the shear failure of metal/ceramic interfaces was accompanied by the slip of misfit dislocation network (MDN) along the interface [46,69]. The energy barrier for MDN slip is lower than that of dislocation motion in metal. Therefore, mode I fracture was studied to investigate the plastic dissipation accompanying interface separation.
5. Conclusions
The present work investigated the plastic deformation mechanisms of two kinds of Ni/Al2O3 interface systems using MD simulations. The results show that for an interface with periodic buckling of the terminating Ni layer, the formation of Lomer–Cottrell locks in metal causes strain hardening. For an interface with a regular reconstructed terminating Ni layer, a higher number of chemically stable Ni-O bonds at the interface causes higher yield strength than Model I, and the interface systems is separated from within the metal layer. Both models exhibit strain rate effects similar to those of nickel-based superalloys under high strain rates (). The plastic deformation of metal is closely associated with the interface dislocation structures, and it influences the crack behavior and mechanical property of Ni/Al2O3 interfaces significantly. Note that there is no twinning phenomenon in the propagation of the microcracks on both Type I and Type II interfaces. Perhaps the high dislocation density (>5 1017 m−2) and homogenous dislocation distribution in single crystal nickel suppress the formation of twinning. This study can help researchers better understand the role of interface structure and plastic deformation on the mechanical properties of the Ni/Al2O3 interface at extreme conditions.
Funding
This work was supported by the Shenzhen Post-doctoral Funding (E29105).
Data Availability Statement
All data are contained within the article.
Acknowledgments
The author acknowledges the support from SIEM’s HPC facility for all the simulations reported in this work.
Conflicts of Interest
The author declares no conflict of interest. The funders had no role in the design of the study; in the collection, analyses, or interpretation of data; in the writing of the manuscript; or in the decision to publish the results.
References
- Evans, A.G.; Mumm, D.R.; Hutchinson, J.W.; Meier, G.H.; Pettic, F.S. Mechanisms controlling the durability of thermal barrier coatings. Prog. Mater. Sci. 2001, 46, 505–553. [Google Scholar] [CrossRef]
- Kumar, V.; Kandasubramanian, B. Processing and design methodologies for advanced and novel thermal barrier coatings for engineering applications. Particuology 2016, 27, 1–28. [Google Scholar] [CrossRef]
- Peters, M.; Leyens, C.; Schulz, U.; Kaysser, W.A. EB-PVD thermal barrier coatings for aeroengines and gas turbines. Adv. Eng. Mater. 2001, 3, 193–204. [Google Scholar] [CrossRef]
- Smith, J.; Scheibel, J.; Classen, D.; Paschke, S.; Elbel, S.; Fick, K.; Carlson, D. Thermal barrier coating validation testing for industrial gas turbine combustion hardware. J. Eng. Gas Turbines Power-Trans. Asme 2016, 138, 031508. [Google Scholar] [CrossRef]
- Tailor, S.; Singh, M.; Doub, A.V. Synthesis and characterization of yttria-stabilized zirconia (YSZ) nano-clusters for thermal barrier coatings (TBCs) applications. J. Clust. Sci. 2016, 27, 1097–1107. [Google Scholar] [CrossRef]
- Boissonnet, G.; Bonnet, G.; Pasquet, A.; Bourhila, N.; Pedraza, F. Evolution of thermal insulation of plasma-sprayed thermal barrier coating systems with exposure to high temperature. J. Eur. Ceram. Soc. 2019, 39, 2111–2121. [Google Scholar] [CrossRef]
- Zhang, W.; Smith, J.R.; Wang, X.G.; Evans, A.G. Influence of sulfur on the adhesion of the nickel/alumina interface. Phys. Rev. B 2003, 67, 245414. [Google Scholar] [CrossRef]
- Shi, S.; Tanaka, S.; Kohyama, M. First-principles investigation of the atomic and electronic structures of α-Al2O3(0001)/Ni(111) Interfaces. J. Am. Ceram. Soc. 2007, 90, 2429–2440. [Google Scholar] [CrossRef]
- Bao, Z.; Guo, X.; Shang, F. An atomistic investigation into the nature of fracture of Ni/Al2O3 interface with yttrium dopant under tension. Eng. Fract. Mech. 2015, 150, 239–247. [Google Scholar] [CrossRef]
- Guo, X.; Shang, F. Reinvestigation of the tensile strength and fracture property of Ni(111)/α-Al2O3(0001) interfaces by first-principle calculations. Comput. Mater. Sci. 2011, 50, 1711–1716. [Google Scholar] [CrossRef]
- Wang, X.G.; Smith, J.; Evans, A. Phase diagram for the Ni/Al2O3 interface and relationships to adhesion. Phys. Rev. B 2006, 74, 081403. [Google Scholar] [CrossRef]
- Wei, Y.; Hutchinson, J.W. Toughness of Ni/Al2O3 interfaces as dependent on micron-scale plasticity and atomistic-scale separation. Philos. Mag. 2008, 88, 3841–3859. [Google Scholar] [CrossRef]
- Gupta, P.; Pal, S.; Yedla, N. Molecular dynamics based cohesive zone modeling of Al (metal)–Cu50Zr50 (metallic glass) interfacial mechanical behavior and investigation of dissipative mechanisms. Mater. Des. 2016, 105, 41–50. [Google Scholar] [CrossRef]
- Salehinia, I.; Wang, J.; Bahr, D.F.; Zbib, H.M. Molecular dynamics simulations of plastic deformation in Nb/NbC multilayers. Int. J. Plast. 2014, 59, 119–132. [Google Scholar] [CrossRef]
- Sazgar, A.; Movahhedy, M.R.; Mahnama, M.; Sohrabpour, S. A molecular dynamics study of bond strength and interface conditions in the Al/Al2O3 metal–ceramic composites. Comput. Mater. Sci. 2015, 109, 200–208. [Google Scholar] [CrossRef]
- Zhou, Y.; Yang, W.; Hu, M.; Yang, Z. The typical manners of dynamic crack propagation along the metal/ceramics interfaces: A molecular dynamics study. Comput. Mater. Sci. 2016, 112, 27–33. [Google Scholar] [CrossRef]
- Damadam, M.; Shao, S.; Ayoub, G.; Zbib, H.M. Recent advances in modeling of interfaces and mechanical behavior of multilayer metallic/ceramic composites. J. Mater. Sci. 2017, 53, 5604–5617. [Google Scholar] [CrossRef]
- Damadam, M.; Shao, S.; Salehinia, I.; Ayoub, G.; Zbib, H.M. Molecular dynamics simulations of mechanical behavior in nanoscale ceramic–metallic multilayer composites. Mater. Res. Lett. 2017, 5, 306–313. [Google Scholar] [CrossRef]
- Florando, J.N.; El-Dasher, B.S.; Chen, C.; Swift, D.C.; Barton, N.R.; McNaney, J.M.; Ramesh, K.T.; Hemker, K.J.; Kumar, M. Effect of strain rate and dislocation density on the twinning behavior in tantalum. AIP Adv. 2016, 6, 045120. [Google Scholar] [CrossRef]
- Chen, J.; Mathaudhu, S.N.; Thadhani, N.; Dongare, A.M. Correlations between dislocation density evolution and spall strengths of Cu/Ta multilayered systems at the atomic scales: The role of spacing of KS interfaces. Materialia 2019, 5, 100192. [Google Scholar] [CrossRef]
- Thompson, C.B.; Randle, V.A. Study of twinning in nickel. Scr. Mater. 1996, 35, 385–390. [Google Scholar] [CrossRef]
- El-Danaf, E.; Kalidindi, S.R.; Doherty, R.D. Influence of grain size and stacking-fault energy on deformation twinning in fcc metals. Metall. Mater. Trans. A Phys. Metall. Mater. Sci. 1999, 30, 1223–1233. [Google Scholar] [CrossRef]
- Mahajan, S.; Bartlett, A.F. Influence of prior mechanical and thermal treatments on shock-induced substructures in molybdenum. Acta Metall. 1971, 19, 1111–1119. [Google Scholar]
- Boucher, N.A.; Christian, J.W. The influence of pre-strain on deformation twinning in niobium single crystals. Acta Metall. 1972, 20, 581–591. [Google Scholar] [CrossRef]
- Long, Y.; Chen, N.X. Interface reconstruction and dislocation networks for a metal/alumina interface: An atomistic approach. J. Phys. Condens. Matter 2008, 20, 135005. [Google Scholar] [CrossRef]
- Meltzman, H.; Mordehai, D.; Kaplan, W.D. Solid–solid interface reconstruction at equilibrated Ni–Al2O3 interfaces. Acta Mater. 2012, 60, 4359–4369. [Google Scholar] [CrossRef]
- Duffy, D.M.; Harding, J.H.; Stoneham, A.M. Atomistic modelling of the metal-oxide interfaces with image interactions. Acta Metall. Mater. 1992, 40, S11–S16. [Google Scholar] [CrossRef]
- Finnis, M.W. Metal-ceramic cohesion and the image interaction. Acta Metall. Mater. 1992, 40, S25–S37. [Google Scholar]
- Endou, A.; Teraishi, K.; Yajima, K.; Yokoyama, K. Potential energy surface and dynamics of Pd/MgO(001) system as investigated by periodic density functional calculations and classical molecular dynamics simulations. Jpn. J. Appl. Phys. 2000, 39, 4255–4260. [Google Scholar]
- Vervisch, W.; Mottet, C.; Goniakowski, J. Theoretical study of the atomic structure of Pd nanoclusters deposited on a MgO(100) surface. Phys. Rev. B 2002, 65, 245411. [Google Scholar] [CrossRef]
- Yao, Y.G.; Wang, T.C.; Wang, C.Y. Peierls-Nabarro model of interfacial misfit dislocation: An analytic solution. Phys. Rev. B 1999, 59, 8232–8236. [Google Scholar] [CrossRef]
- Zhang, Z.; Long, Y.; Cazottes, S.; Daniel, R.; Mitterer, C.; Dehm, G. The peculiarity of the metal-ceramic interface. Sci. Rep. 2015, 5, 11460. [Google Scholar] [CrossRef]
- Long, Y.; Chen, N.X. Atomistic simulation of misfit dislocation in metal/oxide interfaces. Comput. Mater. Sci. 2008, 42, 426–433. [Google Scholar] [CrossRef]
- Long, Y.; Chen, N.X. Pair potential approach for metal/Al2O3 interface. J. Phys. Condens. Matter 2007, 19, 196216. [Google Scholar] [CrossRef]
- Mishin, Y.; Farkas, D.; Mehl, M.J. Papaconstantopoulos, D.A. Interatomic potentials for monoatomic metals from experimental data and at initio calculations. Phys. Rev. B 1999, 59, 3393–3407. [Google Scholar] [CrossRef]
- Vitek, V.; Gutekunst, G.; Mayer, J.; Rühle, M. Atomic structure of misfit dislocations in metal-ceramic interfaces. Philos. Mag. A 1995, 71, 1219–1239. [Google Scholar] [CrossRef]
- Wang, J.; Hoagland, R.G.; Hirth, J.P.; Misra, A. Atomistic modeling of the interaction of glide dislocations with “weak” interfaces. Acta Mater. 2008, 56, 5685–5693. [Google Scholar] [CrossRef]
- Gall, K.; Horstemeyer, M.F.; Schilfgaarde, M.V.; Baskes, M.I. Atomistic simulations on the tensile debonding of an aluminum-silicon interface. J. Mech. Phys. Solids 2000, 48, 2183–2212. [Google Scholar] [CrossRef]
- Nosé, S. A molecular dynamics method for simulations in the canonical ensemble. Mol. Phys. 2006, 52, 255–268. [Google Scholar] [CrossRef]
- Hoover, W.G. Canonical dynamics: Equilibrium phase-space distributions. Phys. Rev. A 1985, 31, 1695–1697. [Google Scholar] [CrossRef]
- Pandre, S.; Mhatre, V.; Kotkunde, N.; Kumar, S.S. Strain hardening behavior of DP 590 steel using dislocation density based Kock-Mecking model. Mater. Today Proc. 2021, 46, 9323–9327. [Google Scholar] [CrossRef]
- Buzaud, E.; Lee, W.S.; Chou, C.W.; Cosculluela, A.; Couque, H.; Cadoni, E. Dynamic deformation behaviour and dislocation substructure of AZ80 magnesium alloy over a wide range of temperatures. EPJ Web Conf. 2018, 183, 03010. [Google Scholar]
- Keller, C.; Hug, E. Kocks-Mecking analysis of the size effects on the mechanical behavior of nickel polycrystals. Int. J. Plast. 2017, 98, 106–122. [Google Scholar] [CrossRef]
- Stechmann, G.; Zaefferer, S.; Raabe, D. Molecular statics simulation of CdTe grain boundary structures and energetics using a bond-order potential. Model. Simul. Mater. Sci. Eng. 2018, 26, 045009. [Google Scholar] [CrossRef] [Green Version]
- Taketomi, S.; Matsumoto, R.; Hagihara, S. Molecular statics simulation of the effect of hydrogen concentration on {112} edge dislocation mobility in alpha Iron. ISIJ Int. 2017, 57, 2058–2064. [Google Scholar] [CrossRef]
- Fu, X.Q.; Liang, L.H.; Wei, Y.G. Atomistic simulation study on the shear behavior of Ag/MgO interface. Comput. Mater. Sci. 2018, 155, 116–128. [Google Scholar] [CrossRef]
- Kelchner, C.L.; Plimpton, S.J.; Hamilton, J.C. Dislocation nucleation and defect structure during surface indentation. Phys. Rev. B 1998, 58, 11085–11088. [Google Scholar] [CrossRef]
- Stukowski, A.; Bulatov, V.V.; Arsenlis, A. Automated identification and indexing of dislocations in crystal interfaces. Model. Simul. Mater. Sci. Eng. 2012, 20, 085007. [Google Scholar] [CrossRef]
- Plimpton, S. Fast parallel algorithms for short-range molecular dynamics. J. Comput. Phys. 1995, 117, 1–19. [Google Scholar] [CrossRef]
- Stukowski, A. Visualization and analysis of atomistic simulation data with OVITO–the Open Visualization Tool. Model. Simul. Mater. Sci. Eng. 2010, 18, 015102. [Google Scholar] [CrossRef]
- Batyrev, I.G.; Alavi, A.; Finnis, M.W. Equilibrium and adhesion of Nb/sapphire: The effect of oxygen partial pressure. Phys. Rev. B 2000, 62, 4698–4706. [Google Scholar] [CrossRef]
- Wang, X.G.; Chaka, A.; Scheffler, M. Effect of the environment on alpha-Al2O3 (0001) surface structures. Phys. Rev. Lett. 2000, 84, 3650–3653. [Google Scholar] [CrossRef]
- Łodziana, Z.; Nørskov, J.K.; Stoltze, P. The stability of the hydroxylated (0001) surface of α-Al2O3. J. Chem. Phys. 2003, 118, 11179–11188. [Google Scholar] [CrossRef]
- Long, Y.; Chen, N.X.; Wang, H.Y. Theoretical investigations of misfit dislocations in Pd/MgO(001) interfaces. J. Phys. Condens. Matter 2005, 17, 6149–6172. [Google Scholar] [CrossRef]
- Lin, Z.J.; Peng, X.H.; Huang, C.; Fu, T.; Wang, Z.C. Atomic structure, electronic properties and generalized stacking fault energy of diamond/c-BN multilayer. RSC Adv. 2017, 7, 29599–29605. [Google Scholar] [CrossRef]
- Cornil, D.; Rivolta, N.; Mercier, V.; Wiame, H.; Beljonne, D.; Cornil, J. Enhanced adhesion energy at oxide/Ag interfaces for low-emissivity glasses: Theoretical insight into doping and vacancy effects. ACS Appl. Mater. Interfaces 2020, 12, 40838–40849. [Google Scholar] [CrossRef]
- Jiang, Y.; Wei, Y.G.; Smith, J.R.; Hutchinson, J.W.; Evans, A.G. First principles based predictions of the toughness of a metal/oxide interface. Int. J. Mater. Res. 2010, 101, 8–15. [Google Scholar] [CrossRef]
- Brandl, C.; Derlet, P.M.; Swygenhoven, H.V. Strain rates in molecular dynamics simulations of nanocrystalline metals. Philos. Mag. 2009, 89, 3465–3475. [Google Scholar] [CrossRef]
- Zhang, Z.P.; Kou, J.X.; Chen, L.Q.; Guo, J.Y.; Duan, X.Y.; Shan, B.; Duan, X.B. From stacking fault to phase transformation: A quantitative model of plastic deformation of CoCrFeMnNi under different strain rates. Intermetallics 2022, 146, 107585. [Google Scholar] [CrossRef]
- Zepeda-Ruiz, L.A.; Stukowski, A.; Oppelstrup, T.; Bulatov, V.V. Probing the limits of metal plasticity with molecular dynamics simulations. Nature 2017, 550, 492–495. [Google Scholar] [CrossRef]
- Zhang, X. A model on twinning-induced crack kinking out of a metal-ceramics interface. Int. J. Fract. 2008, 152, 27–35. [Google Scholar] [CrossRef]
- Ramachandramoorthy, R.; Gao, W.; Bernal, R.; Espinosa, H. High strain rate tensile testing of silver nanowires: Rate-dependent brittle-to-ductile transition. Nano Lett. 2016, 16, 255–263. [Google Scholar] [CrossRef]
- Abdolrahim, N.; Zbib, H.M.; Bahr, D.F. Multiscale modeling and simulation of deformation in nanoscale metallic multilayer systems. Int. J. Plast. 2014, 52, 33–50. [Google Scholar] [CrossRef]
- Zhu, T.; Li, J.; Samanta, A.; Leach, A.; Gall, K. Temperature and strain-rate dependence of surface dislocation nucleation. Phys. Rev. Lett. 2008, 100, 025502. [Google Scholar] [CrossRef] [Green Version]
- Bian, X.; Wang, G.; Wang, Q.; Sun, B.; Hussain, I.; Zhai, Q.; Mattern, N.; Bednarcik, J.; Eckert, J. Cryogenic-temperature-induced structural transformation of a metallic glass. Mater. Res. Lett. 2016, 5, 284–291. [Google Scholar] [CrossRef]
- Tanaka, M.; Izumi, D.; Yoshimura, N.; Shigesato, G.; Hoshino, M.; Ushioda, K.; Higashida, K. Temperature dependence of activation volume on Cu content of ultra-low carbon steel. Philos. Mag. 2017, 97, 2915–2930. [Google Scholar] [CrossRef]
- Swygenhoven, H.V. Grain boundaries and dislocations. Science 2002, 296, 66–67. [Google Scholar] [CrossRef]
- Wu, X.L.; Zhu, Y.T.; Wei, Y.G.; Wei, Q. Strong strain hardening in nanocrystalline nickel. Phys. Rev. Lett. 2009, 103, 205504. [Google Scholar] [CrossRef]
- Long, Y.; Chen, N.X. Theoretical study of misfit dislocation in interface dynamics. Comput. Mater. Sci. 2008, 44, 721–727. [Google Scholar] [CrossRef]
Figure 1.
(a) The Ni/Al2O3 interface model showing the misfit plane located at the first monolayer and second monolayer of metal side. Type I corresponds to the first interface structure and type II corresponds to the second interface structure. (b) Schematic diagram of tension simulation method.
Figure 1.
(a) The Ni/Al2O3 interface model showing the misfit plane located at the first monolayer and second monolayer of metal side. Type I corresponds to the first interface structure and type II corresponds to the second interface structure. (b) Schematic diagram of tension simulation method.

Figure 2.
(a) Adhesive energy curves for the three virtual coherent Al-terminated Ni(111)/Al2O3(0001) interface structures. The well depth corresponds to the work of adhesion. (b) GSFE profiles of the coherent Al-terminated Ni(111)/Al2O3(0001) interface. The peak indicates the unstable SFE in the interface plane.

Figure 3.
Top view of the equilibrium Ni(111)/Al2O3(0001) interface structures. (a) The first interface structure with misfit dislocation plane located at the first monolayer of metal side (Type I interface). (b) The second interface structure with misfit dislocation plane located at the second monolayer of metal side (Type II interface).

Figure 4.
Ni-O pair distribution functions across the Ni(111)/Al2O3(0001) interfaces of Type I and Type II in Figure 3.
Figure 4.
Ni-O pair distribution functions across the Ni(111)/Al2O3(0001) interfaces of Type I and Type II in Figure 3.

Figure 5.
(a,b) show the simulated tensile stress–strain curves and corresponding changes of dislocation density of Ni(111)/Al2O3(0001) interface systems of Type I and Type II interface. The strain rate is 1 109 1/s and the temperature is 1K. (c,d) show the snapshots of the atomic microstructures of Ni(111)/Al2O3(0001) interface systems corresponding to different strains in (a,b). Atoms are colored according to the centro-symmetry parameter (CSP).

Figure 6.
Tensile stress–strain curves of two Ni(111)/Al2O3(0001) interface models at different strain rates. (a) Type I interface samples. (b) Type II interface samples.
Figure 6.
Tensile stress–strain curves of two Ni(111)/Al2O3(0001) interface models at different strain rates. (a) Type I interface samples. (b) Type II interface samples.

Figure 7.
(a,b) show the simulated dislocation densities of Ni(111)/Al2O3(0001) interface systems of Type I and Type II interface. (c–j) show the snapshots of the atomic microstructures and dislocation distribution maps corresponding to the points marked in (a,b). The color-coding scheme of dislocation distribution maps in (c–j): 1/2<110> Perfect (blue), 1/6<112> Shockley (green), 1/6<110> Stair-rod (pink), 1/3<001> Hirth (yellow), 1/3<111> Frank (light blue), and Others (red).

Figure 8.
Saturated dislocation density as functions of strain rate.

Figure 9.
Yield strength vs. as varies for different strain rates.


Table 1.
Simulated samples in molecular dynamic simulations.
| ID | Size (Lattice) | Tensile Velocities (m/s) | Strain Rate (s−1) | Initial Nanostructure |
|---|---|---|---|---|
| S1 | 24 24 3 (Al2O3)-15(Ni) | 1.27 | 1 108 | Type I |
| S2 | 24 24 3 (Al2O3)-15(Ni) | 6.35 | 5 108 | Type I |
| S3 | 24 24 3 (Al2O3)-15(Ni) | 12.70 | 1 109 | Type I |
| S4 | 24 24 3 (Al2O3)-15(Ni) | 38.12 | 3 109 | Type I |
| S5 | 24 24 3 (Al2O3)-15(Ni) | 63.51 | 5 109 | Type I |
| S6 | 24 24 3 (Al2O3)-15(Ni) | 1.24 | 1 108 | Type II |
| S7 | 24 24 3 (Al2O3)-15(Ni) | 6.20 | 5 108 | Type II |
| S8 | 24 24 3 (Al2O3)-15(Ni) | 12.41 | 1 109 | Type II |
| S9 | 24 24 3 (Al2O3)-15(Ni) | 37.20 | 3 109 | Type II |
| S10 | 24 24 3 (Al2O3)-15(Ni) | 62.03 | 5 109 | Type II |
Table 2.
Work of adhesion and unstable stacking fault energy (USFE) for the stoichiometric Al-terminated Ni(111)/Al2O3(0001) interface.
Table 2.
Work of adhesion and unstable stacking fault energy (USFE) for the stoichiometric Al-terminated Ni(111)/Al2O3(0001) interface.
| Mode | or USFE (J/m2) | ||
|---|---|---|---|
| This Work | Ab Initio | ||
| Tension | Ni on O | 1.21 | 1.44 [9], 1.48 [10] 1.90 [34] |
| Ni on Al | 0.62 | 1.01 [34] | |
| Ni on hollow | 1.10 | 1.24 [34] | |
| Shear | <112> | 1.76 | 1.78 [57] |
| <110> | 0.76 | 1.07 [57] | |
Table 3.
Athermal stress, thermal prefactor, and calculated activation parameters for the Al-terminated Ni(111)/Al2O3(0001) interface (T = 1 K).
Table 3.
Athermal stress, thermal prefactor, and calculated activation parameters for the Al-terminated Ni(111)/Al2O3(0001) interface (T = 1 K).
| Interface Type | (GPa) | (GPa) | b3 | |
|---|---|---|---|---|
| Type I | 24.29 | 0.83 | 0.0010 | 0.0025 |
| Type II | 33.59 | 1.19 | 0.0007 | 0.0024 |
Disclaimer/Publisher’s Note: The statements, opinions and data contained in all publications are solely those of the individual author(s) and contributor(s) and not of MDPI and/or the editor(s). MDPI and/or the editor(s) disclaim responsibility for any injury to people or property resulting from any ideas, methods, instructions or products referred to in the content. |
© 2023 by the author. Licensee MDPI, Basel, Switzerland. This article is an open access article distributed under the terms and conditions of the Creative Commons Attribution (CC BY) license (https://creativecommons.org/licenses/by/4.0/).
Share and Cite
MDPI and ACS Style
Fu, X. Nanostructure, Plastic Deformation, and Influence of Strain Rate Concerning Ni/Al2O3 Interface System Using a Molecular Dynamic Study (LAMMPS). Nanomaterials 2023, 13, 641. https://0-doi-org.brum.beds.ac.uk/10.3390/nano13040641
AMA Style
Fu X. Nanostructure, Plastic Deformation, and Influence of Strain Rate Concerning Ni/Al2O3 Interface System Using a Molecular Dynamic Study (LAMMPS). Nanomaterials. 2023; 13(4):641. https://0-doi-org.brum.beds.ac.uk/10.3390/nano13040641
Chicago/Turabian StyleFu, Xueqiong. 2023. "Nanostructure, Plastic Deformation, and Influence of Strain Rate Concerning Ni/Al2O3 Interface System Using a Molecular Dynamic Study (LAMMPS)" Nanomaterials 13, no. 4: 641. https://0-doi-org.brum.beds.ac.uk/10.3390/nano13040641
Note that from the first issue of 2016, this journal uses article numbers instead of page numbers. See further details here.