Elaboration of Trans-Resveratrol Derivative-Loaded Superparamagnetic Iron Oxide Nanoparticles for Glioma Treatment

 , , ,
, , ,  and
and
Abstract
:
1. Introduction
2. Materials and Methods
2.1. Chemicals and Reagents
2.2. Characterization Techniques
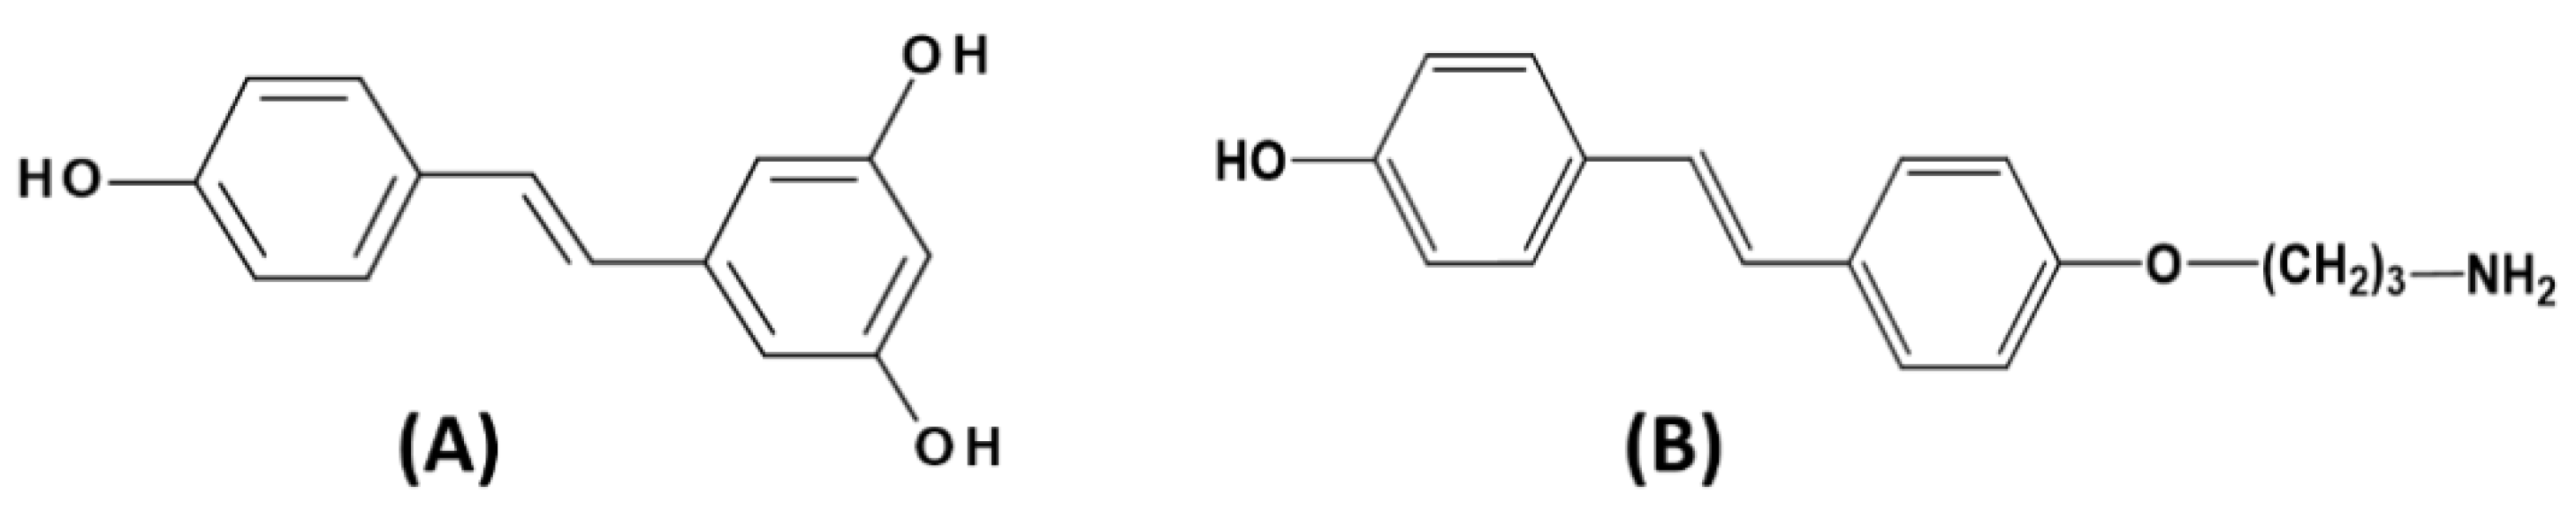
2.3. Synthesis of 4’-Hydroxy-4-(3-aminopropoxy) Trans-Stilbene (HAPtS) Molecule
2.4. Synthesis of Bare and Modified Nanoparticles
2.4.1. Synthesis of Bare SPIONs
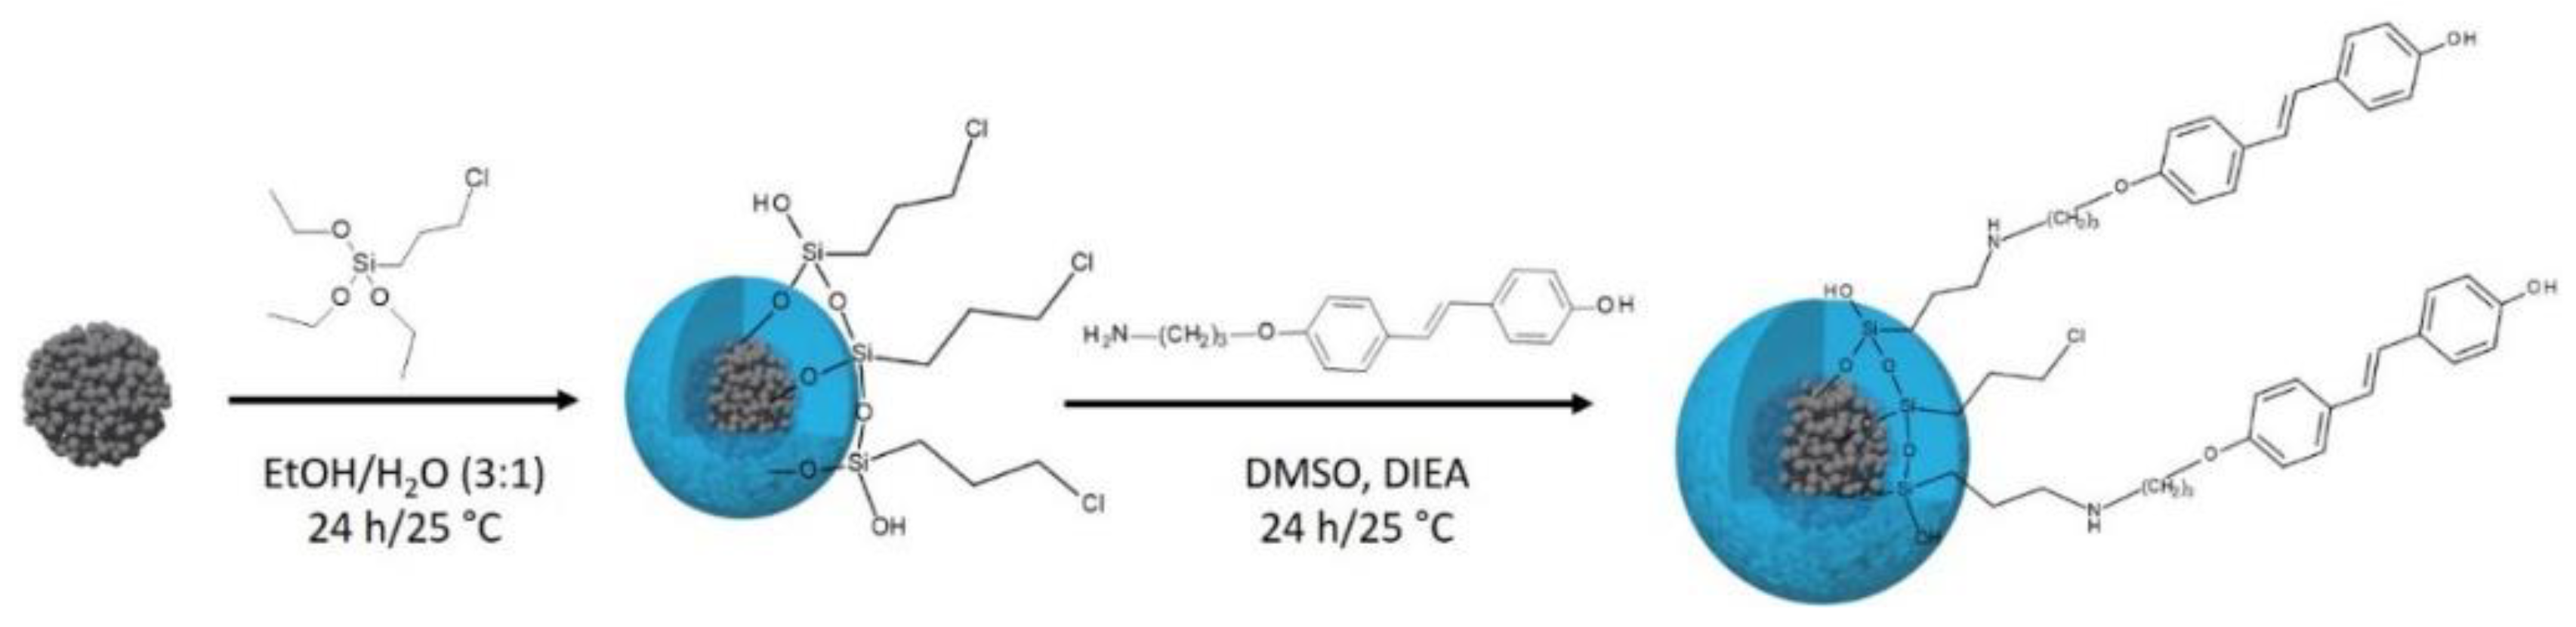
2.4.2. Synthesis of 3-Chlorporyltriethoxysilane-Modified SPIONs: SPIONs-CPTES
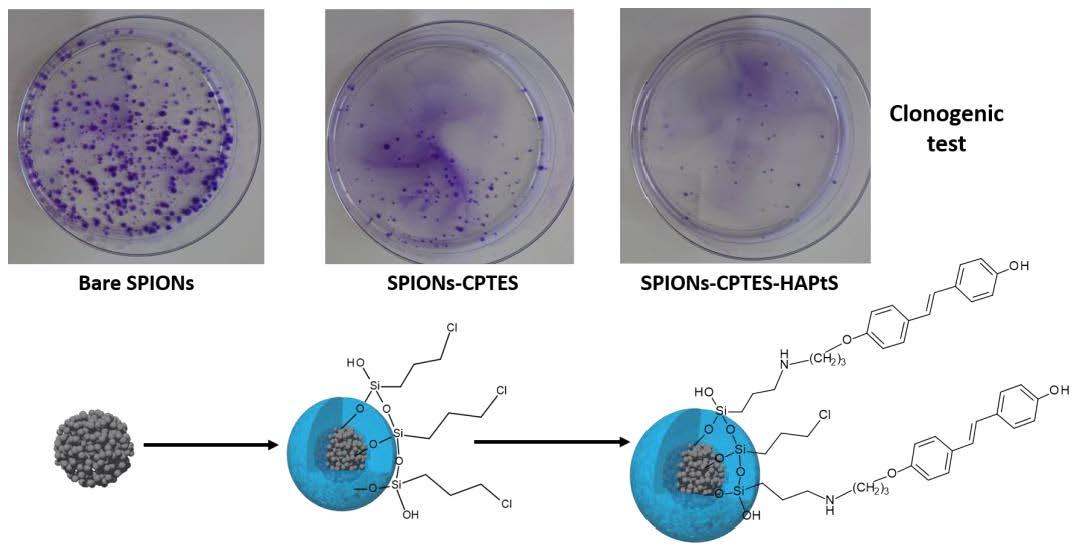
2.4.3. Synthesis of 4’-hydroxy-4-(3-aminopropoxy)-trans-stilbene-Modified SPIONs: SPIONs-CPTES-HAPtS
2.5. Biological Assays
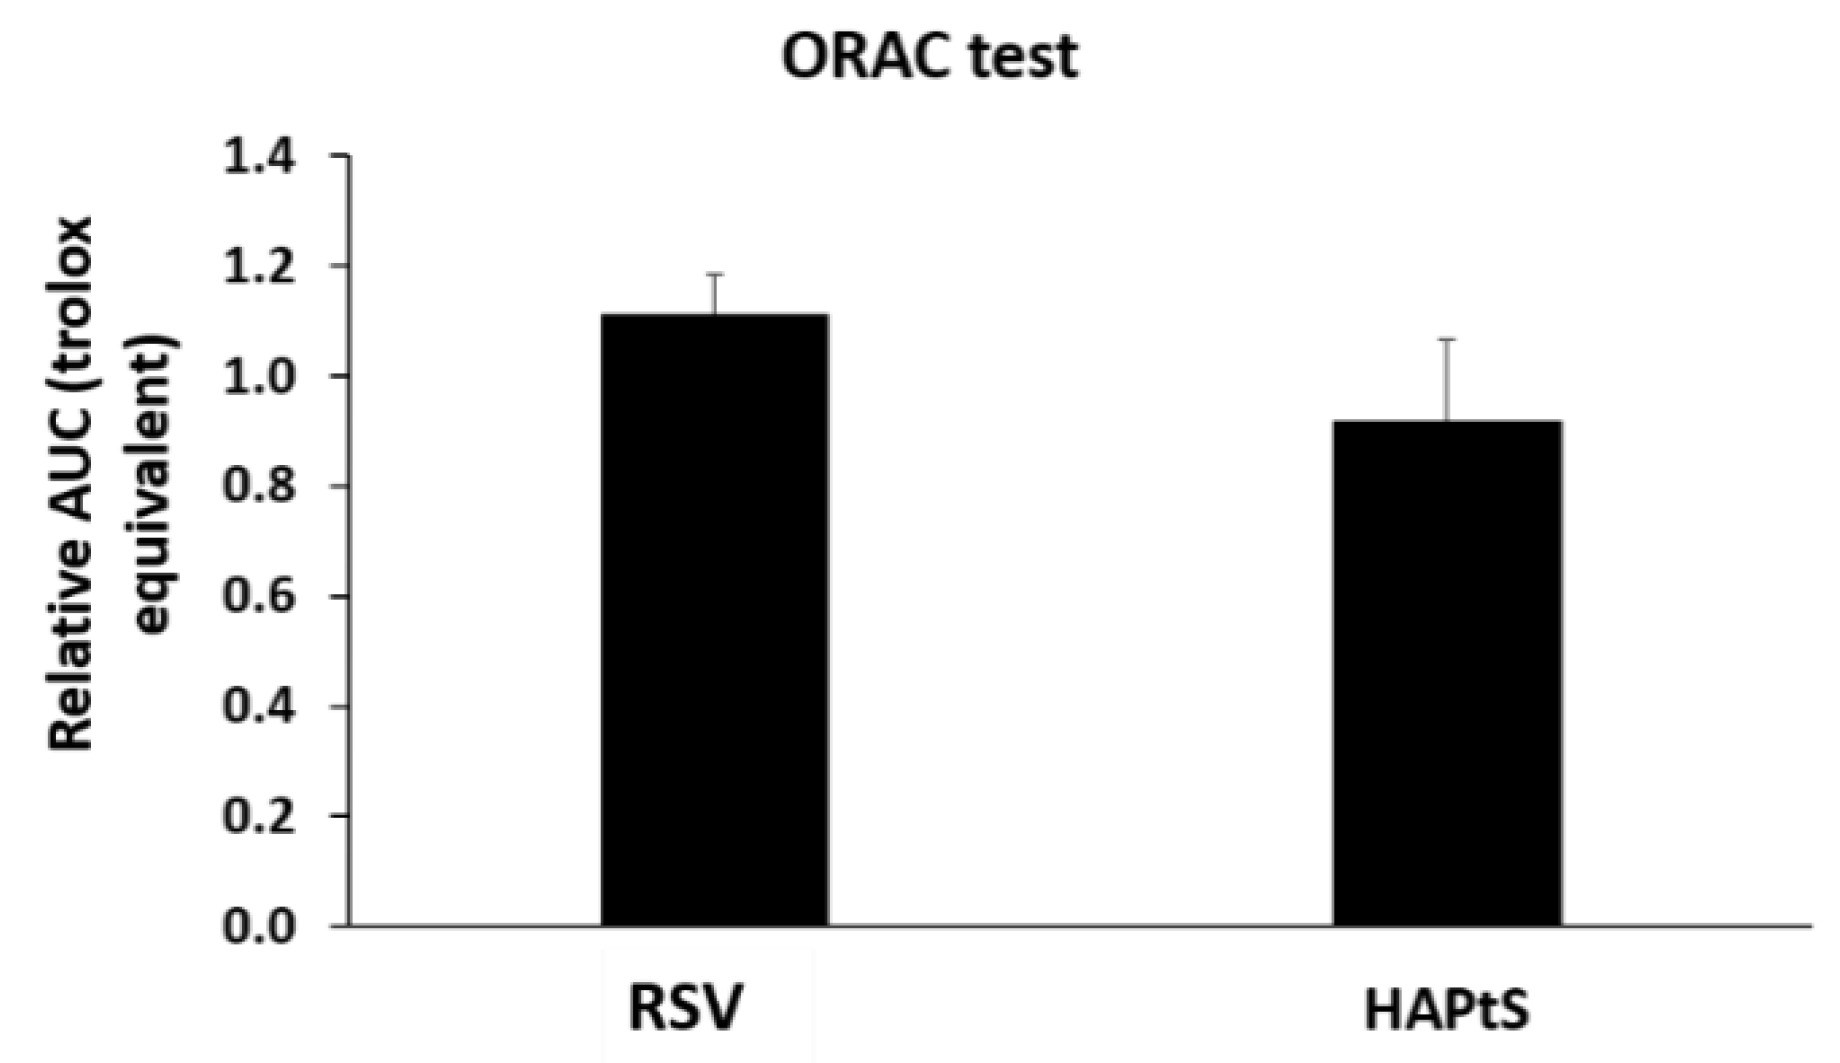
2.5.1. Antioxidant Test: the Oxygen Radical Absorbance Capacity (ORAC) Assay
2.5.2. Cell Culture
2.5.3. Clonogenic Survival Assay
2.5.4. Cytotoxicity: MTT Assay
2.5.5. Cytotoxicity: FDA (Fluorescein Diacetate) Assay
3. Results and Discussion
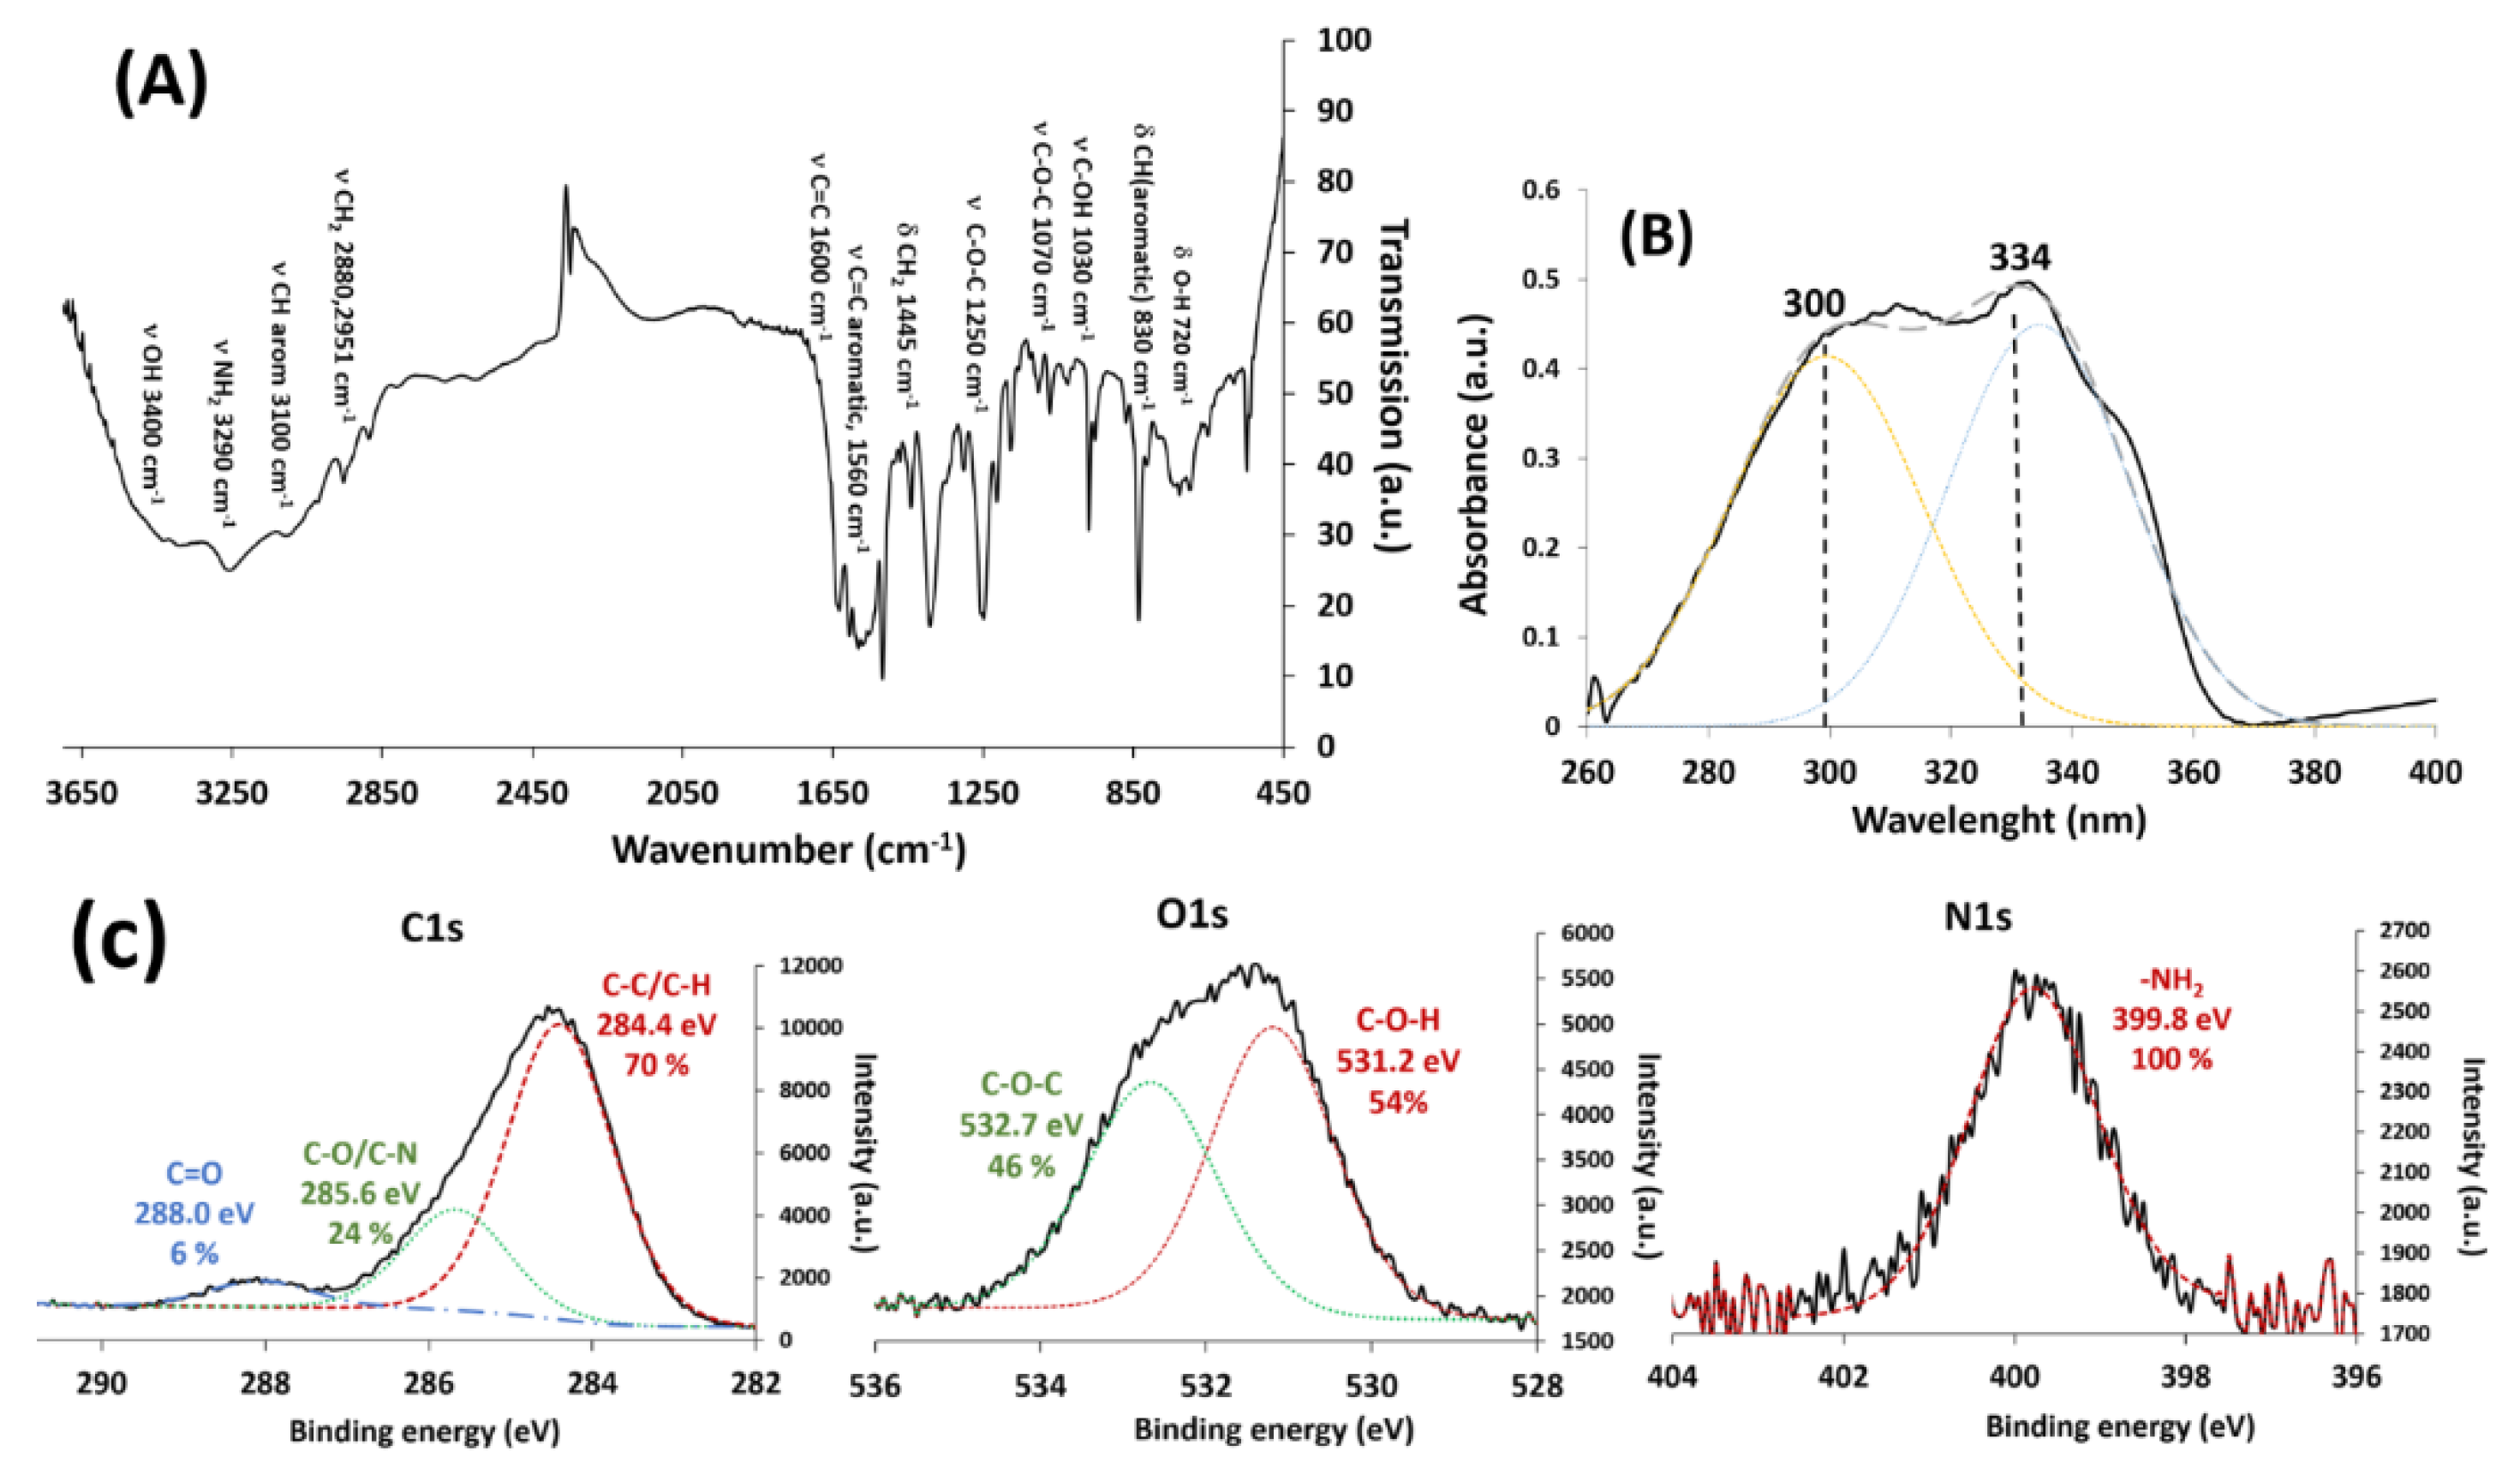
3.1. Characterization of the New RSV Derivative Molecule: HAPtS
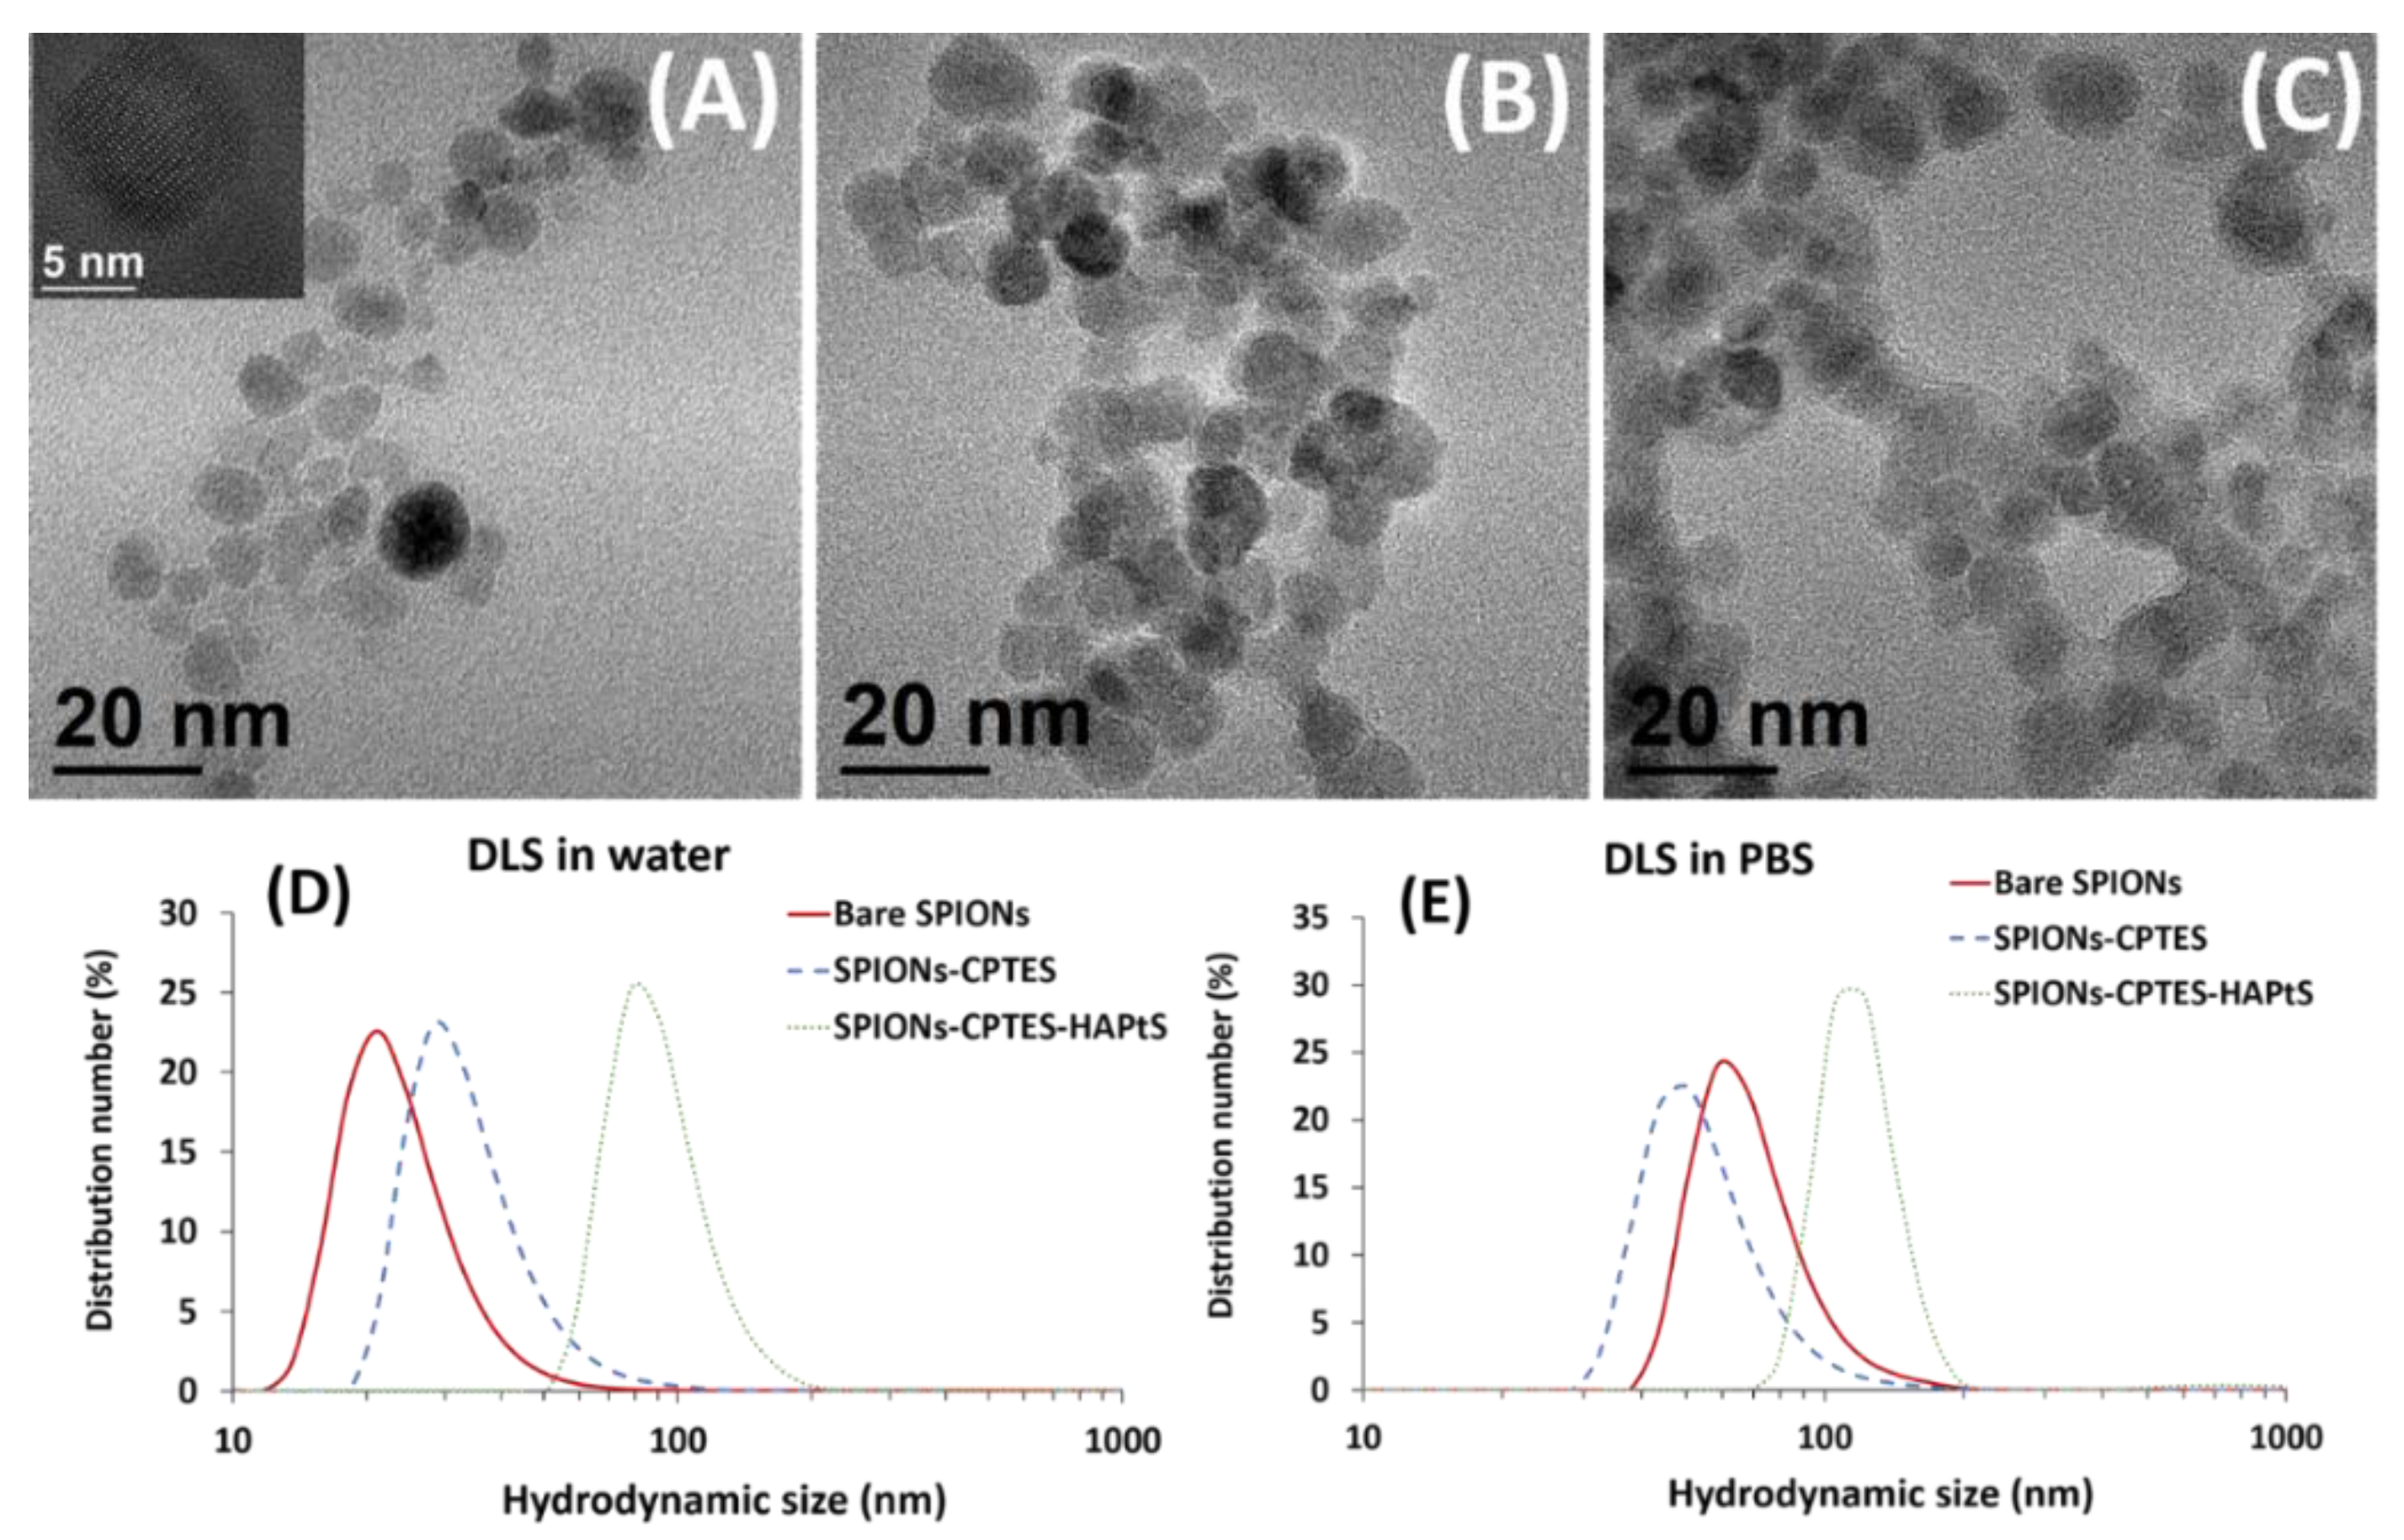
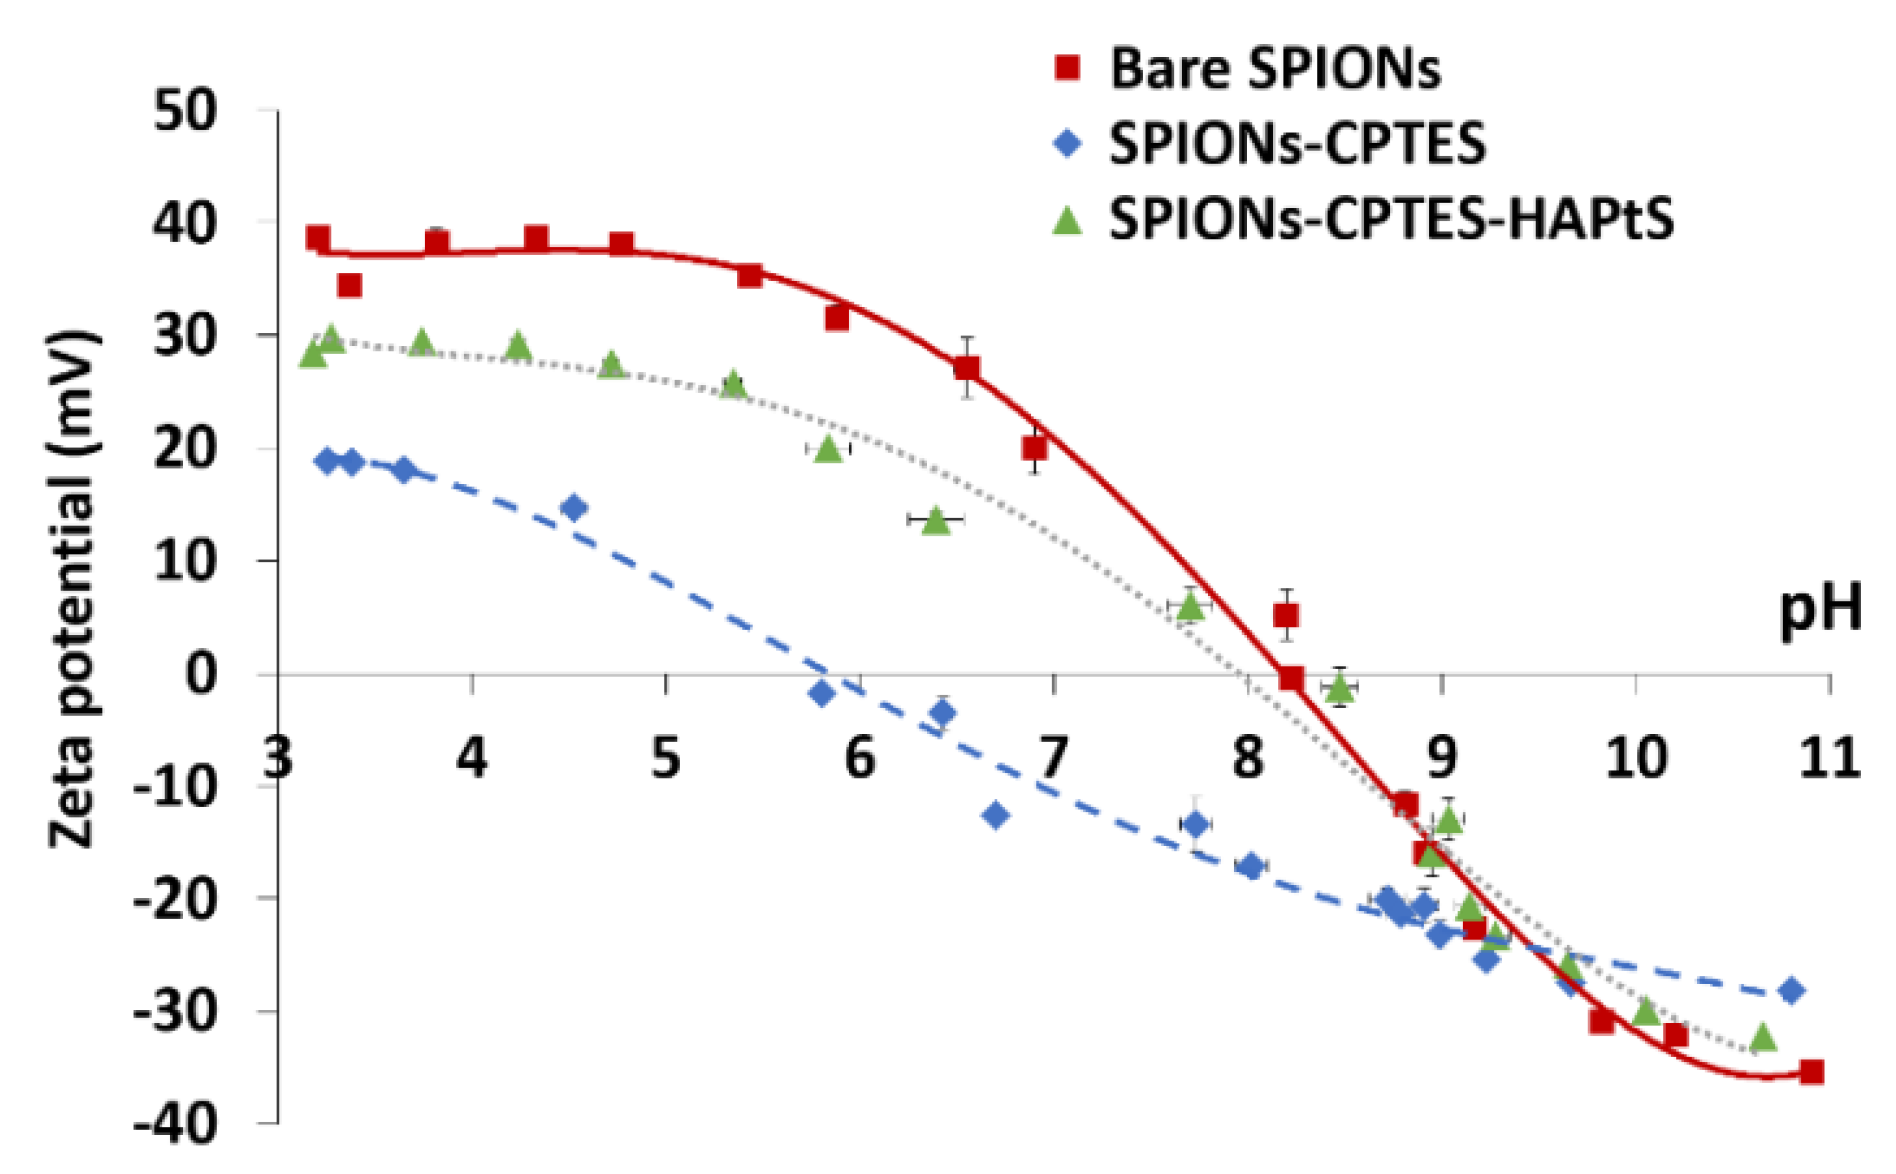
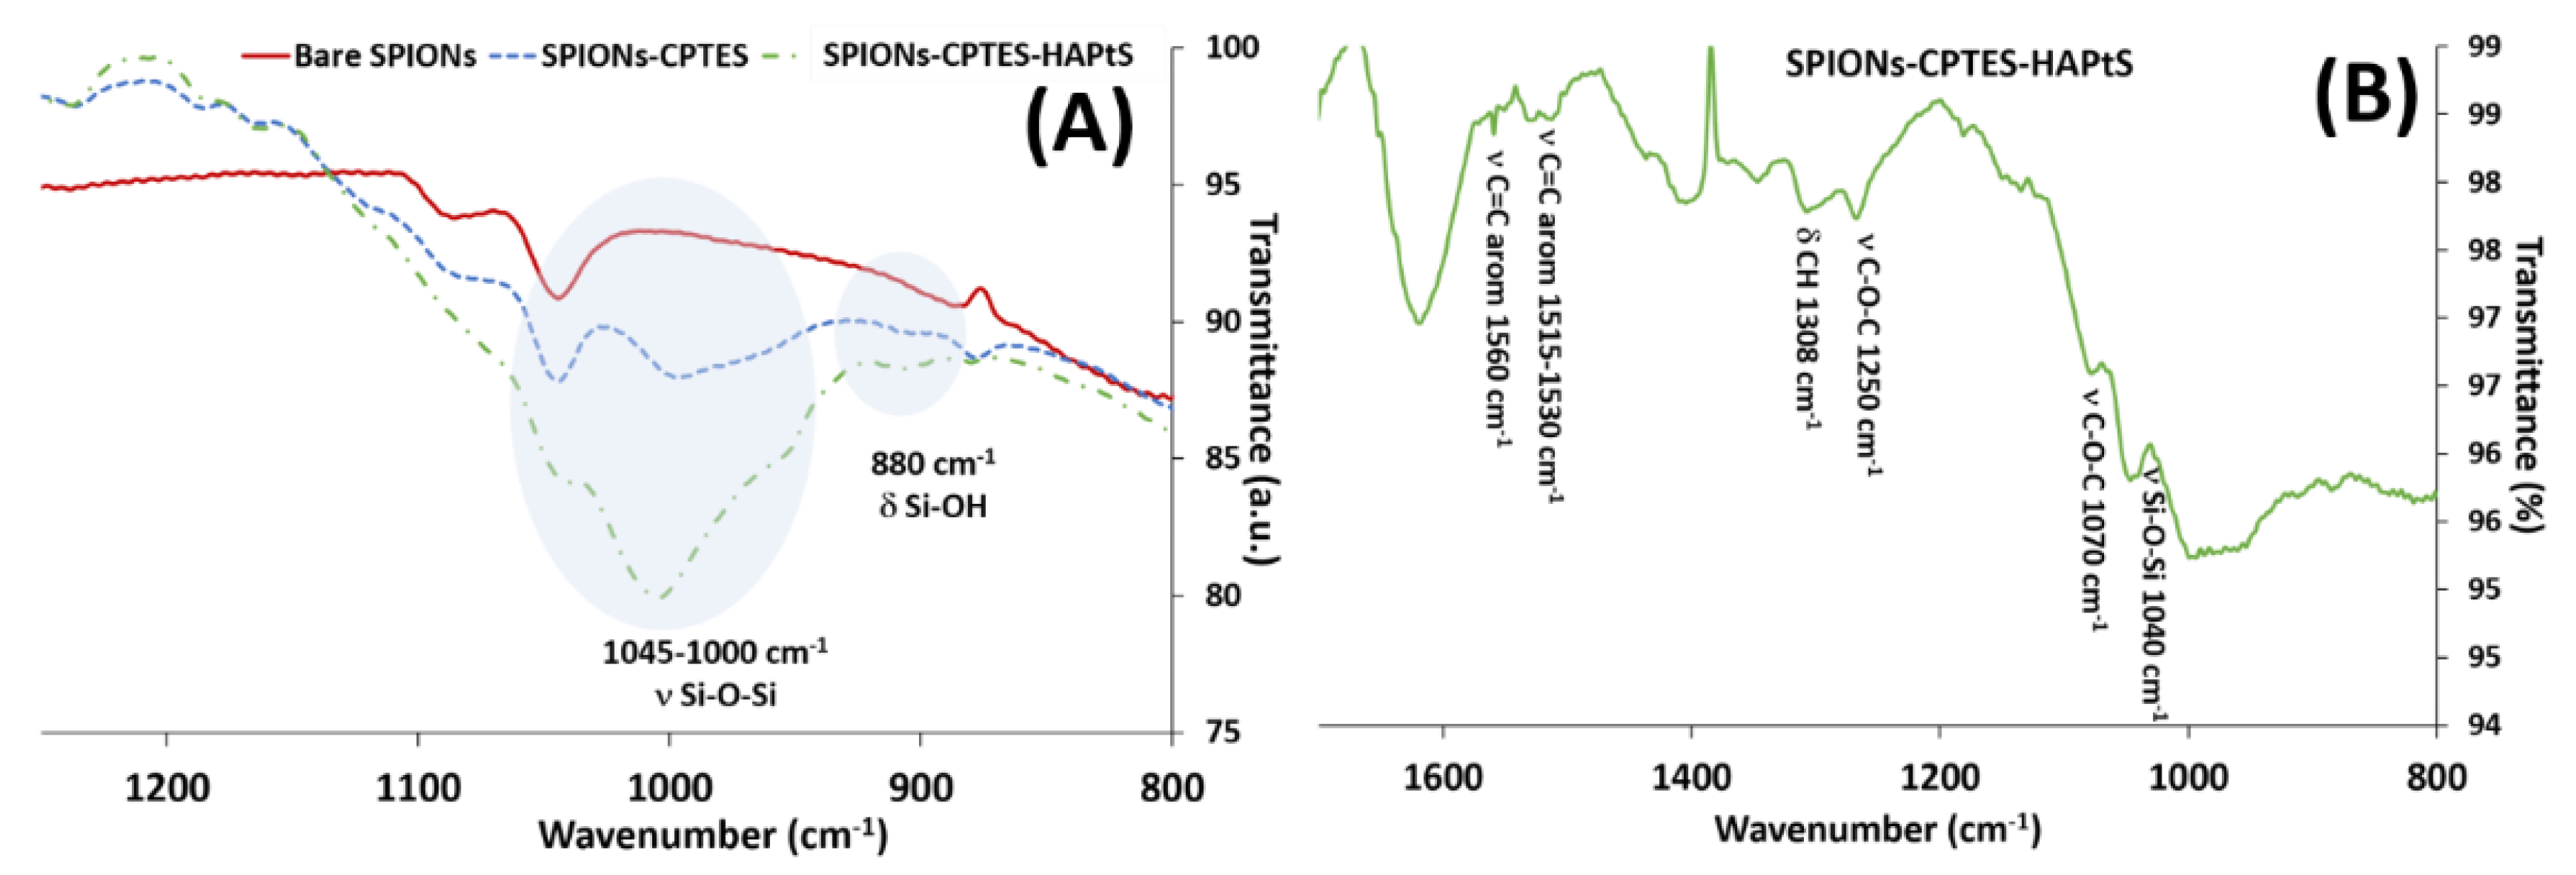
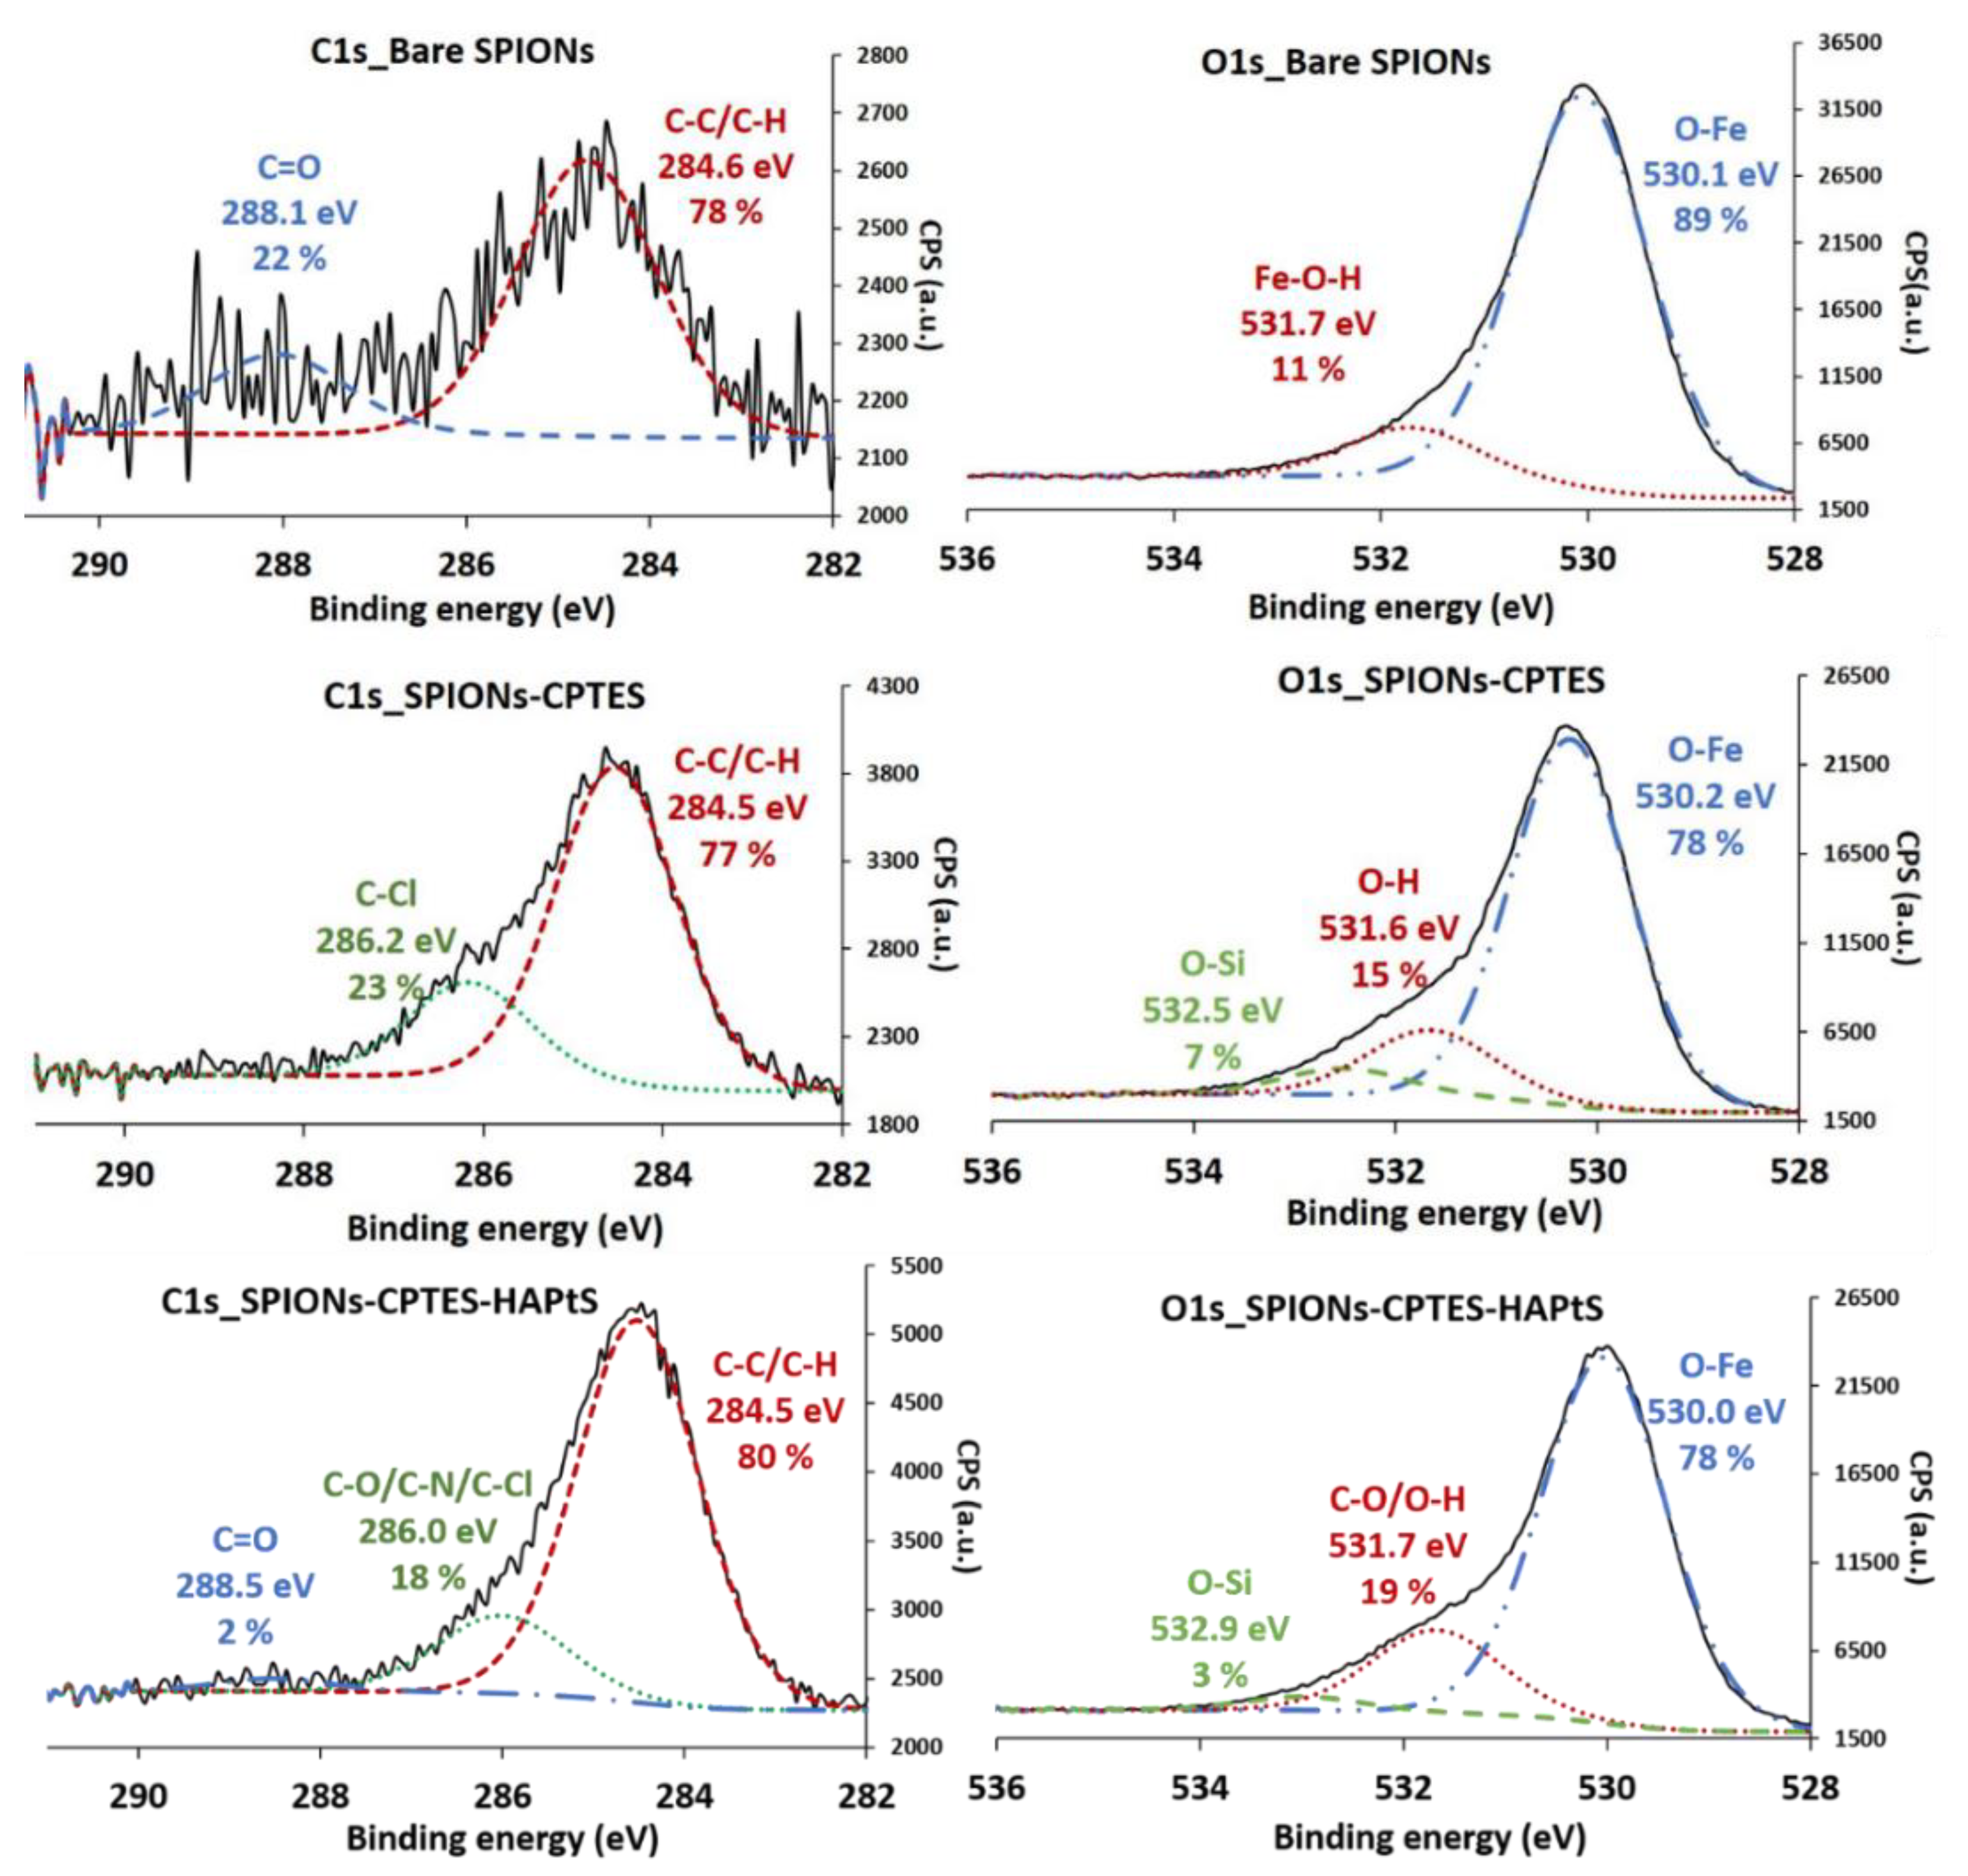
3.2. Elaboration of HAPtS Nanocarrier Based on Superparamagnetic Iron Oxide Nanoparticles (SPIONs)
3.3. Assessment of Nanohybrids Biological Efficiency
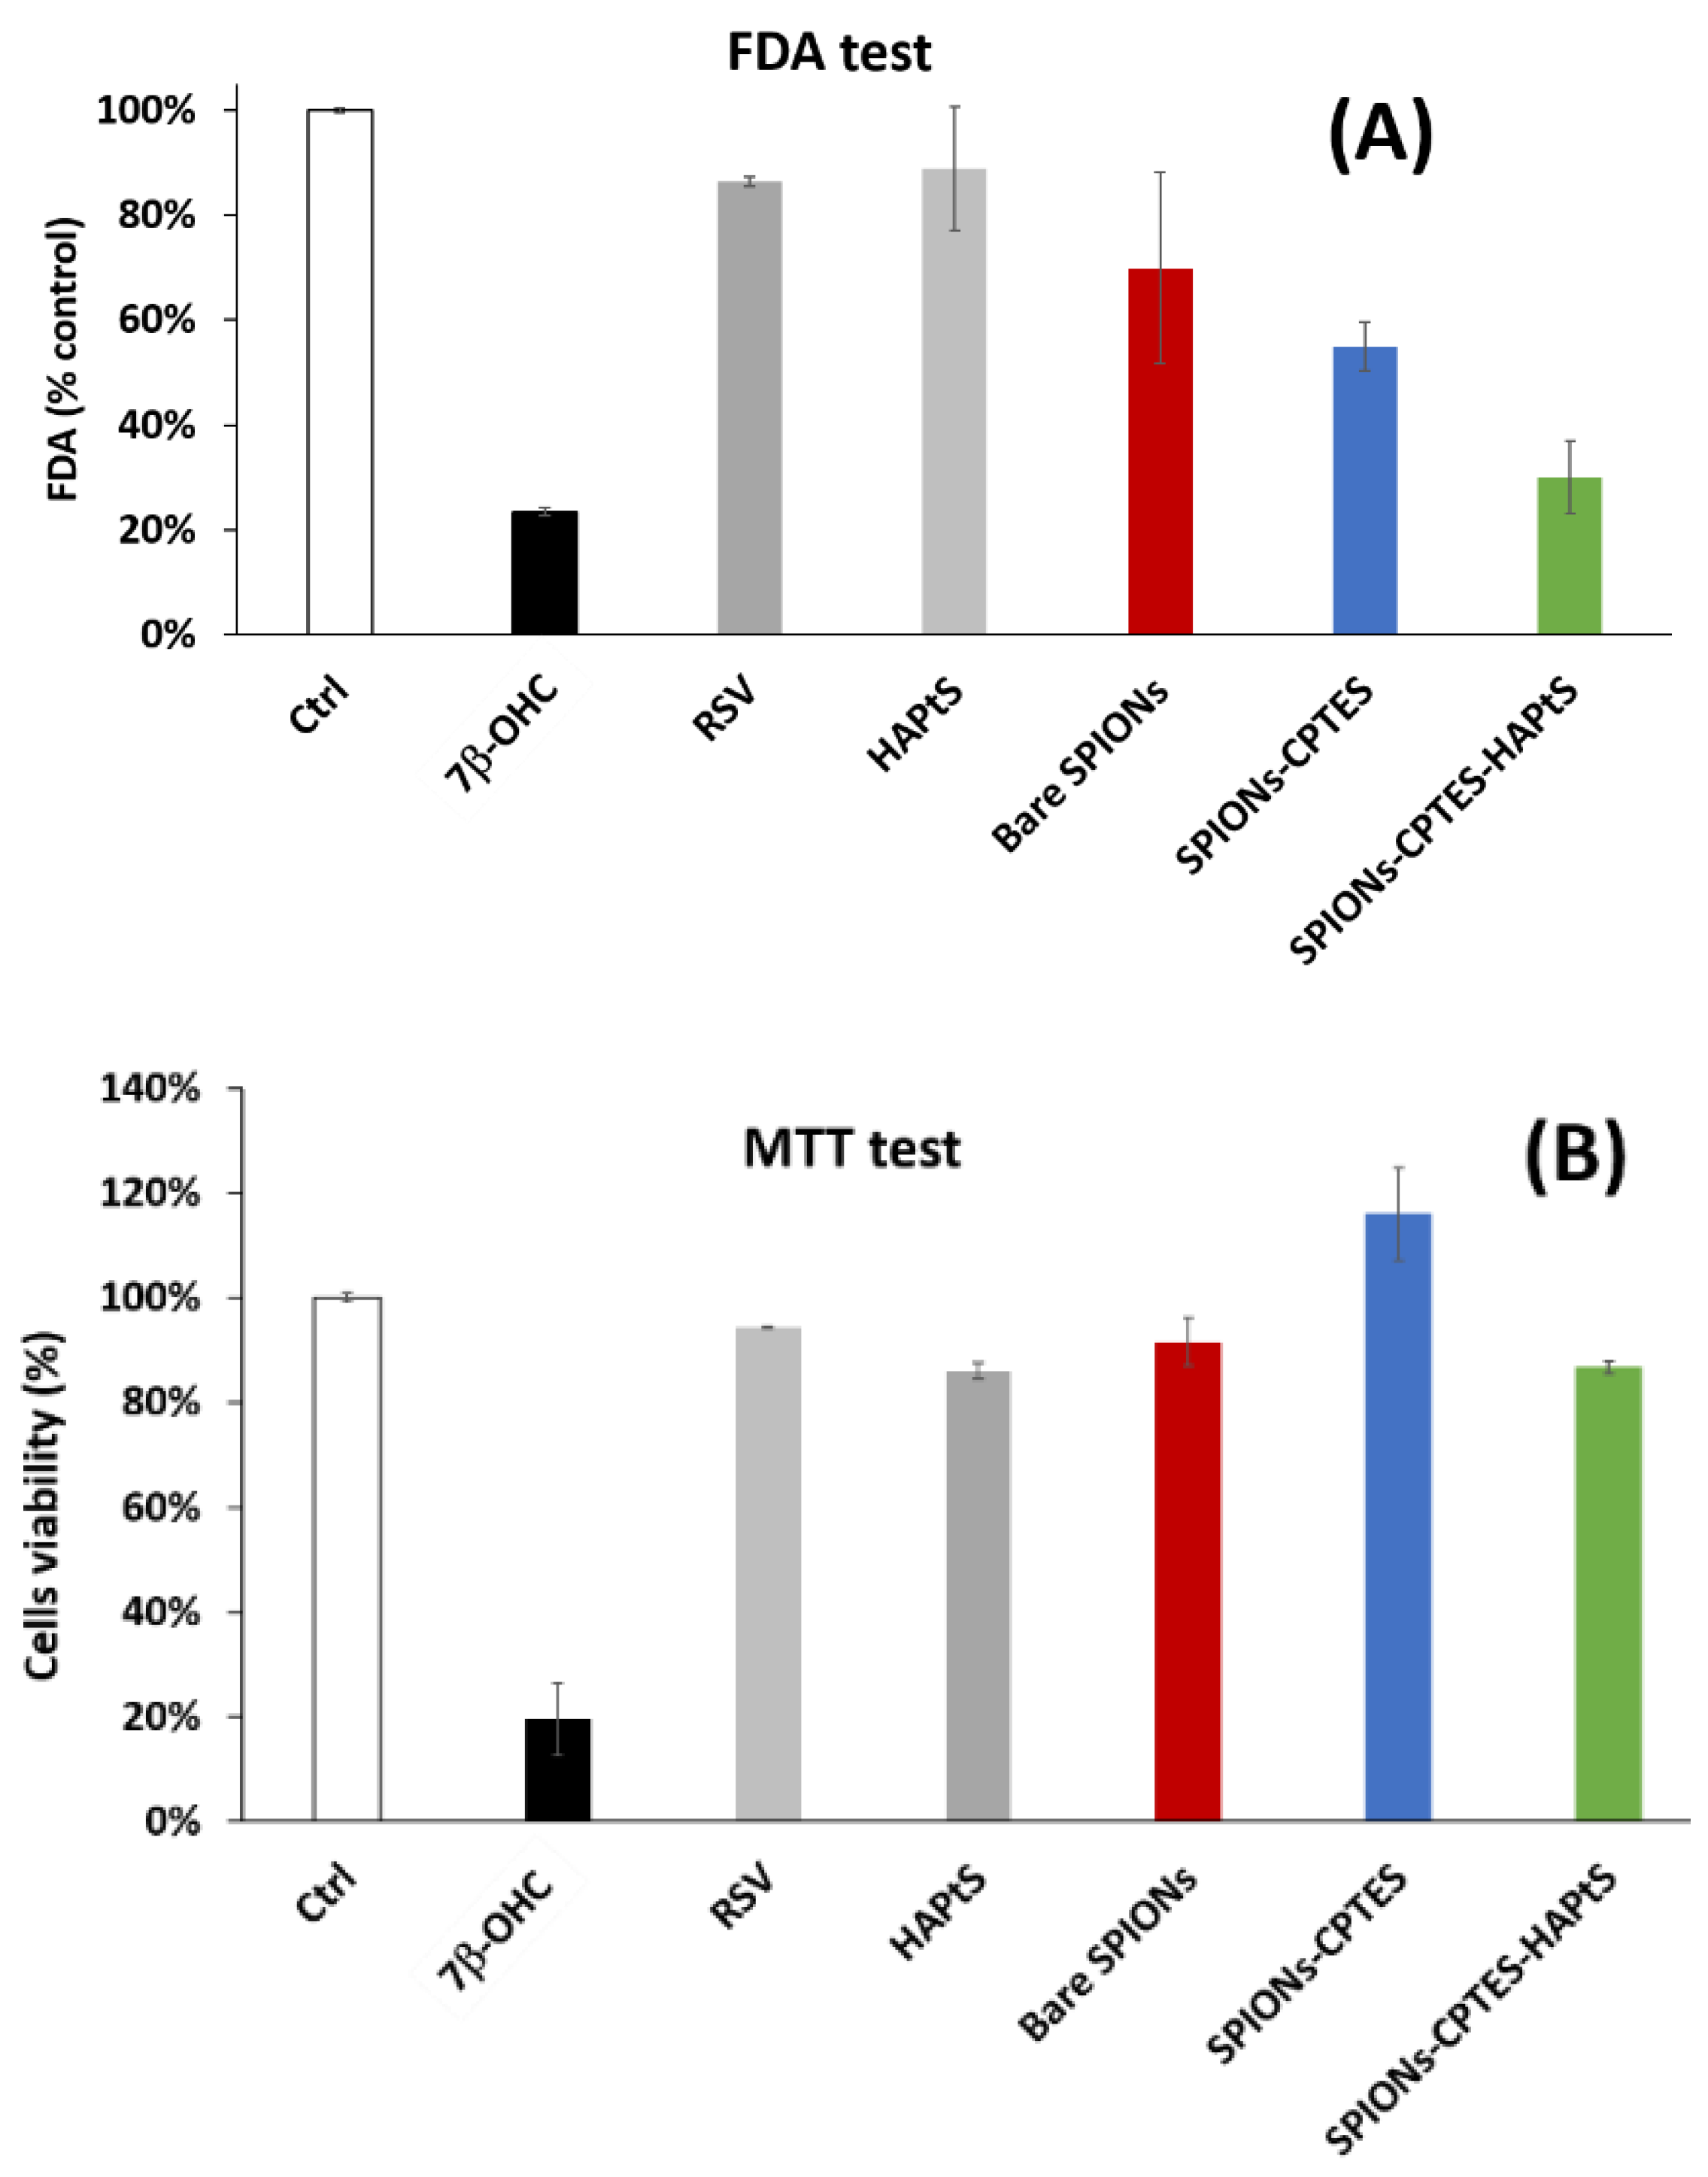
3.3.1. Cytotoxicity Assessment
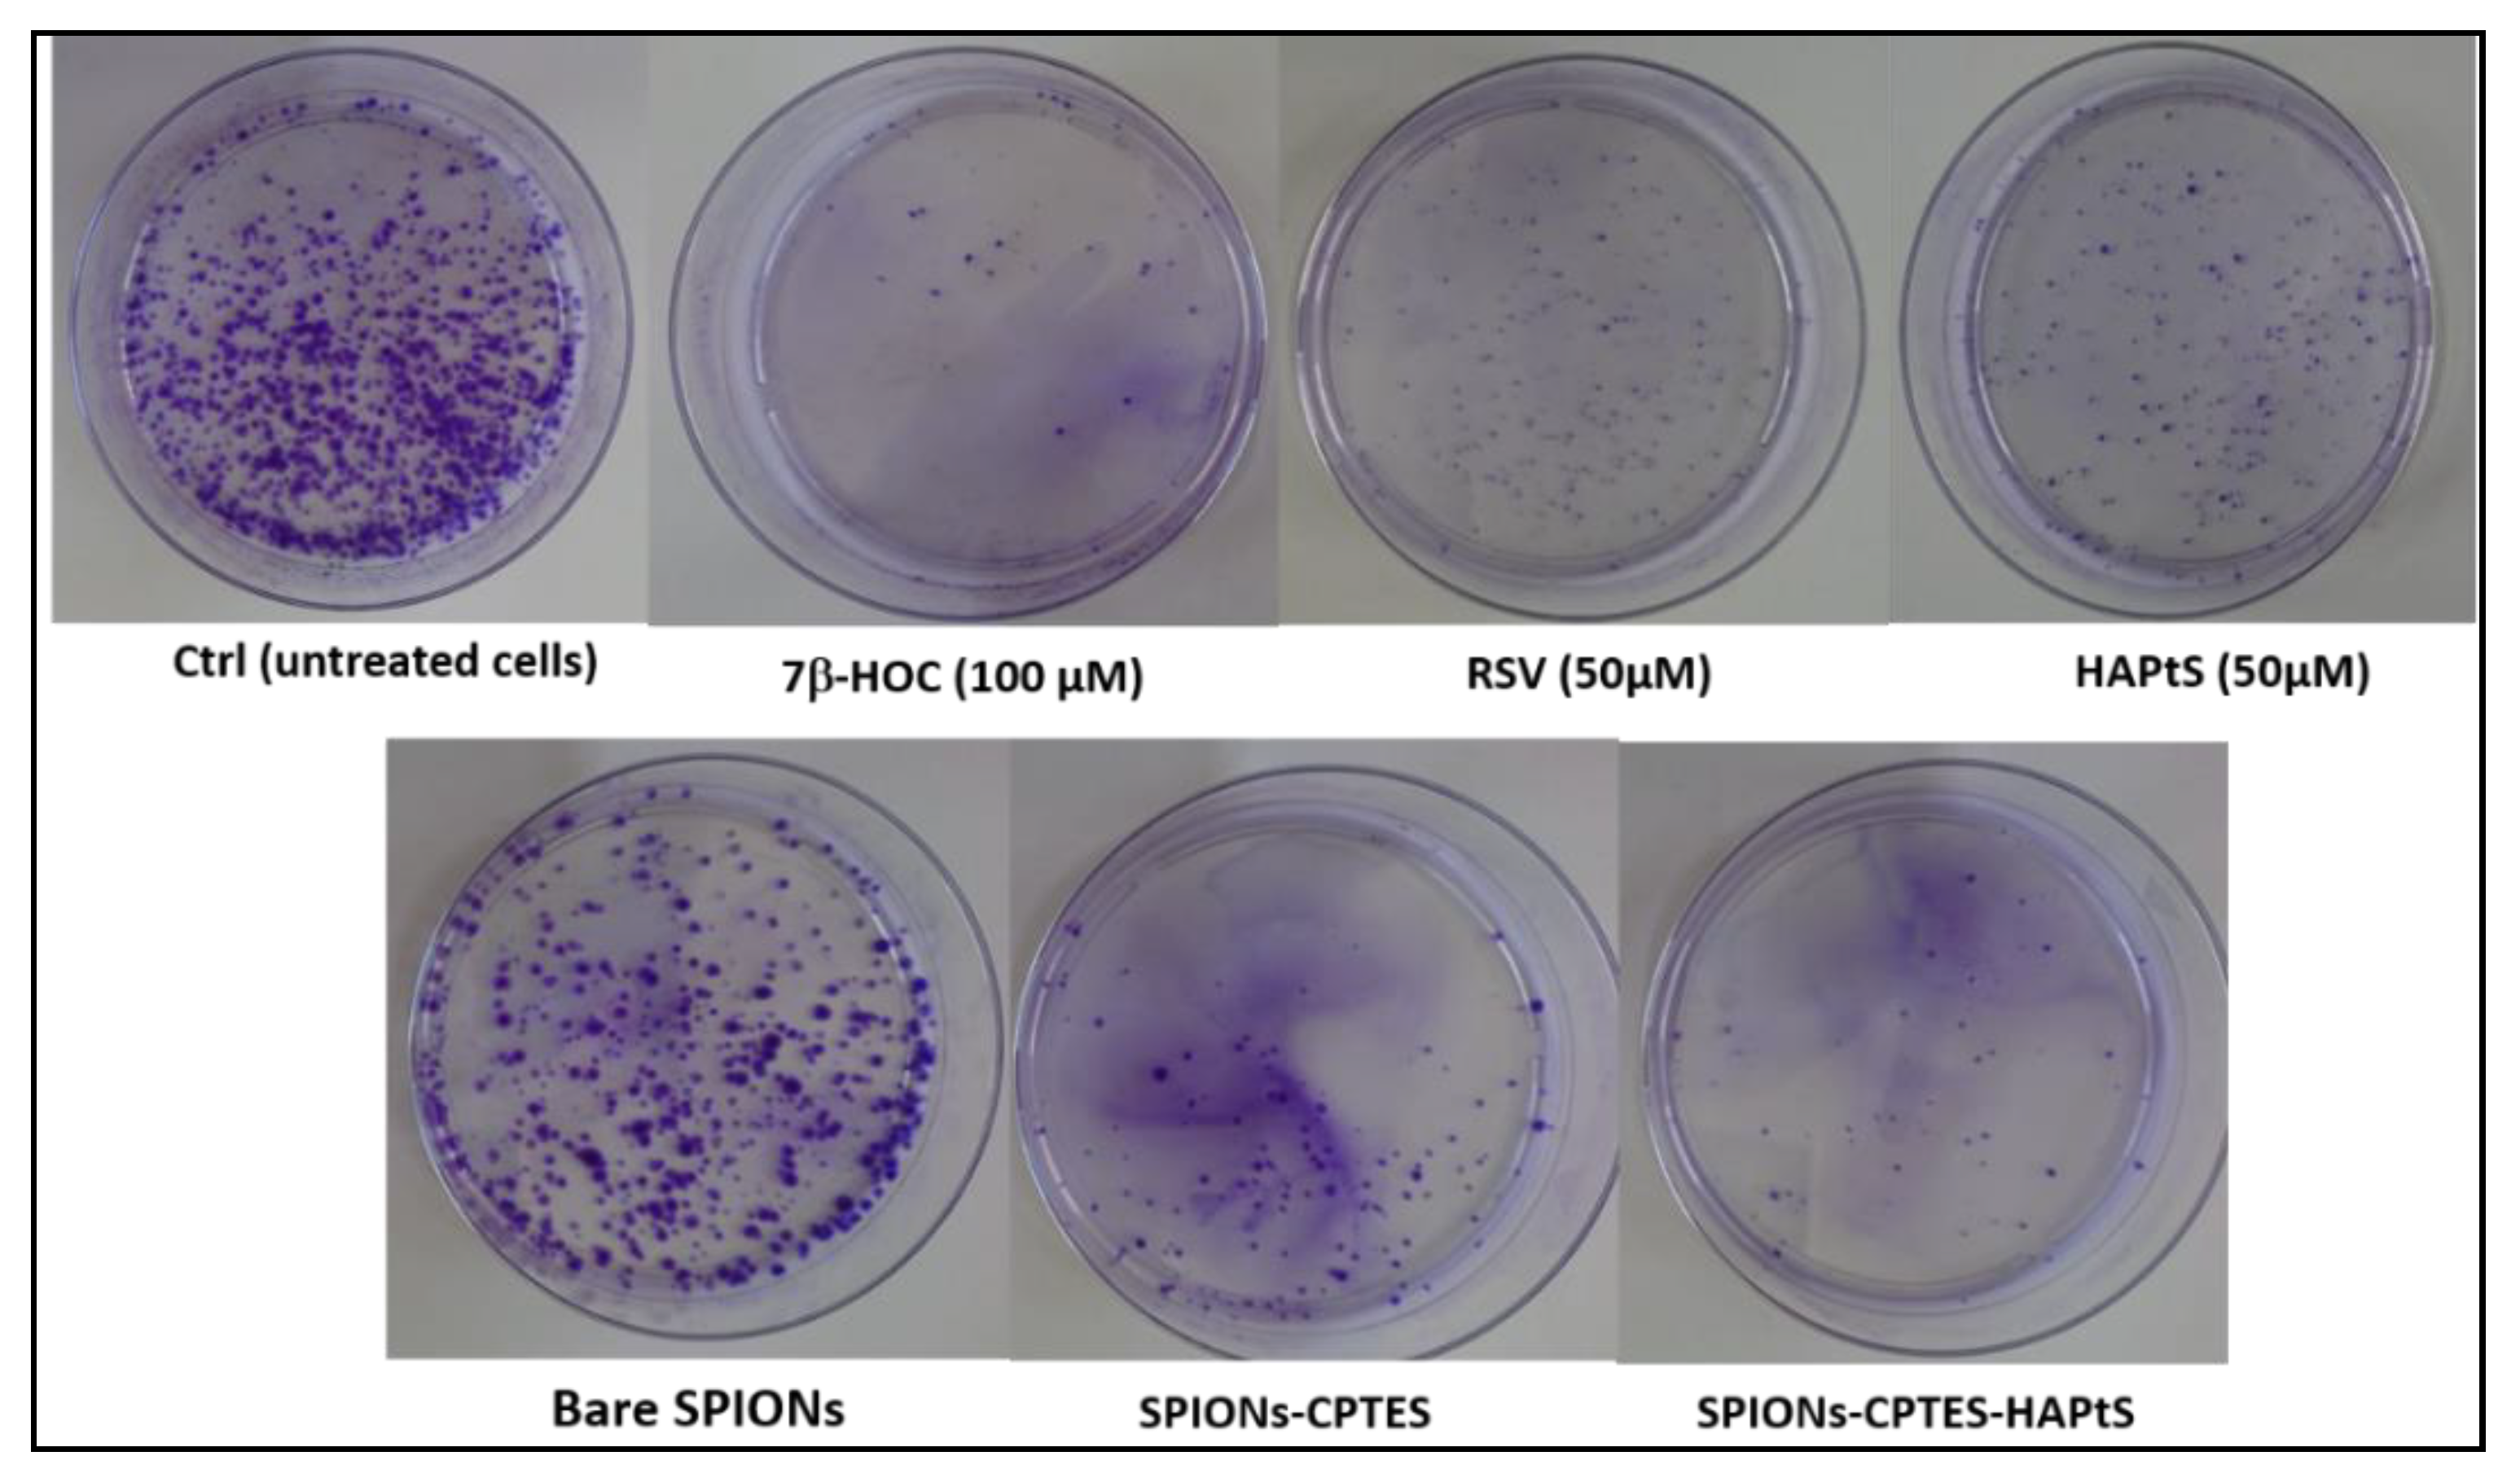
3.3.2. Clonogenic Assay
4. Conclusions
Supplementary Materials
Author Contributions
Funding
Acknowledgments
Conflicts of Interest
References
- Wenzel, E.; Somoza, V. Metabolism and bioavailability of trans-resveratrol. Mol. Nutr. Food Res. 2005, 49, 472–481. [Google Scholar] [CrossRef] [PubMed]
- Siemann, E.; Creasy, L. Concentration of the phytoalexin resveratrol in wine. Am. J. Enol. Vitic. 1992, 43, 49–52. [Google Scholar]
- Frankel, E.; German, J.; Kinsella, J.; Parks, E.; Kanner, J. Inhibition of oxidation of human low-density lipoprotein by phenolic substances in red wine. Lancet 1993, 341, 454–457. [Google Scholar] [CrossRef]
- Stivala, L.A.; Savio, M.; Carafoli, F.; Perucca, P.; Bianchi, L.; Maga, G.; Forti, L.; Pagnoni, U.M.; Albini, A.; Prosperi, E. Specific structural determinants are responsible for the antioxidant activity and the cell cycle effects of resveratrol. J. Boil. Chem. 2001, 276, 22586–22594. [Google Scholar] [CrossRef] [PubMed]
- Chalal, M.; Klinguer, A.; Echairi, A.; Meunier, P.; Vervandier-Fasseur, D.; Adrian, M. Antimicrobial activity of resveratrol analogues. Molecules 2014, 19, 7679–7688. [Google Scholar] [CrossRef] [PubMed]
- Tili, E.; Michaille, J.-J.; Adair, B.; Alder, H.; Limagne, E.; Taccioli, C.; Ferracin, M.; Delmas, D.; Latruffe, N.; Croce, C.M. Resveratrol decreases the levels of miR−155 by upregulating miR-663, a microRNA targeting JunB and JunD. Carcinogenesis 2010, 31, 1561–1566. [Google Scholar] [CrossRef] [PubMed]
- Aggarwal, B.B.; Bhardwaj, A.; Aggarwal, R.S.; Seeram, N.P.; Shishodia, S.; Takada, Y. Role of resveratrol in prevention and therapy of cancer: Preclinical and clinical studies. Anticancer Res. 2004, 24, 2783–2840. [Google Scholar] [PubMed]
- Holmes-McNary, M.; Baldwin, A.S. Chemopreventive properties of trans-resveratrol are associated with inhibition of activation of the IκB kinase. Cancer Res. 2000, 60, 3477–3483. [Google Scholar] [PubMed]
- Athar, M.; Back, J.H.; Tang, X.; Kim, K.H.; Kopelovich, L.; Bickers, D.R.; Kim, A.L. Resveratrol: A review of preclinical studies for human cancer prevention. Toxicol. Appl. Pharmacol. 2007, 224, 274–283. [Google Scholar] [CrossRef] [PubMed]
- Perez-Campo, R.; López-Torres, M.; Cadenas, S.; Rojas, C.; Barja, G. The rate of free radical production as a determinant of the rate of aging: Evidence from the comparative approach. J. Comp. Physiol. B 1998, 168, 149–158. [Google Scholar] [CrossRef] [PubMed]
- Beckman, K.B.; Ames, B.N. The Free Radical Theory of Aging Matures. Physiol. Rev. 1998, 78, 547–581. [Google Scholar] [CrossRef] [PubMed]
- Sun, A.Y.; Wang, Q.; Simonyi, A.; Sun, G.Y. Resveratrol as a Therapeutic Agent for Neurodegenerative Diseases. Mol. Neurobiol. 2010, 41, 375–383. [Google Scholar] [CrossRef] [PubMed]
- Ranney, A.; Petro, M.S. Resveratrol protects spatial learning in middle-aged C57BL/6 mice from effects of ethanol. Behav. Pharmacol. 2009, 20, 330–336. [Google Scholar] [CrossRef] [PubMed]
- Wang, Q.; Xu, J.; Rottinghaus, G.E.; Simonyi, A.; Lubahn, D.; Sun, G.Y.; Sun, A.Y. Resveratrol protects against global cerebral ischemic injury in gerbils. Brain Res. 2002, 958, 439–447. [Google Scholar] [CrossRef]
- Kim, D.; Nguyen, M.D.; Dobbin, M.M.; Fischer, A.; Sananbenesi, F.; Rodgers, J.T.; Delalle, I.; Baur, J.A.; Sui, G.; Armour, S.M.; et al. SIRT1 deacetylase protects against neurodegeneration in models for Alzheimer’s disease and amyotrophic lateral sclerosis. EMBO J. 2007, 26, 3169–3179. [Google Scholar] [CrossRef] [PubMed]
- Kuhnle, G.; Spencer, J.P.; Chowrimootoo, G.; Schroeter, H.; Debnam, E.S.; Srai, S.K.S.; Rice-Evans, C.; Hahn, U. Resveratrol is absorbed in the small intestine as resveratrol glucuronide. Biochem. Biophys. Res. Commun. 2000, 272, 212–217. [Google Scholar] [CrossRef] [PubMed]
- Bertelli, A.; Giovannini, L.; Stradi, R.; Urien, S.; Tillement, J.; Bertelli, A. Kinetics of trans-and cis-resveratrol (3,4′,5-trihydroxystilbene) after red wine oral administration in rats. Int. J. Clin. Pharmacol. Res. 1996, 16, 77–81. [Google Scholar] [PubMed]
- Summerlin, N.; Soo, E.; Thakur, S.; Qu, Z.; Jambhrunkar, S.; Popat, A. Resveratrol nanoformulations: Challenges and opportunities. Int. J. Pharm. 2015, 479, 282–290. [Google Scholar] [CrossRef] [PubMed]
- Spigno, G.; Donsì, F.; Amendola, D.; Sessa, M.; Ferrari, G.; De Faveri, D.M. Nanoencapsulation systems to improve solubility and antioxidant efficiency of a grape marc extract into hazelnut paste. J. Food Eng. 2013, 114, 207–214. [Google Scholar] [CrossRef]
- Lee, C.-W.; Yen, F.-L.; Huang, H.-W.; Wu, T.-H.; Ko, H.-H.; Tzeng, W.-S.; Lin, C.-C. Resveratrol nanoparticle system improves dissolution properties and enhances the hepatoprotective effect of resveratrol through antioxidant and anti-inflammatory pathways. J. Agric. Food Chem. 2012, 60, 4662–4671. [Google Scholar] [CrossRef] [PubMed]
- Isailović, B.D.; Kostić, I.T.; Zvonar, A.; Đorđević, V.B.; Gašperlin, M.; Nedović, V.A.; Bugarski, B.M. Resveratrol loaded liposomes produced by different techniques. Innov. Food Sci. Emerg. Technol. 2013, 19, 181–189. [Google Scholar] [CrossRef]
- Blond, J.; Denis, M.; Bezard, J. Antioxidant action of resveratrol in lipid peroxidation. Sci. Aliment. (France) 1995, 15, 347–358. [Google Scholar]
- Pando, D.; Gutiérrez, G.; Coca, J.; Pazos, C. Preparation and characterization of niosomes containing resveratrol. J. Food Eng. 2013, 117, 227–234. [Google Scholar] [CrossRef]
- Pando, D.; Caddeo, C.; Manconi, M.; Fadda, A.M.; Pazos, C. Nanodesign of olein vesicles for the topical delivery of the antioxidant resveratrol. J. Pharm. Pharmacol. 2013, 65, 1158–1167. [Google Scholar] [CrossRef] [PubMed]
- Peng, H.; Xiong, H.; Li, J.; Xie, M.; Liu, Y.; Bai, C.; Chen, L. Vanillin cross-linked chitosan microspheres for controlled release of resveratrol. Food Chem. 2010, 121, 23–28. [Google Scholar] [CrossRef]
- Kim, S.; Ng, W.K.; Dong, Y.; Das, S.; Tan, R.B. Preparation and physicochemical characterization of trans-resveratrol nanoparticles by temperature-controlled antisolvent precipitation. J. Food Eng. 2012, 108, 37–42. [Google Scholar] [CrossRef]
- Wang, M.; Li, L.; Zhang, X.; Liu, Y.; Zhu, R.; Liu, L.; Fang, Y.; Gao, Z.; Gao, D. Magnetic Resveratrol Liposomes as a New Theranostic Platform for Magnetic Resonance Imaging Guided Parkinson’s Disease Targeting Therapy. ACS Sustain. Chem. Eng. 2018, 6, 17124–17133. [Google Scholar] [CrossRef]
- Shukla, S.P.; Roy, M.; Mukherjee, P.; Das, L.; Neogy, S.; Srivastava, D.; Adhikari, S. Size Selective Green Synthesis of Silver and Gold Nanoparticles: Enhanced Antibacterial Efficacy of Resveratrol Capped Silver Sol. J. Nanosci. Nanotechnol. 2016, 16, 2453–2463. [Google Scholar] [CrossRef] [PubMed]
- Park, S.; Cha, S.-H.; Cho, I.; Park, S.; Park, Y.; Cho, S.; Park, Y. Antibacterial nanocarriers of resveratrol with gold and silver nanoparticles. Mater. Sci. Eng. C 2016, 58, 1160–1169. [Google Scholar] [CrossRef] [PubMed]
- Ganesh Kumar, C.; Poornachandra, Y.; Mamidyala, S.K. Green synthesis of bacterial gold nanoparticles conjugated to resveratrol as delivery vehicles. Colloids Surf. B Biointerfaces 2014, 123, 311–317. [Google Scholar] [CrossRef] [PubMed]
- Laurent, S.; Forge, D.; Port, M.; Roch, A.; Robic, C.; Vander Elst, L.; Muller, R.N. Magnetic Iron Oxide Nanoparticles: Synthesis, Stabilization, Vectorization, Physicochemical Characterizations, and Biological Applications. Chem. Rev. 2008, 108, 2064–2110. [Google Scholar] [CrossRef] [PubMed]
- Canet, E.; Revel, D.; Forrat, R.; Baldy-Porcher, C.; de Lorgeril, M.; Sebbag, L.; Vallee, J.-P.; Didier, D.; Amiel, M. Superparamagnetic iron oxide particles and positive enhancement for myocardial perfusion studies assessed by subsecond T1-weighted MRI. Magn. Reson. Imaging 1993, 11, 1139–1145. [Google Scholar] [CrossRef]
- Thomas, G.; Demoisson, F.; Chassagnon, R.; Popova, E.; Millot, N. One-step continuous synthesis of functionalized magnetite nanoflowers. Nanotechnology 2016, 27, 135604. [Google Scholar] [CrossRef] [PubMed]
- Gupta, A.K.; Gupta, M. Synthesis and surface engineering of iron oxide nanoparticles for biomedical applications. Biomaterials 2005, 26, 3995–4021. [Google Scholar] [CrossRef] [PubMed]
- Perez, J.M.; Josephson, L.; Weissleder, R. Use of Magnetic Nanoparticles as Nanosensors to Probe for Molecular Interactions. ChemBioChem 2004, 5, 261–264. [Google Scholar] [CrossRef] [PubMed]
- Arruebo, M.; Fernández-Pacheco, R.; Ibarra, M.R.; Santamaría, J. Magnetic nanoparticles for drug delivery. Nano Today 2007, 2, 22–32. [Google Scholar] [CrossRef]
- Saraiva, C.; Praça, C.; Ferreira, R.; Santos, T.; Ferreira, L.; Bernardino, L. Nanoparticle-mediated brain drug delivery: Overcoming blood–brain barrier to treat neurodegenerative diseases. J. Control. Release 2016, 235, 34–47. [Google Scholar] [CrossRef] [PubMed]
- Champagne, P.-O.; Westwick, H.; Bouthillier, A.; Sawan, M. Colloidal stability of superparamagnetic iron oxide nanoparticles in the central nervous system: A review. Nanomedicine 2018, 13, 1385–1400. [Google Scholar] [CrossRef] [PubMed]
- Chertok, B.; Moffat, B.A.; David, A.E.; Yu, F.; Bergemann, C.; Ross, B.D.; Yang, V.C. Iron oxide nanoparticles as a drug delivery vehicle for MRI monitored magnetic targeting of brain tumors. Biomaterials 2008, 29, 487–496. [Google Scholar] [CrossRef] [PubMed]
- Chertok, B.; David, A.E.; Yang, V.C. Polyethyleneimine-modified iron oxide nanoparticles for brain tumor drug delivery using magnetic targeting and intra-carotid administration. Biomaterials 2010, 31, 6317–6324. [Google Scholar] [CrossRef] [PubMed]
- Tabatabaei, S.N.; Girouard, H.; Carret, A.-S.; Martel, S. Remote control of the permeability of the blood–brain barrier by magnetic heating of nanoparticles: A proof of concept for brain drug delivery. J. Control. Release 2015, 206, 49–57. [Google Scholar] [CrossRef] [PubMed]
- Dan, M.; Cochran, D.B.; Yokel, R.A.; Dziubla, T.D. Binding, Transcytosis and Biodistribution of Anti-PECAM−1 Iron Oxide Nanoparticles for Brain-Targeted Delivery. PLoS ONE 2013, 8, e81051. [Google Scholar] [CrossRef] [PubMed]
- Chalal, M.; Delmas, D.; Meunier, P.; Latruffe, N.; Vervandier-Fasseur, D. Inhibition of cancer derived cell lines proliferation by synthesized hydroxylated stilbenes and new ferrocenyl-stilbene analogs. Comparison with resveratrol. Molecules 2014, 19, 7850–7868. [Google Scholar] [CrossRef] [PubMed]
- Daubresse, N.; Francesch, C.; Rolando, C. Phase transfer Wittig reaction with 1,3-dioxolan-2-yl-methyltriphenyl phosphonium salts: An efficient method for vinylogation of aromatic aldehydes. Tetrahedron 1998, 54, 10761–10770. [Google Scholar] [CrossRef]
- Sabale, S.; Kandesar, P.; Jadhav, V.; Komorek, R.; Motkuri, R.K.; Yu, X.-Y. Recent developments in the synthesis, properties, and biomedical applications of core/shell superparamagnetic iron oxide nanoparticles with gold. Biomater. Sci. 2017, 5, 2212–2225. [Google Scholar] [CrossRef] [PubMed]
- Nury, T.; Zarrouk, A.; Ragot, K.; Debbabi, M.; Riedinger, J.-M.; Vejux, A.; Aubourg, P.; Lizard, G. 7-Ketocholesterol is increased in the plasma of X-ALD patients and induces peroxisomal modifications in microglial cells: Potential roles of 7-ketocholesterol in the pathophysiology of X-ALD. J. Steroid Biochem. Mol. Boil. 2017, 169, 123–136. [Google Scholar] [CrossRef] [PubMed]
- Franken, N.A.P.; Rodermond, H.M.; Stap, J.; Haveman, J.; van Bree, C. Clonogenic assay of cells in vitro. Nat. Protoc. 2006, 1, 2315. [Google Scholar] [CrossRef] [PubMed]
- Lizard, G.; Gueldry, S.; Deckert, V.; Gambert, P.; Lagrost, L. Evaluation of the cytotoxic effects of some oxysterols and of cholesterol on endothelial cell growth: Methodological aspects. Pathol. Biol. (Paris) 1997, 45, 281–290. [Google Scholar] [PubMed]
- Garvey, M.; Moriceau, B.; Passow, U. Applicability of the FDA assay to determine the viability of marine phytoplankton under different environmental conditions. Mar. Ecol. Prog. Ser. 2007, 352, 17–26. [Google Scholar] [CrossRef]
- Socrates, G. Infrared and Raman Characteristic Group Frequencies: Tables and Charts; John Wiley & Sons: Chichester, UK, 2004. [Google Scholar]
- Zhou, Z.; Li, W.; Sun, W.-J.; Lu, T.; Tong, H.H.; Sun, C.C.; Zheng, Y. Resveratrol cocrystals with enhanced solubility and tabletability. Int. J. Pharm. 2016, 509, 391–399. [Google Scholar] [CrossRef] [PubMed]
- Trela, B.C.; Waterhouse, A.L. Resveratrol: Isomeric Molar Absorptivities and Stability. J. Agric. Food Chem. 1996, 44, 1253–1257. [Google Scholar] [CrossRef]
- López-Nicolás, J.M.; García-Carmona, F. Aggregation state and p K a values of (E)-resveratrol as determined by fluorescence spectroscopy and UV− visible absorption. J. Agric. Food Chem. 2008, 56, 7600–7605. [Google Scholar] [CrossRef] [PubMed]
- Thomas, G.; Demoisson, F.; Boudon, J.; Millot, N. Efficient functionalization of magnetite nanoparticles with phosphonate using a one-step continuous hydrothermal process. Dalton Trans. 2016, 45, 10821–10829. [Google Scholar] [CrossRef] [PubMed]
- Guigue-Millot, N.; Champion, Y.; Hÿtch, M.J.; Bernard, F.; Bégin-Colin, S.; Perriat, P. Chemical Heterogeneities in Nanometric Titanomagnetites Prepared by Soft Chemistry and Studied Ex Situ: Evidence for Fe-Segregation and Oxidation Kinetics. J. Phys. Chem. B 2001, 105, 7125–7132. [Google Scholar] [CrossRef]
- Perriat, P.; Fries, E.; Millot, N.; Domenichini, B. XPS and EELS investigations of chemical homogeneity in nanometer scaled Ti-ferrites obtained by soft chemistry. Solid State Ion. 1999, 117, 175–184. [Google Scholar] [CrossRef]
- Sallem, F.; Boudon, J.; Heintz, O.; Séverin, I.; Megriche, A.; Millot, N. Synthesis and characterization of chitosan-coated titanate nanotubes: Towards a new safe nanocarrier. Dalton Trans. 2017, 46, 15386–15398. [Google Scholar] [CrossRef] [PubMed]
- Jesionowski, T.; Ciesielczyk, F.; Krysztafkiewicz, A. Influence of selected alkoxysilanes on dispersive properties and surface chemistry of spherical silica precipitated in emulsion media. Mater. Chem. Phys. 2010, 119, 65–74. [Google Scholar] [CrossRef]
- Ishida, H.; Koenig, J.L. Fourier transform infrared spectroscopic study of the structure of silane coupling agent on E-glass fiber. J. Colloid Interface Sci. 1978, 64, 565–576. [Google Scholar] [CrossRef]
- Chuang, W.; Geng-sheng, J.; Lei, P.; Bao-lin, Z.; Ke-zhi, L.; Jun-long, W. Influences of surface modification of nano-silica by silane coupling agents on the thermal and frictional properties of cyanate ester resin. Results Phys. 2018, 9, 886–896. [Google Scholar] [CrossRef]
- Aranda, A.; Sequedo, L.; Tolosa, L.; Quintas, G.; Burello, E.; Castell, J.V.; Gombau, L. Dichloro-dihydro-fluorescein diacetate (DCFH-DA) assay: A quantitative method for oxidative stress assessment of nanoparticle-treated cells. Toxicol. Vitro 2013, 27, 954–963. [Google Scholar] [CrossRef] [PubMed]
- Maurizi, L.; Papa, A.-L.; Dumont, L.; Bouyer, F.; Walker, P.; Vandroux, D.; Millot, N. Influence of surface charge and polymer coating on internalization and biodistribution of polyethylene glycol-modified iron oxide nanoparticles. J. Biomed. Nanotechnol. 2015, 11, 126–136. [Google Scholar] [CrossRef] [PubMed]
- Bollu, V.S.; Barui, A.K.; Mondal, S.K.; Prashar, S.; Fajardo, M.; Briones, D.; Rodríguez-Diéguez, A.; Patra, C.R.; Gómez-Ruiz, S. Curcumin-loaded silica-based mesoporous materials: Synthesis, characterization and cytotoxic properties against cancer cells. Mater. Sci. Eng. C 2016, 63, 393–410. [Google Scholar] [CrossRef] [PubMed]
- Geerlings, P.; Tafazoli, M.; Kirsch-Volders, M.; Baeten, A. In vitro mutagenicity and genotoxicity study of a number of short-chain chlorinated hydrocarbons using the micronudeus test and the alkaline single cell gel electrophoresis technique (Comet assay) in human lymphocytes: A structure–activity relationship (QSAR) analysis of the genotoxic and cytotoxic potential. Mutagenesis 1998, 13, 115–126. [Google Scholar] [CrossRef]
- Sruthi, S.; Maurizi, L.; Nury, T.; Sallem, F.; Boudon, J.; Riedinger, J.M.; Millot, N.; Bouyer, F.; Lizard, G. Cellular interactions of functionalized superparamagnetic iron oxide nanoparticles on oligodendrocytes without detrimental side effects: Cell death induction, oxidative stress and inflammation. Colloids Surf. B Biointerfaces 2018, 170, 454–462. [Google Scholar] [CrossRef] [PubMed]


| Element (%) | C1s | O1s | N1s | Si2p | Ca2p | C/N |
|---|---|---|---|---|---|---|
| Calculated | 85.0 | 10.0 | 5.0 | - | - | 17 |
| Experimental | 81.1 | 14.3 | 3.4 | 0.4 | 0.8 | 23 |
| Element | C1s | O1s | N1s | |||
|---|---|---|---|---|---|---|
| Chemical bonds | C-C/C-H | C-O/C-N | C=O | H-O-C | C-O-C | -NH2 |
| Calculated (%) | 76.5 | 23.5 | - | 50.0 | 50.0 | 100.0 |
| Experimental (%) | 70.0 | 24.0 | 6.0 | 54.0 | 46.0 | 100.0 |
| Parameter | Bare SPIONs | SPIONs-CPTES | SPIONs-CPTES- HAPtS | |
|---|---|---|---|---|
| Isoelectric point | 8.3 | 5.9 | 8.2 | |
| Hydrodynamic size in water | dH (number) (nm) | 21 ± 8 | 26 ± 7 | 92 ± 20 |
| PDI | 0.157 ± 0.004 | 0.189 ± 0.003 | 0.329 ± 0.026 | |
| Z-average (nm) | 67 ± 1 | 96 ± 5 | 145 ± 10 | |
| Hydrodynamic size in PBS 0.1× | dH (number) (nm) | 60 ± 9 | 50 ± 8 | 118 ± 25 |
| PDI | 0.489 ± 0.016 | 0.230 ± 0.004 | 0.410 ± 0.012 | |
| Z-average (nm) | 299 ± 16 | 135 ± 12 | 220 ± 8 | |
| TEM measured diameter (nm) | 9.0 ± 2.0 | 8.7 ± 1.5 | 9.6 ± 1.6 | |
| Element (%) | C1s | O1s | Fe2p | N1s | Si2p | Cl2p | Cl/Si |
|---|---|---|---|---|---|---|---|
| Bare SPIONs | 3.0 | 57.5 | 38.4 | 1.1 | - | - | - |
| Element SPIONs/Fe | 0.08 | 1.50 | 1.00 | 0.03 | |||
| SPIONs-CPTES | 15.2 | 49.1 | 28.2 | - | 5.3 | 2.2 | 0.4 |
| Element SPIONs-CPTES/Fe | 0.54 | 1.74 | 1.00 | - | 0.19 | 0.07 | - |
| SPIONs-CPTES-HAPtS | 21.6 | 48.0 | 24.7 | 0.4 | 4.2 | 1.1 | 0.2 |
| Element SPIONs-CPTES-HAPtS/Fe | 0.87 | 1.94 | 1.00 | 0.02 | 0.17 | 0.04 | - |
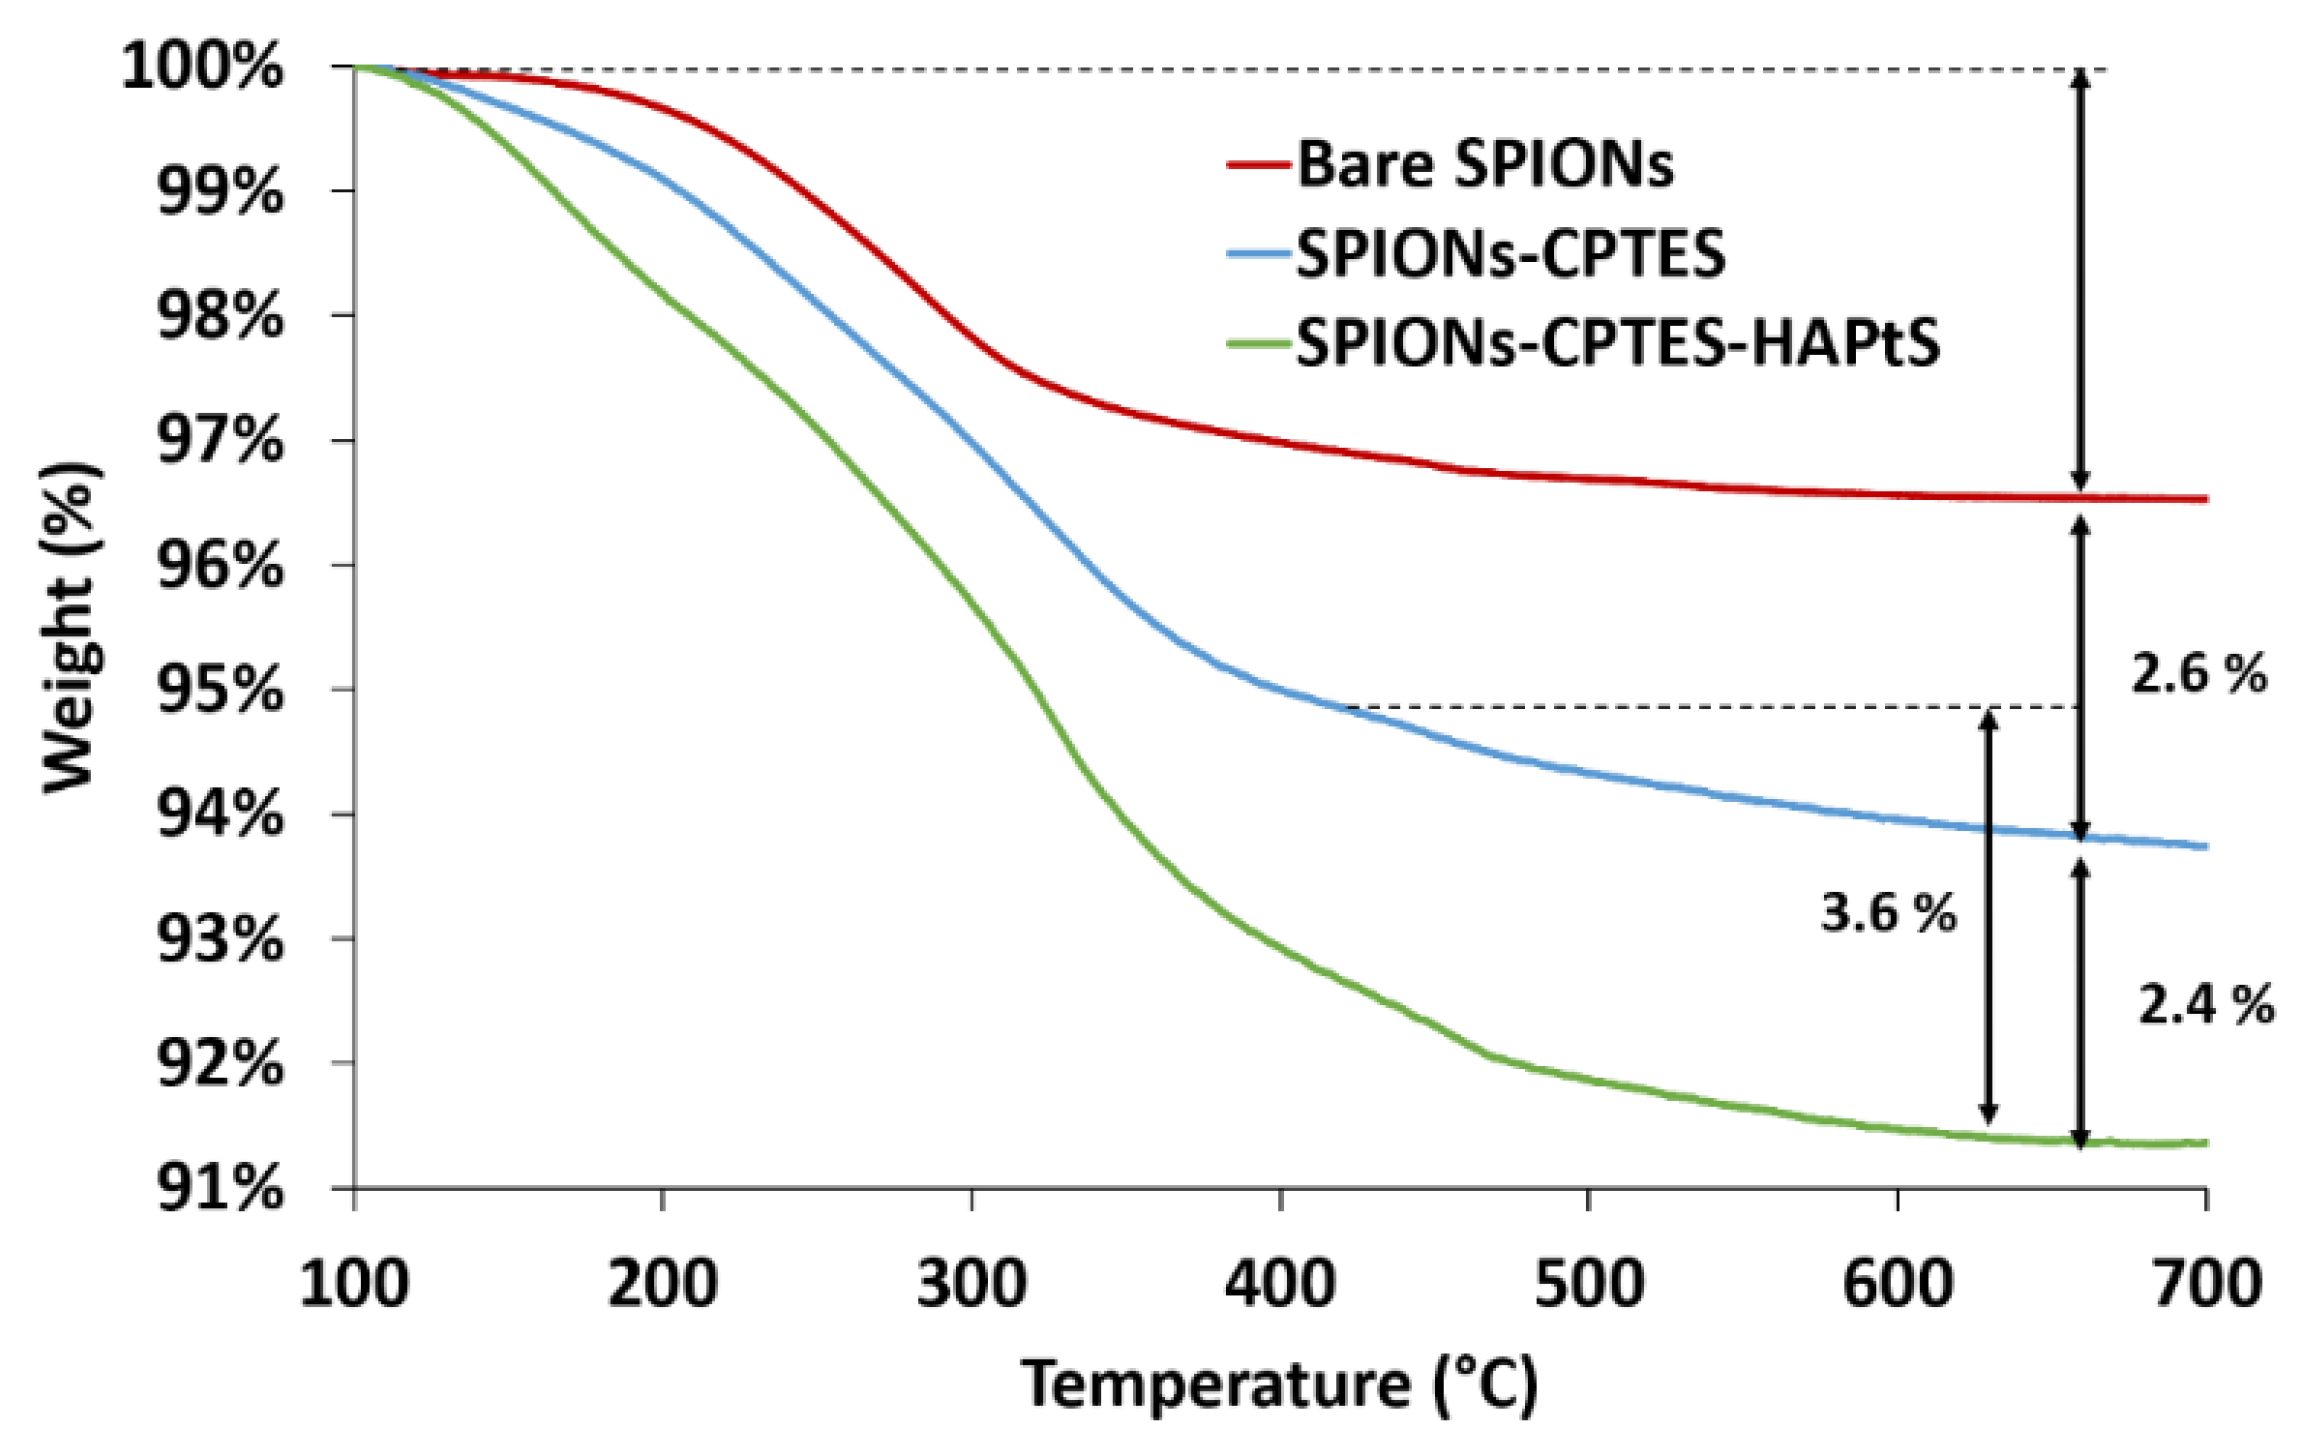
| Samples | Weight Loss (%) | Degraded Molecule during Heating | Compounds on SPIONs Surface | ||
|---|---|---|---|---|---|
| Chemical Formula | Molecular Weight (g·mol−1) | molecule·nm−² | µmol·g−1 SPIONs | ||
| Bare SPIONs | 3.5 | H2O | 18 | 10.3 (OH) | 1944 (OH) |
| SPIONs-CPTES | 2.6 | -(CH2)3-Cl | 78 | 1.8 (CPTES) | 340 (CPTES) |
| SPIONs-CPTES-HAPtS | 3.6 | -(CH2)3-NH-C17H17O2 | 310 | 0.6 (HAPtS) | 116 (HAPtS) |
© 2019 by the authors. Licensee MDPI, Basel, Switzerland. This article is an open access article distributed under the terms and conditions of the Creative Commons Attribution (CC BY) license (http://creativecommons.org/licenses/by/4.0/).
Share and Cite
Sallem, F.; Haji, R.; Vervandier-Fasseur, D.; Nury, T.; Maurizi, L.; Boudon, J.; Lizard, G.; Millot, N. Elaboration of Trans-Resveratrol Derivative-Loaded Superparamagnetic Iron Oxide Nanoparticles for Glioma Treatment. Nanomaterials 2019, 9, 287. https://0-doi-org.brum.beds.ac.uk/10.3390/nano9020287
Sallem F, Haji R, Vervandier-Fasseur D, Nury T, Maurizi L, Boudon J, Lizard G, Millot N. Elaboration of Trans-Resveratrol Derivative-Loaded Superparamagnetic Iron Oxide Nanoparticles for Glioma Treatment. Nanomaterials. 2019; 9(2):287. https://0-doi-org.brum.beds.ac.uk/10.3390/nano9020287
Chicago/Turabian StyleSallem, Fadoua, Rihab Haji, Dominique Vervandier-Fasseur, Thomas Nury, Lionel Maurizi, Julien Boudon, Gérard Lizard, and Nadine Millot. 2019. "Elaboration of Trans-Resveratrol Derivative-Loaded Superparamagnetic Iron Oxide Nanoparticles for Glioma Treatment" Nanomaterials 9, no. 2: 287. https://0-doi-org.brum.beds.ac.uk/10.3390/nano9020287