Enhanced Photocatalytic Degradation of Organic Dyes via Defect-Rich TiO2 Prepared by Dielectric Barrier Discharge Plasma

 , ,
, ,
Abstract
:
1. Introduction
2. Experimental Section
2.1. Sample Preparation
2.2. Catalyst Characterization
2.3. Photocatalytic Activity Measurements
2.4. Apparent Quantum Efficiency Measurement
3. Results and Discussion
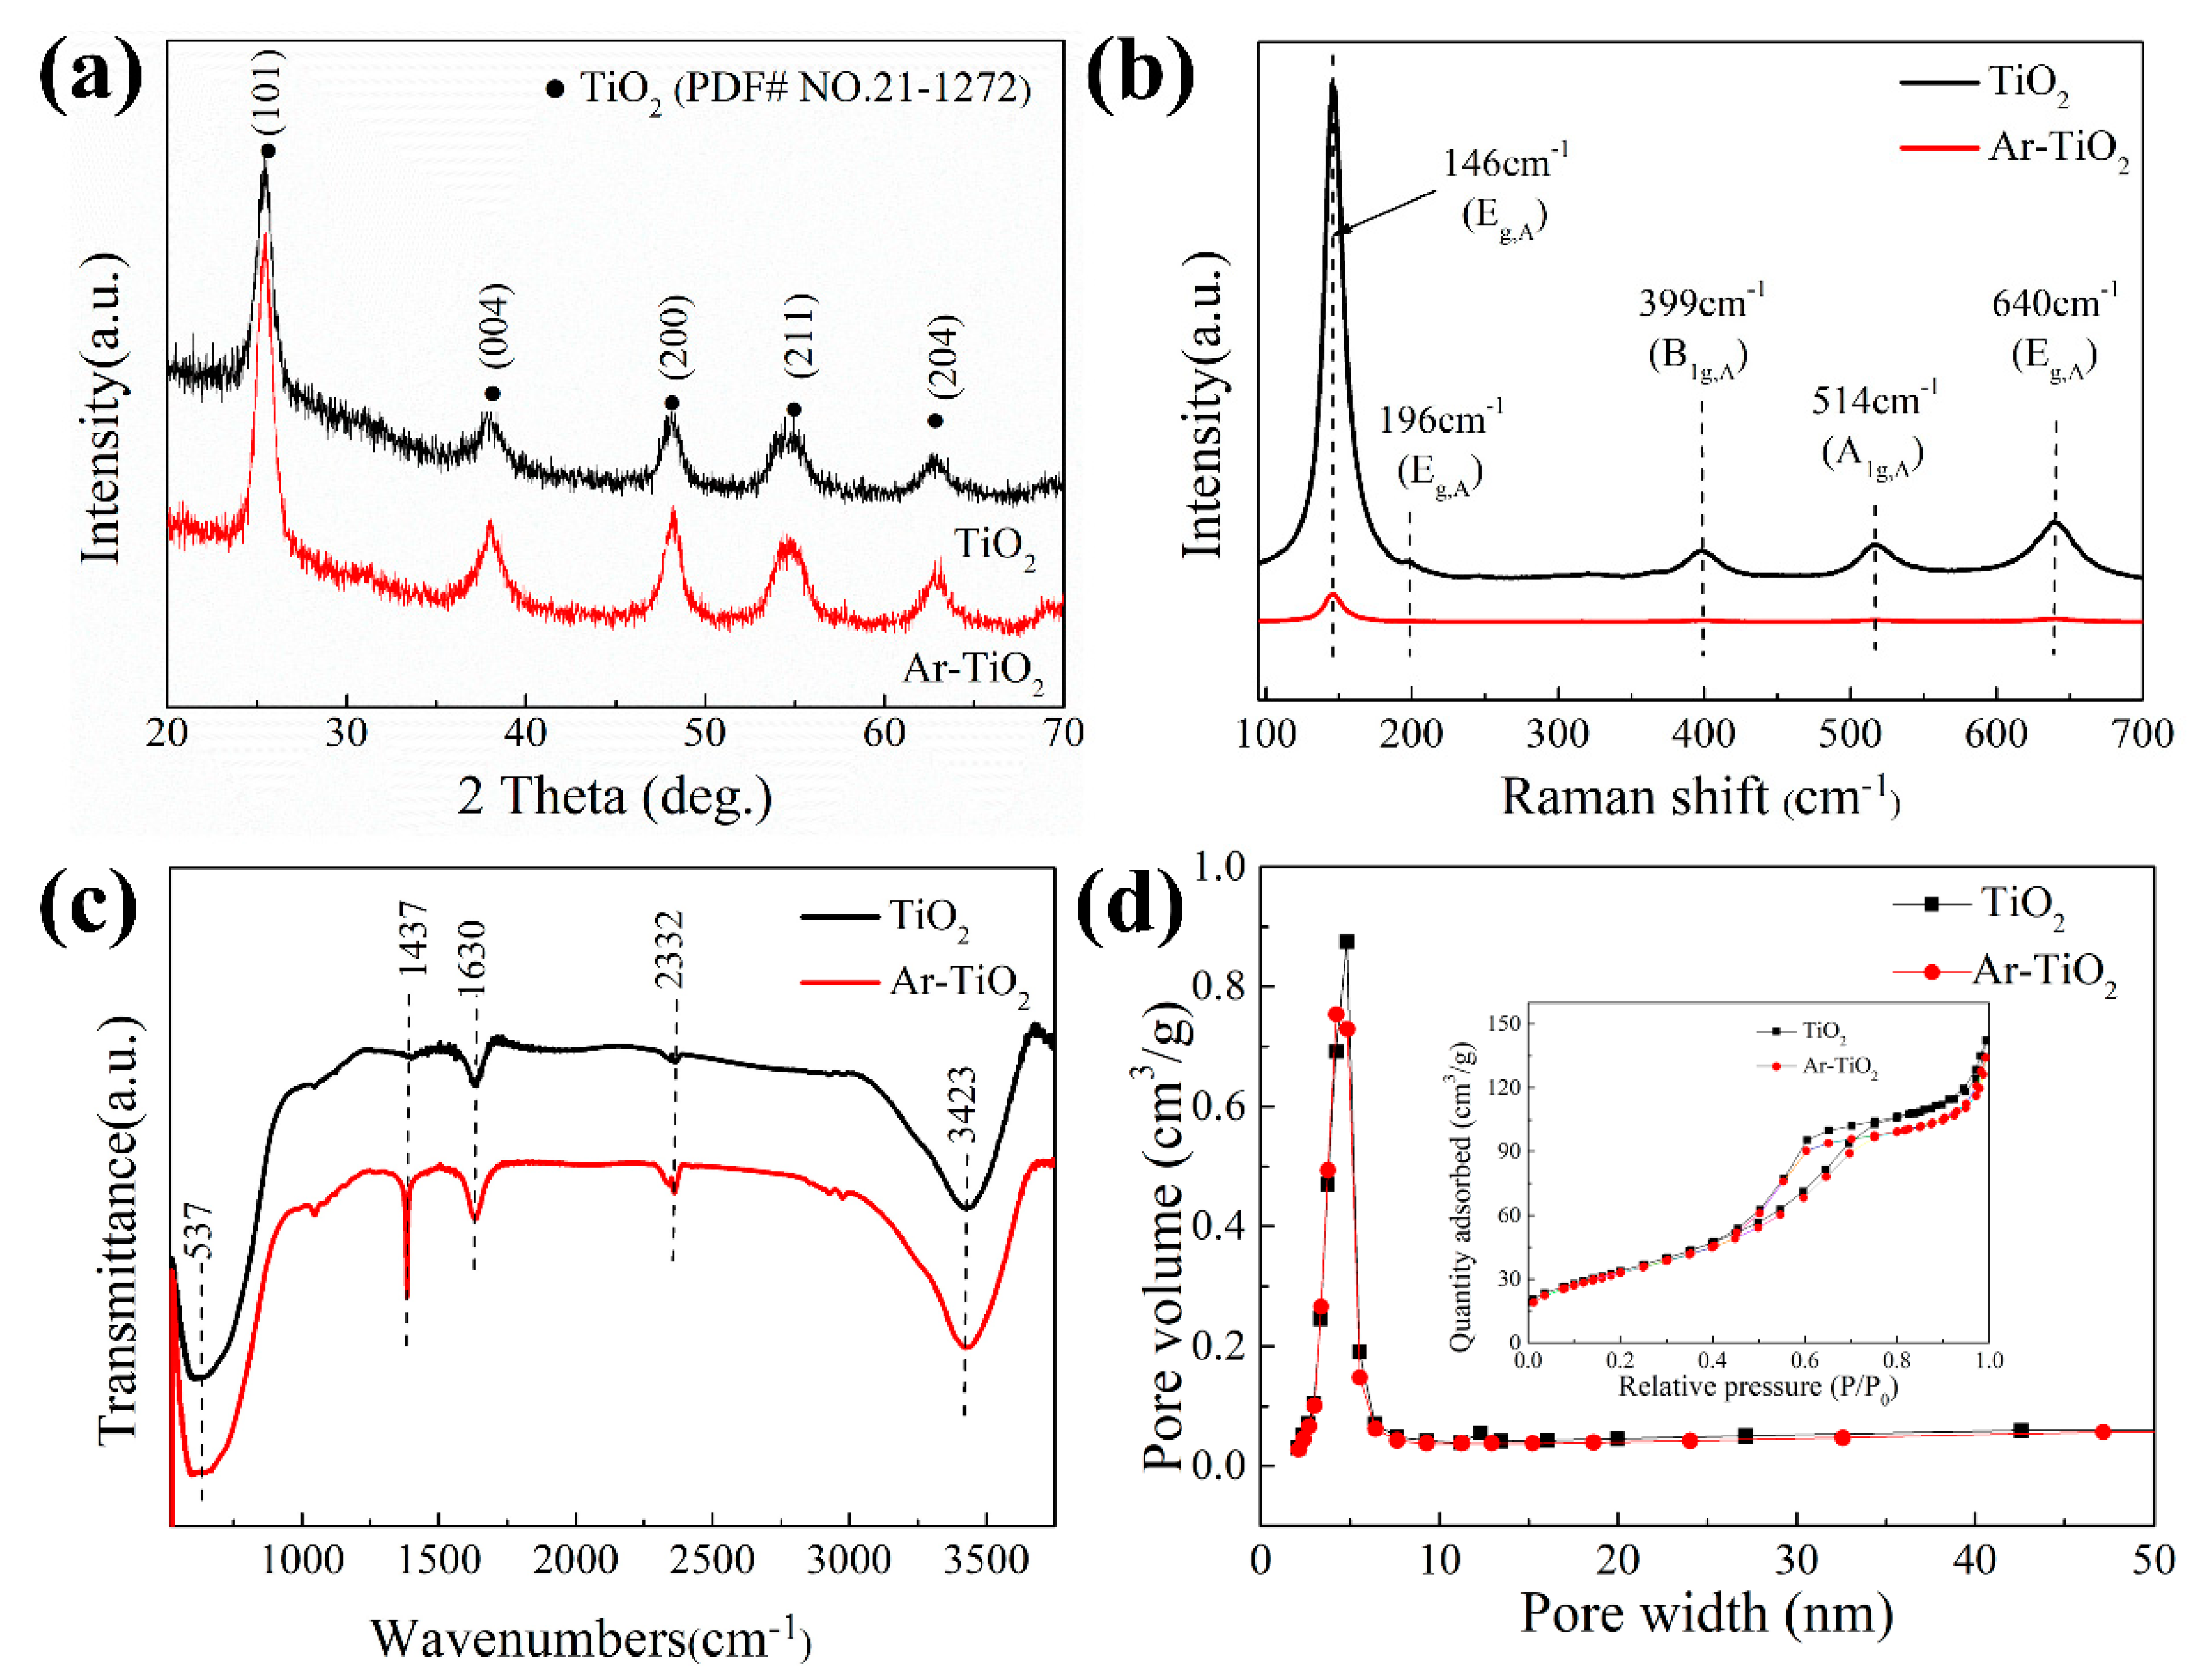
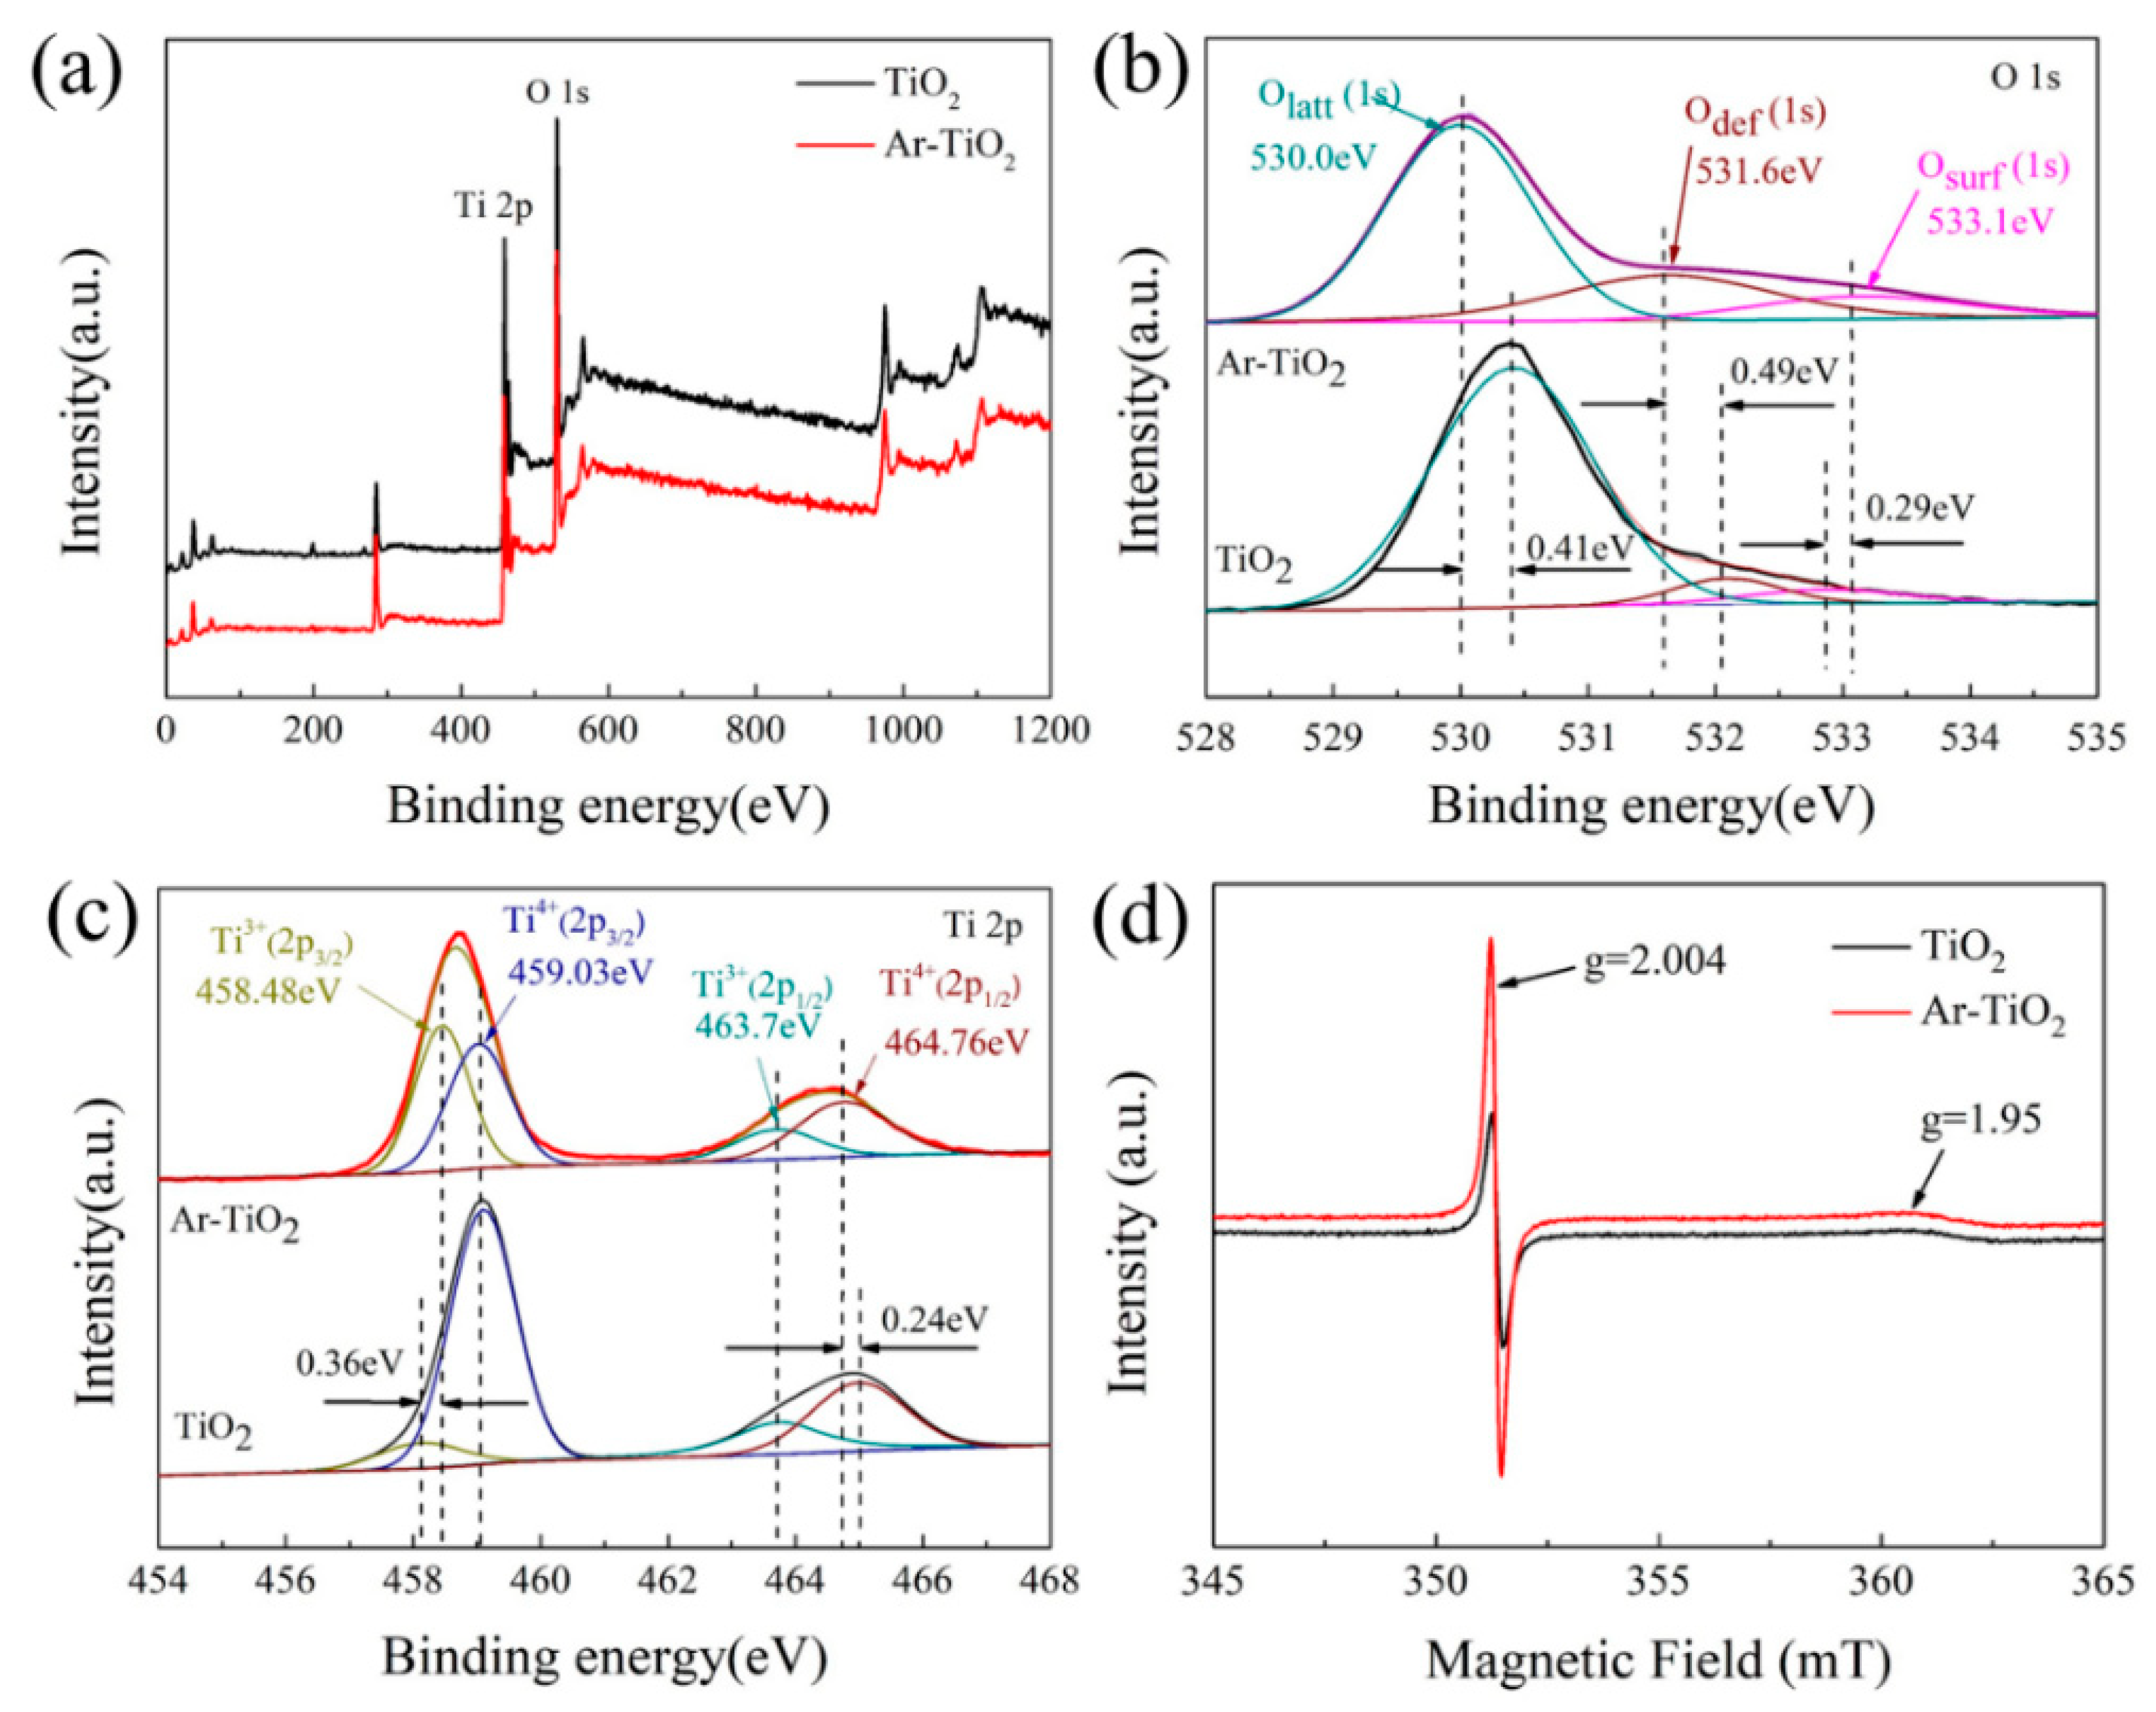
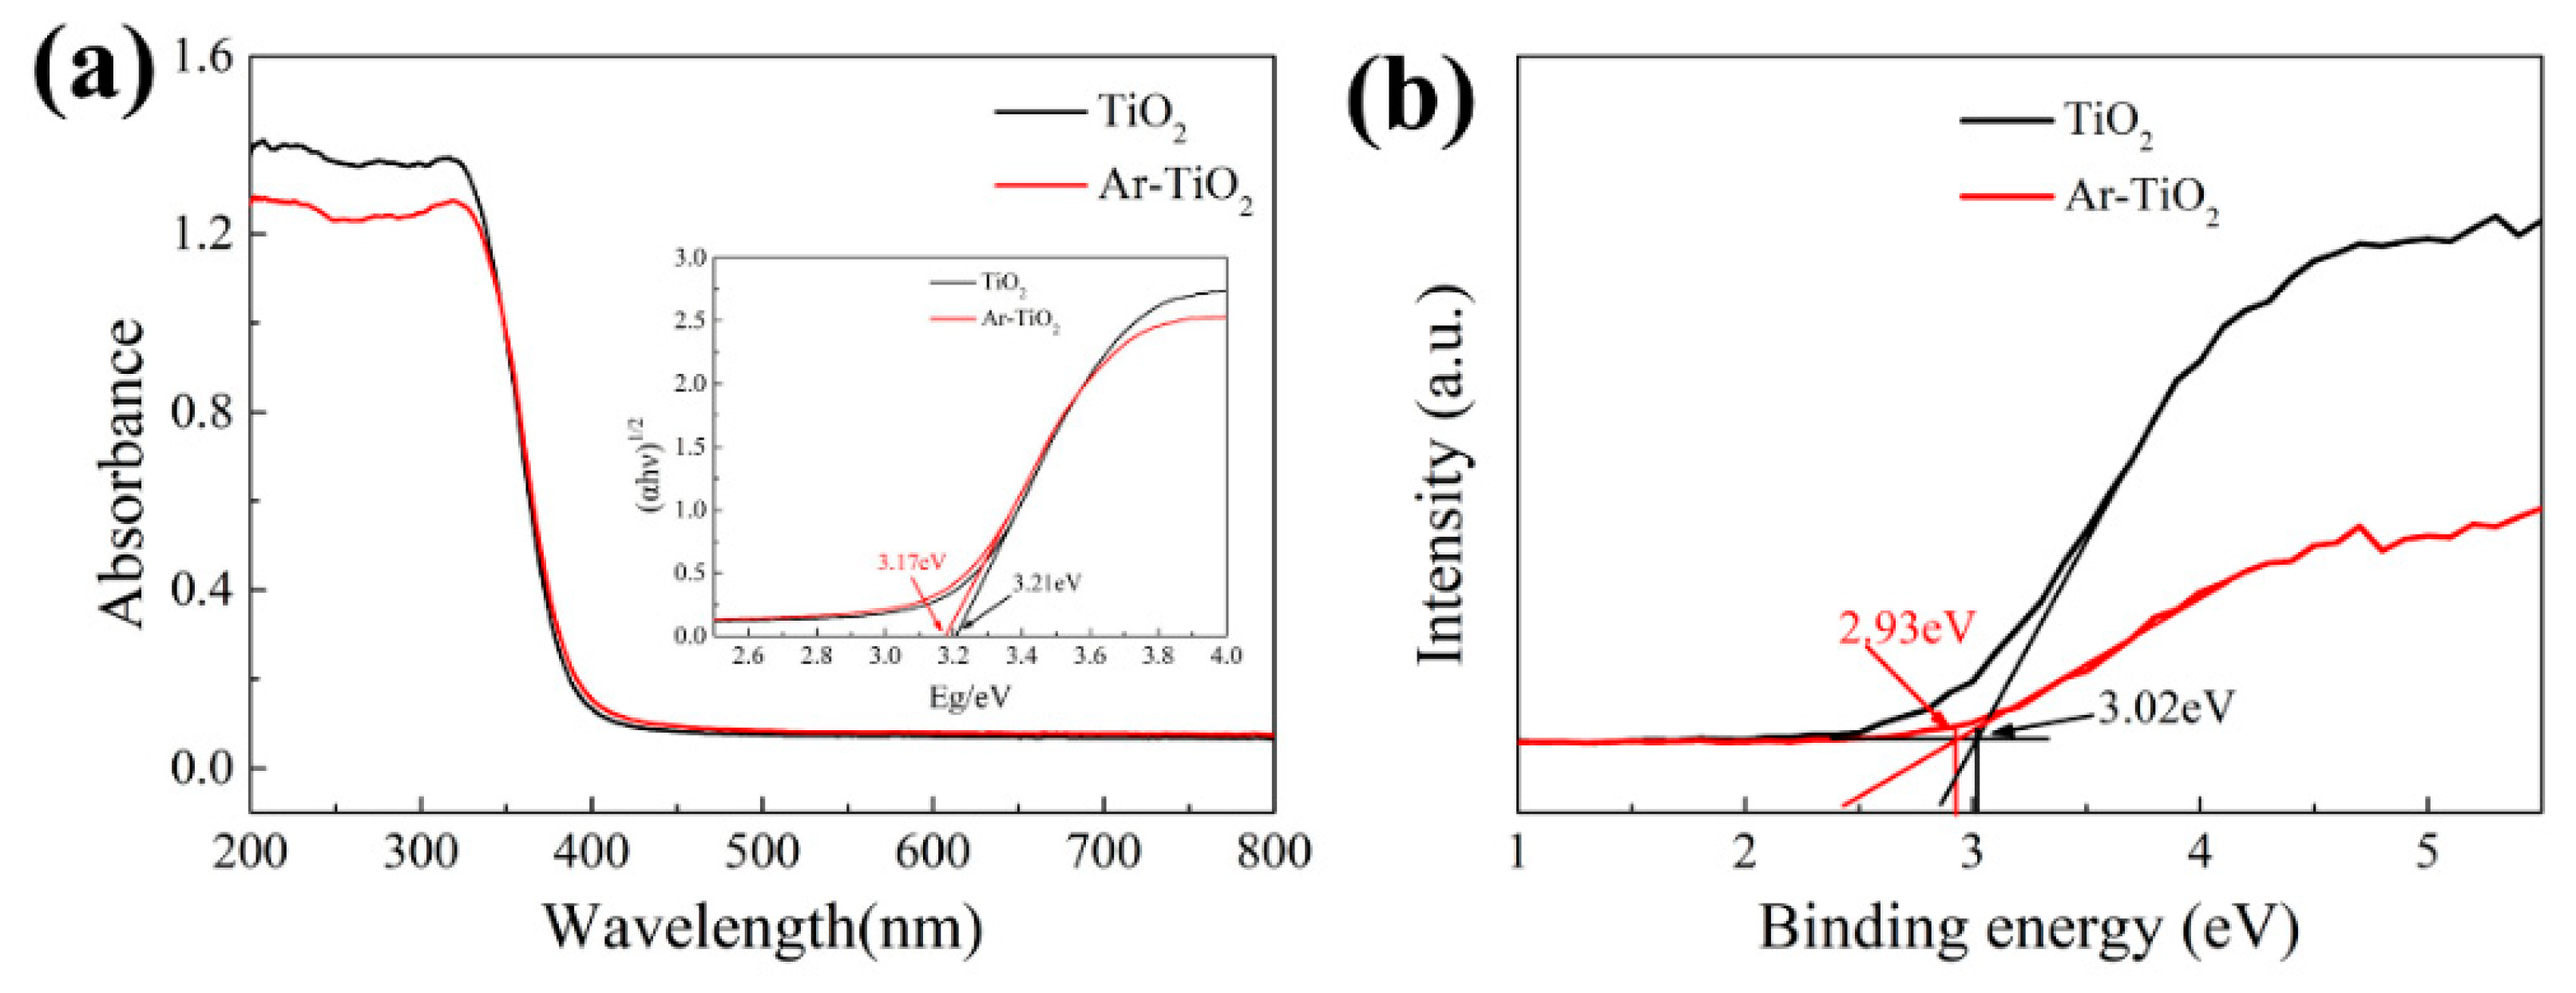
3.1. Physicochemical Properties of Catalysts
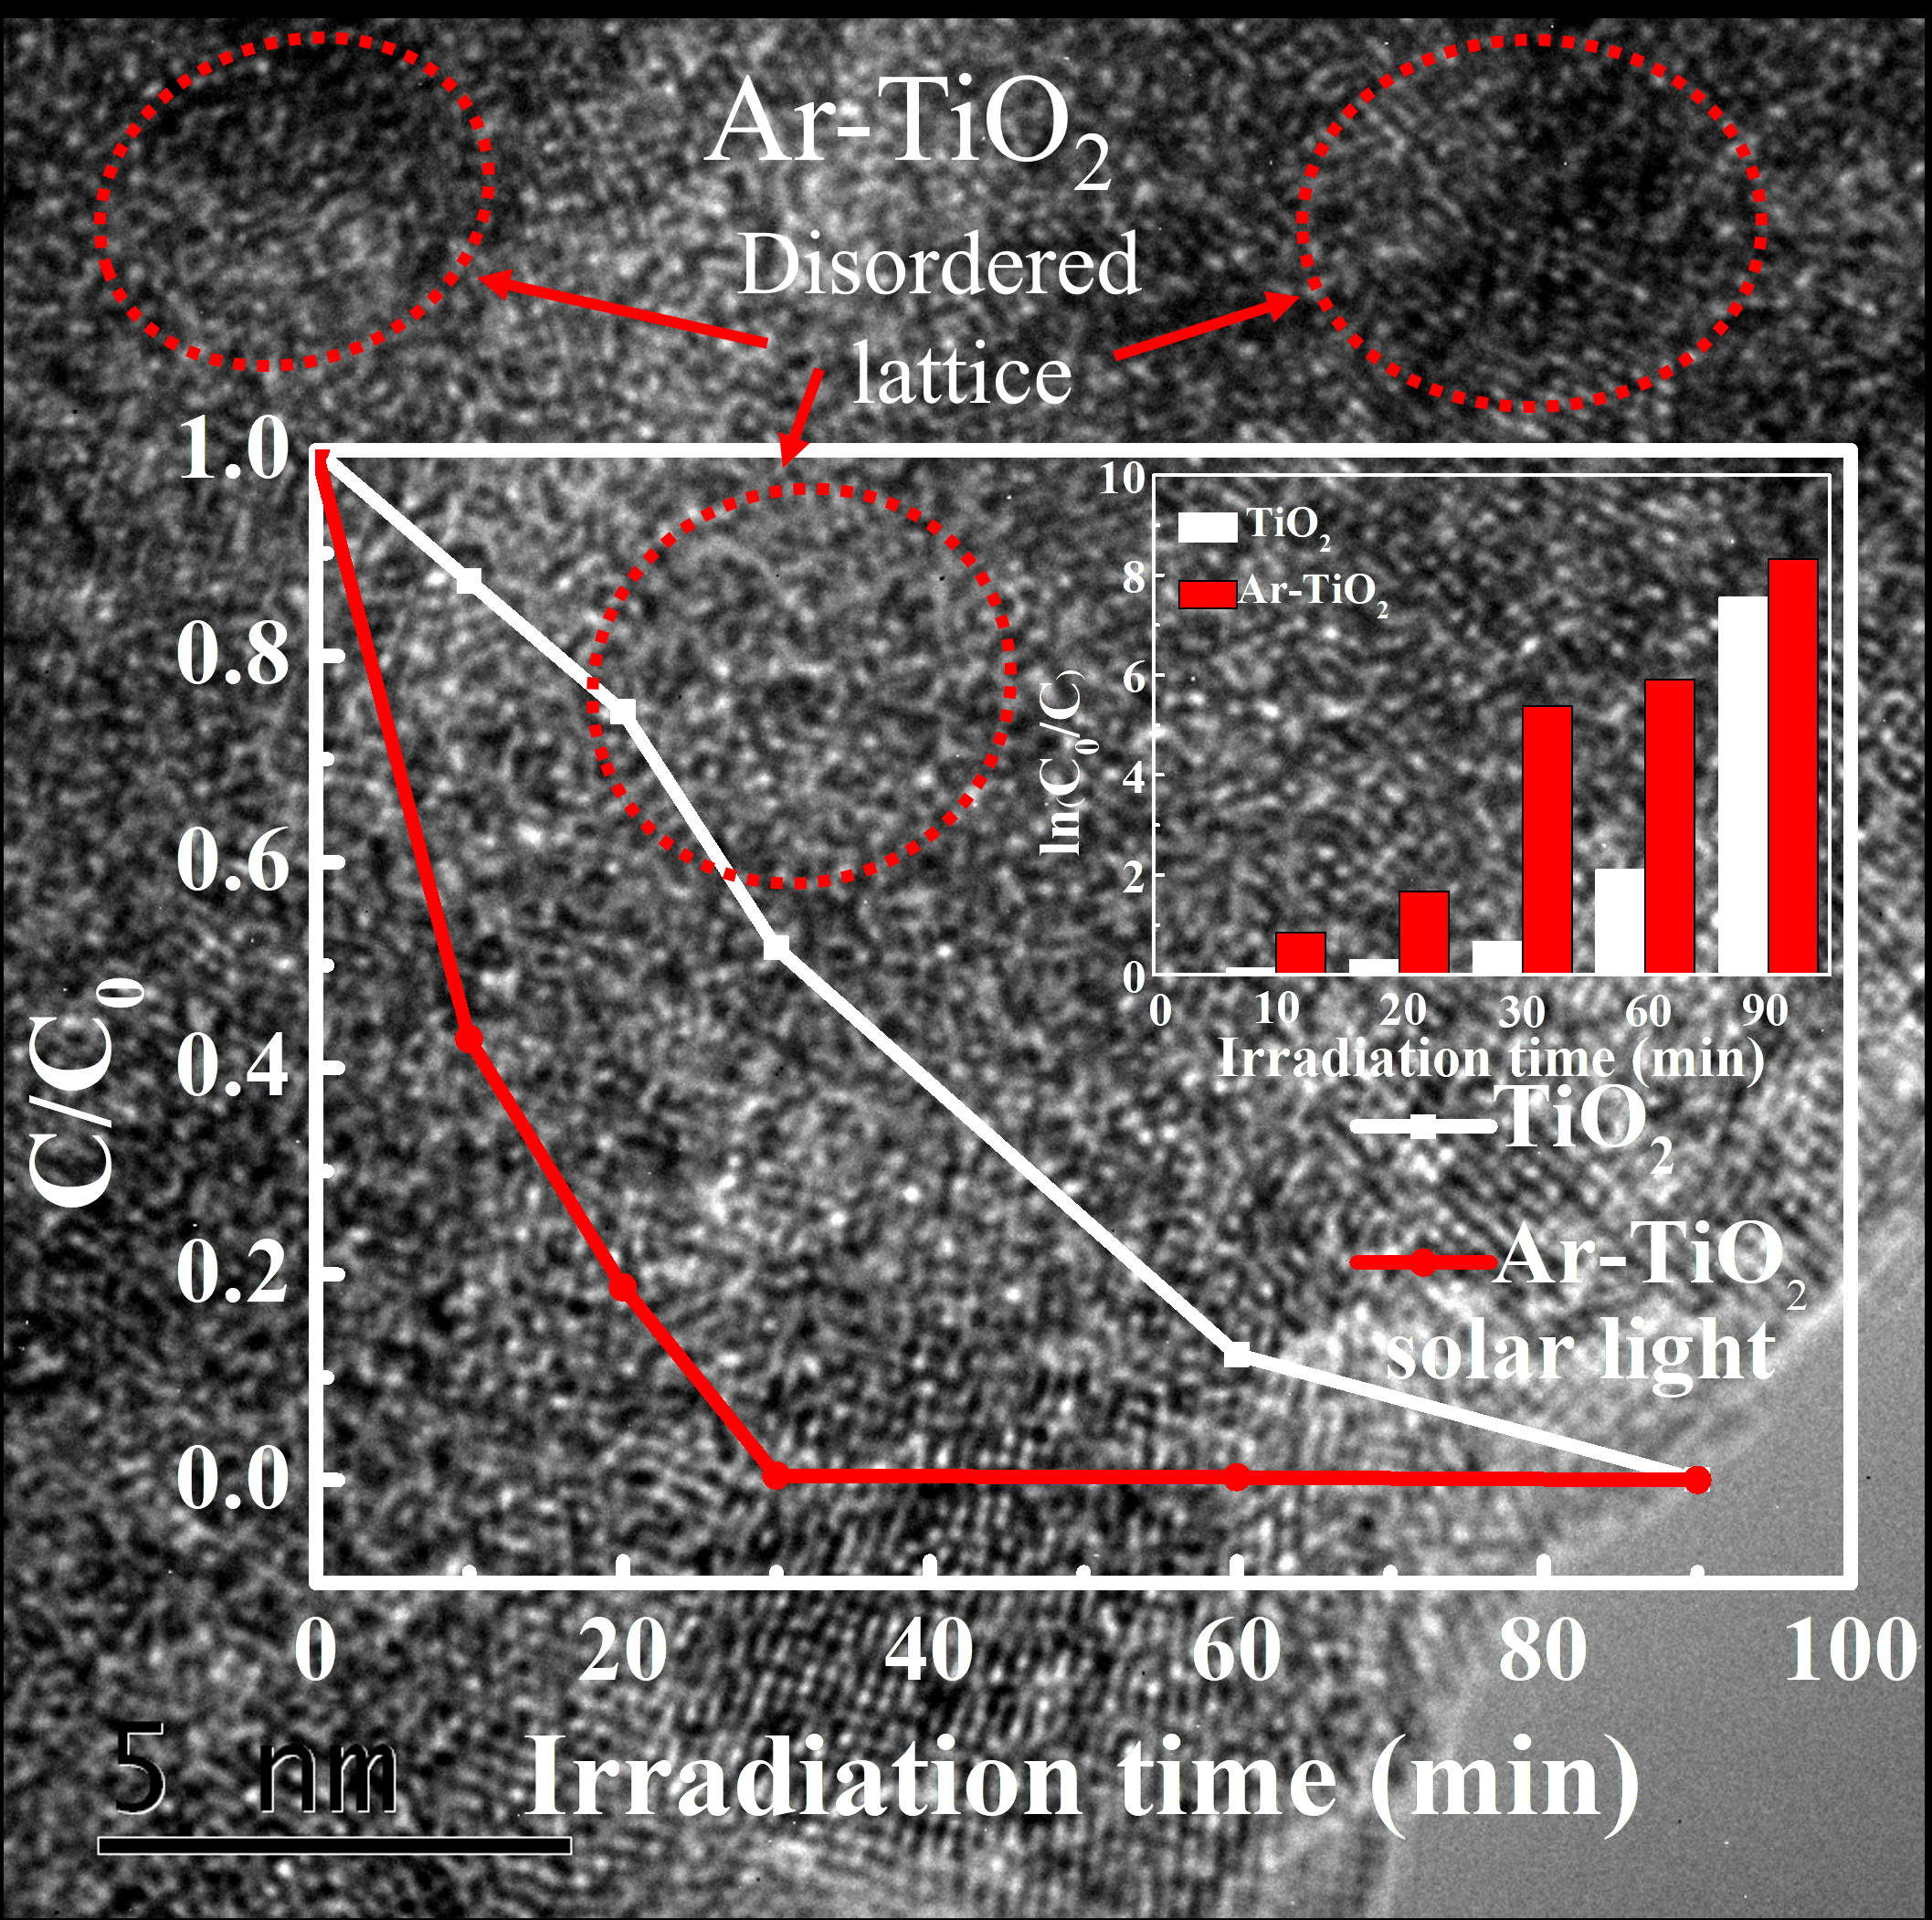
3.2. Morphological Characterization
3.3. Photocatalytic Performance
4. Conclusions
Author Contributions
Funding
Conflicts of Interest
References
- Wang, Y.; Zhu, M.; Li, Y.; Zhang, M.; Xue, X.; Shi, Y.; Dai, B.; Guo, X.; Feng, Y. Heteroatom-doped porous carbon from methyl orange dye wastewater for oxygen reduction. Green Energy Environ. 2017, 3, 172–178. [Google Scholar] [CrossRef]
- Song, C.; Zhao, J.; Li, H.; Liu, L.; Xuan, L.; Xing, H.; Liu, H.; Yu, Y. One-pot synthesis and combined use of modified cotton adsorbent and flocculant for purifying dyeing wastewater. ACS Sustain. Chem. Eng. 2018, 6, 6876–6888. [Google Scholar] [CrossRef]
- Vakili, M.; Rafatullah, M.; Salamatinia, B.; Abdullah, A.Z.; Ibrahim, M.H.; Tan, K.B.; Gholami, Z.; Amouzgar, P. Application of chitosan and its derivatives as adsorbents for dye removal from water and wastewater: A review. Carbohydr. Polym. 2014, 113, 115–130. [Google Scholar] [CrossRef] [PubMed]
- Nguyen, N.T.; Altomare, M.; Yoo, J.; Schmuki, P. Efficient photocatalytic H2 evolution: Controlled dewetting-dealloying to fabricate site-selective high-activity nanoporous au particles on highly ordered TiO2 nanotube arrays. Adv. Mater. 2015, 27, 3208–3215. [Google Scholar] [CrossRef]
- Nebel, C.E. Photocatalysis: A source of energetic electrons. Nat. Mater. 2013, 12, 780–781. [Google Scholar] [CrossRef]
- Murphy, C.J.; Buriak, J.M. Best Practices for the Reporting of Colloidal Inorganic Nanomaterials. Chem. Mater. 2015, 27, 4911–4913. [Google Scholar] [CrossRef]
- Hoque, M.; Guzman, M. Photocatalytic Activity: Experimental Features to Report in Heterogeneous Photocatalysis. Materials 2018, 11, 1990. [Google Scholar] [CrossRef]
- Boerigter, C.; Campana, R.; Morabito, M.; Linic, S. Evidence and implications of direct charge excitation as the dominant mechanism in plasmon-mediated photocatalysis. Nat. Commun. 2016, 7, 10545. [Google Scholar] [CrossRef] [PubMed] [Green Version]
- Wang, Y.; Sun, H.; Tan, S.; Feng, H.; Cheng, Z.; Zhao, J.; Zhao, A.; Wang, B.; Luo, Y.; Yang, J. Role of point defects on the reactivity of reconstructed anatase titanium dioxide (001) surface. Nat. Commun. 2013, 4, 2214. [Google Scholar] [CrossRef]
- Etacheri, V.; Valentin, C.D.; Schneider, J.; Bahnemann, D.; Pillai, S.C. Visible-light activation of TiO2 photocatalysts: Advances in theory and experiments. J. Photochem. Photobiol. C 2015, 25, 1–29. [Google Scholar] [CrossRef]
- Pelaez, M.; Nolan, N.T.; Pillai, S.C.; Seery, M.K.; Falaras, P.; Kontos, A.G.; Dunlop, P.S.M.; Hamilton, J.W.J.; Byrne, J.A.; O’Shea, K. A review on the visible light active titanium dioxide photocatalysts for environmental applications. Appl. Catal. B Environ. 2012, 125, 331–349. [Google Scholar] [CrossRef] [Green Version]
- Jenny, S.; Masaya, M.; Masato, T.; Jinlong, Z.; Yu, H.; Masakazu, A.; Bahnemann, D.W. Understanding TiO2 photocatalysis: Mechanisms and materials. Chem. Rev. 2014, 114, 9919–9986. [Google Scholar]
- Banerjee, S.; Dionysiou, D.D.; Pillai, S.C. Self-cleaning applications of TiO2 by photo-induced hydrophilicity and photocatalysis. Appl. Catal. B Environ. 2015, 176–177, 396–428. [Google Scholar] [CrossRef]
- Xu, F.; Zhang, J.; Zhu, B.; Yu, J.; Xu, J. CuInS2 sensitized TiO2 hybrid nanofibers for improved photocatalytic CO2 reduction. Appl. Catal. B Environ. 2018, 230, 194–202. [Google Scholar] [CrossRef]
- Chen, W.; Wang, Y.; Shangguan, W. Metal (oxide) modified (M= Pd, Ag, Au and Cu) H2SrTa2O7 for photocatalytic CO2 reduction with H2O: The effect of cocatalysts on promoting activity toward CO and H2 evolution. Int. J. Hydrogen Energy 2019, 44, 4123–4132. [Google Scholar] [CrossRef]
- Nakata, K.; Fujishima, A. TiO2 photocatalysis: Design and applications. J. Photochem. Photobiol. C 2012, 13, 169–189. [Google Scholar] [CrossRef]
- Hoffmann, M.R.; Martin, S.T.; Choi, W.; Bahnemann, D.W. Environmental applications of semiconductor photocatalysis. Chem. Rev. 1995, 95, 69–96. [Google Scholar] [CrossRef]
- Fujishima, A.; Zhang, X.; Tryk, D.A. Heterogeneous photocatalysis: From water photolysis to applications in environmental cleanup. Int. J. Hydrogen Energy 2007, 32, 2664–2672. [Google Scholar] [CrossRef]
- Wang, R.; Hashimoto, K.; Fujishima, A.; Chikuni, M.; Kojima, E.; Kitamura, A.; Shimohigoshi, M.; Watanabe, T. Light-induced amphiphilic surfaces. Nature 1997, 388, 431–432. [Google Scholar] [CrossRef]
- Chen, X.; Lei, L.; Huang, F. Cheminform abstract: Black titanium dioxide (TiO2) nanomaterials. Chem. Soc. Rev. 2015, 46, 1861–1885. [Google Scholar] [CrossRef]
- Xiaobo, C.; Clemens, B. The electronic origin of the visible-light absorption properties of C-, N- and s-doped TiO2 nanomaterials. J. Am. Chem. Soc. 2008, 130, 5018–5019. [Google Scholar]
- Shin, S.W.; Lee, J.Y.; Ahn, K.S.; Kang, S.H.; Jin, H.K. Visible light absorbing TiO2 nanotube arrays by sulfur treatment for photoelectrochemical water splitting. J. Phys. Chem. C 2015, 119, 13375–13383. [Google Scholar] [CrossRef]
- Gui-Sheng, L.; Die-Qing, Z.; Yu, J.C. A new visible-light photocatalyst: Cds quantum dots embedded mesoporous TiO2. Environ. Sci. Technol. 2009, 43, 7079–7085. [Google Scholar]
- Jiang, D.; Xu, Y.; Wu, D.; Sun, Y. Visible-light responsive dye-modified TiO2 photocatalyst. J. Solid State Chem. 2008, 181, 593–602. [Google Scholar] [CrossRef]
- Saji, G.; Suman, P.; Zhaoxia, J.; Henderson, B.L.; Tian, X.; Linjiang, L.; Zink, J.I.; Nel, A.E.; Lutz, M.D. Role of fe doping in tuning the band gap of TiO2 for the photo-oxidation-induced cytotoxicity paradigm. J. Am. Chem. Soc. 2011, 133, 11270–11278. [Google Scholar]
- Han, Y.X.; Yang, C.L.; Wang, M.S.; Ma, X.G.; Wang, L.Z. Enhancing the visible-light absorption of TiO2 with the use of key n, co, and na dopant concentrations. Energy Mater. Sol. Cells 2015, 132, 94–100. [Google Scholar] [CrossRef]
- Lee, H.U.; Lee, S.C.; Choi, S.H.; Son, B.; Lee, S.J.; Kim, H.J.; Lee, J. Highly visible-light active nanoporous TiO2 photocatalysts for efficient solar photocatalytic applications. Appl. Catal. B Environ. 2013, 129, 106–113. [Google Scholar] [CrossRef]
- Wan, H.; Yao, W.; Zhu, W.; Yi, T.; Ge, H.; Shi, X.; Tao, D. Fe-N co-doped SiO2 @TiO2 yolk-shell hollow nanospheres with enhanced visible light photocatalytic degradation. Appl. Surf. Sci. 2018, 444, 355–363. [Google Scholar] [CrossRef]
- Chen, S.; Li, X.; Zhou, W.; Zhang, S.; Fang, Y. Carbon-coated Cu-TiO2 nanocomposite with enhanced photostability and photocatalytic activity. Appl. Surf. Sci. 2019, 466, 254–261. [Google Scholar] [CrossRef]
- Aguirre, M.E.; Zhou, R.; Eugene, A.J.; Guzman, M.I.; Grela, M.A. Cu2O/TiO2 heterostructures for CO2 reduction through a direct Z-scheme: Protecting Cu2O from photocorrosion. Appl. Catal. B Environ. 2017, 217, 485–493. [Google Scholar] [CrossRef]
- She, H.; Zhou, H.; Li, L.; Wang, L.; Huang, J.; Wang, Q. Nickel-doped excess oxygen defect titanium dioxide for efficient selective photocatalytic oxidation of benzyl alcohol. ACS Sustain. Chem. Eng. 2018, 6, 11939–11948. [Google Scholar] [CrossRef]
- Hao, C.; Li, J.; Zhang, Z.; Ji, Y.; Zhan, H.; Xiao, F.; Wang, D.; Liu, B.; Su, F.; Hao, C. Enhancement of photocatalytic properties of TiO2 nanoparticles doped with CeO2 and supported on SiO2 for phenol degradation. Appl. Surf. Sci. 2015, 331, 17–26. [Google Scholar] [CrossRef]
- Zha, R.; Nadimicherla, R.; Guo, X. Ultraviolet photocatalytic degradation of methyl orange by nanostructured TiO2/ZnO heterojunctions. J. Mater. Chem. A 2015, 3, 6565–6574. [Google Scholar] [CrossRef]
- Khairy, M.; Zakaria, W. Effect of metal-doping of TiO2 nanoparticles on their photocatalytic activities toward removal of organic dyes. Egypt. J. Petrol. 2014, 23, 419–426. [Google Scholar] [CrossRef]
- Choi, H.J.; Kang, M. Hydrogen production from methanol/water decomposition in a liquid photosystem using the anatase structu re of cu loaded. Int. J. Hydrogen Energy 2007, 32, 3841–3848. [Google Scholar] [CrossRef]
- Ganesh, I.; Gupta, A.K.; Kumar, P.P.; Sekhar, P.S.; Radha, K.; Padmanabham, G.; Sundararajan, G. Preparation and characterization of Ni-doped TiO2 materials for photocurrent and photocatalytic applications. Sci. World J. 2012, 2012, 127326. [Google Scholar] [CrossRef]
- Burda, C.; Lou, Y.; Chen, X.; Samia, A.C.S.; Gole, J.L. Enhanced nitrogen doping in TiO2 nanoparticles. Nano Lett. 2003, 3, 1049–1051. [Google Scholar] [CrossRef]
- Jing, L.; Yong, W.; Huang, J.; Jie, F.; Cao, L.; Li, C. In situ synthesis of mesoporous c-doped TiO2 single crystal with oxygen vacancy and its enhanced sunlight photocatalytic properties. Dyes Pigment. 2017, 144, 203–211. [Google Scholar]
- Di, L.; Haneda, H.; Hishita, S.; Ohashi, N. Visible-light-driven N−F−codoped TiO2 photocatalysts. 2. Optical characterization, photocatalysis, and potential application to air purification. Chem. Mater. 2005, 17, 2596–2602. [Google Scholar]
- Ohno, T. Preparation of visible light active s-doped TiO2 photocatalysts and their photocatalytic activities. Water Sci. Technol. 2004, 265, 115–121. [Google Scholar] [CrossRef]
- Sonobe, T.; Yoshida, K.; Hachiya, K.; Bakr, M.A.; Kii, T.; Yoshikawa, S.; Ohgaki, H. Optical studies of the microwave-treated TiO2 photocatalyst by mir-fel. J. Sustain. Ener. Environ. 2011, 2, 27–29. [Google Scholar]
- Pylnev, M.; Chang, W.-H.; Wong, M.-S. Shell of black titania prepared by sputtering TiO2 target in H2 + Ar plasma. Appl. Surf. Sci. 2018, 462, 285–290. [Google Scholar] [CrossRef]
- Bonelli, T.S.; Pereyra, I. Low temperature rf plasma nitriding of self-organized TiO2 nanotubes for effective bandgap reduction. Appl. Surf. Sci. 2018, 442, 239–244. [Google Scholar] [CrossRef]
- Chung, K.H.; Jeong, S.; Kim, B.J.; An, K.H.; Park, Y.K.; Jung, S.C. Enhancement of photocatalytic hydrogen production by liquid phase plasma irradiation on metal-loaded TiO2/carbon nanofiber photocatalysts. Int. J. Hydrogen Energy 2018, 43, 11422–11429. [Google Scholar] [CrossRef]
- Zheng, Z.; Huang, B.; Lu, J.; Wang, Z.; Qin, X.; Zhang, X.; Dai, Y.; Whangbo, M.-H. Hydrogenated titania: Synergy of surface modification and morphology improvement for enhanced photocatalytic activity. Chem. Commun. 2012, 48, 5733–5735. [Google Scholar] [CrossRef]
- Wang, G.; Wang, H.; Ling, Y.; Tang, Y.; Yang, X.; Fitzmorris, R.C.; Wang, C.; Zhang, J.Z.; Li, Y. Hydrogen-treated TiO2 nanowire arrays for photoelectrochemical water splitting. Nano Lett. 2011, 11, 3026–3033. [Google Scholar] [CrossRef] [PubMed]
- Mohammadizadeh, M.R.; Bagheri, M.; Aghabagheri, S.; Abdi, Y. Photocatalytic activity of TiO2 thin films by hydrogen dc plasma. Appl. Surf. Sci. 2015, 350, 43–49. [Google Scholar] [CrossRef]
- Wang, Y.; Yu, F.; Zhu, M.; Ma, C.; Zhao, D.; Wang, C.; Zhou, A.; Dai, B.; Ji, J.; Guo, X. N-Doping of plasma exfoliated graphene oxide via dielectric barrier discharge plasma treatment for the oxygen reduction reaction. J. Mater. Chem. A 2018, 6, 2011–2017. [Google Scholar] [CrossRef]
- Zhao, D.; Yu, F.; Zhou, A.; Ma, C.; Dai, B. High-efficiency removal of NOx using dielectric barrier discharge nonthermal plasma with water as an outer electrode. Plasma Sci. Technol. 2018, 20, 014020. [Google Scholar] [CrossRef]
- Pan, D.; Han, Z.; Miao, Y.; Zhang, D.; Li, G. Thermally stable TiO2 quantum dots embedded in SiO2 foams: Characterization and photocatalytic H2 evolution activity. Appl. Catal. B Environ. 2018, 229, 130–138. [Google Scholar] [CrossRef]
- Pu, S.; Zhu, R.; Hui, M.; Deng, D.; Pei, X.; Fei, Q.; Wei, C. Facile in-situ design strategy to disperse TiO2 nanoparticles on graphene for the enhanced photocatalytic degradation of Rhodamine 6G. Appl. Catal. B Environ. 2017, 218, 208–219. [Google Scholar] [CrossRef]
- Han, E.; Vijayarangamuthu, K.; Youn, J.S.; Park, Y.K.; Jung, S.C.; Jeon, K.J. Degussa P 25 TiO2 modified with H2O2 under microwave treatment to enhance photocatalytic properties. Catal. Today 2017, 303, 305–312. [Google Scholar] [CrossRef]
- An, H.R.; Yong, C.H.; Kim, H.; Jin, Y.H.; Park, E.C.; Park, S.Y.; Jeong, Y.; Park, J.I.; Kim, J.P.; Lee, Y.C. Studies on mass production and highly solar light photocatalytic properties of gray hydrogenated-TiO2 sphere photocatalysts. J. Hazard. Mater. 2018, 358, 222–233. [Google Scholar] [CrossRef]
- Vinodkumar, E.; Yourey, J.E.; Bartlett, B.M. Chemically bonded TiO2-bronze nanosheet/reduced graphene oxide hybrid for high-power lithium ion batteries. ACS Nano 2014, 8, 1491–1499. [Google Scholar]
- Ullattil, S.G.; Periyat, P. A ‘one pot’ gel combustion strategy towards Ti3+ self-doped ‘black’ anatase TiO2-x solar photocatalyst. J. Mater. Chem. A 2016, 4, 5854–5858. [Google Scholar] [CrossRef]
- Kong, X.; Xu, Y.; Cui, Z.; Li, Z.; Liang, Y.; Gao, Z.; Zhu, S.; Yang, X. Defect enhances photocatalytic activity of ultrathin TiO2 (B) nanosheets for hydrogen production by plasma engraving method. Appl. Catal. B Environ. 2018, 230, 11–17. [Google Scholar] [CrossRef]
- Pillai, S.C.; Periyat, P.; George, R.; Mccormack, D.E.; Seery, M.K.; Hayden, H.; Colreavy, J.; Corr, D.; Hinder, S.J. Synthesis of high-temperature stable anatase TiO2 photocatalyst. J. Phys. Chem. C 2007, 111, 1605–1611. [Google Scholar] [CrossRef]
- Dzwigaj, S.; Arrouvel, C.; Breysse, M.; Geantet, C.; Inoue, S.; Toulhoat, H.; Raybaud, P. DFT makes the morphologies of anatase-TiO2 nanoparticles visible to ir spectroscopy. J. Catal. 2005, 236, 245–250. [Google Scholar] [CrossRef]
- Kang, I.C.; Zhanga, Q.; Shu, Y.; Satoa, T.; Saitoa, F. Preparation of a visible sensitive carbon doped tio2 photo-catalyst by grinding TiO2 with ethanol and heating treatment. Appl. Catal. B Environ. 2008, 80, 81–87. [Google Scholar] [CrossRef]
- Ou, G.; Xu, Y.; Wen, B.; Lin, R.; Ge, B.; Tang, Y.; Liang, Y.; Yang, C.; Huang, K.; Zu, D. Tuning defects in oxides at room temperature by lithium reduction. Nat. Commun. 2018, 9, 1302. [Google Scholar] [CrossRef]
- Qi, K.; Liu, S.Y.; Qiu, M.; University, N.; University, S. Photocatalytic performance of TiO2 nanocrystals with/without oxygen defects. Chin. J. Catal. 2018, 39, 867–875. [Google Scholar] [CrossRef]
- Hu, M.; Xing, Z.; Yan, C.; Li, Z.; Xu, Y.; Xiu, Z.; Zhao, T.; Yang, S.; Wei, Z. Ti3+ self-doped mesoporous black TiO2/SiO2/g-C3N4 sheets heterojunctions as remarkable visible-lightdriven photocatalysts. Appl. Catal. B Environ. 2018, 226, 499–508. [Google Scholar] [CrossRef]
- Xiaobo, C.; Lei, L.; Yu, P.Y.; Mao, S.S. Increasing solar absorption for photocatalysis with black hydrogenated titanium dioxide nanocrystals. Science 2011, 331, 746–750. [Google Scholar]
- Wanbiao, H.; Yun, L.; Withers, R.L.; Frankcombe, T.J.; Lasse, N.; Amanda, S.; Melanie, K.; Paul, S.; Bill, G.; Hua, C. Electron-pinned defect-dipoles for high-performance colossal permittivity materials. Nat. Mater. 2013, 12, 821–826. [Google Scholar]
- Lin, T.; Yang, C.; Wang, Z.; Yin, H.; Lü, X.; Huang, F.; Lin, J.; Xie, X.; Jiang, M. Effective nonmetal incorporation in black titania with enhanced solar energy utilization. Energy Environ. Sci. 2014, 7, 967. [Google Scholar] [CrossRef]
- Yunxia, Z.; Guanghai, L.; Yucheng, W.; Yuanyuan, L.; Lide, Z. The formation of mesoporous TiO2 spheres via a facile chemical process. J. Phys. Chem. B 2005, 109, 5478–5481. [Google Scholar]
- Kumar, A.; Pandey, G. A review on the factors affecting the photocatalytic degradation of hazardous materials. Mater. Sci. Eng. Int. J. 2017, 1, 106–114. [Google Scholar] [CrossRef]


| Samples | Surface Atomic Concentration (%) | |
|---|---|---|
| Ti3+/Ti | Odef/(Olatt + Odef + Osurf) | |
| TiO2 | 20.9 | 6.0 |
| Ar-TiO2 | 45.2 | 24.4 |
| Sample | Surface Area (m2/g) | Pore Volume (cm3/g) | Pore Size (nm) |
|---|---|---|---|
| TiO2 | 124.7 | 0.23 | 5.6 |
| Ar-TiO2 | 121.3 | 0.21 | 5.6 |
| TiO2 | Ar-TiO2 | ||
|---|---|---|---|
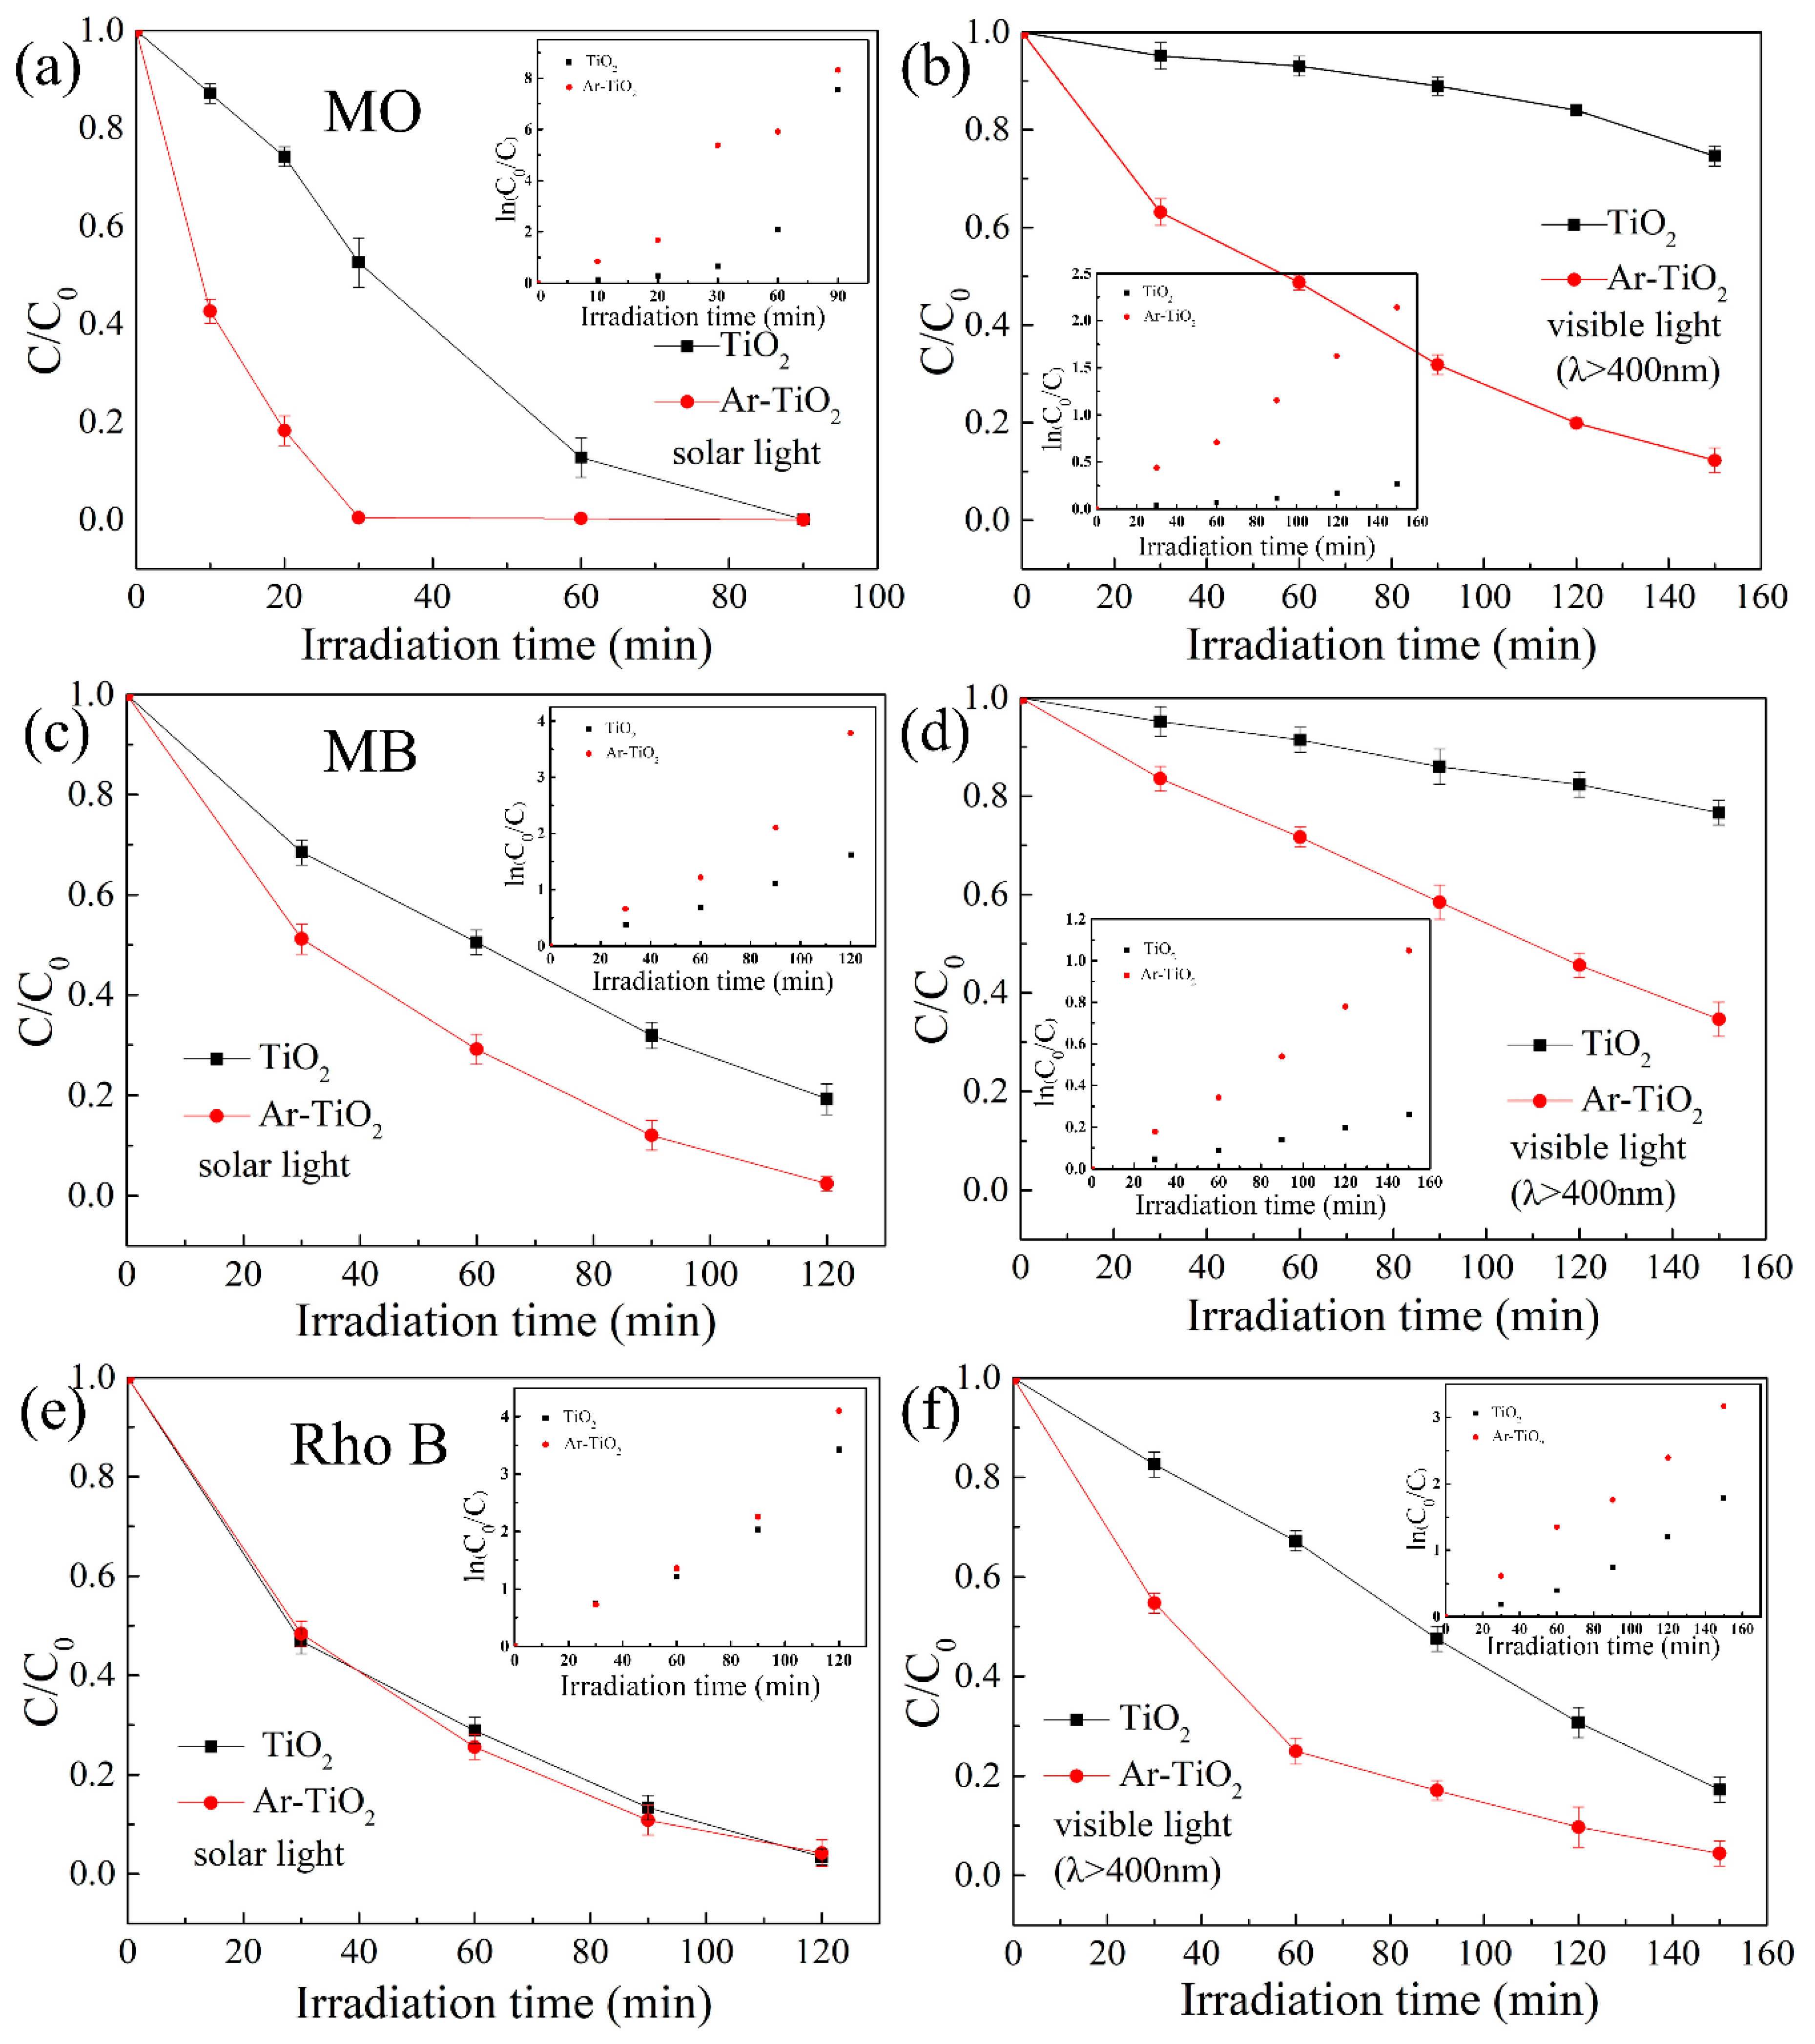
| MO | solar light | 7.55 | 8.32 |
| visible light (λ ≥ 400 nm) | 0.26 | 2.14 | |
| MB | solar light | 1.62 | 3.78 |
| visible light (λ ≥ 400 nm) | 0.26 | 1.05 | |
| Rho B | solar light | 3.42 | 4.10 |
| visible light (λ ≥ 400 nm) | 1.79 | 3.17 | |
| Samples | Time (h) | 1 | 1.5 | 2 | 2.5 |
|---|---|---|---|---|---|
| TiO2 | HER (μmol·g−1·h−1) | 98 | 287 | 306 | 320 |
| AQE (%) | 8.7 | 35.2 | 39.8 | 47.7 | |
| Ar-TiO2 | HER (μmol·g−1·h−1) | 240 | 506 | 524 | 530 |
| AQE (%) | 31.3 | 66.0 | 68.1 | 69 |
© 2019 by the authors. Licensee MDPI, Basel, Switzerland. This article is an open access article distributed under the terms and conditions of the Creative Commons Attribution (CC BY) license (http://creativecommons.org/licenses/by/4.0/).
Share and Cite
Li, Y.; Wang, W.; Wang, F.; Di, L.; Yang, S.; Zhu, S.; Yao, Y.; Ma, C.; Dai, B.; Yu, F. Enhanced Photocatalytic Degradation of Organic Dyes via Defect-Rich TiO2 Prepared by Dielectric Barrier Discharge Plasma. Nanomaterials 2019, 9, 720. https://0-doi-org.brum.beds.ac.uk/10.3390/nano9050720
Li Y, Wang W, Wang F, Di L, Yang S, Zhu S, Yao Y, Ma C, Dai B, Yu F. Enhanced Photocatalytic Degradation of Organic Dyes via Defect-Rich TiO2 Prepared by Dielectric Barrier Discharge Plasma. Nanomaterials. 2019; 9(5):720. https://0-doi-org.brum.beds.ac.uk/10.3390/nano9050720
Chicago/Turabian StyleLi, Yanqin, Wei Wang, Fu Wang, Lanbo Di, Shengchao Yang, Shengjie Zhu, Yongbin Yao, Cunhua Ma, Bin Dai, and Feng Yu. 2019. "Enhanced Photocatalytic Degradation of Organic Dyes via Defect-Rich TiO2 Prepared by Dielectric Barrier Discharge Plasma" Nanomaterials 9, no. 5: 720. https://0-doi-org.brum.beds.ac.uk/10.3390/nano9050720