Synthesis of Multicolor Carbon Dots Based on Solvent Control and Its Application in the Detection of Crystal Violet


Abstract
:
1. Introduction
2. Experimental Section
2.1. Reagents and Materials
2.2. Instrumentations
2.3. Preparation of CDs
2.4. Quantum Yield (QY) Measurement
2.5. Fluorescence Detection of Crystal Violet
3. Results and Discussion
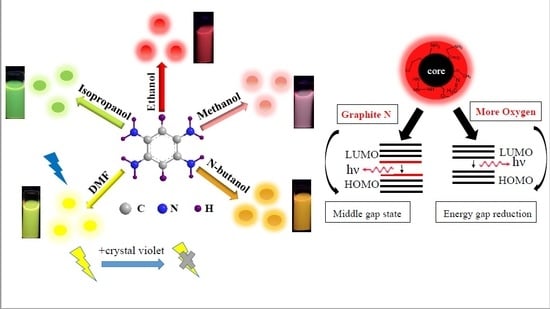
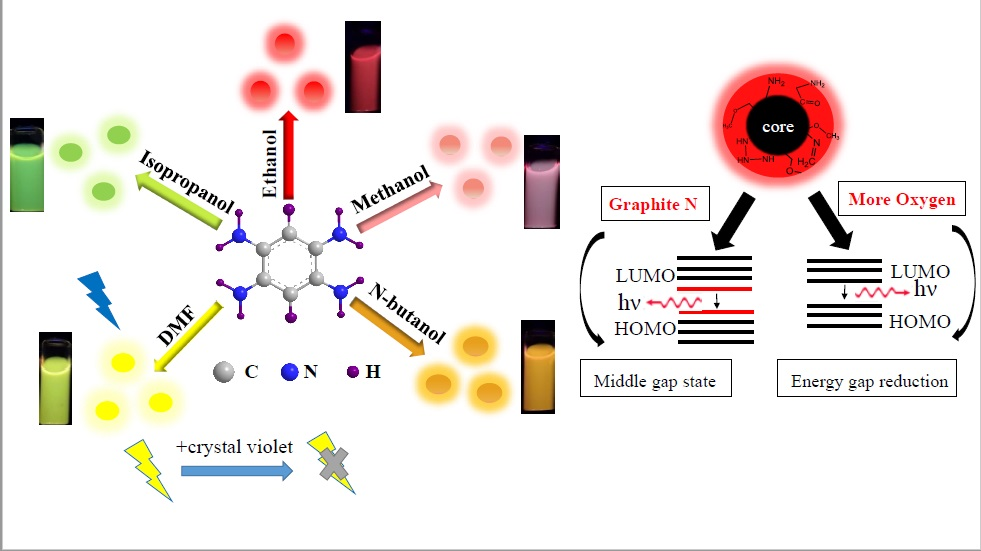
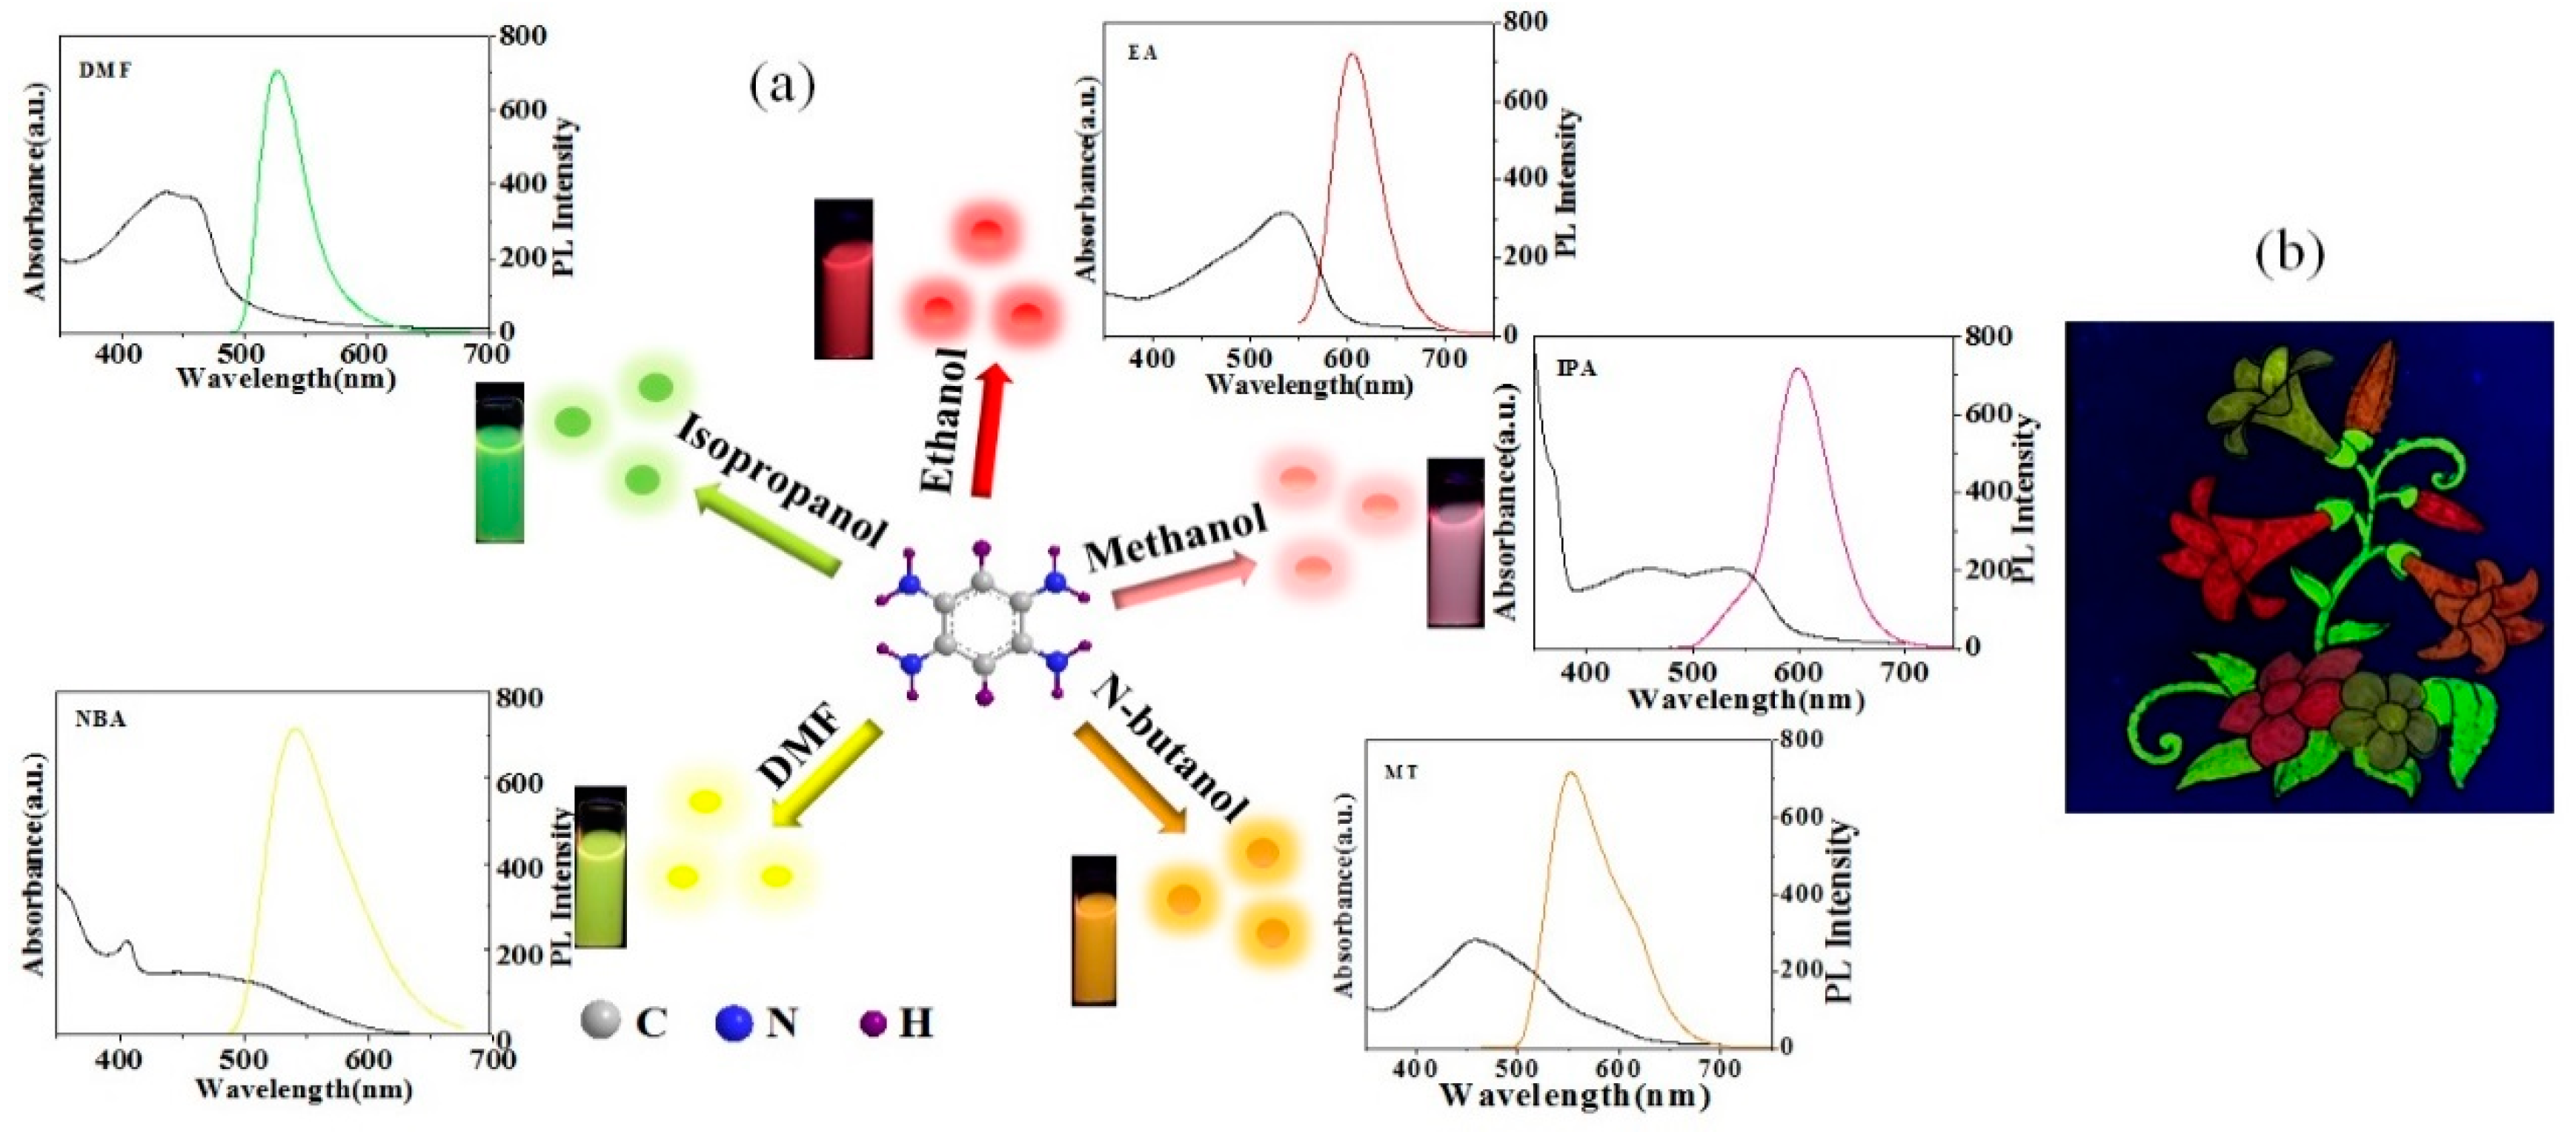
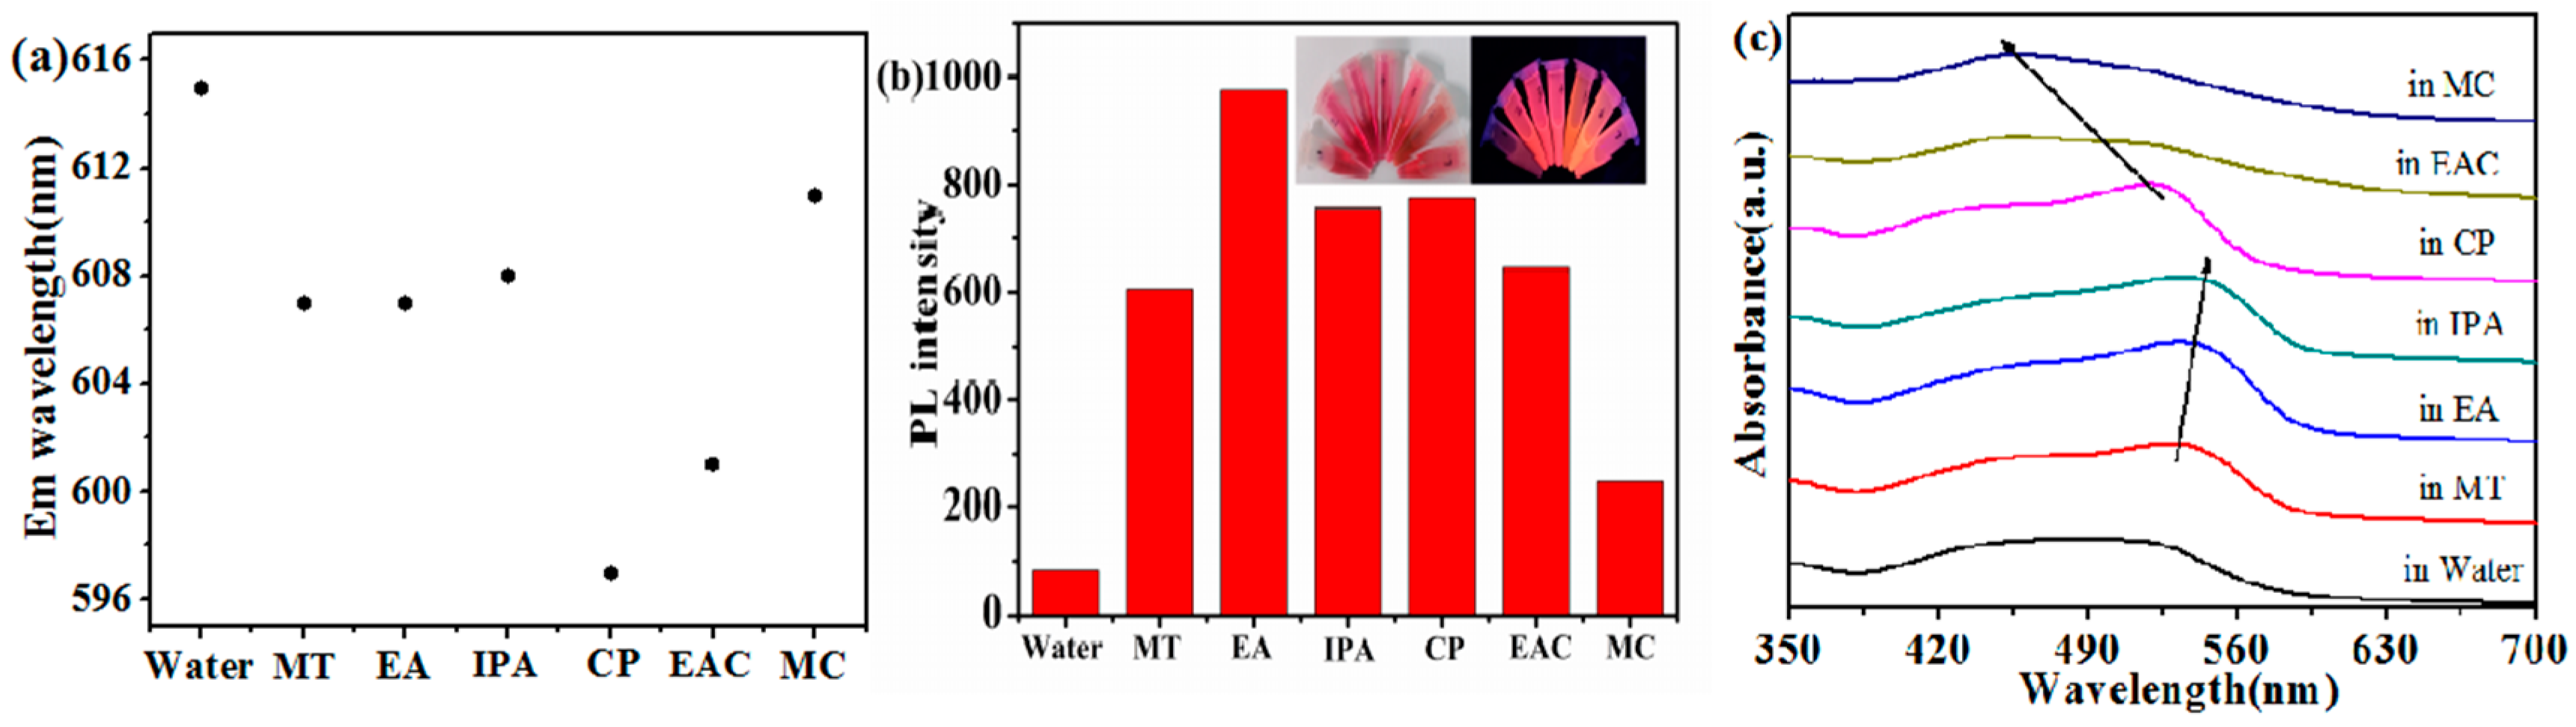
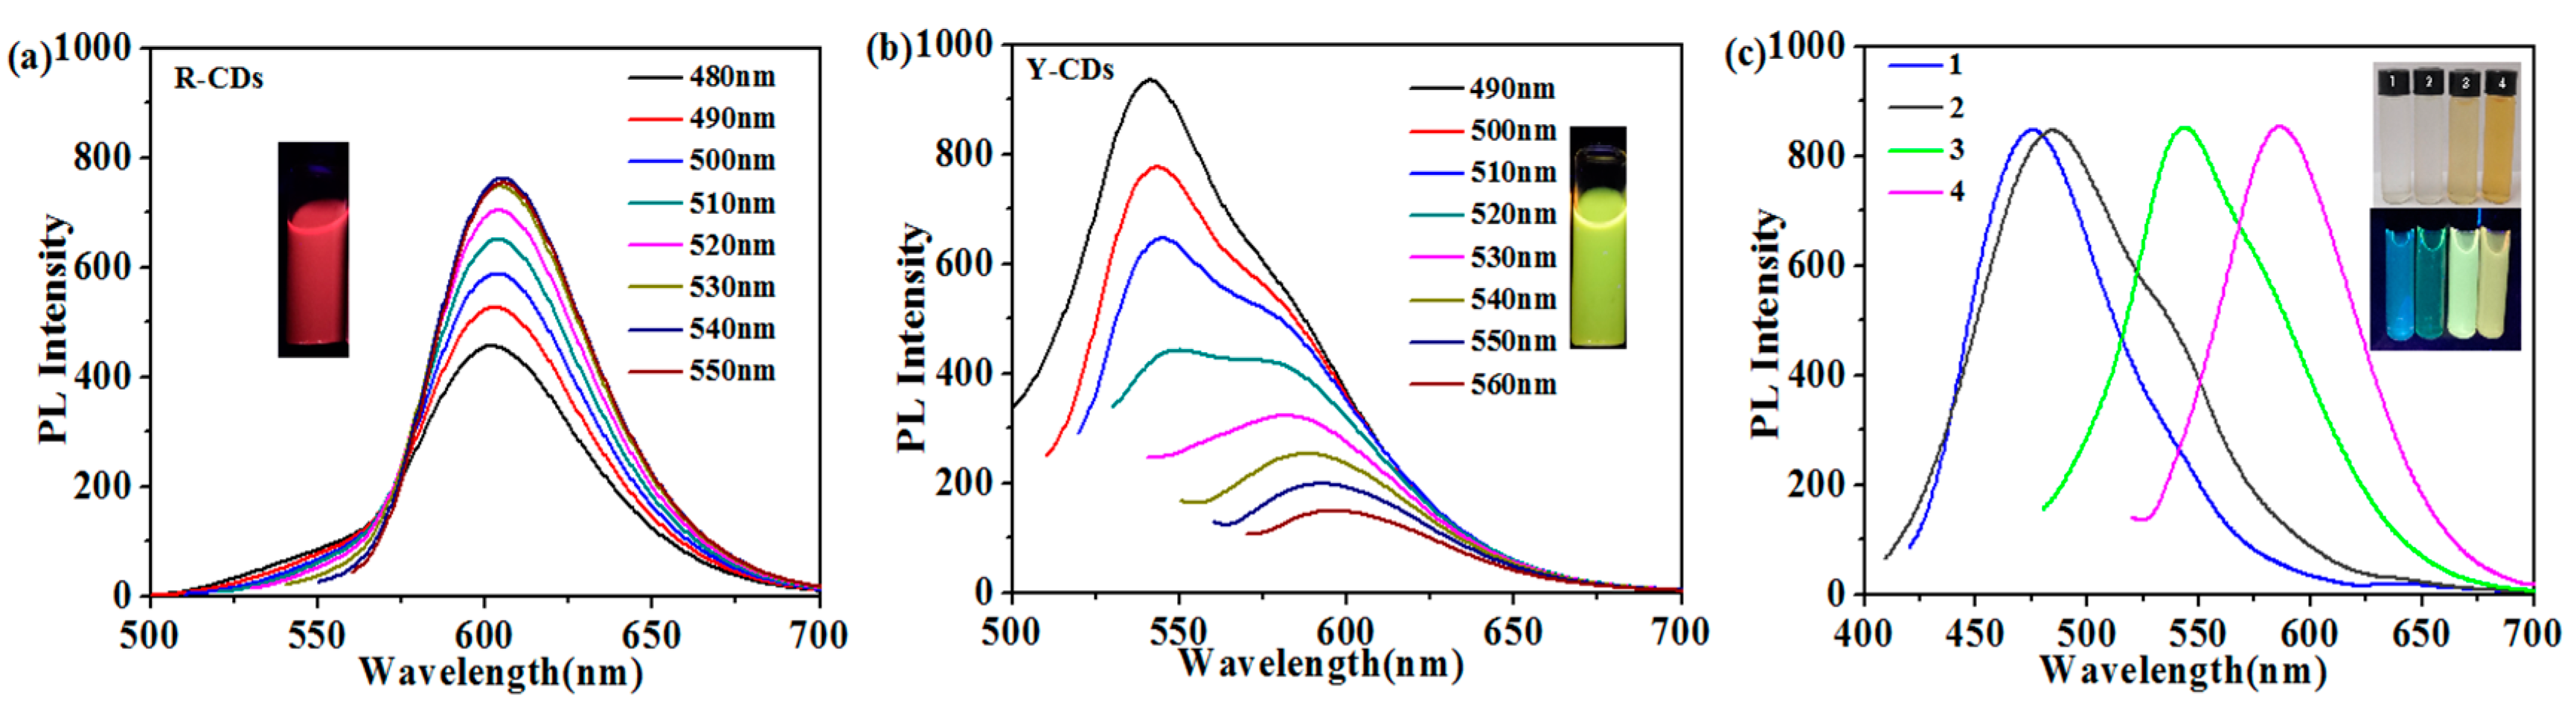
3.1. The Preparation of Multiple-Color-Emissive CDs Based on Different Solvents
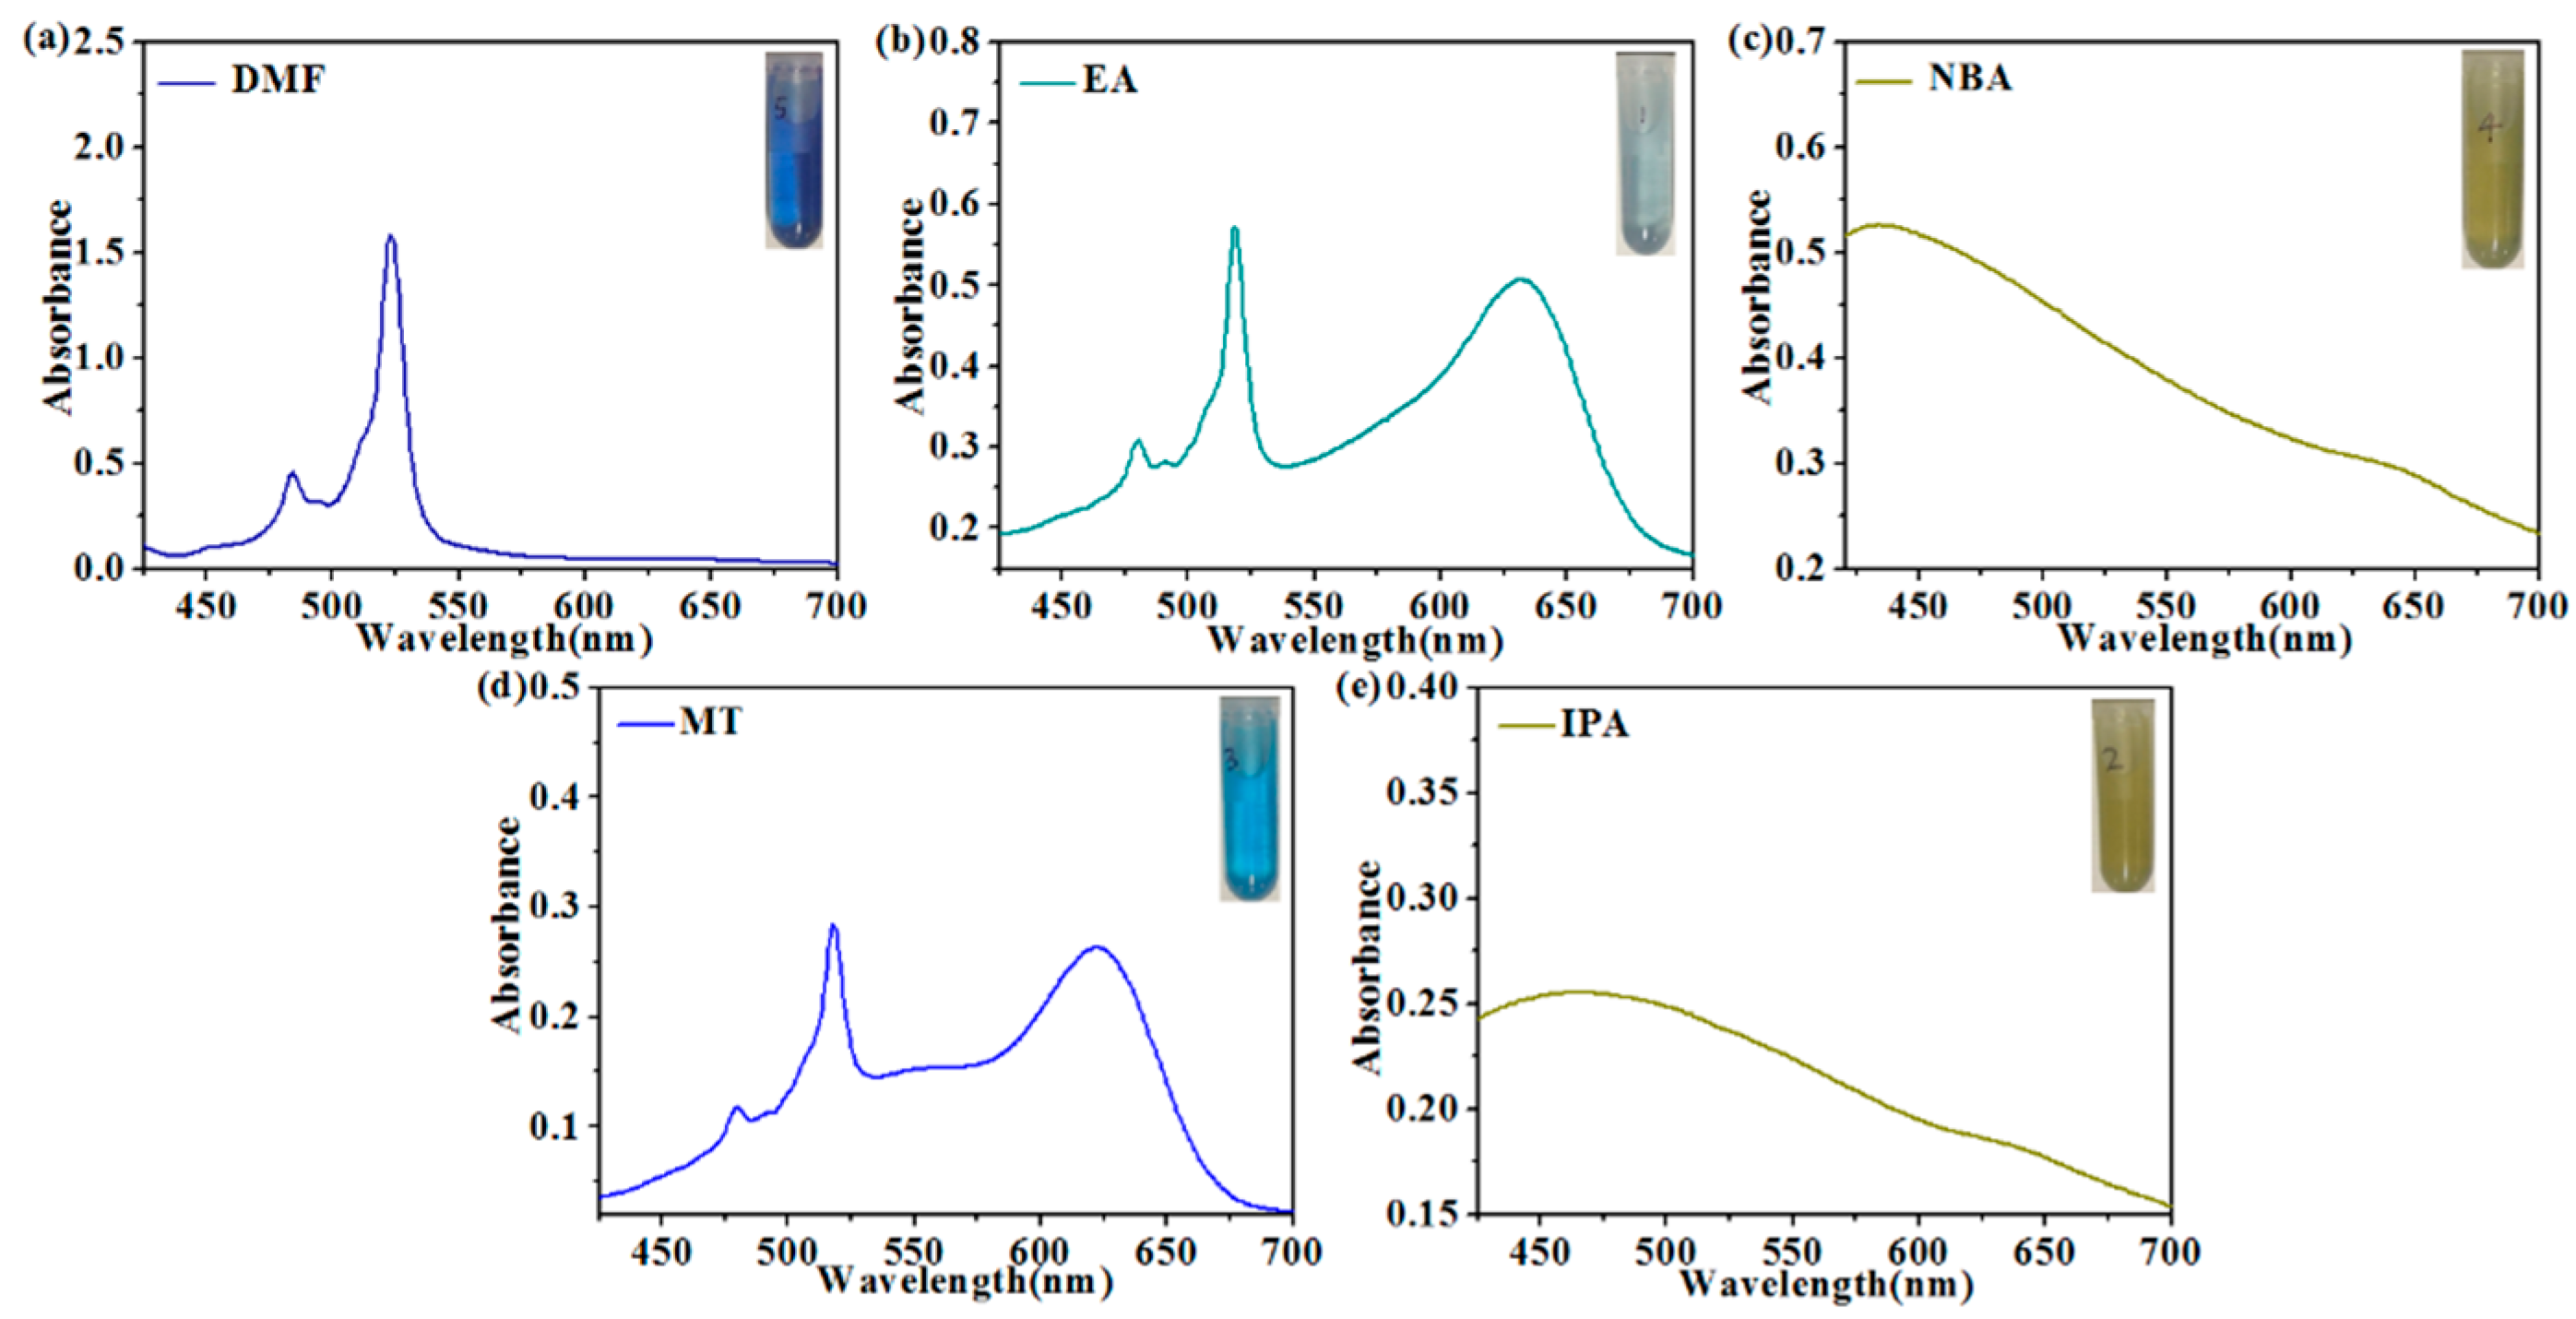
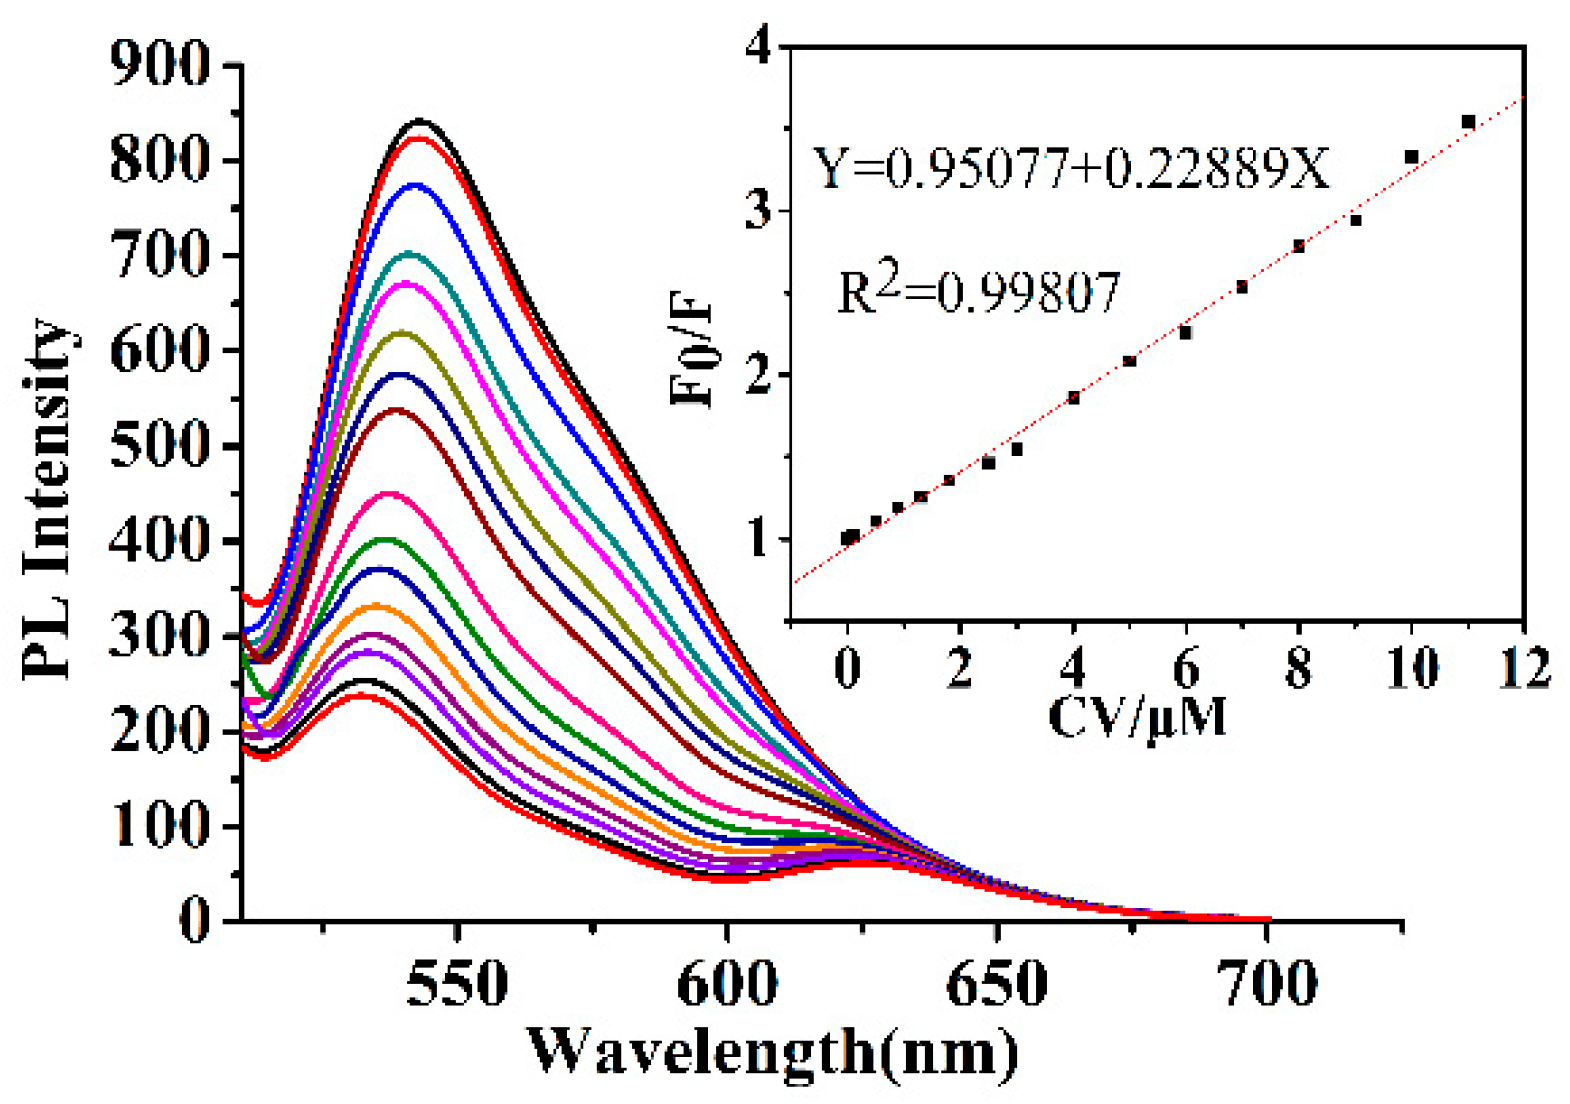
3.2. Fluorescent Detection of CV
4. Conclusions
Supplementary Materials
Author Contributions
Funding
Conflicts of Interest
References
- Dang, D.; Sundaram, C.; Ngo, Y.; Chung, J.; Kim, E.; Hur, S. One pot solid-state synthesis of highly fluorescent N and S co-doped carbon dots and its use as fluorescent probe for Ag+ detection in aqueous solution. Sens. Actuators B Chem. 2018, 255, 3284–3291. [Google Scholar] [CrossRef]
- Chu, K.; Lee, S.; Chang, C.; Liu, L. Recent Progress of Carbon Dot Precursors and Photocatalysis Applications. Polymers 2019, 1, 689. [Google Scholar] [CrossRef] [PubMed]
- Das, T.; Saikia, B.; Dekaboruah, H.; Bordoloi, M.; Neog, D.; Bora, J.; Lahkar, J.; Narzary, B.; Roy, S.; Ramaiah, D. Blue-fluorescent and biocompatible carbon dots derived from abundant low-quality coals. J. Photochem. Photobiol. B 2019, 195, 1–11. [Google Scholar] [CrossRef] [PubMed]
- Wu, B.; Zhu, G.; Dufresne, A.; Lin, N. Fluorescent aerogels based on chemical crosslinking between nanocellulose and carbon dots for optical sensor. ACS Appl. Mater. Interfaces 2019, 11, 16048–16058. [Google Scholar] [CrossRef]
- Uriarte, D.; Domini, C.; Garrido, M. New carbon dots based on glycerol and urea and its application in the determination of tetracycline in urine samples. Talanta 2019, 201, 143–148. [Google Scholar] [CrossRef]
- D’souza, S.L.; Chettiar, S.S.; Koduru, J.R.; Kailasa, S.K. Synthesis of fluorescent carbon dots using Daucus carota subsp. sativus roots for mitomycin drug delivery. Optik 2018, 158, 893–900. [Google Scholar] [CrossRef]
- Duan, Q.; Ma, Y.; Che, M.; Zhang, B.; Zhang, Y.; Li, Y.; Sang, S. Fluorescent carbon dots as carriers for intracellular doxorubicin delivery and track. J. Drug Deliv. Sci. Technol. 2019, 49, 527–533. [Google Scholar] [CrossRef]
- Zheng, M.; Ruan, S.; Liu, S.; Sun, T.; Qu, D.; Zhao, H.; Sun, Z. Self-targeting fluorescent carbon dots for diagnosis of brain cancer cells. ACS Nano 2015, 9, 11455–11461. [Google Scholar] [CrossRef]
- Zheng, M.; Li, Y.; Liu, S.; Wang, W.; Xie, Z.; Jing, X. One-pot to synthesize multifunctional carbon dots for near infrared fluorescence imaging and photothermal cancer therapy. ACS Appl. Mater. Interfaces 2016, 8, 23533–23541. [Google Scholar] [CrossRef]
- Ding, H.; Zhou, X.; Qin, B.; Zhou, Z.; Zhao, Y. Highly fluorescent near-infrared emitting carbon dots derived from lemon juice and its bioimaging application. J. Lumin. 2019, 211, 298–304. [Google Scholar] [CrossRef]
- Lin, S.; Cheng, Y.; Lin, C.; Fang, J.; Xiang, W.; Liang, X. Carbon nanodots with intense emission from green to red and their multifunctional applications. J. Alloys Compd. 2018, 742, 212–219. [Google Scholar] [CrossRef]
- Jiang, K.; Sun, S.; Zhang, L.; Lu, Y.; Wu, A.; Cai, C.; Lin, H. Red, green, and blue luminescence by carbon dots: Full-color emission tuning and multicolor cellular imaging. Angew. Chem. Int. Ed. 2015, 54, 5360–5363. [Google Scholar] [CrossRef] [PubMed]
- Chen, D.; Gao, H.; Chen, X.; Fang, G.; Yuan, S.; Yuan, Y. Excitation-independent dual-color carbon dots: Surface-state controlling and solid-state lighting. ACS Photonics 2017, 4, 2352–2358. [Google Scholar] [CrossRef]
- Ding, H.; Wei, J.S.; Zhang, P.; Zhou, Z.Y.; Gao, Q.Y.; Xiong, H.M. Solvent-Controlled Synthesis of Highly Luminescent Carbon Dots with a Wide Color Gamut and Narrowed Emission Peak Widths. Small 2018, 14, 1800612. [Google Scholar] [CrossRef] [PubMed]
- Tian, Z.; Zhang, X.; Li, D.; Zhou, D.; Jing, P.; Shen, D.; Rogach, A.L. Full-color inorganic carbon dot phosphors for white-light-emitting diodes. Adv. Opt. Mater. 2017, 5, 1700416. [Google Scholar] [CrossRef]
- Chao, D.; Lyu, W.; Liu, Y.; Zhou, L.; Zhang, Q.; Deng, R.; Zhang, H. Solvent-dependent carbon dots and their applications in the detection of water in organic solvents. J. Mater. Chem. C 2018, 6, 7527–7532. [Google Scholar] [CrossRef]
- Wang, H.; Sun, C.; Chen, X.; Zhang, Y.; Colvin, V.; Rice, Q.; Seo, J.; Feng, S.; Wang, S.; William, W. Excitation wavelength independent visible color emission of carbon dots. Nanoscale 2017, 9, 1909–1915. [Google Scholar] [CrossRef]
- Ghasemi, E.; Kaykhaii, M. Application of Micro-cloud point extraction for spectrophotometric determination of Malachite green, Crystal violet and Rhodamine B in aqueous samples. Spectrochim. Acta Part A Mol. Biomol. Spectrosc. 2016, 164, 93–97. [Google Scholar] [CrossRef]
- Littlefield, N.A.; Blackwell, B.N.; Hewitt, C.C.; Gaylor, D.W. Chronic toxicity and carcinogenicity studies of gentian violet in mice. Toxicol. Sci. 1985, 5, 902–912. [Google Scholar] [CrossRef]
- An, L.; Deng, J.; Zhou, L.; Li, H.; Chen, F.; Wang, H.; Liu, Y. Simultaneous spectrophotometric determination of trace amount of malachite green and crystal violet in water after cloud point extraction using partial least squares regression. J. Hazard. Mater. 2010, 175, 883–888. [Google Scholar] [CrossRef]
- Maxwell, E.J.; Tong, W.G. Sensitive detection of malachite green and crystal violet by nonlinear laser wave mixing and capillary electrophoresis. J. Chromatogr. B 2016, 1020, 29–35. [Google Scholar] [CrossRef] [PubMed] [Green Version]
- Dowling, G.; Mulder, P.P.; Duffy, C.; Regan, L.; Smyth, M.R. Confirmatory analysis of malachite green, leucomalachite green, crystal violet and leucocrystal violet in salmon by liquid chromatography–tandem mass spectrometry. Anal. Chim. Acta 2007, 586, 411–419. [Google Scholar] [CrossRef] [PubMed]
- Lai, K.; Zhang, Y.; Du, R.; Zhai, F.; Rasco, B.A.; Huang, Y. Determination of chloramphenicol and crystal violet with surface enhanced Raman spectroscopy. Sens. Instrum. Food Qual. Saf. 2011, 5, 19–24. [Google Scholar] [CrossRef]
- Liu, Y.; Chao, D.; Zhou, L.; Li, Y.; Deng, R.; Zhang, H. Yellow emissive carbon dots with quantum yield up to 68.6% from the solvent and manganese ions. Carbon 2018, 135, 253–259. [Google Scholar] [CrossRef]
- Choi, Y.; Kim, S.; Choi, Y.; Song, J.; Kwon, T.; Kwon, O.; Kim, B. Morphology tunable hybrid carbon nanosheets with solvatochromism. Adv. Mater. 2017, 29, 1701075. [Google Scholar] [CrossRef] [PubMed]
- Mukherjee, S.; Prasad, E.; Chadha, A. H-Bonding controls the emission properties of functionalized carbon nano-dots. Phys. Chem. Chem. Phys. 2017, 19, 7288–7296. [Google Scholar] [CrossRef]
- Pramanik, A.; Biswas, S.; Kumbhakar, P. Solvatochromism in highly luminescent environmental friendly carbon quantum dots for sensing applications: Conversion of bio-waste into bio-asset. Spectrochim. Acta A 2018, 191, 498–512. [Google Scholar] [CrossRef]
- Shang, J.; Ma, L.; Li, J.; Ai, W.; Yu, T.; Gurzadyan, G. The origin of fluorescence from graphene oxide. Sci. Rep. 2012, 2, 792. [Google Scholar] [CrossRef]
- Bhattacharya, A.; Chatterjee, S.; Prajapati, R.; Mukherjee, T. Size-dependent penetration of carbon dots inside the ferritin nanocages: Evidence for the quantum confinement effect in carbon dots. Phys. Chem. Chem. Phys. 2015, 17, 12833–12840. [Google Scholar] [CrossRef]
- Ghosh, S.; Chizhik, A.; Karedla, N.; Dekaliuk, M.; Gregor, I.; Schuhmann, H.; Seibt, M.; Bodensiek, K.; Schaap, I.; Schulz, O.; et al. Photoluminescence of carbon nanodots: Dipole emission centers and electron–phonon coupling. Nano Lett. 2014, 14, 5656–5661. [Google Scholar] [CrossRef]
- Ding, H.; Wei, J.S.; Xiong, H.M. Nitrogen and sulfur co-doped carbon dots with strong blue luminescence. Nanoscale 2014, 6, 13817–13823. [Google Scholar] [CrossRef] [PubMed]
- Miao, X.; Qu, D.; Yang, D.; Nie, B.; Zhao, Y.; Fan, H.; Sun, Z. Synthesis of carbon dots with multiple color emission by controlled graphitization and surface functionalization. Adv. Mater. 2018, 30, 1704740. [Google Scholar] [CrossRef] [PubMed]
- Ju, B.; Nie, H.; Zhang, X.G.; Chen, Q.; Guo, X.; Xing, Z.; Zhang, S.X.A. Inorganic Salt Incorporated Solvothermal Synthesis of Multicolor Carbon Dots, Emission Mechanism, and Antibacterial Study. ACS Appl. Nano Mater. 2018, 1, 6131–6138. [Google Scholar] [CrossRef]
- Ding, H.; Yu, S.; Wei, J.; Xiong, H. Full-color light-emitting carbon dots with a surface-state-controlled luminescence mechanism. ACS Nano 2015, 10, 484–491. [Google Scholar] [CrossRef]
- Das, P.; Ganguly, S.; Mondal, S.; Bose, M.; Das, A.K.; Banerjee, S.; Das, N.C. Heteroatom doped photoluminescent carbon dots for sensitive detection of acetone in human fluids. Sens. Actuators B Chem. 2018, 266, 583–593. [Google Scholar] [CrossRef]
- Shamsipur, M.; Molaei, K.; Molaabasi, F.; Alipour, M.; Alizadeh, N.; Hosseinkhani, S.; Hosseini, M. Facile preparation and characterization of new green emitting carbon dots for sensitive and selective off/on detection of Fe3+ ion and ascorbic acid in water and urine samples and intracellular imaging in living cells. Talanta 2018, 183, 122–130. [Google Scholar] [CrossRef]
- Holá, K.; Sudolska, M.; Kalytchuk, S.; Nachtigallova, D.; Rogach, A.; Otyepka, M.; Zboril, R. Graphitic nitrogen triggers red fluorescence in carbon dots. ACS Nano 2017, 11, 12402–12410. [Google Scholar] [CrossRef]
- Yang, S.; Sun, J.; Li, X.; Zhou, W.; Wang, Z.; He, P.; Ding, G.; Xie, X.; Kang, Z.; Jiang, M. Large-scale fabrication of heavy doped carbon quantum dots with tunable-photoluminescence and sensitive fluorescence detection. J. Mater. Chem. A 2014, 2, 8660–8667. [Google Scholar] [CrossRef]
- Xia, J.; Zhuang, Y.T.; Yu, Y.L.; Wang, J.H. Highly fluorescent carbon polymer dots prepared at room temperature, and their application as a fluorescent probe for determination and intracellular imaging of ferric ion. Microchim. Acta 2017, 184, 1109–1116. [Google Scholar] [CrossRef]
- Han, Y.; Chen, Y.; Liu, J.; Niu, X.; Ma, Y.; Ma, S.; Chen, X. Room-temperature synthesis of yellow-emitting fluorescent silicon nanoparticles for sensitive and selective determination of crystal violet in fish tissues. Sens. Actuators B Chem. 2018, 263, 508–516. [Google Scholar] [CrossRef]


| Solvent | EA | IPA | MT | NBA | DMF |
|---|---|---|---|---|---|
| Ex/nm | 540 | 520 | 480 | 460 | 460 |
| Em/nm | 605 | 600 | 552 | 543 | 527 |
| FWHM/nm | 56 | 65 | 86 | 75 | 44 |
| QYs/% | 30.2 | 32.7 | 10.0 | 10.0 | 47.6 |
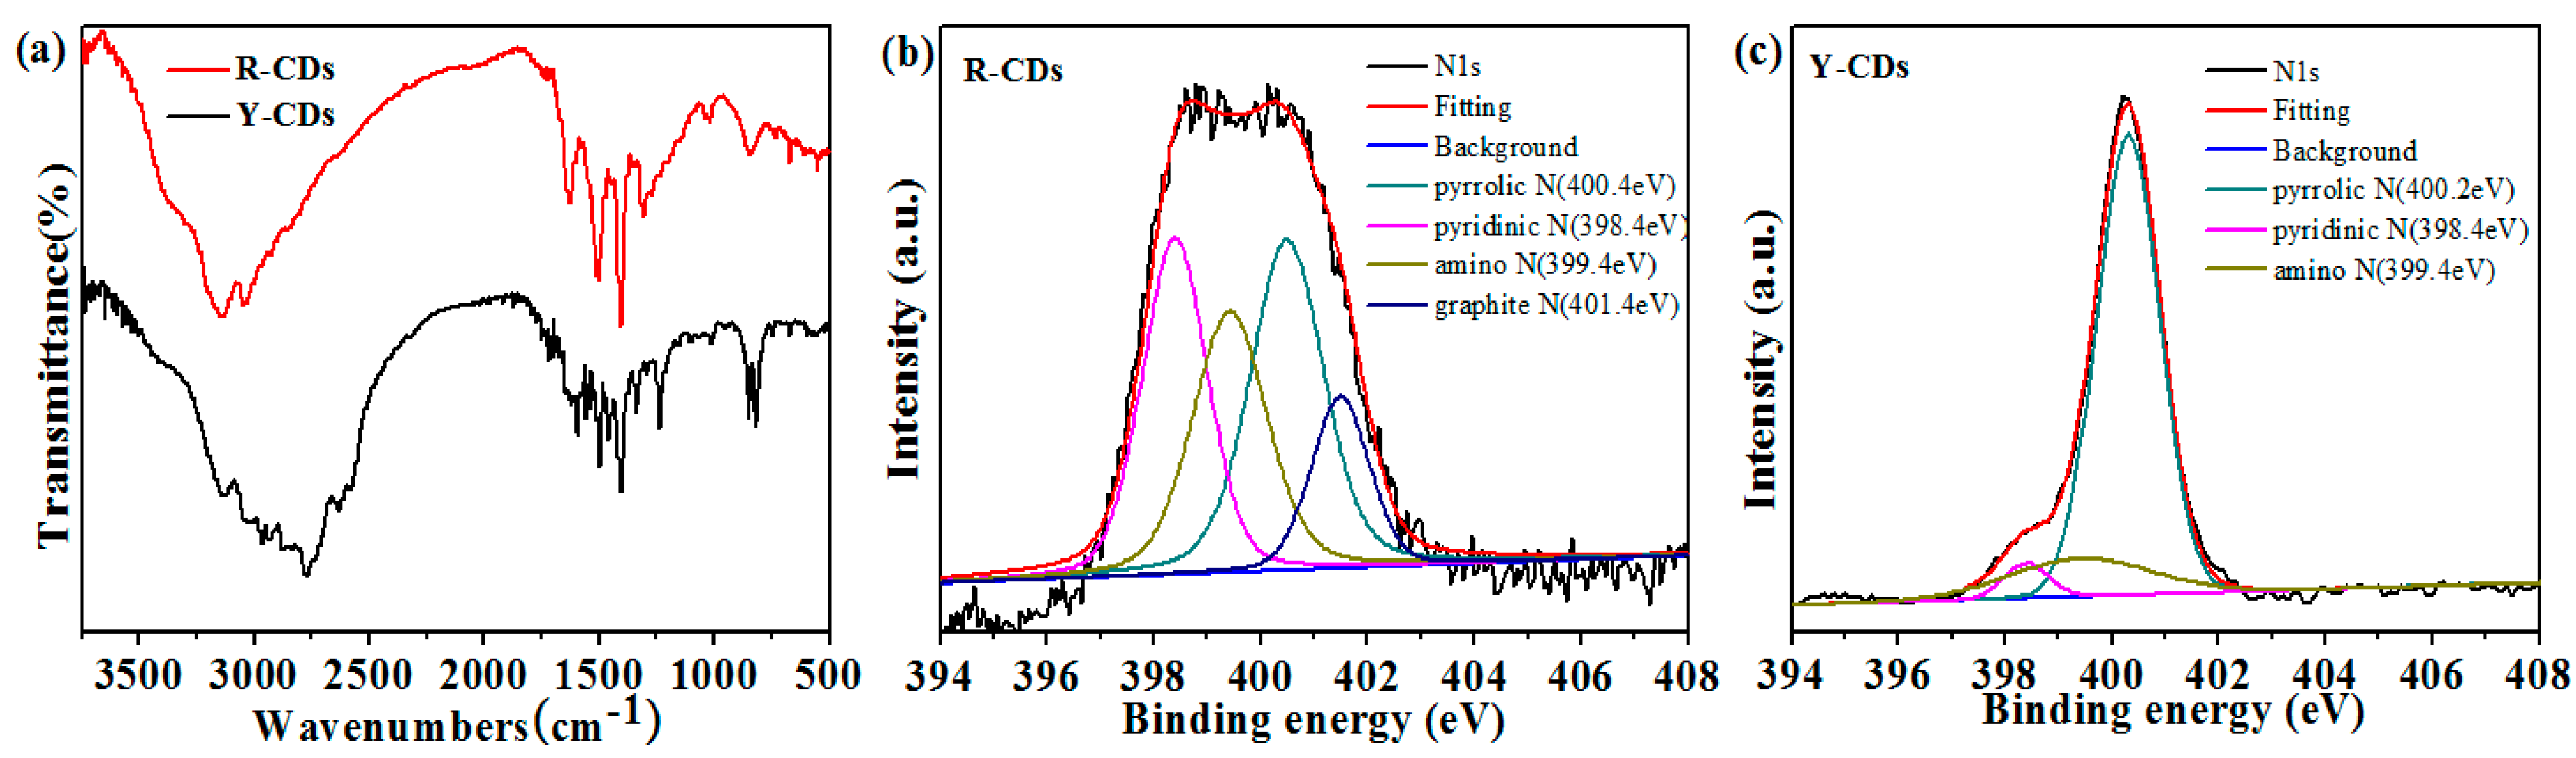
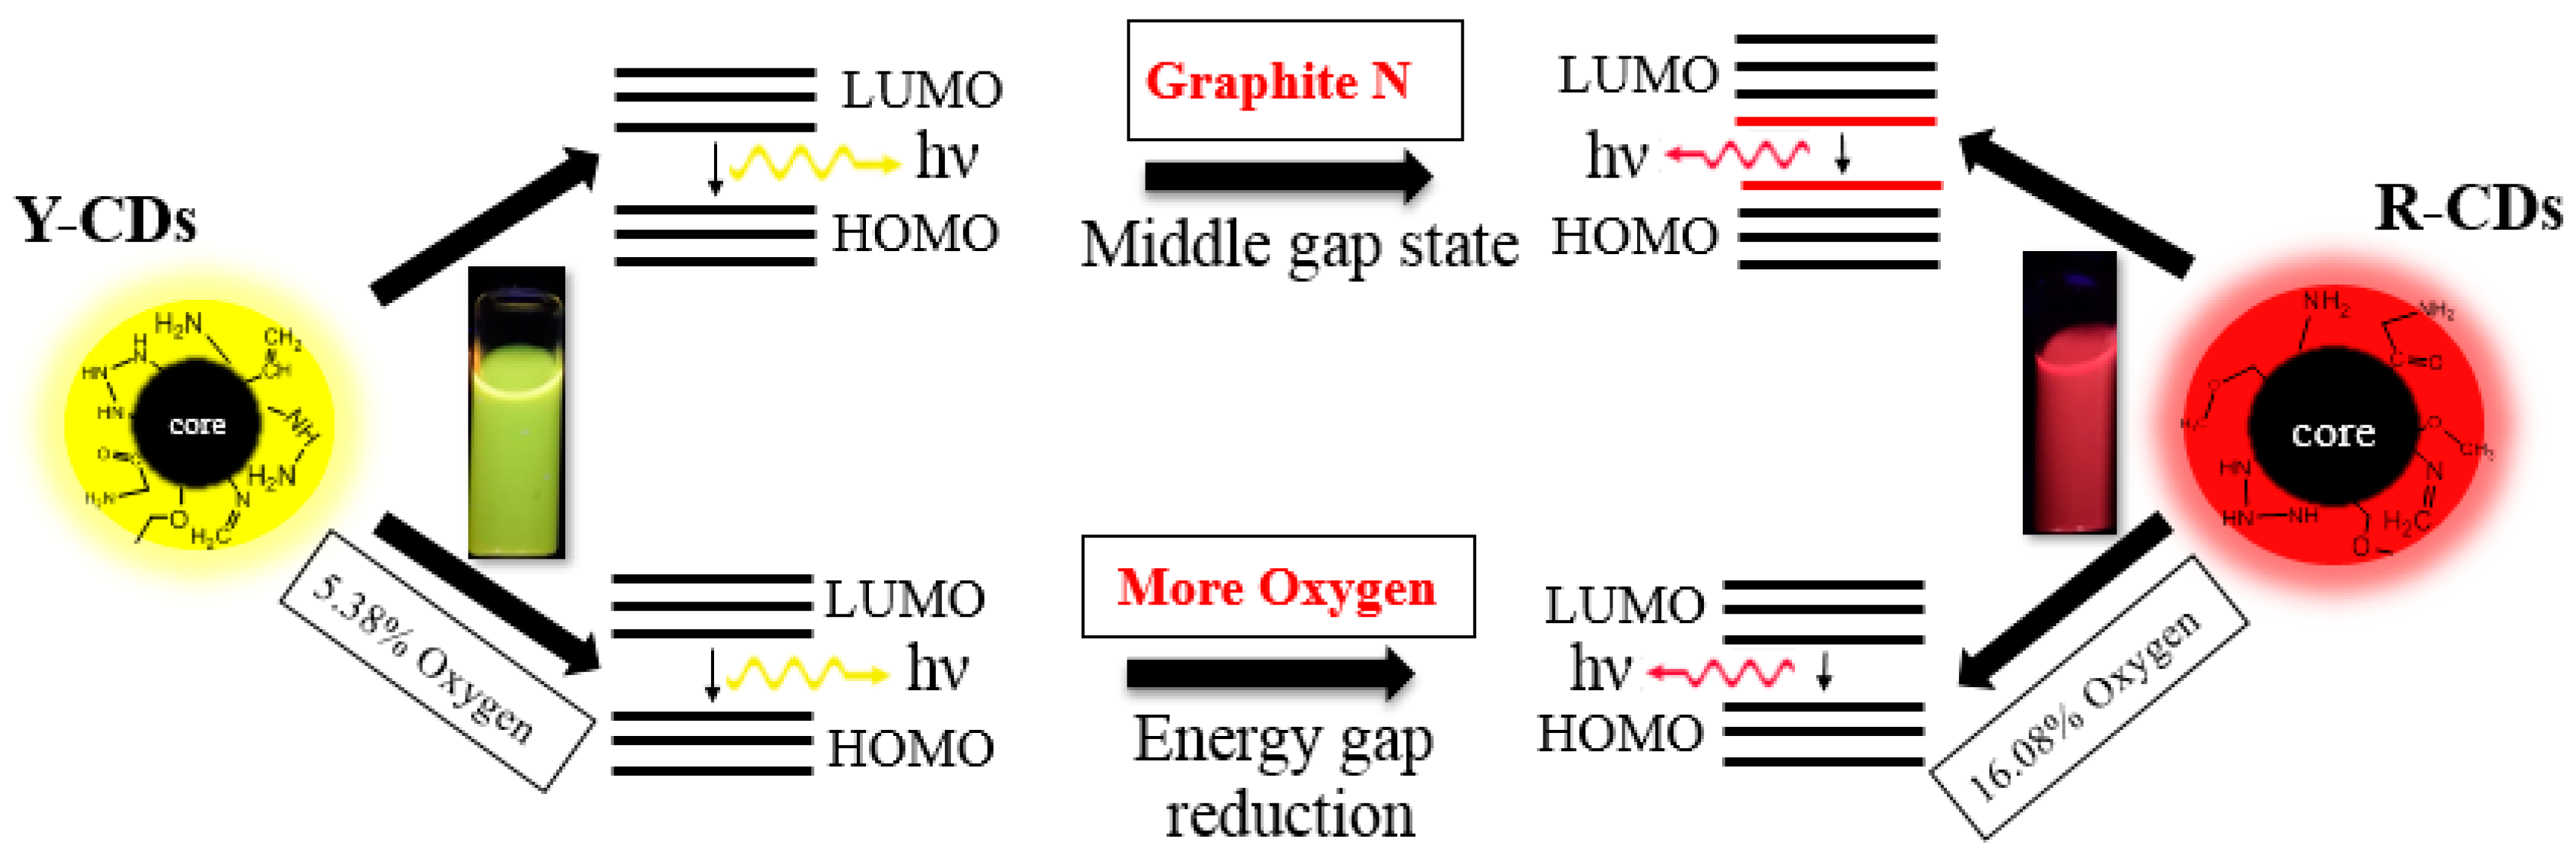
| Sample | C (mol%) | O (mol%) | N (mol%) |
|---|---|---|---|
| R-CDs | 74.45 | 16.08 | 9.48 |
| Y-CDs | 73.37 | 5.38 | 21.25 |
© 2019 by the authors. Licensee MDPI, Basel, Switzerland. This article is an open access article distributed under the terms and conditions of the Creative Commons Attribution (CC BY) license (http://creativecommons.org/licenses/by/4.0/).
Share and Cite
Zhao, D.; Liu, X.; Zhang, Z.; Zhang, R.; Liao, L.; Xiao, X.; Cheng, H. Synthesis of Multicolor Carbon Dots Based on Solvent Control and Its Application in the Detection of Crystal Violet. Nanomaterials 2019, 9, 1556. https://0-doi-org.brum.beds.ac.uk/10.3390/nano9111556
Zhao D, Liu X, Zhang Z, Zhang R, Liao L, Xiao X, Cheng H. Synthesis of Multicolor Carbon Dots Based on Solvent Control and Its Application in the Detection of Crystal Violet. Nanomaterials. 2019; 9(11):1556. https://0-doi-org.brum.beds.ac.uk/10.3390/nano9111556
Chicago/Turabian StyleZhao, Dan, Xuemei Liu, Zhixia Zhang, Rui Zhang, Liangxiu Liao, Xincai Xiao, and Han Cheng. 2019. "Synthesis of Multicolor Carbon Dots Based on Solvent Control and Its Application in the Detection of Crystal Violet" Nanomaterials 9, no. 11: 1556. https://0-doi-org.brum.beds.ac.uk/10.3390/nano9111556