
Transmembrane 29 (Tmem29), a Newly Identified Molecule Showed Downregulation in Hypoxic-Ischemic Brain Damage

 , ,
, ,  and
and 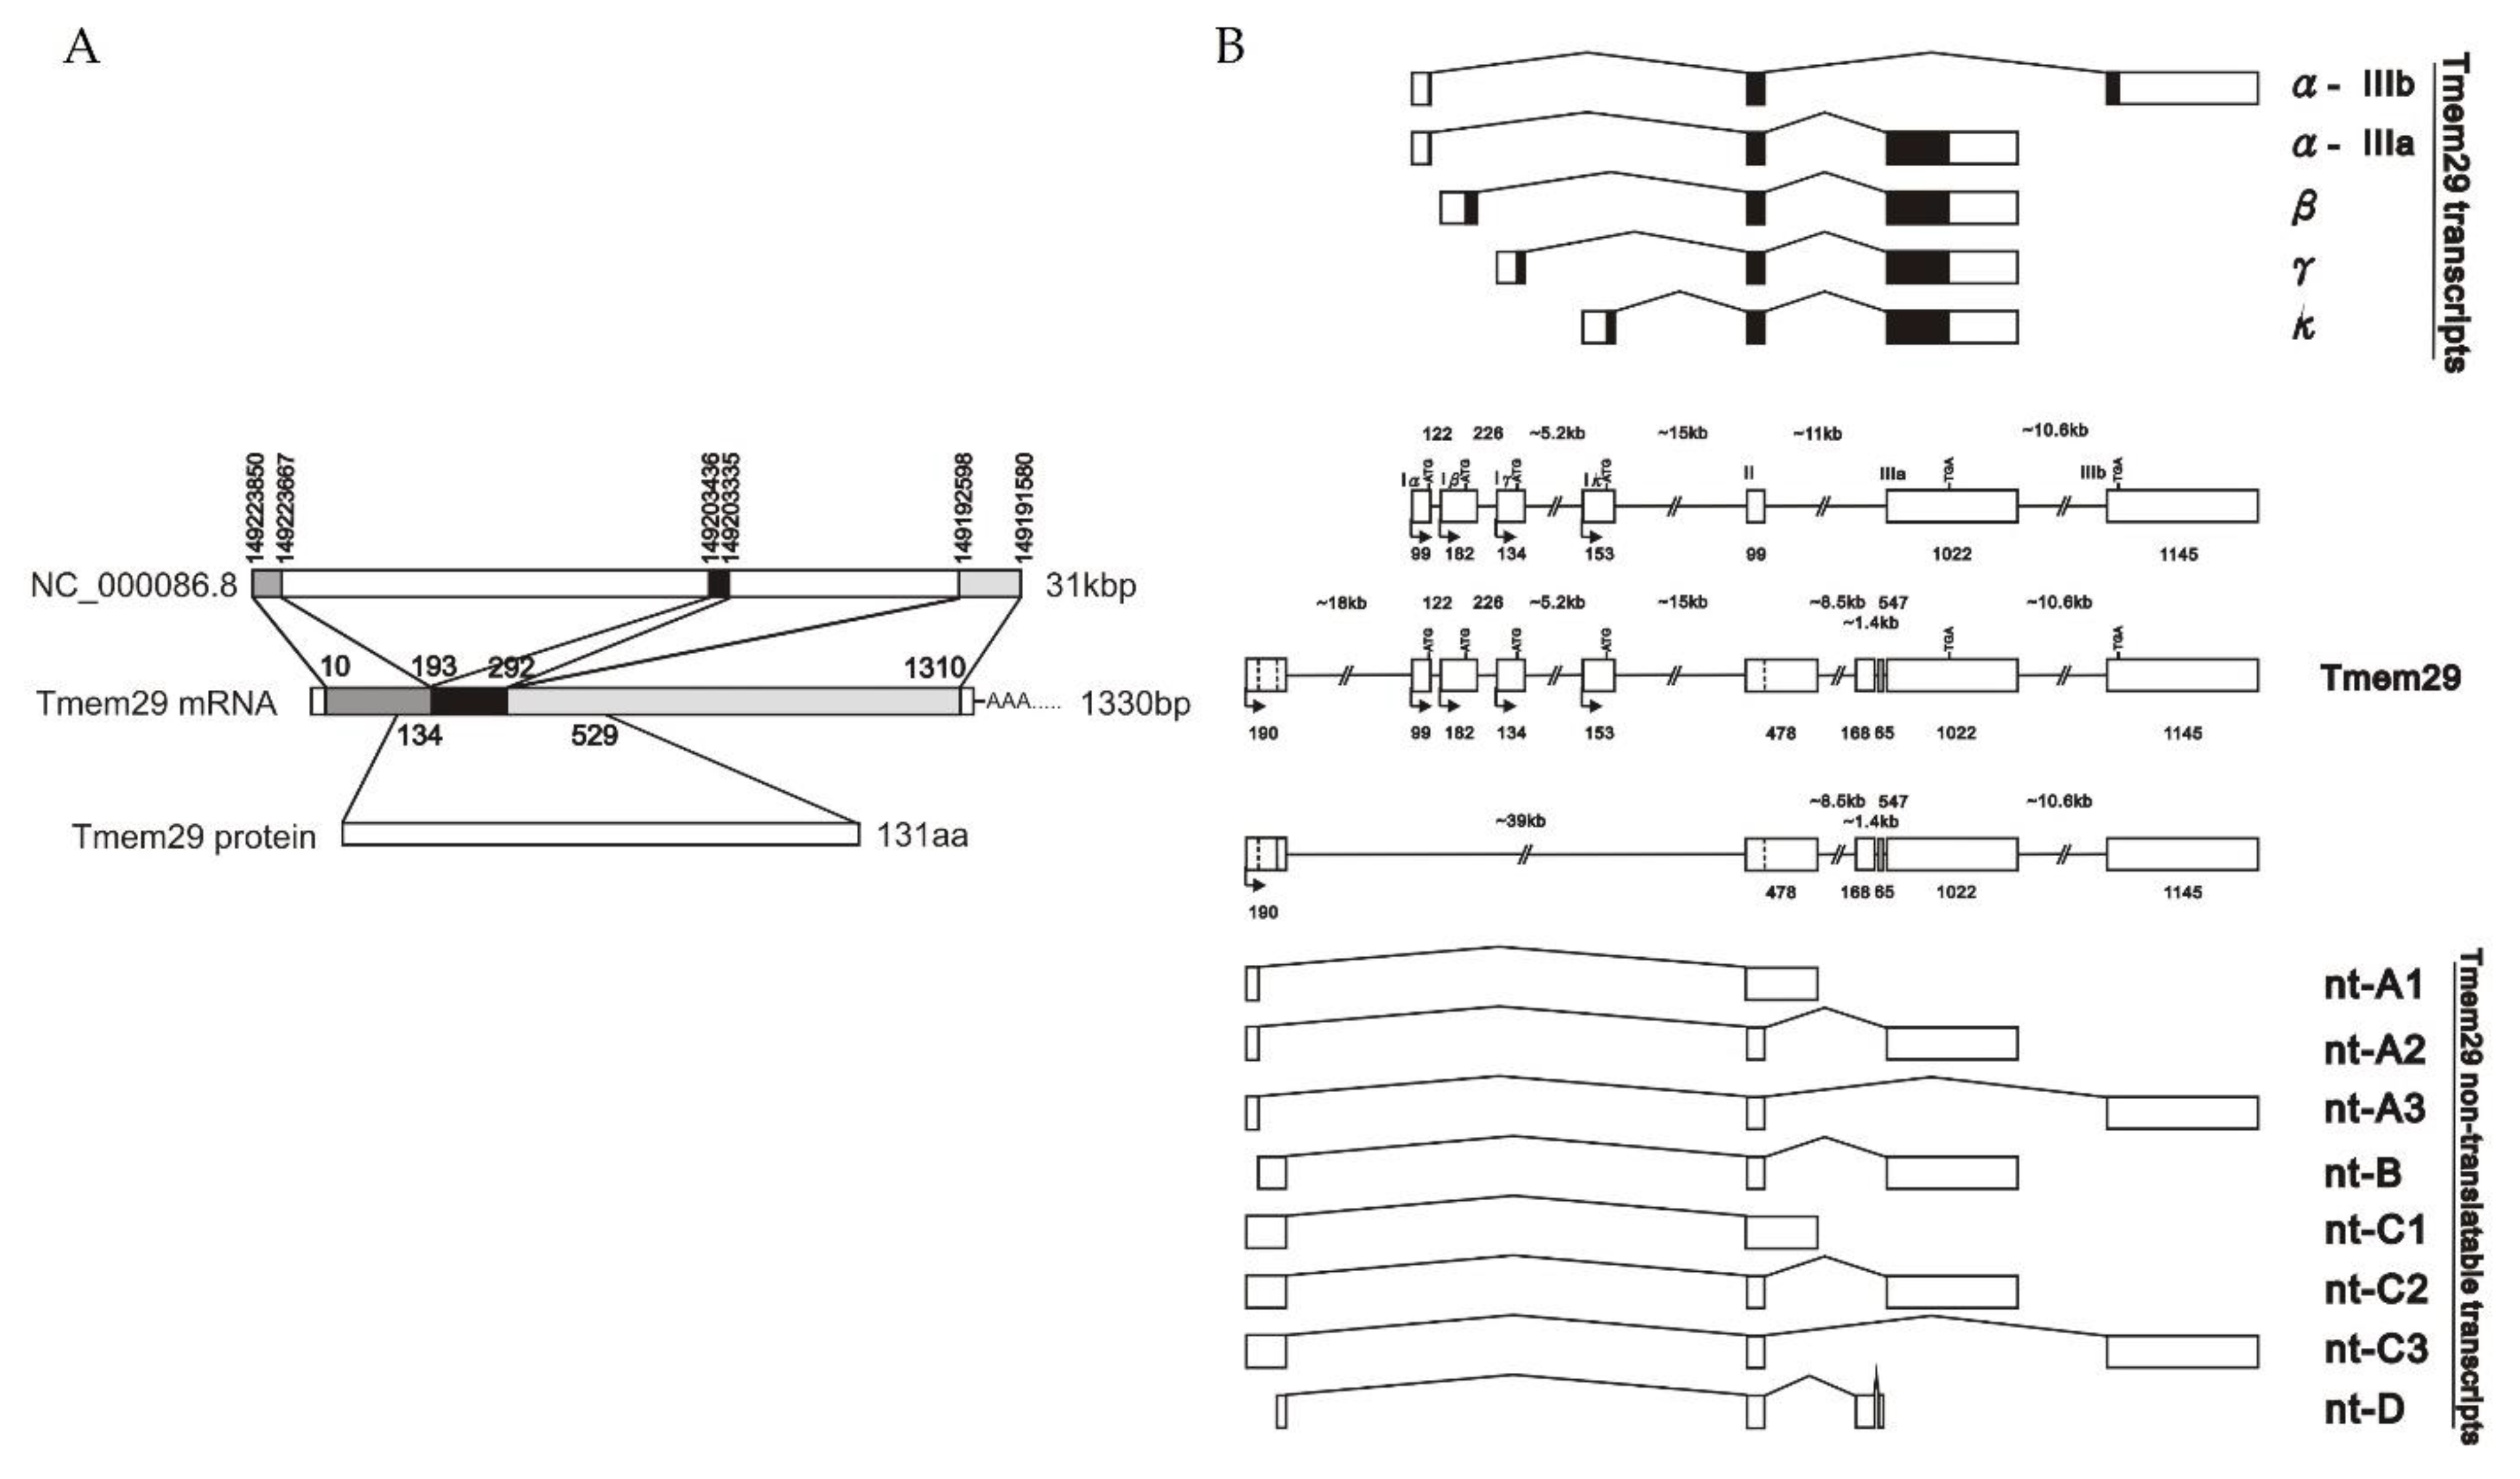
Abstract
:1. Introduction
2. Materials and Methods
2.1. Differential Expressed Hypoxic-Ischemic Novel Molecules Analysis
2.2. Mice Organ mRNA Expression Studies of Tmem29
2.3. In Vitro Protein Expression Analysis of Tmem29
2.4. Oxygen Glucose Deprivation in Neuro2a Cultures
2.5. Statistical Analysis
3. Results
3.1. Identification of a Differentially Expressed Gene after HIBD and Expressed as a Transcript Family
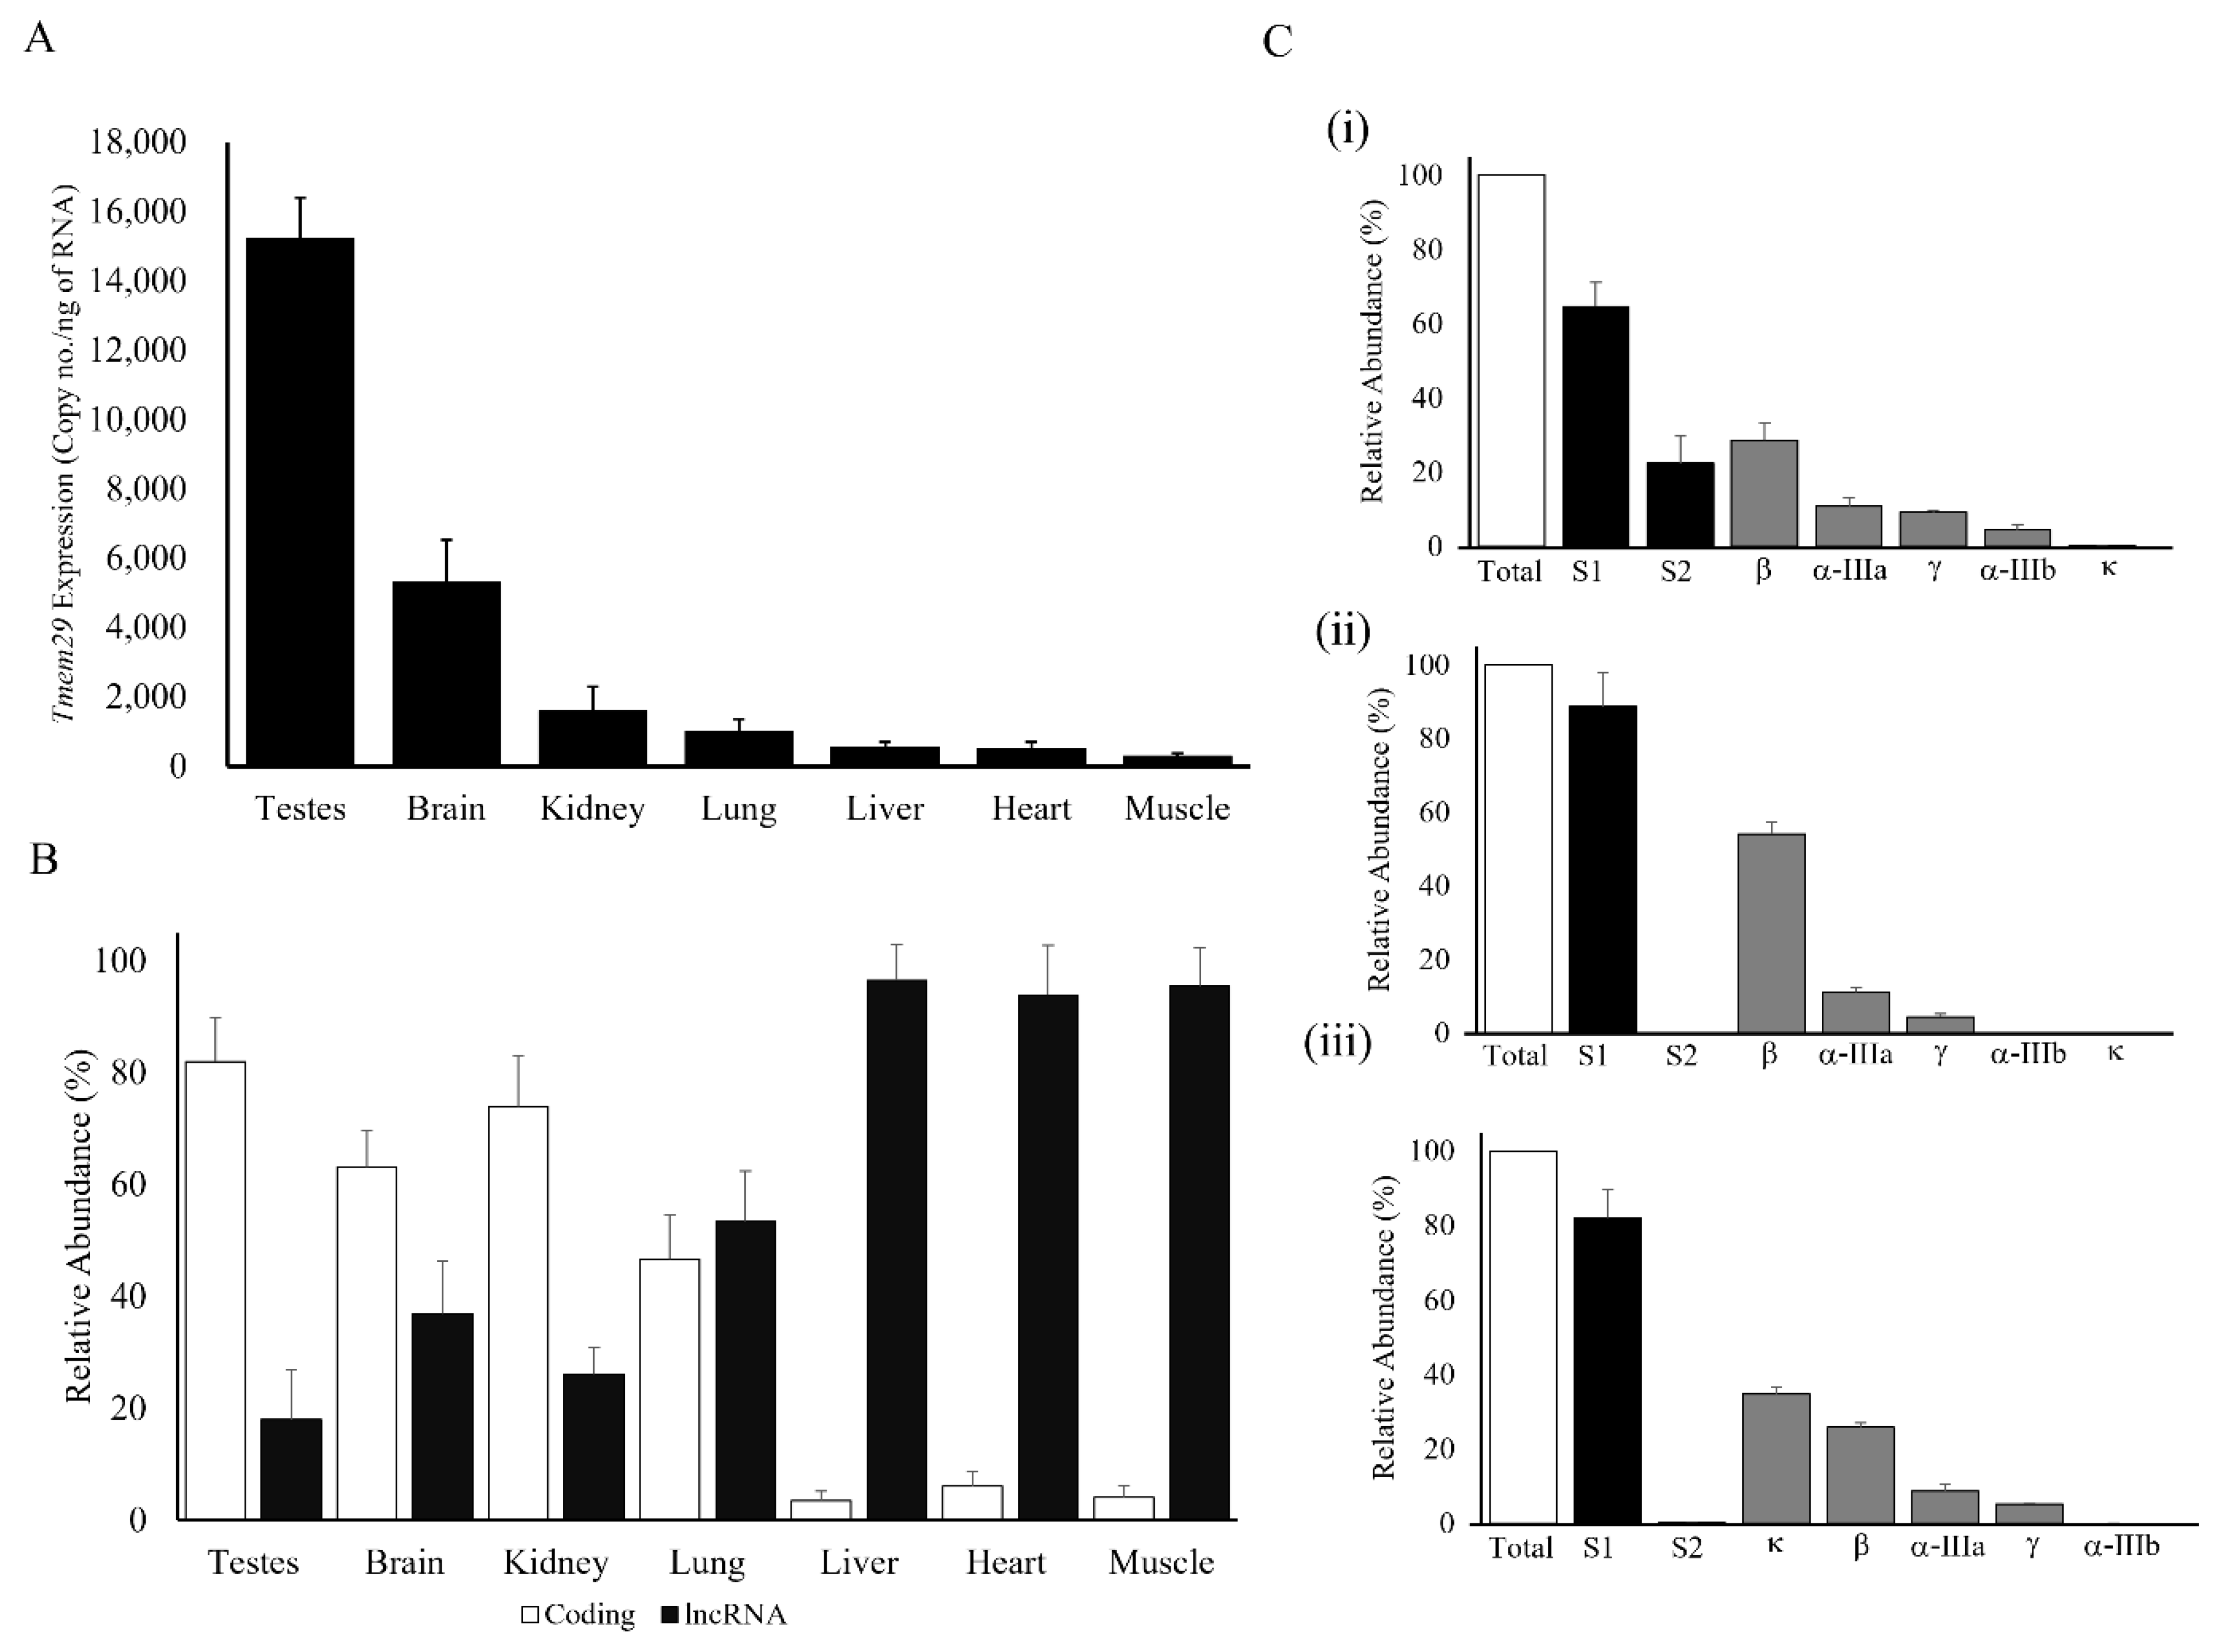
3.2. Complex Regulation of Tmem29: Expressed Differently in Various Adult Mice Organs
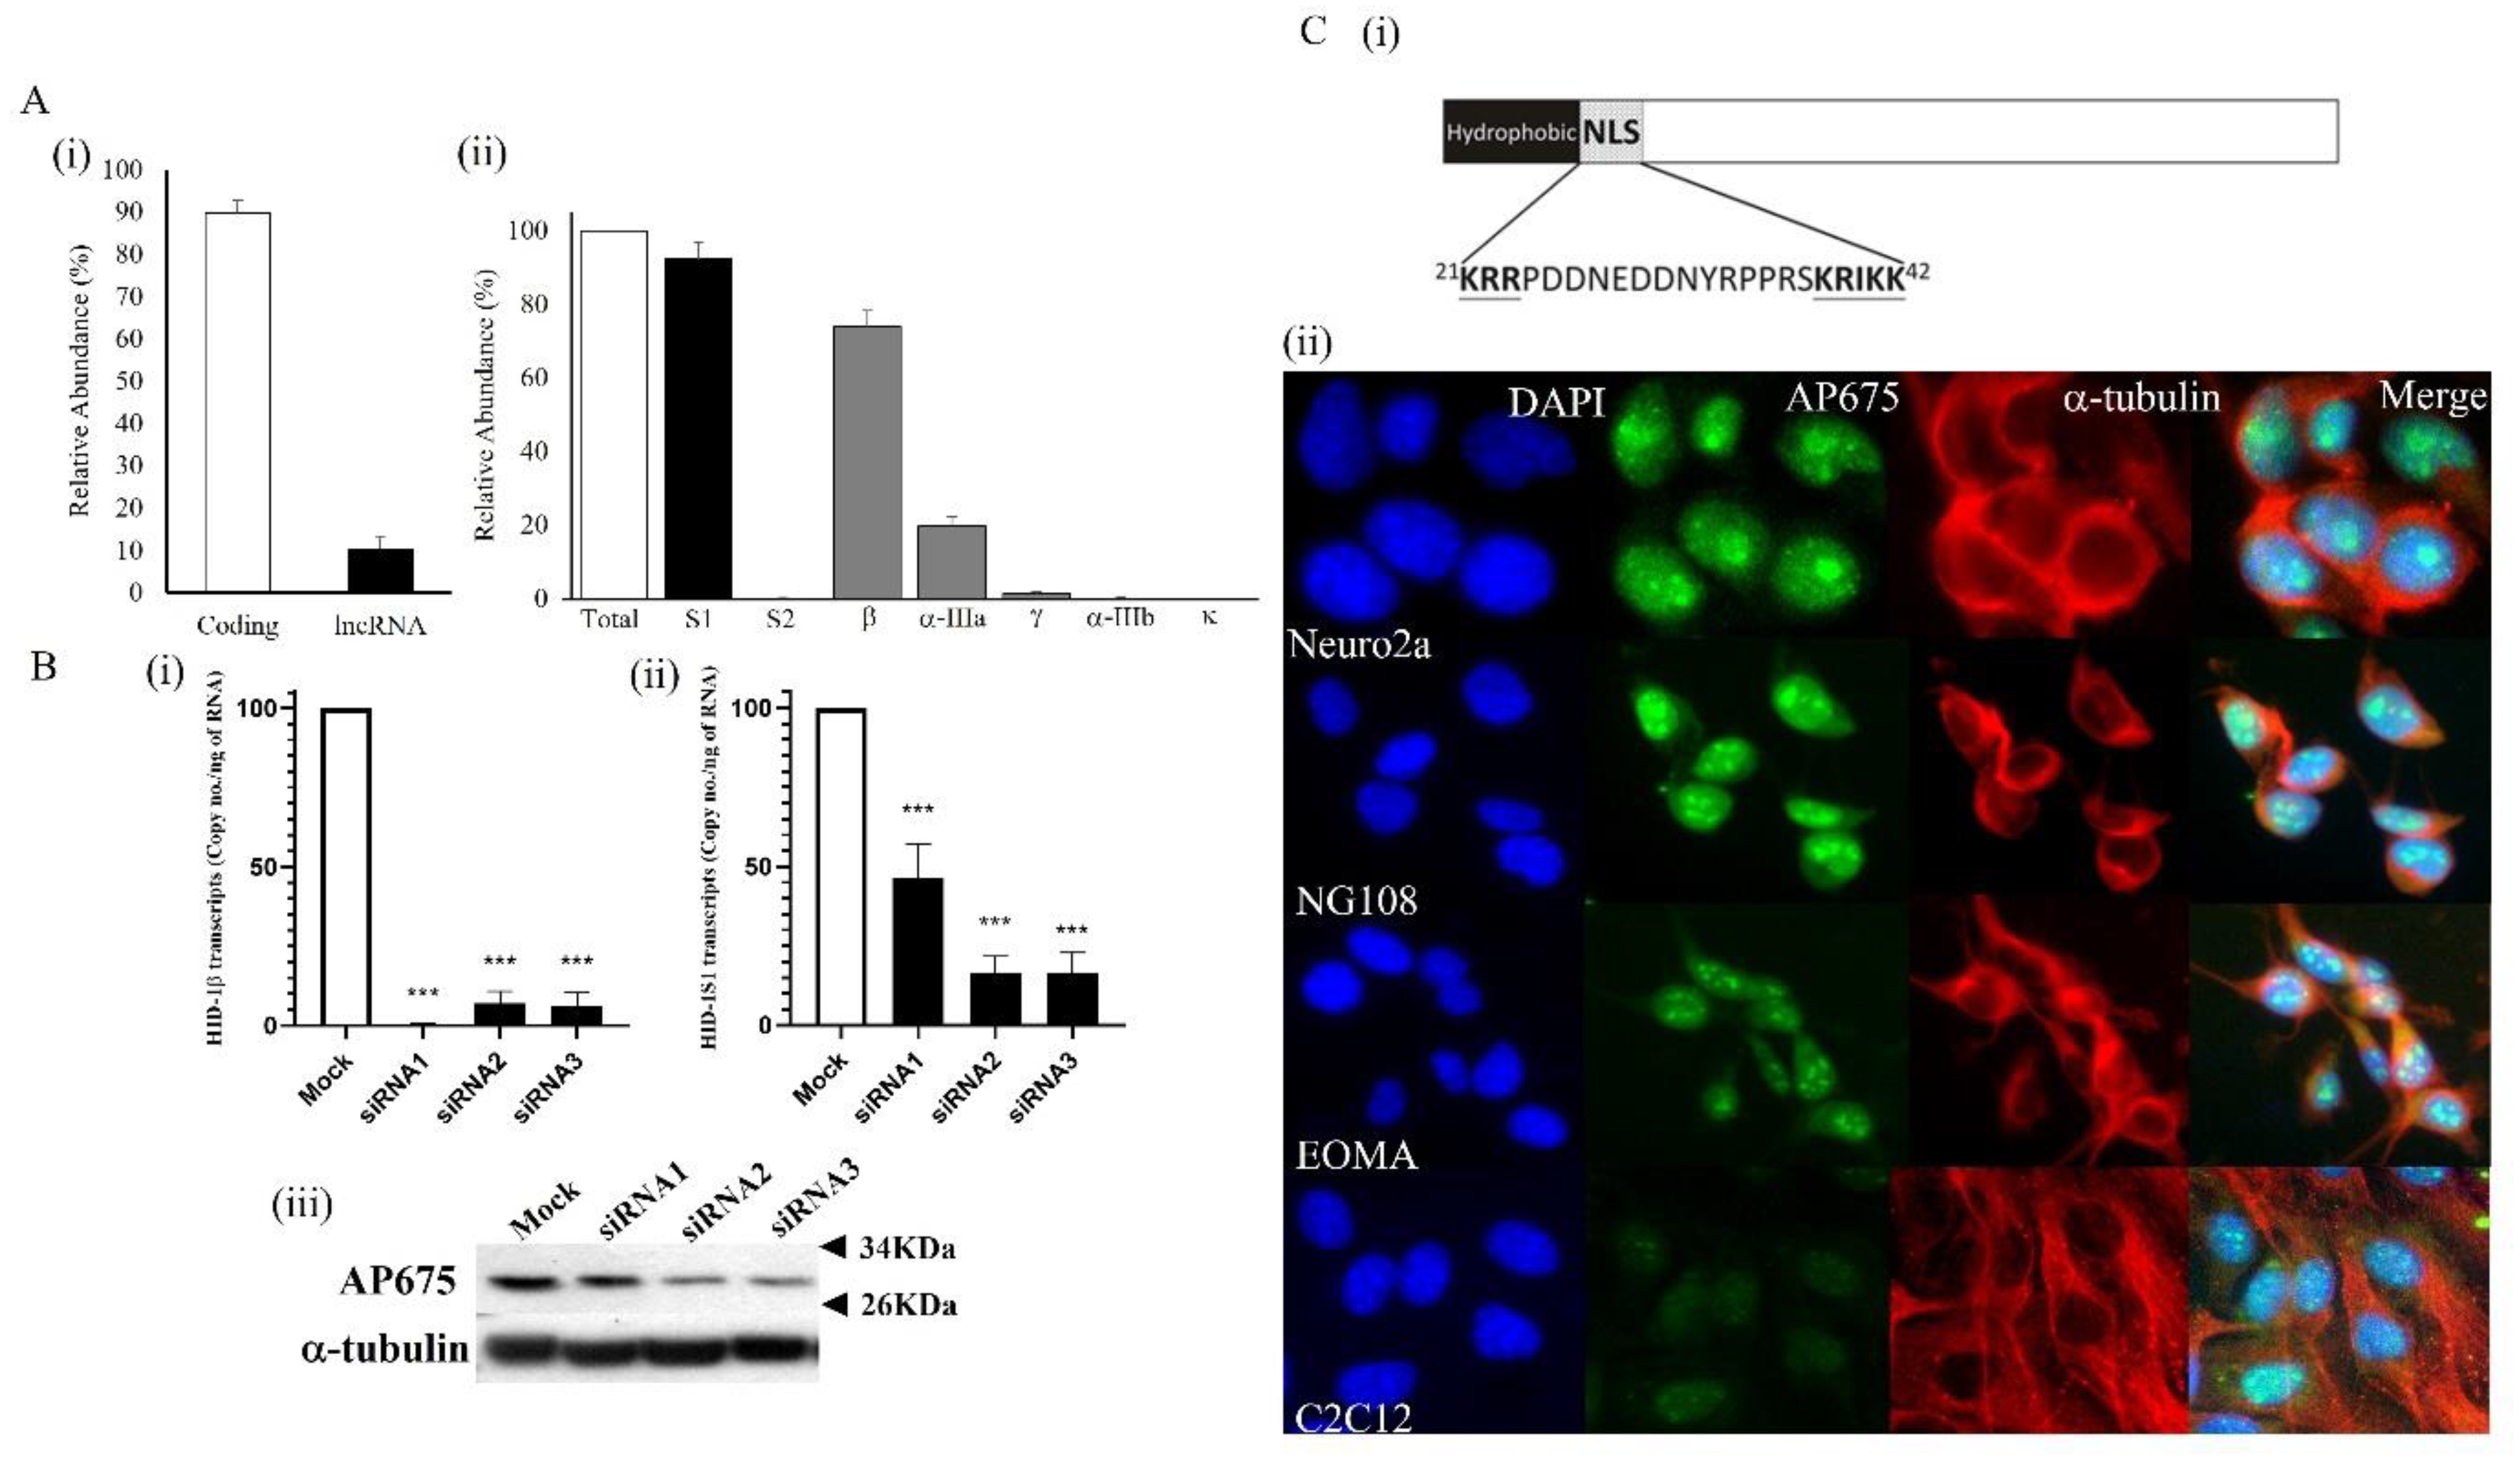
3.3. Tmem29 Encodes for a Nuclear Protein
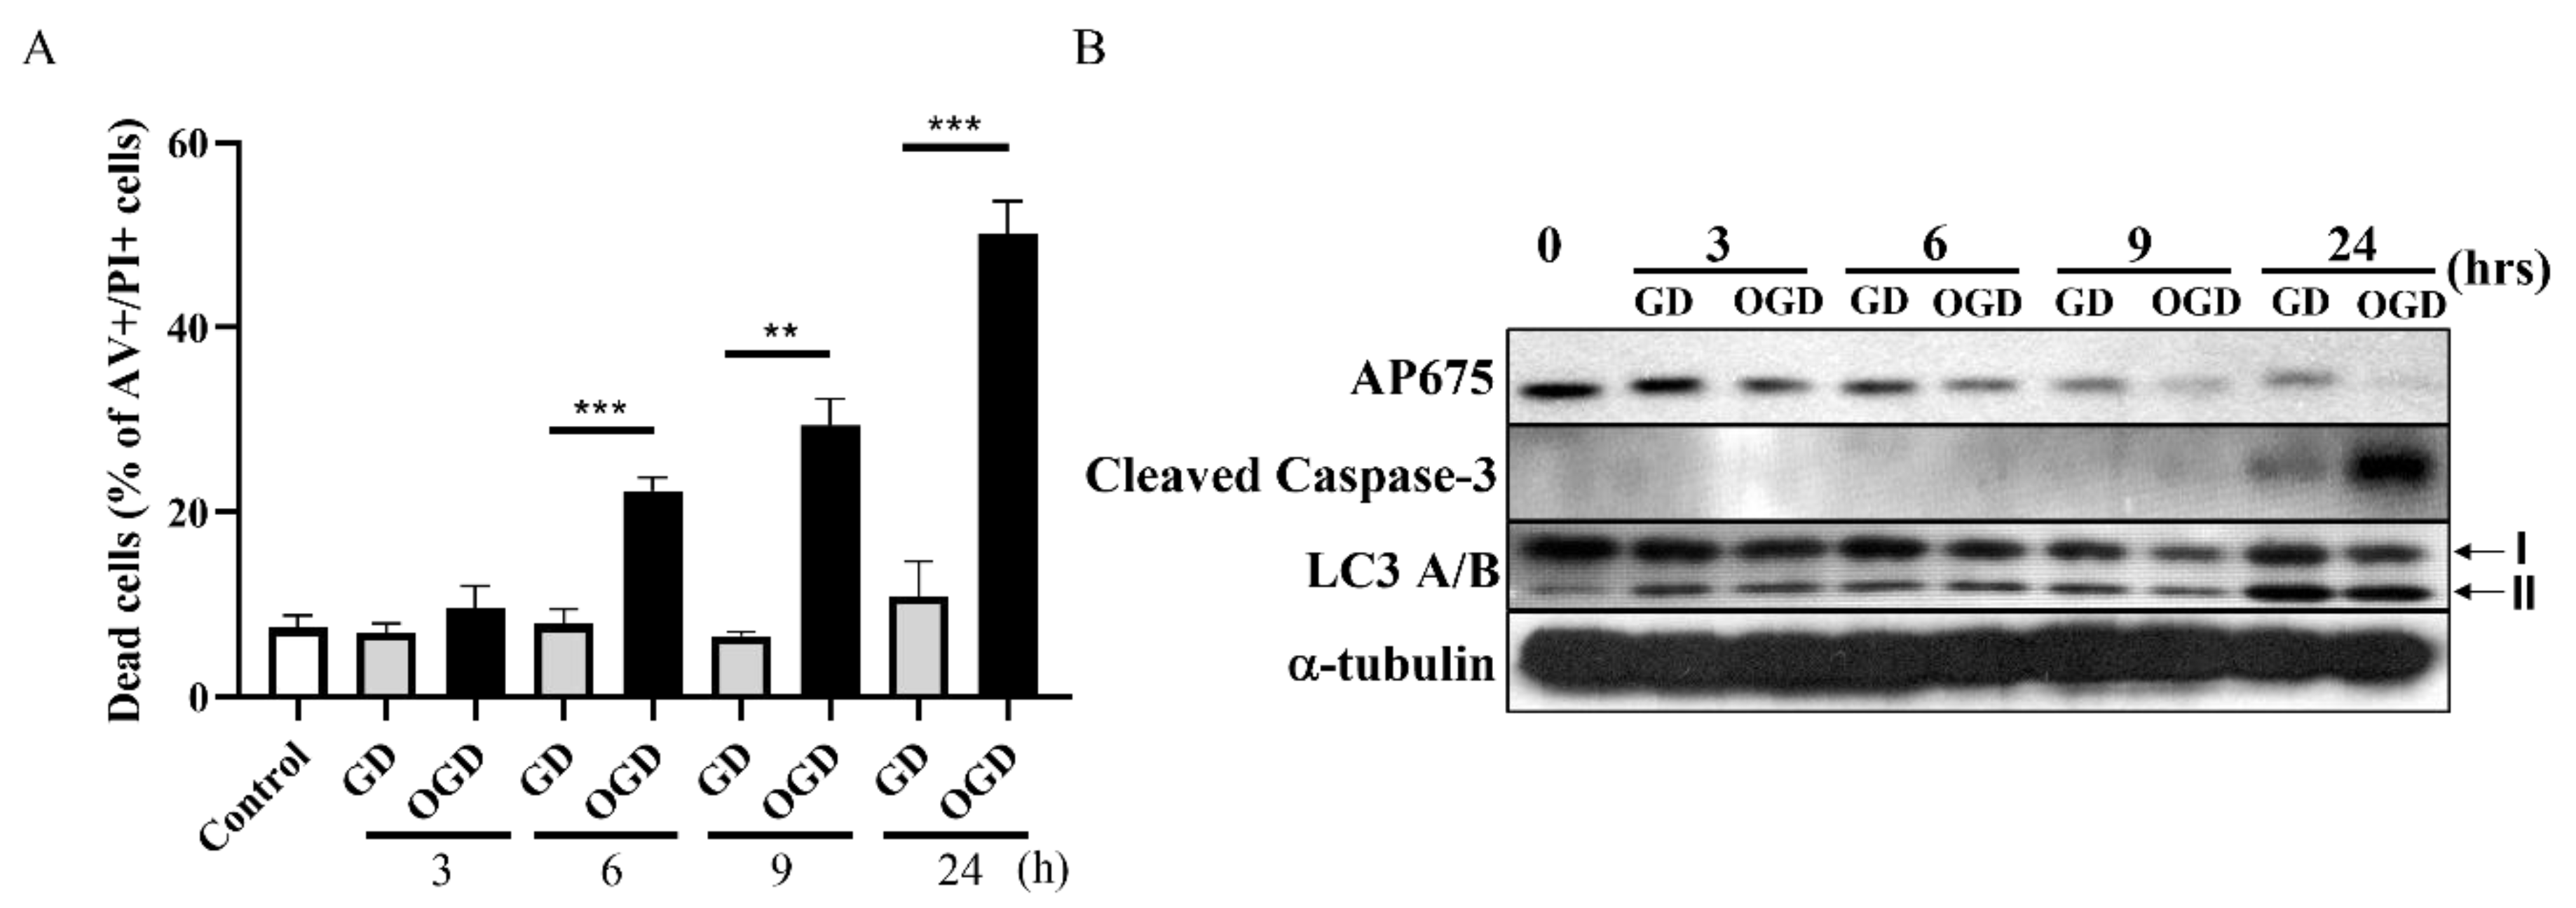
3.4. Downregulation of Tmem29 Protein after Oxygen Glucose Deprivation (OGD) and Glucose Deprivation (GD) in Neuro2a Cells
4. Discussion
5. Conclusions
Supplementary Materials
Author Contributions
Funding
Institutional Review Board Statement
Informed Consent Statement
Data Availability Statement
Conflicts of Interest
References
- Ferriero, D.M. Neonatal brain injury. N. Engl. J. Med. 2004, 351, 1985–1995. [Google Scholar] [CrossRef] [PubMed]
- Perlman, J.M. Brain injury in the term infant. Semin. Perinatol. 2004, 28, 415–424. [Google Scholar] [CrossRef] [PubMed]
- Sarnat, H.B.; Sarnat, M.S. Neonatal encephalopathy following fetal distress. A clinical and electroencephalographic study. Arch. Neurol. 1976, 33, 696–705. [Google Scholar] [CrossRef]
- Thompson, C.M.; Puterman, A.S.; Linley, L.L.; Hann, F.M.; van der Elst, C.W.; Molteno, C.D.; Malan, A.F. The value of a scoring system for hypoxic ischaemic encephalopathy in predicting neurodevelopmental outcome. Acta Paediatr. 1997, 86, 757–761. [Google Scholar] [CrossRef]
- Lv, H.Y.; Wu, S.J.; Wang, Q.L.; Yang, L.H.; Ren, P.S.; Qiao, B.J.; Wang, Z.Y.; Li, J.H.; Gu, X.L.; Li, L.X. Effect of erythropoietin combined with hypothermia on serum tau protein levels and neurodevelopmental outcome in neonates with hypoxic-ischemic encephalopathy. Neural Regen. Res. 2017, 12, 1655–1663. [Google Scholar] [CrossRef] [PubMed]
- Edmonds, C.J.; Helps, S.K.; Hart, D.; Zatorska, A.; Gupta, N.; Cianfaglione, R.; Vollmer, B. Minor neurological signs and behavioural function at age 2 years in neonatal hypoxic ischaemic encephalopathy (HIE). Eur. J. Paediatr. Neurol. 2020, 27, 78–85. [Google Scholar] [CrossRef]
- Aridas, J.D.; Yawno, T.; Sutherland, A.E.; Nitsos, I.; Ditchfield, M.; Wong, F.Y.; Fahey, M.C.; Malhotra, A.; Wallace, E.M.; Jenkin, G.; et al. Detecting brain injury in neonatal hypoxic ischemic encephalopathy: Closing the gap between experimental and clinical research. Exp. Neurol. 2014, 261, 281–290. [Google Scholar] [CrossRef] [PubMed]
- Arteaga, O.; Revuelta, M.; Uriguen, L.; Alvarez, A.; Montalvo, H.; Hilario, E. Pretreatment with Resveratrol Prevents Neuronal Injury and Cognitive Deficits Induced by Perinatal Hypoxia-Ischemia in Rats. PLoS ONE 2015, 10, e0142424. [Google Scholar] [CrossRef] [Green Version]
- Jha, N.K.; Jha, S.K.; Sharma, R.; Kumar, D.; Ambasta, R.K.; Kumar, P. Hypoxia-Induced Signaling Activation in Neurodegenerative Diseases: Targets for New Therapeutic Strategies. J. Alzheim. Dis. 2018, 62, 15–38. [Google Scholar] [CrossRef]
- National Center for Biotechnology Information (NCBI) GENE Database. Available online: https://0-www-ncbi-nlm-nih-gov.brum.beds.ac.uk/gene/382245 (accessed on 23 June 2021).
- The European Bioinformatics Institute(EMBL-EBI), Ensembl Mouse Gene Database. Available online: https://asia.ensembl.org/Mus_musculus/Gene/Summary?db=core;g=ENSMUSG00000041353;r=X:149180769-149242150 (accessed on 23 June 2021).
- National Center for Biotechnology Information (NCBI) HomoloGene Database (Accession no.:136288). Available online: https://0-www-ncbi-nlm-nih-gov.brum.beds.ac.uk/homologene/136288 (accessed on 4 July 2021).
- Reinius, B.; Johansson, M.M.; Radomska, K.J.; Morrow, E.H.; Pandey, G.K.; Kanduri, C.; Sandberg, R.; Williams, R.W.; Jazin, E. Abundance of female-biased and paucity of male-biased somatically expressed genes on the mouse X-chromosome. BMC Genom. 2012, 13, 607. [Google Scholar] [CrossRef] [Green Version]
- Levine, S. Anoxic-ischemic encephalopathy in rats. Am. J. Pathol. 1960, 36, 1–17. [Google Scholar] [PubMed]
- Rice, J.E., 3rd; Vannucci, R.C.; Brierley, J.B. The influence of immaturity on hypoxic-ischemic brain damage in the rat. Ann. Neurol. 1981, 9, 131–141. [Google Scholar] [CrossRef] [PubMed]
- Vannucci, R.C.; Connor, J.R.; Mauger, D.T.; Palmer, C.; Smith, M.B.; Towfighi, J.; Vannucci, S.J. Rat model of perinatal hypoxic-ischemic brain damage. J. Neurosci. Res. 1999, 55, 158–163. [Google Scholar] [CrossRef]
- Vannucci, R.C.; Vannucci, S.J. A model of perinatal hypoxic-ischemic brain damage. Ann. N. Y. Acad. Sci. 1997, 835, 234–249. [Google Scholar] [CrossRef] [PubMed]
- Nguyen, B.A.N.; Pogoutse, A.; Provart, N.; Moses, A.M. NLStradamus: A simple Hidden Markov Model for nuclear localization signal prediction. BMC Bioinf. 2009, 10, 202. [Google Scholar] [CrossRef] [Green Version]
- Jin, K.; Mao, X.O.; Eshoo, M.W.; Nagayama, T.; Minami, M.; Simon, R.P.; Greenberg, D.A. Microarray analysis of hippocampal gene expression in global cerebral ischemia. Ann. Neurol. 2001, 50, 93–103. [Google Scholar] [CrossRef]
- Kim, Y.D.; Sohn, N.W.; Kang, C.; Soh, Y. DNA array reveals altered gene expression in response to focal cerebral ischemia. Brain. Res. Bull. 2002, 58, 491–498. [Google Scholar] [CrossRef]
- Raghavendra Rao, V.L.; Bowen, K.K.; Dhodda, V.K.; Song, G.; Franklin, J.L.; Gavva, N.R.; Dempsey, R.J. Gene expression analysis of spontaneously hypertensive rat cerebral cortex following transient focal cerebral ischemia. J. Neurochem. 2002, 83, 1072–1086. [Google Scholar] [CrossRef] [PubMed]
- Tang, Y.; Lu, A.; Aronow, B.J.; Wagner, K.R.; Sharp, F.R. Genomic responses of the brain to ischemic stroke, intracerebral haemorrhage, kainate seizures, hypoglycemia, and hypoxia. Eur. J. Neurosci. 2002, 15, 1937–1952. [Google Scholar] [CrossRef]
- Gubits, R.M.; Burke, R.E.; Casey-McIntosh, G.; Bandele, A.; Munell, F. Immediate early gene induction after neonatal hypoxia-ischemia. Brain. Res. Mol. Brain. Res. 1993, 18, 228–238. [Google Scholar] [CrossRef]
- Hedtjarn, M.; Mallard, C.; Eklind, S.; Gustafson-Brywe, K.; Hagberg, H. Global gene expression in the immature brain after hypoxia-ischemia. J. Cereb. Blood Flow Metab. 2004, 24, 1317–1332. [Google Scholar] [CrossRef] [PubMed]
- Chen, J.; Simon, R. Ischemic tolerance in the brain. Neurology 1997, 48, 306–311. [Google Scholar] [CrossRef] [PubMed]
- Welch, W.J. Mammalian stress response: Cell physiology, structure/function of stress proteins, and implications for medicine and disease. Physiol. Rev. 1992, 72, 1063–1081. [Google Scholar] [CrossRef] [PubMed]
- Kapranov, P.; Cheng, J.; Dike, S.; Nix, D.A.; Duttagupta, R.; Willingham, A.T.; Stadler, P.F.; Hertel, J.; Hackermuller, J.; Hofacker, I.L.; et al. RNA maps reveal new RNA classes and a possible function for pervasive transcription. Science 2007, 316, 1484–1488. [Google Scholar] [CrossRef] [Green Version]
- 6 Non-coding RNA characterization. Nature 2019. [CrossRef]
- Fang, H.; Li, H.F.; He, M.H.; Yan, J.Y.; Yang, M.; Zhang, F.X.; Wang, R.R.; Wang, Q.Y.; Zhang, J.P. Long non-coding RNA MALAT1 sponges microRNA-429 to regulate apoptosis of hippocampal neurons in hypoxic-ischemic brain damage by regulating WNT1. Brain. Res. Bull 2019, 152, 1–10. [Google Scholar] [CrossRef]
- Fu, C.H.; Lai, F.F.; Chen, S.; Yan, C.X.; Zhang, B.H.; Fang, C.Z.; Wang, G.H. Silencing of long non-coding RNA CRNDE promotes autophagy and alleviates neonatal hypoxic-ischemic brain damage in rats. Mol. Cell Biochem. 2020, 472, 1–8. [Google Scholar] [CrossRef]
- Zhou, H.; Wang, X.; Cheng, R.; Hou, X.; Chen, Y.; Feng, Y.; Qiu, J. Analysis of long non-coding RNA expression profiles in neonatal rats with hypoxic-ischemic brain damage. J. Neurochem. 2019, 149, 346–361. [Google Scholar] [CrossRef]
- Geronimo-Olvera, C.; Montiel, T.; Rincon-Heredia, R.; Castro-Obregon, S.; Massieu, L. Autophagy fails to prevent glucose deprivation/glucose reintroduction-induced neuronal death due to calpain-mediated lysosomal dysfunction in cortical neurons. Cell Death Dis. 2017, 8, e2911. [Google Scholar] [CrossRef] [Green Version]
- Wang, P.; Shao, B.Z.; Deng, Z.; Chen, S.; Yue, Z.; Miao, C.Y. Autophagy in ischemic stroke. Prog. Neurobiol. 2018, 163–164, 98–117. [Google Scholar] [CrossRef]
- Zhao, M.; Zhu, P.; Fujino, M.; Zhuang, J.; Guo, H.; Sheikh, I.; Zhao, L.; Li, X.K. Oxidative Stress in Hypoxic-Ischemic Encephalopathy: Molecular Mechanisms and Therapeutic Strategies. Int. J. Mol. Sci. 2016, 17, 2078. [Google Scholar] [CrossRef] [PubMed] [Green Version]


Publisher’s Note: MDPI stays neutral with regard to jurisdictional claims in published maps and institutional affiliations. |
© 2022 by the authors. Licensee MDPI, Basel, Switzerland. This article is an open access article distributed under the terms and conditions of the Creative Commons Attribution (CC BY) license (https://creativecommons.org/licenses/by/4.0/).
Share and Cite
Tsang, H.-W.; Bhatia, I.; Chan, K.-W.; Chan, G.C.-F.; Ip, P.; Cheung, P.-T. Transmembrane 29 (Tmem29), a Newly Identified Molecule Showed Downregulation in Hypoxic-Ischemic Brain Damage. NeuroSci 2022, 3, 41-51. https://0-doi-org.brum.beds.ac.uk/10.3390/neurosci3010003
Tsang H-W, Bhatia I, Chan K-W, Chan GC-F, Ip P, Cheung P-T. Transmembrane 29 (Tmem29), a Newly Identified Molecule Showed Downregulation in Hypoxic-Ischemic Brain Damage. NeuroSci. 2022; 3(1):41-51. https://0-doi-org.brum.beds.ac.uk/10.3390/neurosci3010003
Chicago/Turabian StyleTsang, Hing-Wai, Inderjeet Bhatia, Koon-Wing Chan, Godfrey Chi-Fung Chan, Patrick Ip, and Pik-To Cheung. 2022. "Transmembrane 29 (Tmem29), a Newly Identified Molecule Showed Downregulation in Hypoxic-Ischemic Brain Damage" NeuroSci 3, no. 1: 41-51. https://0-doi-org.brum.beds.ac.uk/10.3390/neurosci3010003