Article

Optimizing N Fertilization for Increasing Yield and Profits of Rainfed Maize Grown under Sandy Loam Soil

1
Nepal Agricultural Research Council, DoAR Karnali Province, Dasharathpur, Surkhet 21702, Nepal
2
International Maize and Wheat Improvement Centre (CIMMYT), Khumaltar, Lalitpur 44705, Nepal
3
International Fertilizer Development Centre (IFDC), Kathmandu 44600, Nepal
4
National Soil Science Research Centre, Khumaltar, Lalitpur 44705, Nepal
*
Author to whom correspondence should be addressed.
Submission received: 19 July 2021 / Revised: 21 August 2021 / Accepted: 27 August 2021 / Published: 1 September 2021

Abstract

:
The optimum dose of fertilizers for crops varies with soil, agro-ecology, and crop management practices. Optimizing application dose is critical to reduce nutrient loss to the environment and increase nitrogen use efficiency (NUE), crop yields, and economic return to farmers. An experiment was conducted to determine the optimum N dose for increasing maize (Zea mays L. cv, Manakamana-3) yield, NUE, and farm profits under rainfed conditions. Five levels of N (0, 60, 120, 180, and 240 kg ha−1), and a non-fertilized treatment were tested in a randomized complete block design with three replications. Effects of each treatment on yield and yield attributing traits, plant lodging and Sterility (plants with no cob or grain formation), NUE, and stay green trait of maize were recorded. Application of N above 120 kg ha−1 (N120) did not have any significant effects on yield and yield components. Nitrogen, at N120 and above, produced highly fertile plants (though sterility slightly increased at N180 and N240), higher N uptake, and lower dead leaf area (18–27%). N120 produced the highest agronomic; yield increase per unit of N application (AEN—26.89 kg grain kg−1 N) and physiological efficiency of N (PEN—42.67 kg grain kg−1 N uptake), and net benefit (USD 500.43). Considering agronomic, economic, and NUE factors, an N dose of 120 kg ha−1 was found optimum for the cultivation of rainfed maize (Manakamana-3) under sandy loam soil.

1. Introduction

Maize is a major cereal crop for livestock feed, fuel, fodder, and human nutrition across the world. Globally, 1148.49 million tons of maize is produced from 197.20 million hectares (ha) area with a productivity of 5.82 t ha−1 and consumed mostly as feed (61%), food (17%), and industrial raw material (22%) [1]. In Nepal, current maize production is 2.71 million tons from a 0.96 million hectare area with an average productivity of 2.84 t ha−1 [2]. Besides being a staple crop of the mid-hill region, maize is the chief ingredient of livestock feeds, especially for rapidly growing poultry [3,4]. Despite the cultivation of several new maize hybrids and improved varieties, national production fails to fulfill total demand, and the country imports maize in large quantities every year [5,6]. Maize productivity is low compared to other South Asian countries (Pakistan—5.12 t ha−1, Bangladesh—8.02 t ha−1, Sri Lanka—3.87 t ha−1) [1]. Low productivity is associated with several edaphoclimatic constraints. One of the major reasons for low productivity is the inefficient use of fertilizers, thus a large yield gap between farmer’s practice and attainable yield is prevalent [7,8,9].
Among the essential plant nutrients, nitrogen (N) is the most limiting one [10,11,12]. However, both excess and deprived application could be detrimental to plants. Nitrogen shortage during the vegetative stage directly affects root development, stem elongation, and uptake of other nutrients [13], while impairs pollen shedding, fertilization, grain filling, and premature senescence of leaves, if it extends to flowering and later stages [13,14,15,16,17,18]. In contrast, excess supply of N with a low potassium dose promotes vigorous vegetative growth, taller plant stature, and higher risk to lodging [19].
Global N consumption is increasing every year; 105.15 million tons in 2016 and is projected to reach approximately 111.60 million tons by 2022 [20]. A similar trend is observed in Nepal. Sales of urea from 2010 to 2017 increased by almost three times while Di-ammonium phosphate (DAP), and Muriate of potash (MoP) increased by 4.80 and 2.76 times, respectively. Urea application was 2.23 and 30.12 times higher in comparison to DAP and MoP fertilizers [21]. Additionally, farmers buy some fertilizers from the private sector as well as trade from the grey market, although the grey market data are excluded in official records [22]. With the increased application of N, the amount of losses has also been elevated from soil–plant systems, causing low fertilizer use efficiency thereby contributing to increasing greenhouse gas emissions, eutrophication, and biodiversity degradation [10,23,24,25,26]. Long-term application of N fertilizer in the form of urea increases soil acidity, thus degrades the physical and chemical properties of soil [27]. Due to these reasons, the majority of research has been focused on increasing nitrogen use efficiency (NUE) through efficient N fertilizer management practices [24,26].
Nutrient loss is attributed to a mismatch of synchrony between crop needs and soil supply. In Nepal, balanced fertilization (as recommended by the government) rarely happens in farmer’s fields. Farmers’ fertilizer use is very low compared to other South Asian countries. Moreover, farmers prefer urea as this is relatively cheaper. In some cases, this leads to over-application depending on availability in the market and low to no application under shortage [22,28,29,30]. Even if the recommended dose of fertilizer (RDF) is applied, improved varieties and hybrids are under-performing as the current RDF is decades old and needs to be revised according to different agro-ecology, soil, and growing conditions [8]. Considering the environmental impact of nutrient loss, few studies were conducted on innovative fertilizers and application methods. For example, deep placement of urea briquette in maize was found effective for increasing grain yield, N use efficiency, and economic return [22]. In addition, the use of blended fertilizer to reduce total fertilizer import was suggested [22]. However, commercial production of these fertilizers would commence only after registration in a formal system and may take an even longer time to reach farmers’ fields. Likewise, the country has started a soil testing facility in a mobile van covering different districts [31], this somehow imprints a positive effect on fertilizer application decisions.
Fertilizer doses of 120:60:40 N P2O5 K2O kg ha−1 are the current recommendations for improved varieties of maize [8]. This general recommendation may not be equally effective across diverse agro-ecological regions, and soil types as nutrient uptake and crop yield are affected by the soil type and climate [32]. Sandy soil may lose N through leaching, while poorly drained heavy soil may lose N through denitrification [32]. The soil type of the experimental region is sandy loam and is characterized by low water holding [22,33] with hot summer and dry winter climate [34]. Thus, N loss through leaching and volatilization commonly occur in this region [32]. A revision of the RDF based on agronomic, economic, and physiological efficiency of applied fertilizers is necessary to produce more with less fertilizers by increasing plant uptake and reducing nutrient losses. Therefore, this study was conducted to determine the optimum dose of N to increase maize productivity, nitrogen use efficiency (NUE), and economic returns under sandy loam soil of the Mid-western river basin of Nepal.

2. Materials and Methods

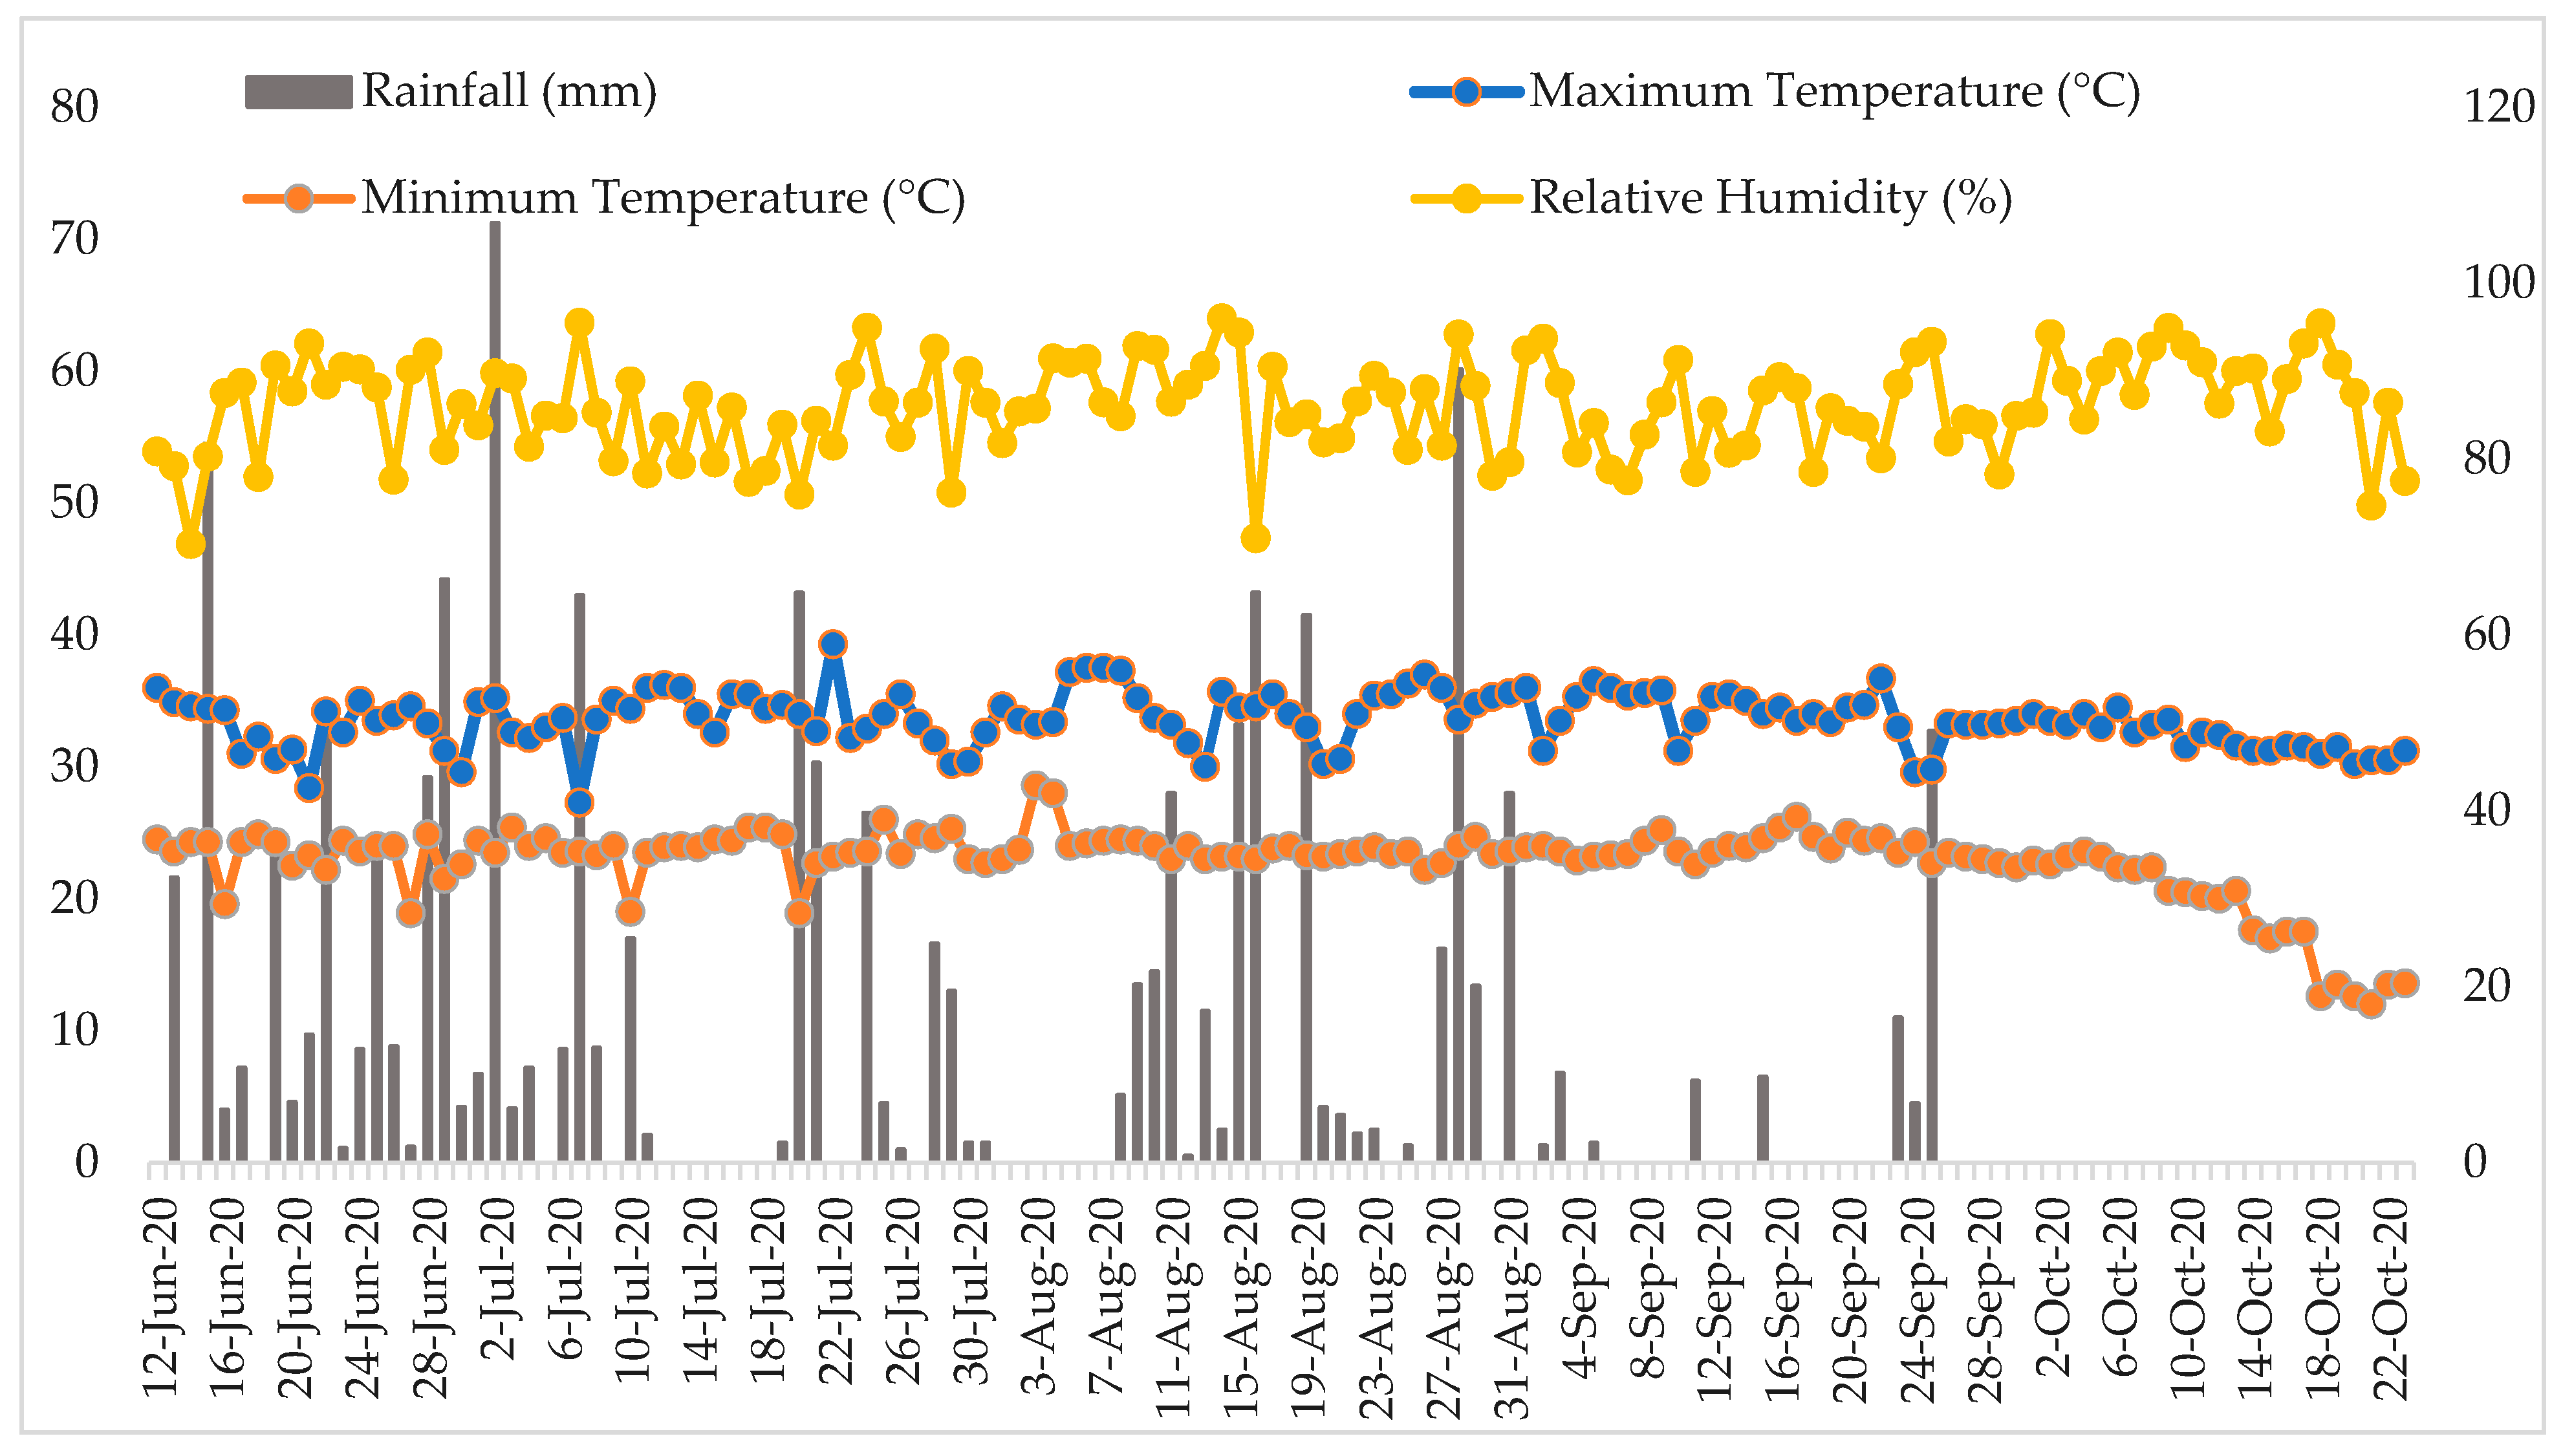
2.1. Experimental Site and Setup

A field trial was established at Directorate of Agricultural Research, Dasharathpur, Surkhet (28°30′ northern latitude, 81°47′ eastern longitude, and 490 m above mean sea level) from June to October 2020 during the summer season under rainfed conditions (Koppen–Geiger climatic class: temperate climate with dry winter and hot summer). The daily variation in rainfall (mm), maximum–minimum temperatures (°C), and humidity (%) during the study period are depicted in Figure 1.
Six treatments including five doses of N fertilizer (0, 60, 120, 180, and 240 kg ha−1) and control—CK (without any fertilizer) were deployed in a randomized complete block design with three replications (Table 1). Replications (blocks) were one meter apart, while the distance between two plots within replication was 0.5 m. The size of each plot was 15 m2 (5 m × 3 m) comprising four lines (20 plants in each line at 25 cm distance) at an inter-row distance of 75 cm. Two seeds per hill were sown 4–5 cm below the soil surface and later maintained as a single stand by thinning at 26 days after sowing. During field preparation, deep ploughing was performed twice followed by harrowing, and levelling. For each treatment plot, the fertilizer amount was calculated and applied uniformly to the whole plot area. Phosphorous and potassium were applied in each plot, while nitrogen (N) was applied as per treatment. Urea (46% N) was top-dressed at 28 and 46 days after sowing in two equal splits in all N applied plots. In N omission plots (N0), single superphosphate (SSP) was applied to ensure no external N application. Di-ammonium phosphate—DAP (18% N and 46% P2O5), muriate of potash—MOP (60% K2O), single superphosphate—SSP (16% P2O5), and other nutrients mix were applied once (basal application) before sowing at final land preparation. The other nutrients mix consisted of secondary nutrients; Magnesium (2.5%), Calcium (3%), and Sulphur (3%), and micronutrients, including Zinc (8%), Iron (0.5%), Boron (1%), Copper (0.5%), Manganese (0.5%), and Molybdenum (0.03%).

2.2. Crop Management

Manakamana-3, a popular variety of the mid-hill region, was used for the experiment, which has a yield potential of 5.5 t ha−1 and was released in 2001 [35]. The preceding crop in the experimental site was wheat (Triticum aestivum L.). Agronomic management practices such as weeding, earthing up, and pest/disease management, etc.; were performed as required following standard protocols from the Nepal Agricultural Research Council (NARC). The crop was cultivated under rainfed conditions.

2.3. Soil, Plant and Grain Analysis

Soil samples were collected from different portions of each plot (0–20 cm depth), pooled into one composite sample for each treatment, and analyzed for their physicochemical properties (pH, OM, total N, available P and K, soil texture) at the National Soil Science Research Centre, Khumaltar, Lalitpur. Soil samples were oven-dried and passed through a 2 mm sieve before analysis. The hydrometer method was used for soil texture [36], potentiometric 1:2 for soil pH [37], Walkley and Black for organic matter [38], Kjeldahl for total N [39], Olsen’s for available P2O5 [40], and ammonium acetate for available K2O analysis [41]. The soil was characterized as a textured sandy loam (sand: 65%, silt: 35.4%, and clay: 15.4%) with slightly acidic in nature (pH: 6.45), medium level of organic matter (2.02%), total N (0.10%) and available K2O (125.80 mgkg−1), and higher amount of available P2O5 (96.12 mgkg−1). From different literatures, it is disseminated that Zinc and Boron deficiencies are widespread in almost all agro-ecology of Nepal [42,43,44]. Terai being more prone to it, for practicing rice based cropping system [42].
After harvesting, stover and grain samples were collected from each treatment plot for determining N content and total N uptake by plants. Plant samples were oven-dried at 65 °C for 72 h [39]. The dried samples (both grain and plant) were grounded and digested with sulphuric acid before plant N analysis. Nitrogen content was determined using the Kjeldahl digestion–distillation method. The N content (percentage) in grain and plant samples were later used for the determination of different components of nitrogen use efficiencies (NUEs).

2.4. Agro-Morphological Traits Recording

Plant height and ear heights (length between ground level to the base point of the uppermost ear in maize plant) were recorded based on observations of five sample plants from central two rows of the plots, whereas whole plot observation was carried out for plant lodging and sterility, and later expressed in percentage. Plants without cobs or cobs without kernels were considered sterile. Manual harvesting of the plants was performed 5 cm above the ground in each plot; 5 m length from two central rows (5 m × 1.5 m = 7.5 m2) excluding border rows. Stover yield (kg plot−1) was recorded after cobs were removed, oven-dried, and moisture corrected based on oven-dried weight [45]. The total number of cobs recovered were counted to record the number of ears harvested in each treatment.
Grain yield (kg plot−1), and hundred-grain weight (g) were recorded after proper drying and shelling of the cobs. The moisture percentage in the grain was estimated with a moisture tester (Wile 55, Farm comp Oy, Finland). The biological yield was estimated by adding grain and stover yield. After about 50% tasseling of the plants, leaf senescence scoring in each plot was performed by observing the central two rows of the plot. Four readings were taken at one-week intervals. We used a scale of 0 to 10 by dividing the estimated area of the dead leaf by 10; scale 1 indicates 10% dead leaf area, 2 indicates 20% dead leaf area, etc. The standard data recording protocol of Zaman-Allah et al. [46] was followed for all the studied parameters presented in this paper. Conversion of grain and stover yield (kg plot−1) to yield (t ha−1) were performed using the following formulas [22],
Grain   yield   ( t   ha 1 ) = Plot   yield   ( Kg )   Net   harvested   area   ( m 2 ) × ( 100   recorded   moisture ) ( 100 adjusted   moisture ) × 10,000 1000
Stover   yield   ( t   ha 1 ) = Plot   yield   ( Kg ) Net   harvested   area   ( m 2 ) × 10,000 1000
Stover yield (kg plot−1) was recorded after oven drying of samples and correcting the moisture based on oven-dried weight [45]. Grain moisture was adjusted to 12.5%, and the net harvested area was in m2. In both the equations, multiplication factor 10,000 was used for converting area (m2) into hectare and 1000−1 for converting yield (kg) into a metric ton.

2.5. Nitrogen Uptake and Use Efficiency

Total N uptake and different components of NUEs including agronomic efficiency (AEN), recovery efficiency (REN), partial factor productivity (PFPN), physiological efficiency (PEN), internal efficiency (IEN), and utilization efficiency (UEN) were estimated using the following formulas [45,47],
N   uptake   in   grain   = ( GY × NC ) 100
N   uptake   in   plant   = STOY × NC 100
Total   N   Uptake   ( TN ) = N   uptake   in   grain   + N   uptake   in   plant
Recovery   efficiency   of   N   ( REN ) = ( UN N UN 0 ) / FN
Agronomic   efficiency   of   N   ( AEN ) = ( GY N GY 0 ) / FN
Partial   Factor   Productivity   of   N   ( PFPN ) = GY N FN
Physiological   efficiency   of   applied   N   ( PEN ) = ( GY N GY 0 ) / ( UN N UN 0 )  
Internal   efficiency   of   N   ( IEN ) = GY N UN N
Utilization   efficiency   of   N   ( UEN ) =   PE N ×   RE N
where,
GY—grain yield (kg ha−1),
STOY—stover yield (kg ha−1),
NC—N content in grain or plant sample (%),
UNN—total N uptake in N applied treatment (kg ha−1),
UN0—total N uptake in treatment without N application (kg ha−1),
GYN—Grain yield in N applied treatment (kg ha−1),
GY0—Grain yield in the N control plot (kg ha−1),
FN—N applied to the test treatment (kg ha−1),
N uptake was expressed in kg ha−1, REN (kg N uptake kg−1 N application), PEN (kg grain kg−1 N uptake), IEN (kg grain kg−1 N uptake) and all other NUEs in kg grain yield kg−1 N.

2.6. Partial Economic Analysis

Partial budgeting of N and control treatments were performed considering cultural and fertilizer related costs for the cultivation of maize in a hectare of land referring to Badu-Apraku et al. [48]. Maize threshing cost using hand sheller was used as suggested by Amare et al. [49]. Grain and stover yields were adjusted by reducing 10% from actual experimental yields to synchronize farmer’s crop management practices [48]. We fixed input and labor cost, grain, and crop residues price by local market survey (Dasharathpur, and Birendranagar, Surkhet). The B:C ratio was calculated using the following formula [22].
B : C   ratio = Total   revenue Total   cos t   of   cultivation

2.7. Data Analysis

Data analysis was performed using Microsoft excel 2016, and ADEL-R (Analysis and Design of Experiments with R for windows) software [50]. Linear model (Equation (13)) was used to generate a one-way analysis of variance (ANOVA) to test the statistical significance of employed treatments on dependent variables (agronomic and yield attributing traits, plant lodging and Sterility, grain yield, and nitrogen use efficiency).
Y ij = µ + T i + β j + E ij
where, Yij is the ith observation in the jth block, µ is the grand mean, Ti is the effect of the treatment i (i = 1, 2…6) such that the average of each treatment level is Ti = µ + Ti, βj is the effect of the block j (j = 1, 2, 3) such that average of each block is Bj = µ + βj, and Eij the residuals; deviation of each observation from their expected values.
Significant differences between treatment means of yield attributing traits, plant lodging, sterility, grain yield, N uptake and NUEs were evaluated through post hoc Fisher least significant difference test (LSD, p ≤ 0.05).

3. Results

3.1. Agronomic and Yield Attributing Traits

Increasing nitrogen doses influenced the majority of agronomic and yield-attributing traits except for the number of ears harvested at maturity (EHARV). N120 produced the tallest plant (PHT) and ear height (EHT) (224 cm and 116 cm, respectively). N dose above 120 kg ha−1 had no significant effect on plant and ear height (Table 2). The total biomass (BY) was maximum (13.9 t ha−1) at 180 kg ha−1, however, found statistically on par with the 120 kg ha−1 N dose. Dry matter partitioning in the grain increased with respective increases in N doses from N0–N240 (Table 2). Similarly, significant differences were observed for the harvest index and recorded the highest (0.46) at 60 kg N ha−1, but at N60–N240, the effect was non-significant. The majority of agronomic and yield-attributing traits were not improved above 120 kg ha−1 and exceptionally at very lower rates in some traits; HGW, BY, and STOY (Table 2).

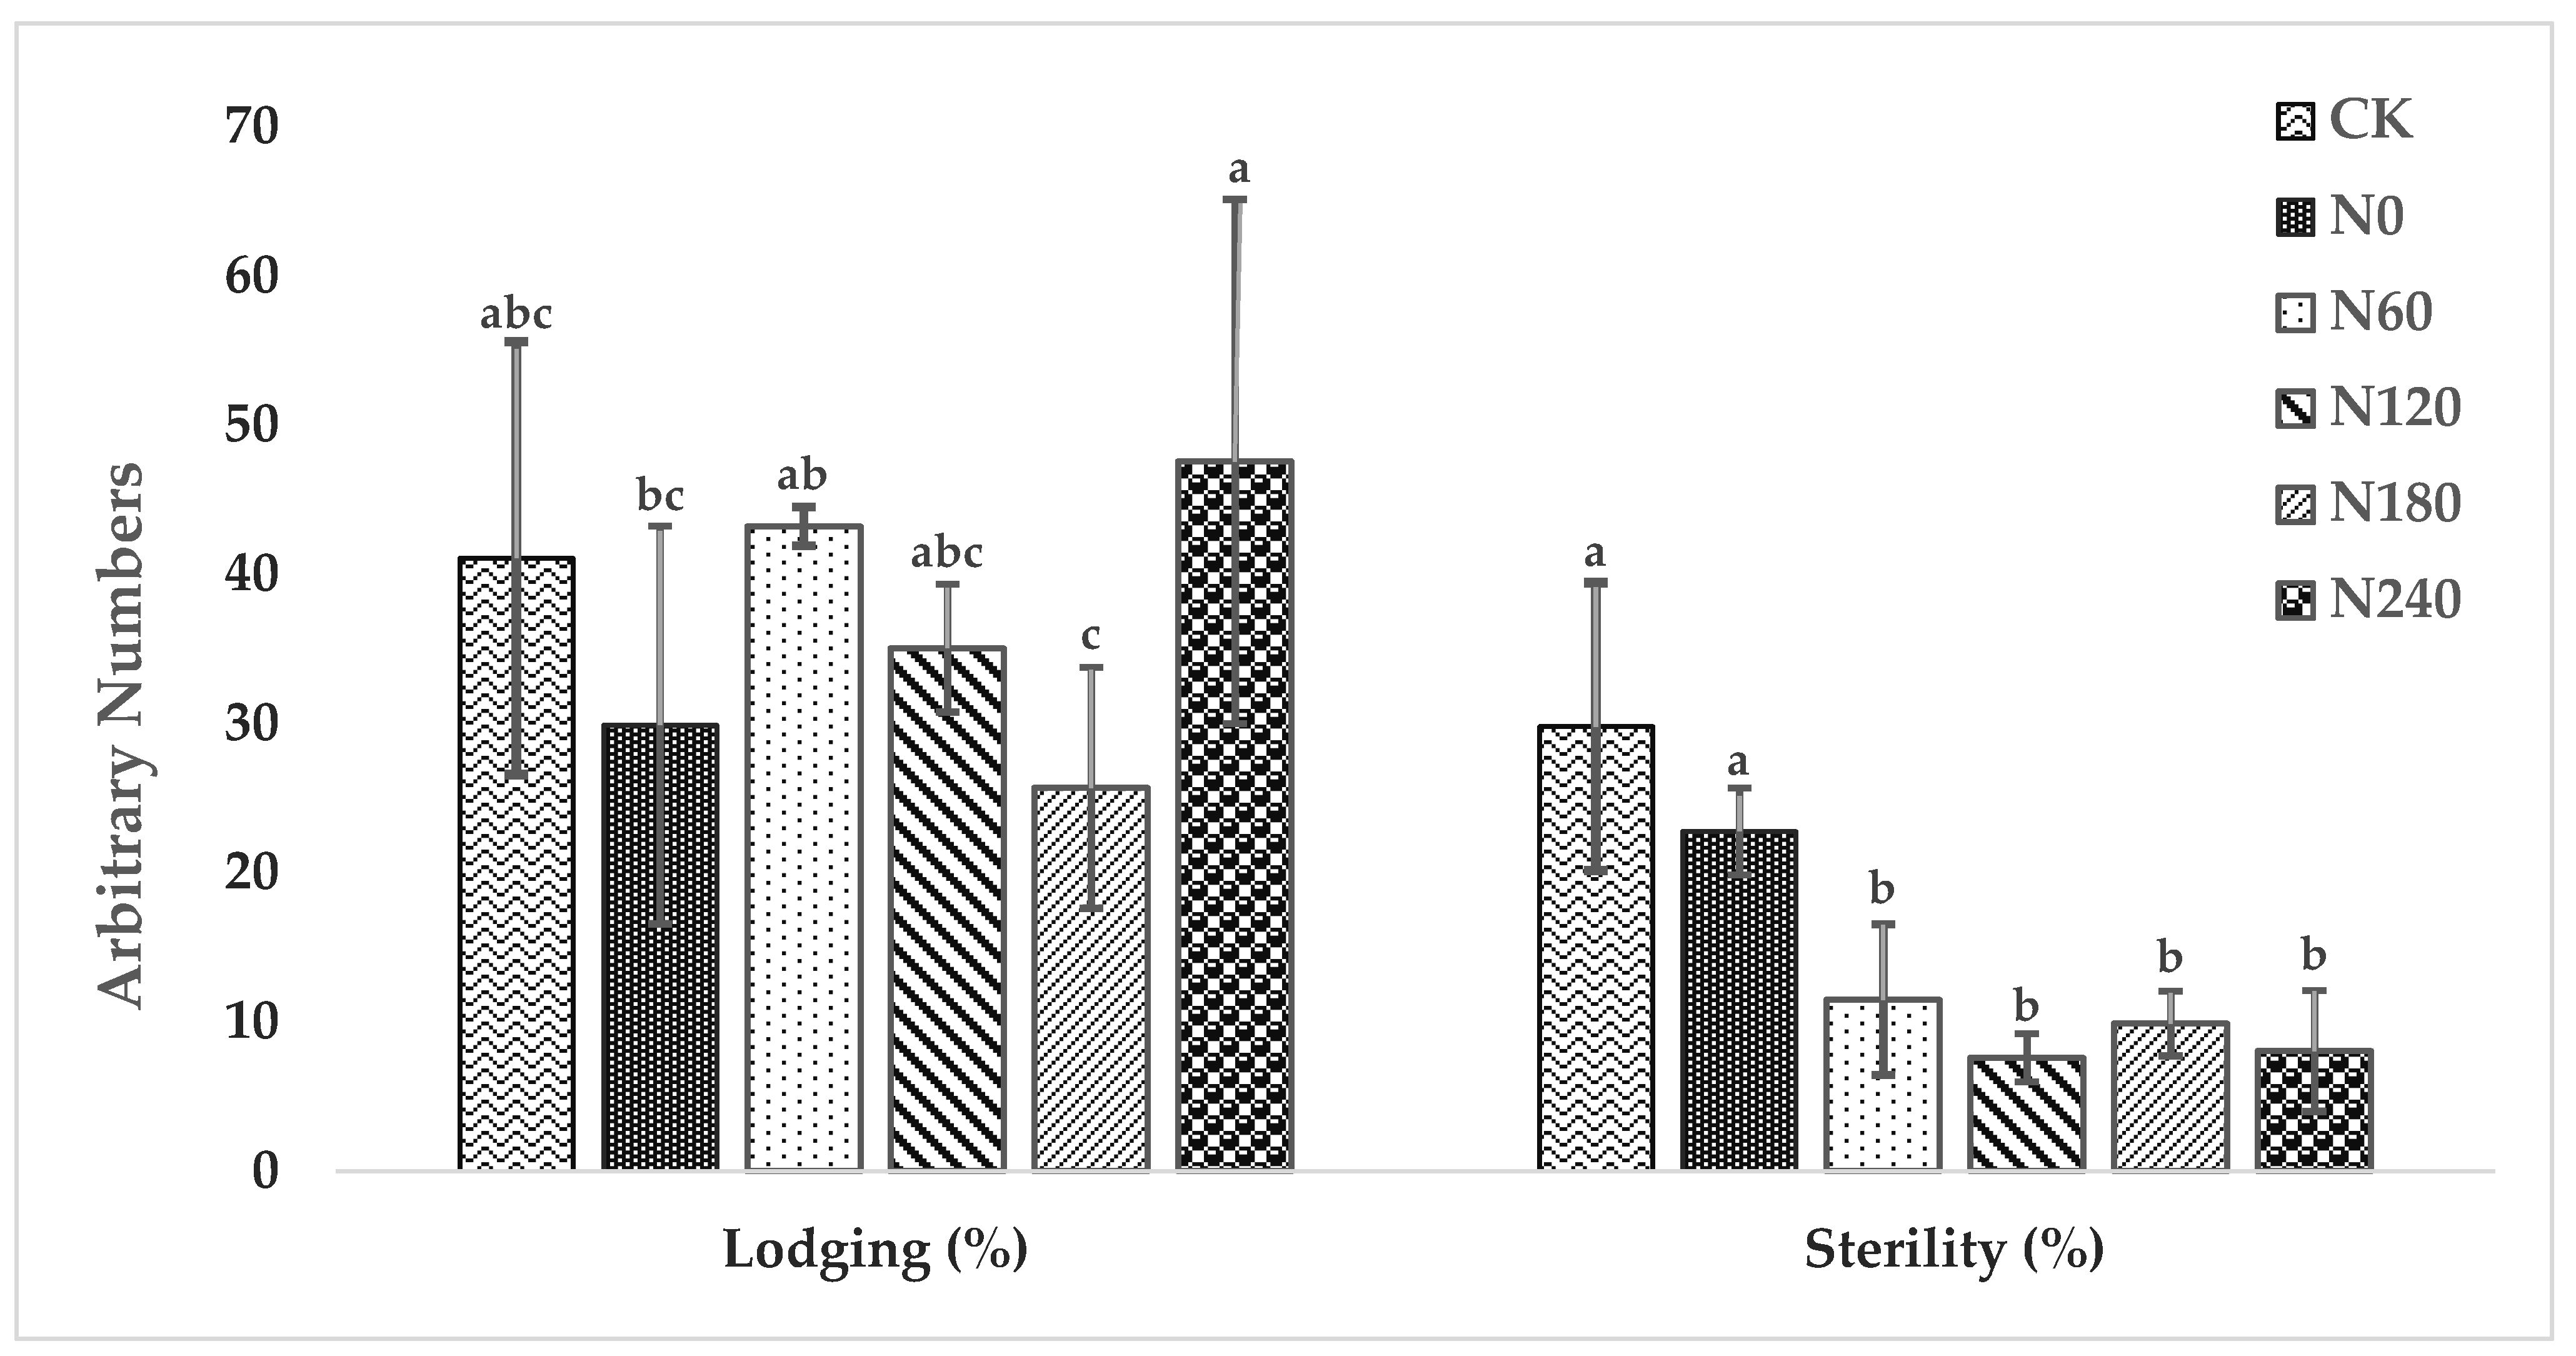
3.2. Plant Lodging and Sterility

Increasing the N dose decreased lodging up to N180, but increased at N240 (47.55%) (Figure 2). Treatment CK (41.08%), despite no fertilizer application, recorded a similar pattern of lodging as in N60 (43.21%). N control (N0) recorded a low lodging rate (29.89%) as similar to N180 (25.68%). The highest Sterility was observed in N stressed plots (low N plots such as CK, N0, N60) and gradually decreased on increasing N doses (Figure 2). N120 produced highly fertile plants (7.59% Sterility), however, Sterility slightly increased above that dose (N180—9.88% Sterility, and N240—8.04% Sterility).

3.3. Leaf Senescence
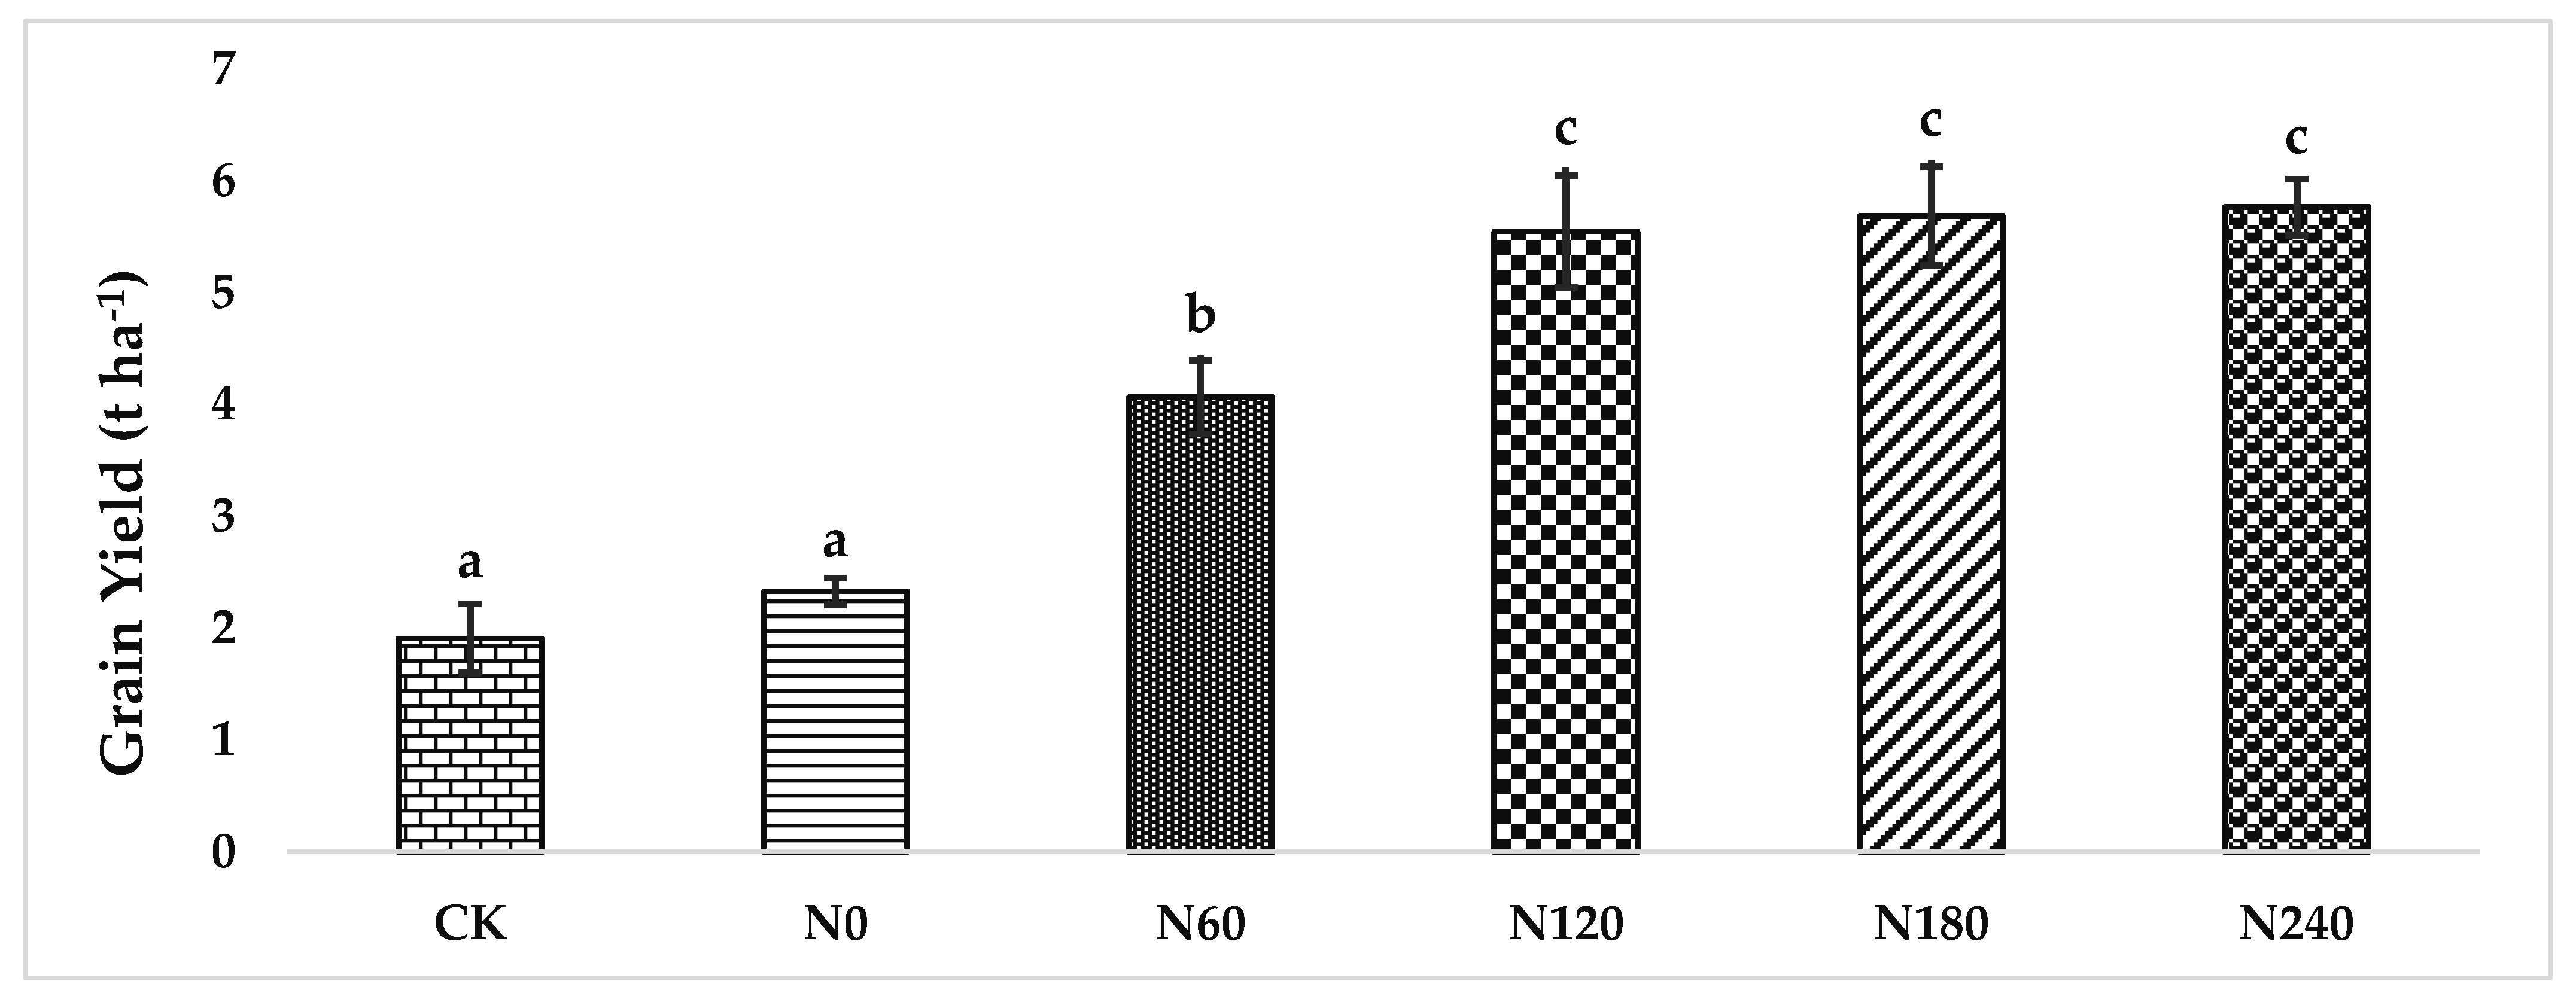
Leaf senescence gradually increased with growth stages from tasseling to maturity in all treatment plots. However, N stressed plots (lower N applied plots) recorded higher scores comparatively even at the time of first scoring (66 DAS) and progressed in a similar fashion following the last scoring time (87 DAS). It was evident that dead leaf tissues were more prominent in low N plots than in higher N plots (Figure 3). At the final scoring (87 DAS), the proportion of dead leaf area in N stressed plots was 47–52%. In contrast, N fertilized plots (at and above N120) recorded comparatively lower dead leaf area (18–27%) (Figure 3).

3.4. Grain Yield

The yield response was positively correlated with applied N doses from N0 to N240. However, after N120 yield increment rate was not significant (Figure 4). The highest gain (1.74 tons) in grain yield was achieved with N60 (N0–N60), and later 1.48 tons while increasing N dose to N120 (N60–N120). Yield advantages of 1.49, 1.44, and 1.39 t ha−1 were observed in N240, N180, and N120 treatments over N0, respectively (Figure 5).

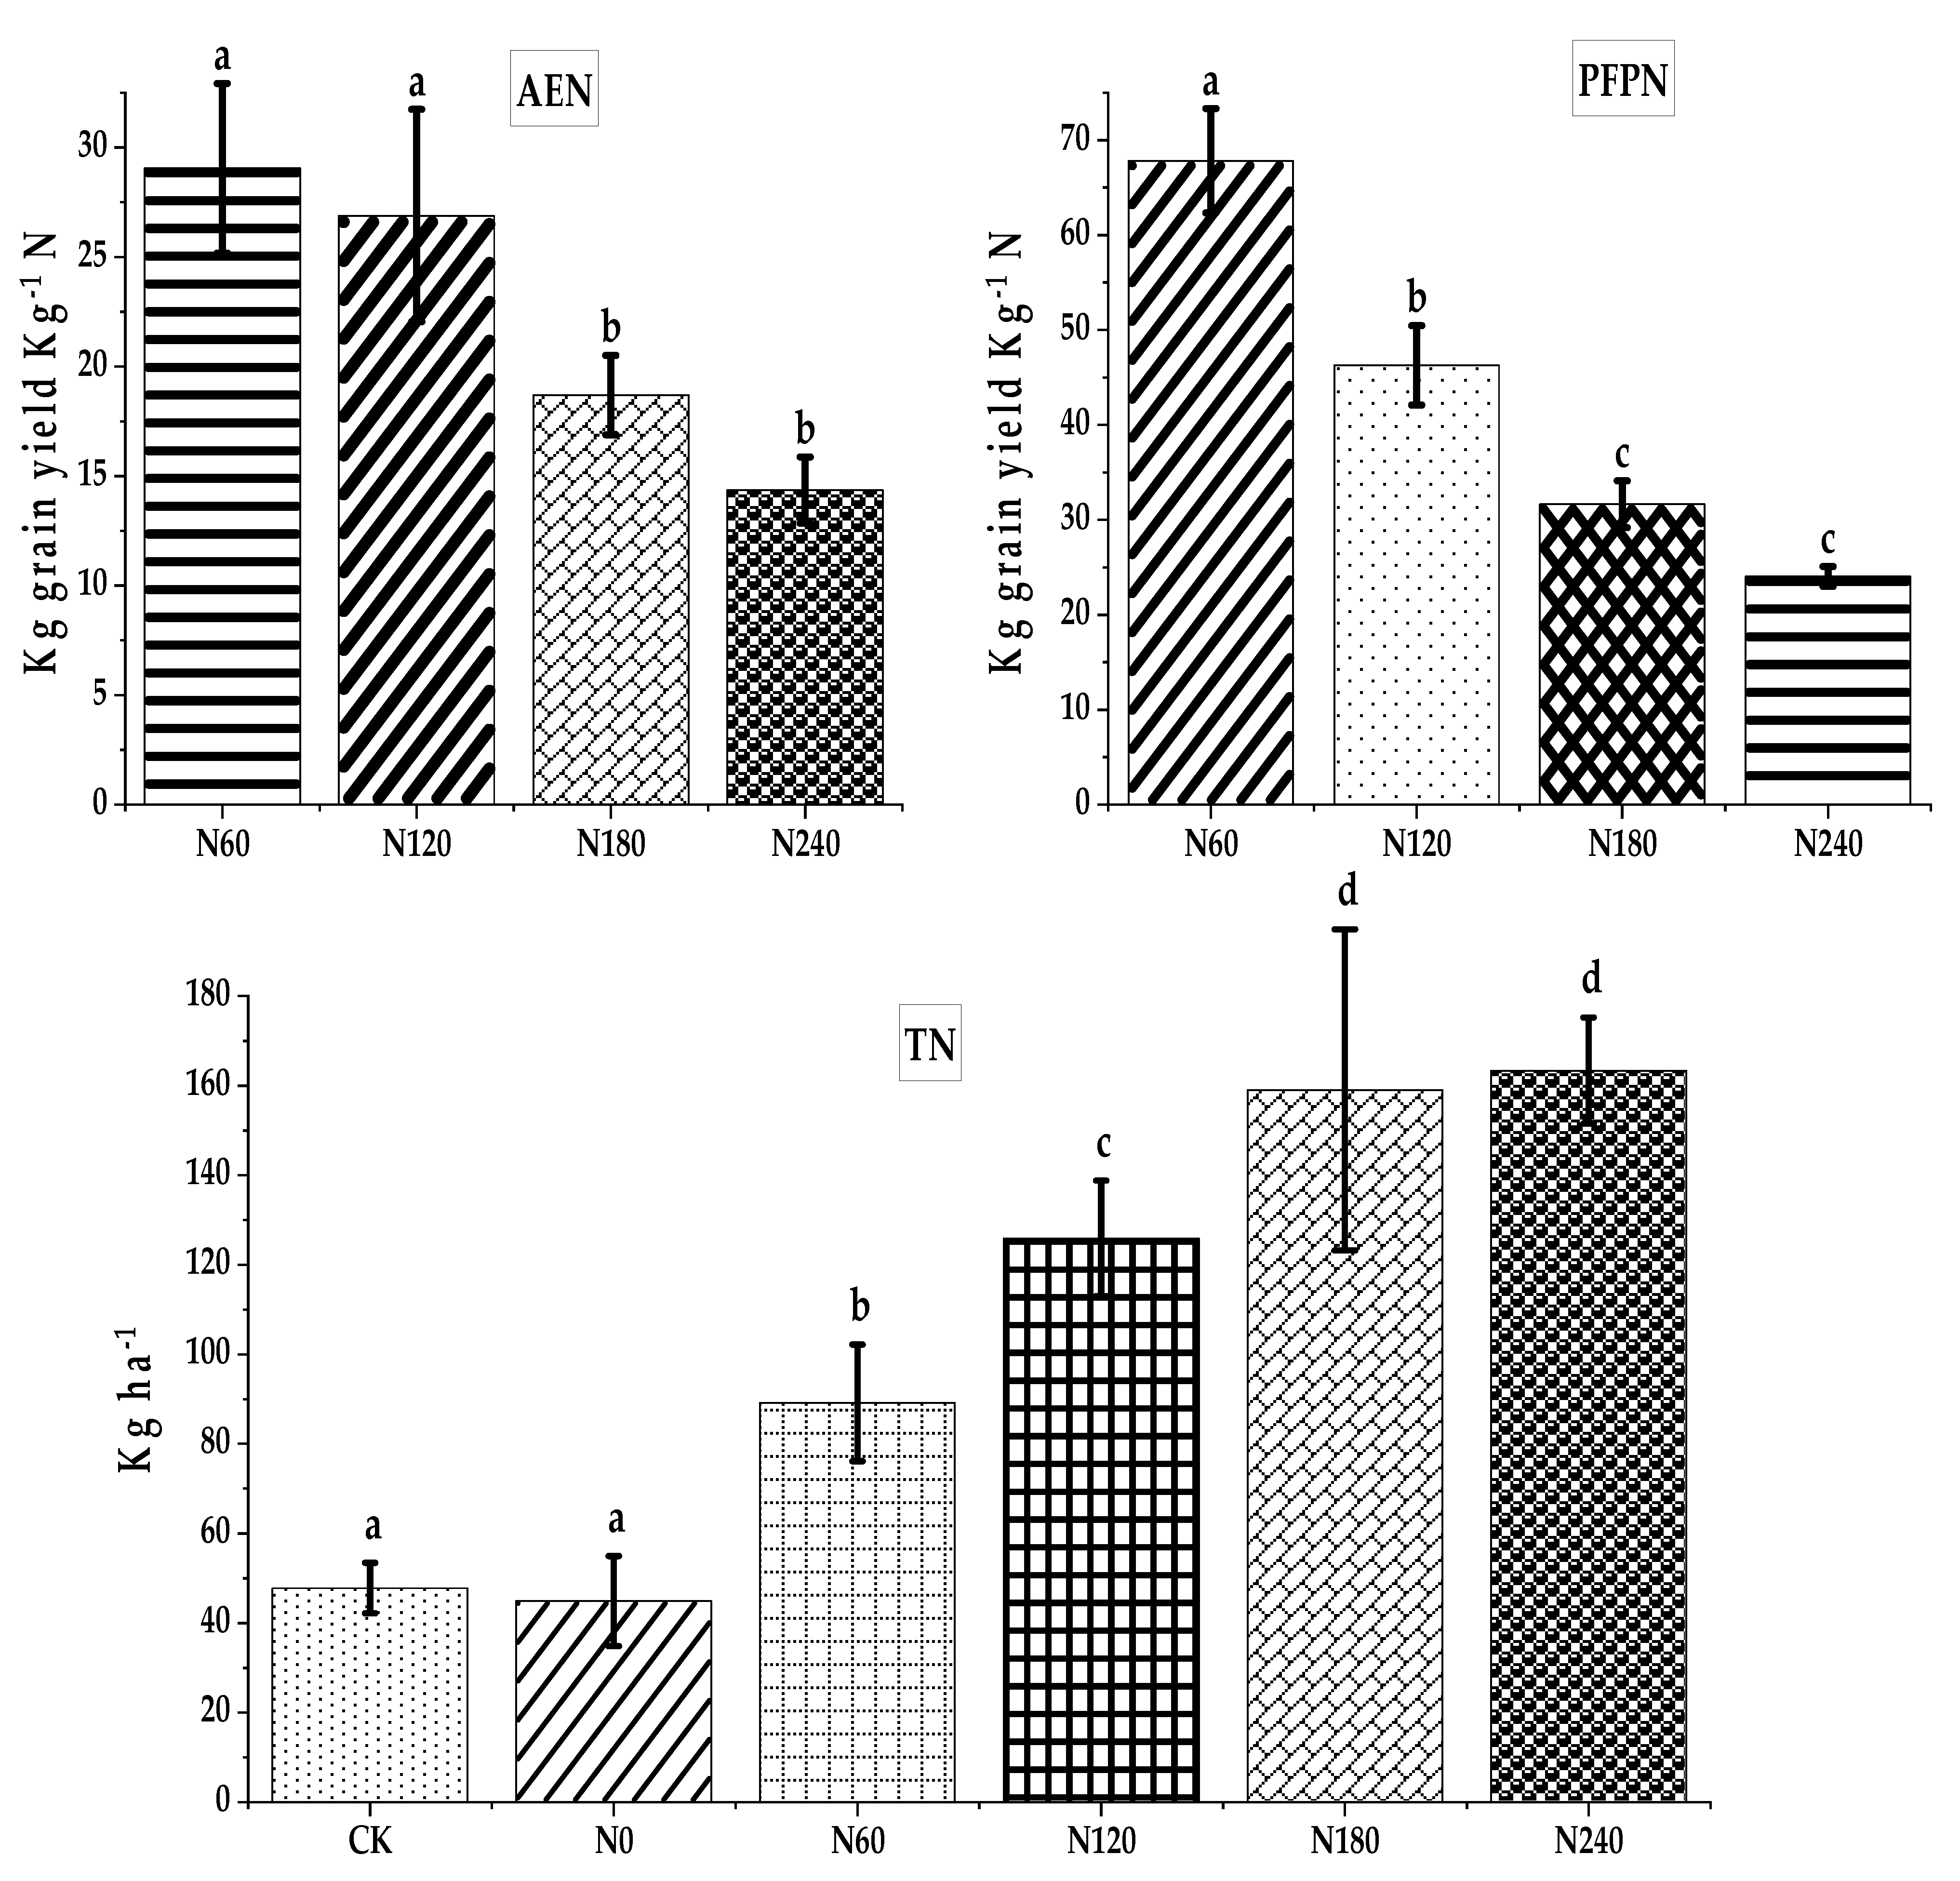
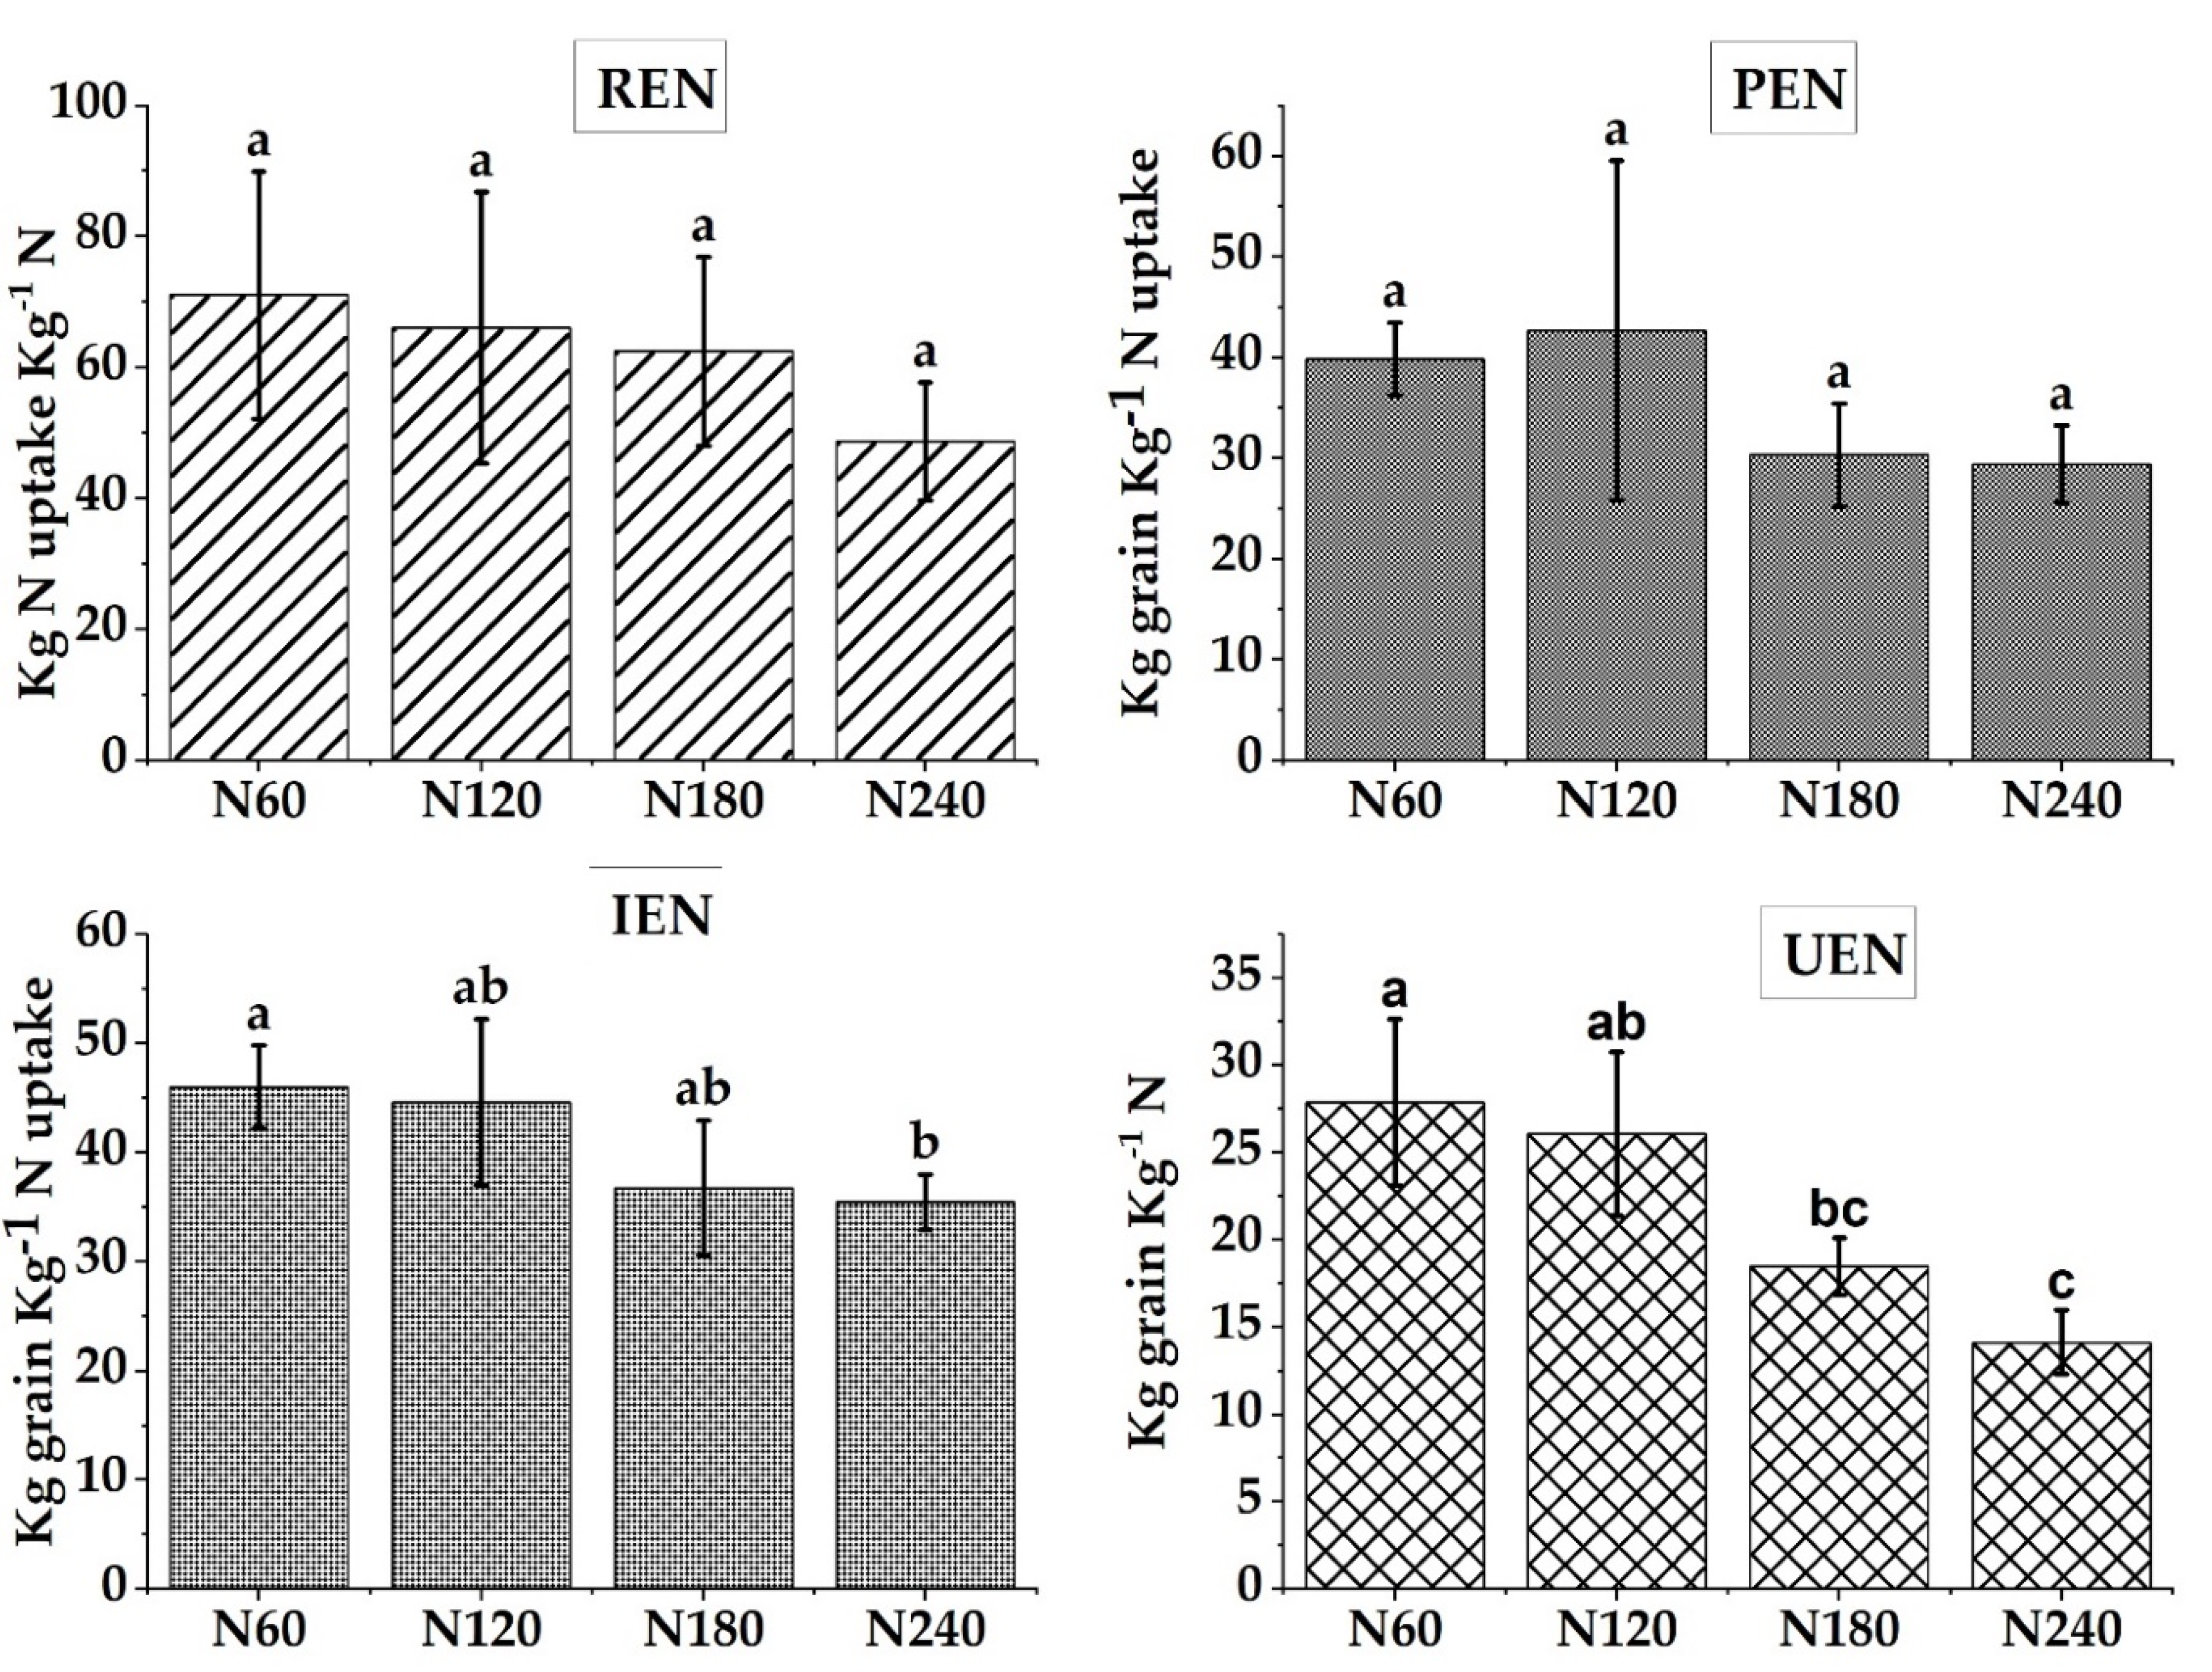
3.5. Nitrogen Uptake and Use Efficiency

Statistically, N uptake above N180 was not significantly different (Figure 6). From the pattern of N uptake in different treatments, it was evident that above N180, applied fertilizer was more lost to the environment than its actual utilization by maize despite the fact that N application synchronized to crop needs (through di-ammonium phosphate-DAP at final land preparation, 50% at V6 and remaining 50% at V12 leaf stage through urea). It can be inferred from the result that the application of N above N180 is physiologically less desirable.
As expected, nitrogen use efficiency (NUE) decreased with increased N levels (Figure 6 and Figure 7). The highest agronomic efficiency of N (AEN) was recorded at N60 (29.05 kg grain kg−1 N), which was on par with N120 (26.89 kg grain kg−1 N). The highest physiological efficiency of N (PEN) was observed at N120 (42.67 kg grain kg−1 N uptake) which was followed by N60 with 39.86 kg grain kg−1 N uptake. For total N uptake and the majority of NUE components, N180 and N240 produced similar AEN, PFPN, PEN, and IEN. Likewise, N60 and N120 had similar effects on AEN, IEN, and UEN (Figure 6 and Figure 7). Overall, nitrogen application at 120 kg ha−1 was found to be optimum and increasing the N dose beyond that had no significant effect on any of the response variables.

3.6. Partial Economic Analysis

Based on partial budgeting, the higher net benefit (USD 500.43) and B:C ratio was observed at N120 (Table 3). 180 kg ha−1 N (N180) is the second-best alternative producing a net benefit of USD 494.97 and a 1.51 benefit–cost ratio. Table 3 depicts the detail of total variable costs, net benefits, and benefit–cost ratios recorded in different N treatments.

4. Discussion

4.1. Effect of Nitrogen in Agronomic and Yield Attributing Traits

Nitrogen doses did not have any effects on the number of ears plant−1 as this is genetically controlled rather than by management factors. In line with our findings, Sharma et al. [51] and Ngosong et al. [52] also reported non-significant effects of N doses (0–240 kg ha−1) on the number of ears plant−1. In our study, N doses above 120 kg ha−1 did not show any effects on most agronomic traits. An increment in stover yield, biomass, plant, and ear height while increasing the N dose from N0–N120 might have been attributed to increased photosynthesis, stem elongation, and overall vegetative growth [13,29]. An increase in hundred-grain weight (HGW) in response to the corresponding increase in N dose was because of continuous dry matter deposition into the grain for a longer duration.
Lower Leaf senescence with increasing N doses could be due to prolonged green color photosynthetic tissues (Figure 3). Shi et al. [53] reported that plant and ear height were similar when an N dose of 120 kg ha−1 or above was applied. Ding et al. [54] found that dry matter production in N deficient plants was significantly lower than that of N supplied plants, particularly after flowering. Cheetham et al. [55] reported maximum dry matter deposition in grain (as 200 grain-weight) when N was applied at 125 kg ha−1.
Adhikari et al. [56] reported improved yield attributing traits of maize in response to an increase in N dose and found some improved varieties of maize (Manakamana-4, Rampur composite) performing well at 180:90:60 kg ha−1 NPK doses. Likewise, the highest biomass yield of maize at 115 kg ha−1 N was also reported from the evaluation of 0–115 kg ha−1 N doses [57]. In addition, researchers reported reduced plant height, leaf area, chlorophyll content, stay green, total dry matter, and thousand-grain weight under N deprived conditions while evaluating open-pollinated and hybrid maize varieties at 0–180 kg ha−1 N [58]. These studies sufficiently corroborate the findings of our experiment.

4.2. Plant Lodging and Sterility

Nitrogen application increases plant height and biomass production, but plants become susceptible when N applied at higher doses [19]. In addition to a higher dose of N, late-season rainfall (105 days after sowing) in combination with stormy winds might have accelerated heavy lodging in our experiment (Figure 1). A reduced supply of N results in reduced pollen shedding, poor fertilization rate, and grain filling thereby increasing more Sterility in plants [13,14,15,16]. Andrade et al. [15] pointed out that the physiological condition of maize close to the silking stage is critical to determine fertility in the cob at the final stage. Thus, in our experiment, the reason for the high Sterility recorded in N stressed plots was due to a poor supply of N at vegetative to later (silking and further) stages. The low supply of N was evident as higher leaf senescence scores were recorded from such plots (Figure 3). A decrease in plant lodging from an increasing N dose might be due to an increase in the activity of the key enzymes regulating the lignin biosynthesis, lignin content, and stalk diameter [53,59]. Moreover, the thickness of the rind number and thickness of the vascular bundle is negatively correlated to stalk lodging [53]. As in our study, significant low stalk lodging was reported in maize at 120 kg ha−1 N and a similar plant density [53]. Additionally, they reported, N application increased stem characteristics such as rind thickness, number, and thickness of vascular bundle and found a similar effect at 120 kg ha−1 N and 180 kg ha−1 N.

4.3. Leaf Senescence

Leaf senescence has a close relationship with the amount of N supply to plants throughout the crop cycle [46]. N uptake is maximum at mid-vegetative growth. Following anthesis, poor N supply from soil results in accelerated N remobilization to grains as the development of grains requires more N than maintaining vegetative tissues. Continued deficiency results in early senescence of older leaves as N is mobile in the plant system [16,17,18,60,61]. The longer the leaves stay green, chlorophyll in the leaf is maintained for a longer duration due to less N remobilization from vegetative tissues, thus increases more dry matter partitioning and can increase grain yield by 1012% [62,63]. Our findings corroborate with the results of Ding et al. [54], who reported accelerated leaf senescence in maize after anthesis in N deficient plots due to decreased chlorophyll and soluble protein contents. Similarly, reports on N deprivation at early vegetative growth resulting in a large percentage of senescent leaf area was also disseminated [64]. From the multi-season experiment, the lowest percentage of leaf senescence was reported at 120 kg ha−1 N dose while evaluating several varieties at 0 to 120 kg ha−1 N doses [65]. Likewise, Paponov and Engels [61] also reported a reduction in chlorophyll content and green leaf area due to low N supply in maize.

4.4. Grain Yield

Grain yield is a consequence of the overall genetic potential of the variety and its growing environment. We observed that N deficiency (in lower doses CK, N0, and N60) resulted in overall inferior agronomic and yield-attributing traits, a higher percentage of dead leaf tissues, lodging due to poor stalk strength, higher plant Sterility, and poor cob characteristics (Table 2, Figure 2, Figure 3 and Figure 8). Due to these reasons, N stressed treatments might have underperformed in comparison to their genetic potential. N stressed plants show stunted growth, yellowing of leaves, decreased green leaf tissues and photosynthesis rate, less biomass and dry matter deposition in grain, and higher sterility [13,14,15,16,25,64]. Several researchers reported increased grain yield in response to an increased application of N [51,56,65,66,67] up to 180 kg ha−1 N, a further increase in the N level resulted in a decreased grain yield [51,55,68]. From different studies at the national and international level, a grain yield of 3.91–6.06 t ha−1 was reported at 120 kg ha−1 N application in maize during different seasons [29,56,65,68]. Thus, application of N fertilizer at 120 kg ha−1 was found optimum for the Manakamana-3 variety of maize compared with maize yield potentials reported by different studies.
Particularly in N omission plot (N0), there was little effect of P2O5 and K2O on increasing grain yield (yielded similar to control-CK). Higher soil P2O5 content (96.12 mg kg−1) in combination with external application might have affected in soil N availability as demonstrated by Liu et al. [69]. From long term studies, it was also disseminated that, soil application of Olsen-P above critical level (10.9–21.4 mg Kg−1), is less effective on increasing crop yield [70]. Potassium content in the experimental soil was medium (125.80 mg kg−1) and within the critical range—109–340 mg kg−1 [71], however it effects well to grain yield when integrated with nitrogenous fertilizers [72]. In Nepal, Zinc deficiency is widespread in agricultural soils, and more prominent in terai region where rice based cropping system is dominant [42]. In our study, we could not quantify the contribution of micronutrients in the grain yield of maize. However, previous study in the same location disseminated that Zinc application in maize measured up almost 3% in grain yield when applied at 20 kg ha−1 dose [22]. In addition, several studies reported, application of micronutrients in combination to macronutrients, increased yield and grain quality in maize [73,74,75]. Thus, studies on effect of Zinc and other micronutrients in maize, should be extensively done in Nepal to quantify the actual impact.

4.5. Nitrogen Uptake and Use Efficiency

Our study suggests that N60 is not sufficient to supply the overall N need of the crop. Total uptake of N (48.60% more) at this dose indicates additional N uptake from soil indigenous supply in spite of external N application. Synchronizing crop needs, N supply from the soil system is necessary to fulfill crop needs but not above the genetic and physiological potential. Any supply above the physiological needs only increases the total cost of production, not the grain yield. In our experiment, N uptake was exponential up to N180, and above that, N uptake increased at a decreasing rate. The reduction in N uptake at higher N doses might have been attributed to increments in N loss to the environment. Additionally, this might possibly be due to the less physiological needs of the crop. An increase in N uptake, as in our findings, in response to increased N doses, were reported by several studies in maize [58,76,77,78].
Nitrogen uptake by maize from the soil, and later its assimilation and remobilization into the grain, determines the overall efficiency of applied fertilizer. Hence, uptake efficiency and utilization efficiency are two important components and increasing uptake and utilization efficiency increases the overall NUE in crops [10,25,26]. Higher values of all NUE components in lower doses of N in our study was the result of higher utilization of N uptake in developing grains and lower N loss to the environment due to the synchronization of N application time and crop needs. According to several reports, synchronizing N supply with crop demand throughout the crop period is a great strategy of reducing N loss and increasing NUE [16,79,80]. A higher dose of N application results in low NUE due to elevated N loss from ammonia volatilization, denitrification, surface runoff, and leaching [10,81]. Beatty and Wong [26] also disseminated that reducing nutrient loss could simultaneously increase nutrient efficiency through the application of optimum dose; the minimum dose that produces maximum biomass and grain yield. In accord with our findings, several previous studies reported higher NUEs at lower N levels while evaluating improved and hybrids varieties of maize at 0–280 kg ha−1 N doses [52,58,76,77,78,80,82,83,84]. The range of yield increment kg−1 N application was 22.01–38.16 kg at N doses of 45–150 kg ha−1 [76,80,82,84]. Results from our study are in close agreement with these studies.

4.6. Economic Return

Economic return from cropping is largely dependent on the efficiency of applied inputs including fertilizers. Inefficient application of these inputs directly increases the cost of production, leading to low economic gain from farming. Among the key factors, manure and fertilizer boast the highest share [85,86], resulting in great economic loss in the case of inefficient applications. Nepalese households rarely practice balanced fertilization to synchronize crop needs. Thus, incurring an extra 63% maize production cost, on average, compared to the firms with good agricultural practices having the same output and production technology [85]. Thus, we also performed an economic analysis in our experiment. Among the different doses, 120 kg ha−1 N was found efficient with the highest net income (USD 500.43) in comparison to other N doses. The efficiency might have been attributed to more utilization and less loss of nutrients to the soil and the environment. Few studies, from similar soil and weather conditions, have reported a net benefit of USD 881.2 from the application of recommended N dose (120 kg ha−1) in hybrid maize. The study also disseminated that deep placement (4–6 cm away from the plant and 5–7 cm below the soil surface) of urea in briquette form (a compressed form of prilled urea with larger granule size) could increase productivity and the economic return of maize [22]. Our preliminary study found that increasing the N dose above the recommended dose (120 kg ha−1) did not increase productivity and profitability, but using innovative fertilizers and application technologies might be the next alternatives. Innovative fertilizers and application technologies are emerging concepts for reducing nutrient loss to the environment and increasing NUE. The Nepal seed and fertilizer project introduced polymer-coated urea, blended fertilizers, and briquette urea in Nepal and tested their effectiveness in increasing fertilizer efficiency. The researchers reported a 25–40% reduction in N input by using polymer-coated urea and deep placement of briquette urea in maize. In addition, they reported an increase in agronomic efficiency of N from 17 kg grain per kg N to 24–28 kg of grain per kg N by using these innovative fertilizers and application technologies in maize [22,87].

5. Conclusions

Our preliminary results suggest that there would be no further improvement in the majority of agronomic and yield-attributing traits by increasing the N dose from the existing recommended dose (i.e.; 120 kg N ha−1). Similarly, fertilizer use and economic efficiencies were also highest at the recommended dose. The results indicate that the current fertilizer dose is still effective and maize productivity could be increased with balanced fertilization synchronizing crop needs, which Nepalese farms are lacking [88,89,90]. However, further studies are needed to conduct across different agro-ecological zones, cropping systems and management practice to confirm this result.

Author Contributions

Conceptualization, Y.K.G.; B.R.B. and S.P.V.; methodology, B.R.B. and K.D.; software, K.D.; validation, Y.K.G.; S.P.V.; N.R.P. and B.R.B.; formal analysis, K.D.; investigation, K.D.; resources, B.R.B.; K.D. and K.R.P.; data curation, K.D. and N.R.P.; writing—original draft preparation, K.D.; writing—review and editing, N.R.P.; B.R.B.; Y.K.G.; S.P.V. and K.R.P.; visualization, K.D.; supervision, B.R.B. and K.R.P.; project administration, B.R.B.; K.D. and K.R.P.; funding acquisition, B.R.B. and K.D. All authors have read and agreed to the published version of the manuscript.

Funding

This research was funded by United States Agency for International Development through the project Feed the Future Nepal Seed and Fertilizer [cooperative Agreement number AID-367-IO-16-00001].

Institutional Review Board Statement

Not applicable.

Informed Consent Statement

Not applicable.

Data Availability Statement

The data presented in this study are available on request from the corresponding author.

Acknowledgments

We acknowledge Anirudra Sharma from the Office of Hydrology and Meteorology, Kohalpur, Banke for providing weather data. We are thankful to Dinesh Panday, (post-doctoral researcher in soil N management) for providing valuable review comments to improve the manuscript quality. We are grateful to Dinesh Khadka for helping with soil sample analysis.

Conflicts of Interest

The authors declare no conflict of interest. The funders had no role in the design of the study; in the collection, analyses, or interpretation of data; in the writing of the manuscript, or in the decision to publish the results.

References

  1. FAOSTAT. Area, Production and Productivity of Maize in World and South Asian Countries. 2020. Available online: http://www.fao.org/faostat/en/#data/QC (accessed on 10 April 2021).
  2. AITC. Agriculture and Livestock Diary (Nepali); Government of Nepal, Ministry of Agriculture and Livestock Development, Agriculture Information and Training Center: Lalitpur, Nepal, 2020. Available online: https://aitc.gov.np/english/downloadsdetail/2/2019/19794382/ (accessed on 10 April 2021).
  3. Koirala, K.B.; Gurung, D.; Rijal, T.; Bhandari, G.; Sah, Y.; Shrestha, J.; Chhetri, J. Hybrid Maize Research and Development in Nepal. In Proceedings of the 27th National Summer Crops Workshop, Rampur, Chitawan, Nepal, 18–20 April 2013; Volume 2, pp. 133–154. [Google Scholar]
  4. Tripathi, M.P.; Koirala, K.B.; Gautam, D.; Subedi, S.; Upadhyay, J.; Shrestha, H.K. Field Performance of Three-way Cross Yellow and White Maize Hybrids in Nepal. Asian J. Adv. Agric. Res. 2021, 15, 24–33. [Google Scholar] [CrossRef]
  5. Osti, N.P. Animal Feed Resources and their Management in Nepal. Acta Sci. Agric. 2020, 4, 2–14. [Google Scholar] [CrossRef]
  6. TEPC. Export Import Data Bank; Trade and Export Promotion Center, Ministry of Industry, Commerce and Supplies, Government of Nepal: Lalitpur, Nepal, 2019. Available online: https://www.tepc.gov.np/ (accessed on 10 April 2021).
  7. Paudyal, K.R.; Ransom, J.K.; Rajbhandari, N.P.; Adhikari, K.; Gerpacio, R.V.; Pingali, P.L. Maize in Nepal: Production Systems, Constraints, and Priorities for Research; NARC and CIMMYT: Kathmandu, Nepal, 2001. [Google Scholar]
  8. Govind, K.C.; Karki, T.B.; Shrestha, J.; Achhami, B.B. Status and prospects of maize research in Nepal. J. Maize Res. Dev. 2015, 1, 1–9. [Google Scholar] [CrossRef]
  9. Devkota, K.P.; McDonald, A.J.; Khadka, L.; Khadka, A.; Paudel, G.; Devkota, M. Fertilizers, hybrids, and the sustainable intensification of maize systems in the rainfed mid-hills of Nepal. Eur. J. Agron. 2016, 80, 154–167. [Google Scholar] [CrossRef]
  10. Noor, M.A.; Tejada Moral, M. Nitrogen management and regulation for optimum NUE in maize—A mini review. Cogent Food Agric. 2017, 3, 1348214. [Google Scholar] [CrossRef]
  11. Blumenthal, J.D.M.; Baltensperger, D.D.; Cassman, K.G.; Mason, S.C.; Pavlista, A.D. Importance and Effect of Nitrogen on Crop Quality and Health. In Nitrogen in the Environment; Academic Press: Cambridge, MA, USA, 2008; pp. 51–70. [Google Scholar] [CrossRef] [Green Version]
  12. Wiederholt, R.; Johnson, B. Nitrogen Behavior in the Environment. North Dakota State University, Extension Service. 2005. Available online: https://www.ag.ndsu.edu/publications/environment-natural-resources/nitrogen-behavior-in-the-environment (accessed on 10 May 2021).
  13. English, E.; Ketterings, Q.; Czymmek, K.; Gabriel, A.; Flis, F.; Lawrence, J. Nitrogen Uptake by Corn. Agronomy Fact Sheet Series. 2017. Available online: https://extension.psu.edu/nitrogen-fertilization-of-corn (accessed on 15 July 2021).
  14. Pearson, C.J.; Jacobs, B.C. Yield components and nitrogen partitioning of maize in response to nitrogen before and after anthesis. Aust. J. Agric. Res. 1987, 38, 1001–1009. [Google Scholar] [CrossRef]
  15. Andrade, F.H.; Echarte, L.; Rizzalli, R.; Della Maggiora, A.; Casanovas, M. Kernel number prediction in maize under nitrogen or water stress. Crop. Sci. 2002, 42, 1173–1179. [Google Scholar] [CrossRef] [Green Version]
  16. Aziiba, E.A.; Qiang, C.; Coulter, J.A. Mechanisms of nitrogen use in maize. Agronomy 2019, 9, 775. [Google Scholar] [CrossRef] [Green Version]
  17. Sawyer, J. Nutrient Deficiencies and Application Injuries in Field Crops; University Extension; IOWA State University: Ames, IA, USA, 2004; Available online: https://crops.extension.iastate.edu/files/article/nutrientdeficiency.pdf (accessed on 14 May 2021).
  18. Sattelmacher, B.; Horst, W.J.; Becker, H.C. Factors that contribute to genetic variation for nutrient efficiency of crop plants. Z. Pflanz. Bodenkd. 1994, 157, 215–224. [Google Scholar] [CrossRef]
  19. Nielsen, B.; Colville, D. Stalk Lodging in Corn: Guidelines for Preventive Management. Agronomy Guide: Purdue University Cooperative Extension Service. Available online: https://www.extension.purdue.edu/extmedia/AY/AY-262.html (accessed on 14 May 2021).
  20. FAO. World Fertilizer Outlook and Trends to 2022. 2019. Available online: http://www.fao.org/publications/card/en/c/CA6746EN/ (accessed on 14 May 2021).
  21. MoALD. Statistical Information on Nepalese Agriculture 2075/76 (2018/19); Government of Nepal, Ministry of Agriculture & Livestock Development, Planning & Development, Cooperation, Coordination Division, Statistics and Analysis Section, Singha Durbar: Kathmandu, Nepal, 2020. Available online: http://doanepal.gov.np/downloadfile/Statistical%20information%20on%20Nepalese%20agriculture_1601976502.pdf (accessed on 11 April 2021).
  22. Dhakal, K.; Baral, B.R.; Pokhrel, K.R.; Pandit, N.R.; Thapa, S.B.; Gaihre, Y.K.; Vista, S.P. Deep placement of briquette urea increases agronomic and economic efficiency of maize in sandy loam soil. Agrivita 2020, 42, 499–508. [Google Scholar] [CrossRef]
  23. Conijn, J.G.; Bindraban, P.S.; Schröder, J.J.; Jongschaap, R.E.E. Can our global food system meet food demand within planetary boundaries? Agric. Ecosyst. Environ. 2018, 251, 244–256. [Google Scholar] [CrossRef]
  24. Fugice, J.; Dimkpa, C.; Johnson, L. Slow and Steady: The Effects of Different Coatings on Nitrogen Release in Soil; International Fertilizer Development Corporation (IFDC): Muscle Shoals, AL, USA, 2018; Available online: https://ifdc.org/wp-content/uploads/2018/10/Fertilizer-Focus-Slow-and-Steady-Sept-Oct-2018.pdf (accessed on 3 May 2021).
  25. Bhattacharya, A. Nitrogen-Use Efficiency under Changing Climatic Conditions. Chang. Clim. Resour. Use Effic. Plants 2019, 181–240. [Google Scholar] [CrossRef]
  26. Beatty, P.H.; Wong, J.L. Nitrogen Use Efficiency. In Encyclopedia of Applied Plant Sciences, 2nd ed.; Elsevier: Amsterdam, The Netherlands, 2016; Volume 1. [Google Scholar] [CrossRef]
  27. Lungu, O.I.; Dynoodt, R.F. Acidification from Long-Term Use of Urea and Its Effect on Selected Soil Properties. Afr. J. Food Agric. Nutr. Dev. 2008, 8, 63–76. [Google Scholar] [CrossRef] [Green Version]
  28. ABPSD. Statistical Information on Nepalese Agriculture 2014/15; Agri-Business Promotion and Statistical Division, Ministry for Agriculture and Cooperatives, Singhadarbar: Kathmandu, Nepal, 2014; Available online: https://nepalindata.com/resource/statistical-information-nepalese-agriculture-201415-2071072/ (accessed on 13 May 2021).
  29. Adhikari, P.; Baral, B.R.; Shrestha, J. Maize response to time of nitrogen application and planting seasons. J. Maize Res. Dev. 2016, 2, 83–93. [Google Scholar] [CrossRef] [Green Version]
  30. Adhikari, S.P.; Timsina, K.P.; Brown, P.R.; Ghimire, Y.N.; Lamichhane, J. Technical efficiency of hybrid maize production in eastern terai of Nepal: A stochastic frontier approach. J. Agric. Nat. Resour. 2018, 1, 189–196. [Google Scholar] [CrossRef] [Green Version]
  31. Pandey, S.; Bhatta, N.P.; Paudel, P.; Pariyar, R.; Maskey, K.H.; Khadka, J.; Thapa, T.B.; Rijal, B.; Panday, D. Improving fertilizer recommendations for Nepalese farmers with the help of soil-testing mobile van. J. Crop. Improv. 2018, 32, 19–32. [Google Scholar] [CrossRef] [Green Version]
  32. Fernandez, F.G.; Kaiser, D.E. Understanding Nitrogen in Soils; University of Minnesota Extension: St Paul, MN, USA, 2018; Available online: http://extension.umn.edu/nitrogen/understanding-nitrogen-soils (accessed on 15 August 2021).
  33. Dhakal, K.; Ghimire, S.K.; Kharel, R.; Yadaw, R.B.; Pokhrel, K.R.; Prem, B.M. Green super rice genotypes exhibited superior morphological traits and higher yield advantage over check under rainfed lowland condition. Russ. J. Agric. Sociol. Econ. Sci. 2020, 101, 3–12. [Google Scholar] [CrossRef]
  34. Karki, R.; Talchabhadel, R.; Aalto, J.; Baidya, S.K. New climatic classification of Nepal. Theor. Appl. Climatol. 2016, 125, 799–808. [Google Scholar] [CrossRef]
  35. SQCC. Notified and Denotified Varieties of Different Crops Till 13 September 2019; Government of Nepal, Ministry of Agriculture and Livestock Development, Seed Quality Control Centre, Hariharbhawan: Lalitpur, Nepal, 2019. Available online: http://sqcc.gov.np/images/category/Notified_and_Denotified_Varieties_till_2076_04_07.pdf (accessed on 15 April 2021).
  36. Bouyoucos, G.J. Hydrometer Method Improved for Making Particle Size Analyses of Soils1. Agron. J. 1962, 54, 464–465. [Google Scholar] [CrossRef]
  37. Jackson, M.L. Soil Chemical Analysis; Prentice Hall of India Pvt. Ltd.: New Delhi, India, 1973. [Google Scholar]
  38. Walkley, A.J.; Black, I.A. Estimation of soil organic carbon by the chromic acid titration method. Soil Sci. 1934, 37, 29–38. [Google Scholar] [CrossRef]
  39. Bremner, J.M.; Mulvaney, C.S. Nitrogen-Total. In Methods of Soil Analysis. Part 2. Chemical and Microbiological Properties; Page, A.L., Miller, R.H., Keeney, D.R., Eds.; American Society of Agronomy; Soil Science Society of America: Madison, WI, USA, 1982; pp. 595–624. [Google Scholar]
  40. Olsen, S.R.; Cole, C.V.; Watanabe, F.S.; Dean, L.A. Estimation of Available Phosphorus in Soils by Extraction with Sodium Bicarbonate; United States Department of Agriculture Circular 19; United States Department of Agriculture: Washington, DC, USA, 1954; p. 939. [Google Scholar]
  41. Jackson, M.L. Soil Chemical Analysis; Prentice Hall of India Pvt. Ltd.: New Delhi, India, 1967. [Google Scholar]
  42. Andersen, P. A review of micronutrient problems in the cultivated soil of Nepal: An issue with implications for agriculture and human health. Mt. Res. Dev. 2007, 27, 331–335. [Google Scholar] [CrossRef] [Green Version]
  43. Panday, D.; Ojha, R.B.; Chalise, D.; Das, S.; Twanabasu, B. Spatial variability of soil properties under different land use in the Dang district of Nepal. Cogent Food Agric. 2019, 5, 1600460. [Google Scholar] [CrossRef]
  44. Shrestha, S.; Becker, M.; Lamers, J.P.A.; Wimmer, M.A. Diagnosis of zinc and boron availability in emerging vegetable-based crop rotations in Nepal. J. Plant Nutr. Soil Sci. 2020, 183, 429–438. [Google Scholar] [CrossRef]
  45. Baral, B.R.; Pande, K.R.; Gaihre, Y.K.; Baral, K.R.; Sah, S.K.; Thapa, Y.B.; Singh, U. Increasing nitrogen use efficiency in rice through fertilizer application method under rainfed drought conditions in Nepal. Nutr. Cycl. Agroecosyst. 2020, 118, 103–114. [Google Scholar] [CrossRef]
  46. Zaman-Allah, M.; Das, B.; Cairns, J.E.; Vinayan, M.T.; Tarekegne, A.; Magorokosho, C.; Zaidi, P.H.; Seetharam, K. Phenotyping for Abiotic Stress Tolerance in Maize—Low Nitrogen Stress. A Field Manual; CIMMYT: Harare, Zimbabwe, 2018; Available online: https://repository.cimmyt.org/bitstream/handle/10883/19935/60069.pdf?sequence=1 (accessed on 10 March 2021).
  47. Ladha, J.K.; Kirk GJ, D.; Bennett, J.; Peng, S.; Reddy, C.K.; Reddy, P.M.; Singh, U. Opportunities for increased nitrogen-use efficiency from improved lowland rice germplasm. Field Crop. Res. 1998, 56, 41–71. [Google Scholar] [CrossRef]
  48. Badu-Apraku, B.; Fakorede, M.A.B.; Menkir, A.; Sanogo, D. Conduct and Management of Maize Field Trials; International Institute of Tropical Agriculture: Ibadan, Nigeria, 2012; p. 59. Available online: https://repository.cimmyt.org/bitstream/handle/10883/1376/97758.pdf?sequence=1&isAllowed=y (accessed on 12 March 2021).
  49. Amare, D.; Endalew, W.; Yayu, N.; Endeblihatu, A.; Biweta, W.; Tefera, A.; Tekeste, S. Evaluation and Demonstration of Maize Shellers for Small-Scale Farmers. MOJ Appl. Bionics Biomech. 2017, 1, 93–98. [Google Scholar] [CrossRef]
  50. Pacheco, A.; Rodriguez, F.; Alvarado, G.; Crossa, J.; Burgueno, J. ADEL-R (Analysis and Design of Experiments with R for Windows), Version 2.0; International Maize and Wheat Improvement Center: Veracruz, Mexico, 2017; Available online: https://data.cimmyt.org/dataset.xhtml?persistentId=hdl:11529/10857 (accessed on 16 February 2021).
  51. Sharma, R.; Adhikari, P.; Shrestha, J.; Acharya, B.P. Response of maize (Zea mays L.) hybrids to different levels of nitrogen. Arch. Agric. Environ. Sci. 2019, 4, 295–299. [Google Scholar] [CrossRef]
  52. Ngosong, C.; Bongkisheri, V.; Tanyi, C.B.; Nanganoa, L.T.; Tening, A.S. Optimizing Nitrogen Fertilization Regimes for Sustainable Maize (Zea mays L.) Production on the Volcanic Soils of Buea Cameroon. Adv. Agric. Cult. 2019, 2019, 4681825. [Google Scholar] [CrossRef] [Green Version]
  53. Shi, D.Y.; Li, Y.H.; Zhang, J.W.; Liu, P.; Zhao, B.; Dong, S.T. Effects of plant density and nitrogen dose on lodging-related stalk traits of summer maize. Plant Soil Environ. 2016, 62, 299–306. [Google Scholar] [CrossRef] [Green Version]
  54. Ding, L.; Wang, K.J.; Jiang, G.M.; Biswas, D.K.; Xu, H.; Li, L.F.; Li, Y.H. Effects of nitrogen deficiency on photosynthetic traits of maize hybrids released in different years. Ann. Bot. 2005, 96, 925–930. [Google Scholar] [CrossRef] [PubMed] [Green Version]
  55. Cheetham, H.; Millner, J.; Hardacre, A.K. Effect of nitrogen fertilisation on maize grain quality and yield. Agron. N. Z. 2006, 36, 71–84. [Google Scholar]
  56. Adhikary, B.H.; Baral, B.R.; Shrestha, J. Productivity of winter maize as affected by varieties and fertilizer levels. Int. J. Appl. Biol. 2020, 4, 85–93. [Google Scholar] [CrossRef]
  57. Abebe, Z.; Feyisa, H. Effects of Nitrogen Doses and Time of Application on Yield of Maize: Rainfall Variability Influenced Time of N Application. Int. J. Agron. 2017, 2017, 1545280. [Google Scholar] [CrossRef] [Green Version]
  58. Makhziah, M.; Rochiman, K.; Purnobasuki, H. Effect of Nitrogen Supply and Genotypic Variation for Nitrogen Use Efficiency in Maize. Am. J. Exp. Agric. 2013, 3, 182–199. [Google Scholar] [CrossRef]
  59. Peng, D.; Chen, X.; Yin, Y.; Lu, K.; Yang, W.; Tang, Y.; Wang, Z. Lodging resistance of winter wheat (Triticum aestivum L.): Lignin accumulation and its related enzymes activities due to the application of paclobutrazol or gibberellin acid. Field Crop. Res. 2014, 157, 1–7. [Google Scholar] [CrossRef]
  60. Mistele, B.; Schmidhalter, U. Estimating the nitrogen nutrition index using spectral canopy reflectance measurements. Eur. J. Agron. 2008, 29, 184–190. [Google Scholar] [CrossRef]
  61. Paponov, I.A.; Engels, C. Effect of nitrogen supply on leaf traits related to photosynthesis during grain filling in two maize genotypes with different N efficiency. J. Plant Nutr. Soil Sci. 2003, 166, 756–763. [Google Scholar] [CrossRef]
  62. Spano, G.; Di Fonzo, N.; Perrotta, C.; Platani, C.; Ronga, G.; Lawlor, D.W.; Napier, J.A.; Shewry, P.R. Physiological characterization of “stay green” mutants in durum wheat. J. Exp. Bot. 2003, 54, 1415–1420. [Google Scholar] [CrossRef] [Green Version]
  63. Glass, A.D.M. Nitrogen Use Efficiency of Crop Plants: Physiological Constraints upon Nitrogen Absorption. Crit. Rev. Plant Sci. 2003, 22, 453–470. [Google Scholar] [CrossRef]
  64. Girardin, P.; Deltour, A.; Tollenaar, M. Effect of Temporary N Starvation in Maize on Leaf Senescence. Can. J. Plant Sci. 1985, 65, 819–829. [Google Scholar] [CrossRef]
  65. Gungula, D.T.; Togun, A.O.; Kling, J.G. The Influence of N Doses on Maize Leaf Number and Senescence in Nigeria. Int. Inst. Trop. Agric. 2005, 1, 1–5. [Google Scholar]
  66. Galindo, F.S.; Teixeira Filho, M.C.M.; Buzetti, S.; Pagliari, P.H.; Santini, J.M.K.; Alves, C.J.; Megda, M.M.; Nogueira, T.A.R.; Andreotti, M.; Arf, O. Maize yield response to nitrogen doses and sources associated with Azospirillum brasilense. Agron. J. 2019, 111, 1985–1997. [Google Scholar] [CrossRef] [Green Version]
  67. Begizew, G.; Adugnaw, M.; Merkeb, G. Effect of nitrogen dose and intra-row spacing on yield and yield components of maize at Bako, Western Ethiopia. Afr. J. Agric. Res. 2020, 16, 1464–1471. [Google Scholar] [CrossRef]
  68. Ahmad, S.; Khan, A.A.; Kamran, M.; Ahmad, I.; Ali, S.; Fahad, S. Response of Maize Cultivars to Various Nitrogen Levels. Eur. J. Exp. Biol. 2018, 8, 1–4. [Google Scholar] [CrossRef]
  69. Liu, D.; Cui, Z.; Yan, B.; Gao, Y.; Wu, B.; Li, W.; Niu, J. Effect of nitrogen and phosphorus application on soil nitrogen morphological characteristics and grain yield of oil flax. Oil Crop Sci. 2020, 5, 29–35. [Google Scholar] [CrossRef]
  70. Bai, Z.; Li, H.; Yang, X.; Zhou, B.; Shi, X.; Wang, B.; Li, D.; Shen, J.; Chen, Q.; Qin, W.; et al. The critical soil P levels for crop yield, soil Fertil. and environmental safety in different soil types. Plant Soil 2013, 372, 27–39. [Google Scholar] [CrossRef]
  71. van Biljon, J.J.; Fouche, D.S.; Botha, A.D.P. Threshold values and sufficiency levels for potassium in maize producing sandy soils of South Africa. S. Afr. J. Plant Soil 2008, 25, 65–70. [Google Scholar] [CrossRef]
  72. Sangakkara, R.; Amarasekera, P.; Stamp, P. Growth, yields, and nitrogen-use efficiency of maize (Zea mays L.) and mungbean (Vigna radiata L. Wilczek) as affected by potassium fertilizer in tropical South Asia. Commun. Soil Sci. Plant Anal. 2011, 42, 832–843. [Google Scholar] [CrossRef]
  73. Sahrawat, K.L.; Rego, T.J.; Wani, S.P.; Pardhasaradhi, G. Sulfur, boron, and zinc fertilization effects on grain and straw quality of maize and sorghum grown in semi-arid tropical region of India. J. Plant Nutr. 2008, 31, 1578–1584. [Google Scholar] [CrossRef] [Green Version]
  74. Ruffo, M.; Olson, R.; Daverede, I. Maize yield response to zinc sources and effectiveness of diagnostic indicators. Commun. Soil Sci. Plant Anal. 2016, 47, 137–141. [Google Scholar] [CrossRef] [Green Version]
  75. Kugbe, J.X.; Kombat, R.; Atakora, W. Secondary and micronutrient inclusion in fertilizer formulation impact on maize growth and yield across northern Ghana. Cogent Food Agric. 2019, 5, 1700030. [Google Scholar] [CrossRef]
  76. Nduwimana, D. Optimizing Nitrogen Use Efficiency and Maize Yield under Varying Fertilizer Doses in Kenya. Int. J. Bioresour. Sci. 2020, 7, 63–73. [Google Scholar] [CrossRef]
  77. Barbieri, P.A.; Echeverría, H.E.; Saínz Rozas, H.R.; Andrade, F.H. Nitrogen use efficiency in maize as affected by nitrogen availability and row spacing. Agron. J. 2008, 100, 1094–1100. [Google Scholar] [CrossRef]
  78. Victoria, O.; Ping, A.; Yang, S.; Eneji, E. Liming and Nitrogen Effects on Maize Yield and Nitrogen Use Efficiency. Commun. Soil Sci. Plant Anal. 2019, 50, 2041–2055. [Google Scholar] [CrossRef]
  79. Djaman, K.; Irmak, S.; Martin, D.L.; Ferguson, R.B.; Bernards, M.L. Plant nutrient uptake and soil nutrient dynamics under full and limited irrigation and rainfed maize production. Agron. J. 2013, 105, 527–538. [Google Scholar] [CrossRef]
  80. Qiu, S.J.; He, P.; Zhao, S.C.; Li, W.J.; Xie, J.G.; Hou, Y.P.; Grant, C.A.; Zhou, W.; Jin, J.Y. Impact of nitrogen dose on maize yield and nitrogen use efficiencies in northeast China. Agron. J. 2015, 107, 305–313. [Google Scholar] [CrossRef]
  81. Broadbent, F.E.; De Datta, S.K.; Laureles, E.V. Measurement of Nitrogen Utilization Efficiency in Rice Genotypes. Agron. J. 1987, 79, 786–791. [Google Scholar] [CrossRef]
  82. Kankam-Boadu, I.; Sarkodie-Addo, J.; Amagloh, F. Nitrogen Use Efficiency and Maize Productivity in the Guinea Savanna Agro-ecological Zone of Ghana. J. Exp. Agric. Int. 2018, 23, 1–15. [Google Scholar] [CrossRef]
  83. Campelo, D.H.; Teixeira A dos, S.; Moreira LC, J.; de Lacerda, C.F. Growth, production and water and nitrogen use efficiency of maize under water depths and nitrogen fertilization. Rev. Bras. Eng. Agric. Ambient. 2019, 23, 747–753. [Google Scholar] [CrossRef]
  84. Sharifi, R.S.; Namvar, A. Effects of time and dose of nitrogen application on phenology and some agronomical traits of maize (Zea mays L.). Biologija 2016, 62, 35–45. [Google Scholar] [CrossRef]
  85. Paudel, P.; Matsuoka, A. Cost efficiency estimates of maize production in Nepal: A case study of the Chitwan district. Agric. Econ. 2009, 55, 139–148. [Google Scholar] [CrossRef] [Green Version]
  86. Dahal, B.R.; Rijal, S. Resource Use Efficiency and Profitability of Maize Farming in Sindhuli, Nepal: Cobb-Douglas Production Function Analysis. Int. J. Appl. Sci. Biotechnol. 2019, 7, 248–256. [Google Scholar] [CrossRef] [Green Version]
  87. Beshir, A.; Pradhan, B.; Choudhary, D.; Rusinamhodzi, L. Slow-Release Nitrogen Fertilizers Measure Up: Briquetted Urea and Polymer-Coated Urea More Efficient as Maize Fertilizers than Regular Urea, Researchers in Nepal Find. 3 June 2019. Available online: https://www.cimmyt.org/news/slow-release-nitrogen-fertilizers-measure-up/ (accessed on 17 August 2021).
  88. Sherchan, D.; Karki, K. Plant Nutrient Management for Improving Crop Productivity in Nepal; FAO: Roma, Italy, 2005; Available online: http://www.fao.org/3/ag120e/ag120e10.htm (accessed on 17 August 2021).
  89. Kunwar, U. Balanced Fertilizer Application Boosts Smallholder Incomes. Precision Nutrient Management Helps Women Farmers in Nepal Increase Crop Yields and Household Incomes. 13 November 2020. Available online: https://www.cimmyt.org/blogs/balanced-fertilizer-application-boosts-smallholder-incomes/ (accessed on 17 August 2021).
  90. Kishore, A.; Alvi, M.; Krupnik, T.J. Development of balanced nutrient management innovations in South Asia: Perspectives from Bangladesh, India, Nepal, and Sri Lanka. Glob. Food Secur. 2021, 28, 100464. [Google Scholar] [CrossRef] [PubMed]
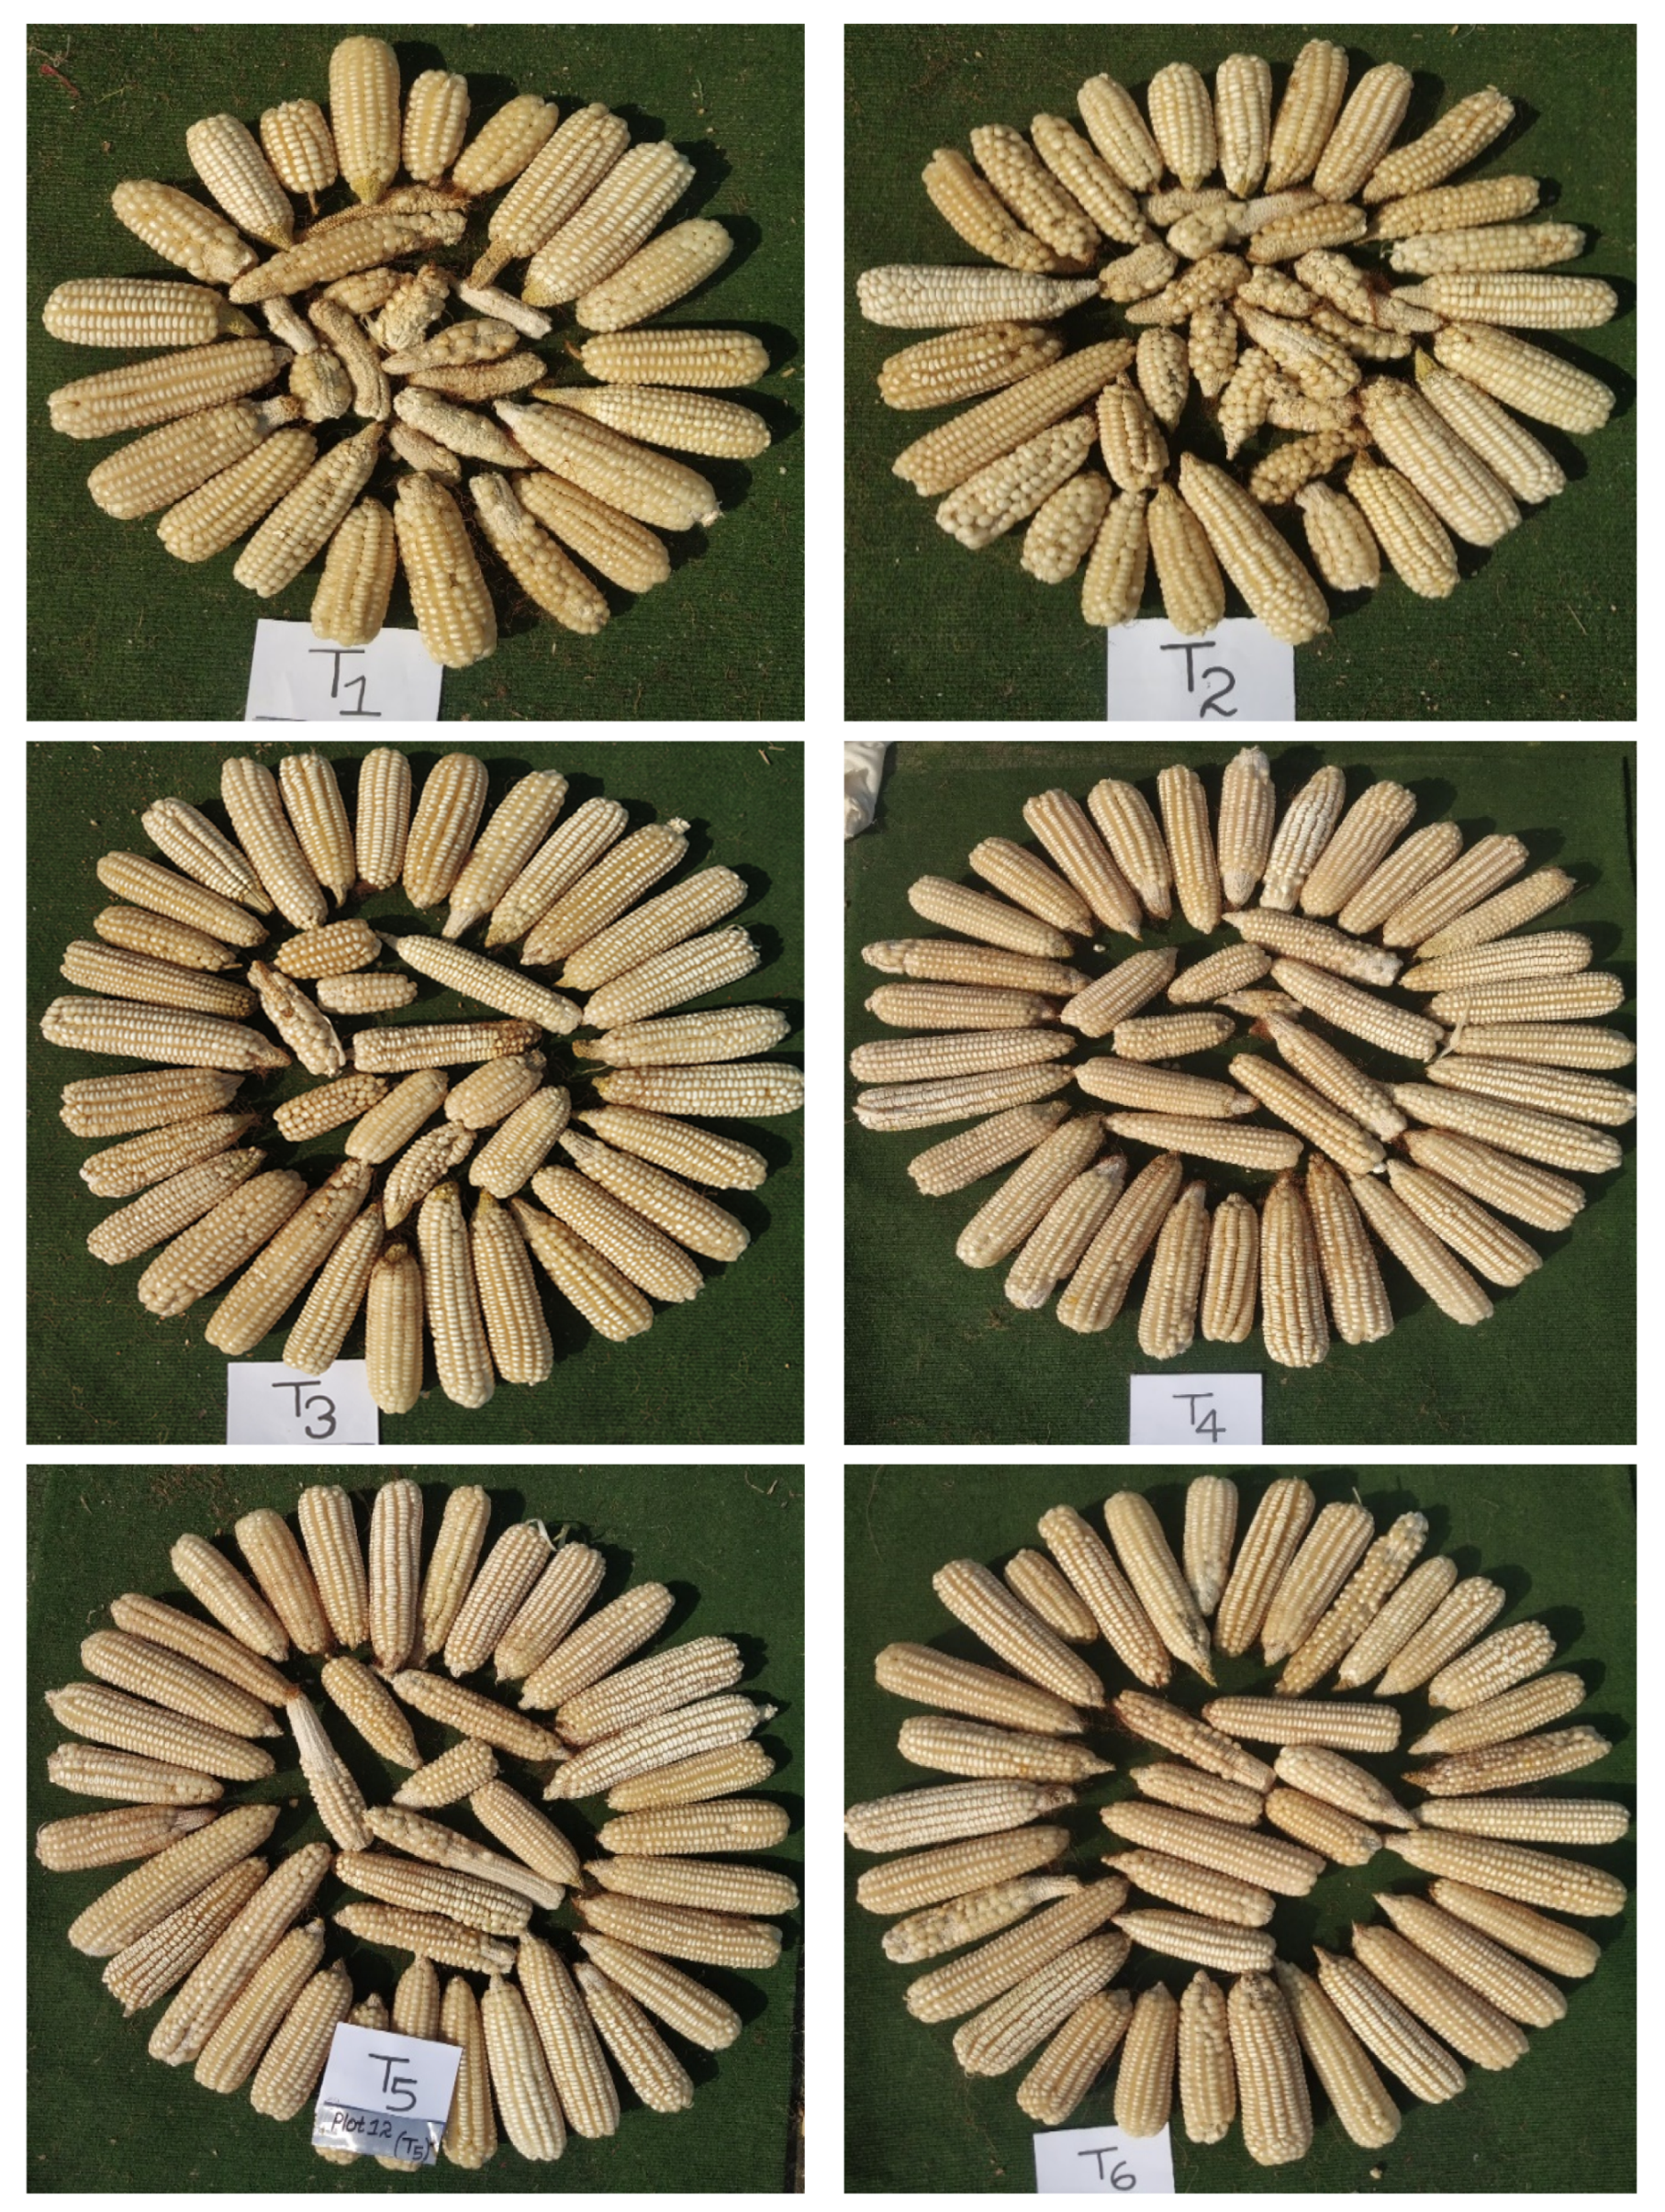
Figure 1. Daily fluctuations of maximum and minimum temperature, humidity, and rainfall recorded during the study period. Data of rainfall and temperatures are represented in the primary vertical axis and humidity in the secondary vertical axis. Dates are presented in day-month-year format, year is 2020 (Data source; Office of Hydrology and Meteorology, Kohalpur—we used data of nearest sub-station Mehelkuna).
Nitrogen 02 00025 g001
Figure 2. Lodging and Sterility observed in different treatments influenced by varying doses of Nitrogen. CK; control treatment, N0; 0 kg ha−1 N, N60; 60 kg ha−1 N, N120; 120 kg ha−1 N, N180; 180 kg ha−1 N, N240; 240 kg ha−1 N. Similar letters across the treatments indicate a non-significant effect (p ≤ 0.05).
Nitrogen 02 00025 g002
Figure 3. Leaf senescence score in different treatments as influenced by N doses. DAS; days after sowing, CK; control treatment, N0; 0 kg ha−1 N, N60; 60 kg ha−1 N, N120; 120 kg ha−1 N, N180; 180 kg ha−1 N, N240; 240 kg ha−1 N, senescence scores can be converted to % by using a multiplication factor of 10 (Score of 2 indicates 20% dead leaf area). Same letters across the treatments indicate a non-significant effect (p ≤ 0.05).
Nitrogen 02 00025 g003
Figure 4. Grain yield produced by different treatments as influenced by Nitrogen doses. CK; control treatment, N0; 0 kg ha−1 N, N60; 60 kg ha−1 N, N120; 120 kg ha−1 N, N180; 180 kg ha−1 N, N240; 240 kg ha−1 N, means with similar letters across the treatments denote a non-significant effect (p ≤ 0.05).
Nitrogen 02 00025 g004
Figure 5. Yield advantage of N fertilized treatments over N omission (N0) plots. CK; control treatment, N0; 0 kg ha−1 N, N60; 60 kg ha−1 N, N120; 120 kg ha−1 N, N180; 180 kg ha−1 N, N240; 240 kg ha−1 N. Inverted bar (as in CK) represents negative yield advantage over N0. Similar letters across the treatments indicate a non-significant effect (p ≤ 0.05).
Nitrogen 02 00025 g005
Figure 6. Total nitrogen uptake, agronomic use efficiency and partial factor productivity of N as influenced by different levels of N. TN; total nitrogen, AEN; agronomic N use efficiency (kg grain kg−1 N), PFPN; partial factor productivity of N (kg grain kg−1 N), CK; control treatment, N0; 0 kg ha−1 N, N60; 60 kg ha−1 N, N120; 120 kg ha−1 N, N180; 180 kg ha−1 N, N240; 240 kg ha−1 N, the mean values with similar letters across the treatments denote a non-significant effect (p ≤ 0.05).
Nitrogen 02 00025 g006
Figure 7. Different components of NUEs as influenced by different N doses. REN; Recovery efficiency of N (kg N uptake kg−1 N), PEN; Physiological efficiency of N (kg grain kg−1 N uptake), IEN; Internal efficiency of N (kg grain kg−1 N uptake), UEN; Utilization efficiency of N (kg grain kg−1 N), N60; 60 kg ha−1 N, N120; 120 kg ha−1 N, N180; 180 kg ha−1 N, N240; 240 kg ha−1 N. Similar letters across the treatments indicate a non-significant effect (p ≤ 0.05).
Nitrogen 02 00025 g007
Figure 8. Cob yield in the different treatments as influenced by varying levels of Nitrogen; (T1) CK—control treatment, (T2) N0—0 kg ha−1 N, (T3) N60—60 kg ha−1 N, (T4) N120—120 kg ha−1 N, (T5) N180—180 kg ha−1 N, (T6) N240—240 kg ha−1 N.
Nitrogen 02 00025 g008
Table 1. Details of different treatments with various N levels used in the study.
TreatmentsAbbreviationDetails
T1CKControl (no fertilizer)
T2N00:60:40 NPK kg ha−1 + 20 kg ha−1 other nutrients mix
T3N6060:60:40 NPK kg ha−1 + 20 kg ha−1 other nutrients mix
T4N120120:60:40 NPK kg ha−1 + 20 kg ha−1 other nutrients mix
T5N180180:60:40 NPK kg ha−1 + 20 kg ha−1 other nutrients mix
T6N240240:60:40 NPK kg ha−1 + 20 kg ha−1 other nutrients mix
Remarks: CK; control treatment, N0; 0 kg ha−1 N, N60; 60 kg ha−1 N, N120; 120 kg ha−1 N, N180; 180 kg ha−1 N, N240; 240 kg ha−1 N, SSP; single super phosphate (0:16:0 NPK).
Table 2. Effect of varying N levels on agronomic and yield attributing traits of the Manakamana-3 maize variety under rainfed conditions.
TreatmentsPHT (cm)EHT (cm)EHARVSTOY (t ha−1)BY (t ha−1)HGW (g)HI
CK187 a89 a364.1 a5.9 a35.8 a0.32 a
N0187 a84 a394.4 a6.7 a34.3 ab0.35 a
N60212 a109 b414.9 a8.9 b36.7 abc0.46 b
N120224 ab116 b417.2 b12.7 c39.6 bcd0.44 b
N180218 bc114 b408.2 b13.9 c41.1 cd0.41 b
N240223 c115 b437.9 b13.7 c41.4 d0.42 b
Grand Mean209105406.110.338.20.40
p-value0.02 *<0.01 **0.08 ns<0.01 **<0.01 **0.02 *<0.01 **
LSD (0.05)24.917.64.41.41.84.40.04
CV (%)6.69.36.012.59.86.46.1
Remarks: PHT; plant height, EHT; ear height, EHARV; number of ears harvested, STOY; straw yield, BY; biomass yield, HGW; hundred grain weight, CK; control treatment, N0; 0 kg ha−1 N, N60; 60 kg ha−1, N120; 120 kg ha−1, N180; 180 kg ha−1, N240; 240 kg ha−1, LSD; least significant difference, CV; coefficient of variation, means followed by same letters within the column are statistically non-significant (p ≤ 0.05). * Significant effect at p ≤ 0.05, ** significant effect at p ≤ 0.01, and ns non-significant effect.
Table 3. Partial economic analysis of different treatments estimated for a hectare of land (USD 1: 116.39 NPR).
TreatmentsAdjusted Yield (t ha−1)Total Revenue (USD)Total Variable Cost (USD)Net Benefit (USD)B:C Ratio
GrainStover
CK1.723.65496.81594.55−97.740.91
N02.103.98604.81721.86−117.050.80
N603.664.411049.94842.62207.321.33
N1204.996.481432.93932.50500.431.54
N1805.127.371470.95975.98494.971.51
N2405.197.111490.701019.47471.231.46
Remarks: CK; control treatment, N0; 0 kg ha−1 N, N60; 60 kg ha−1 N, N120; 120 kg ha−1 N, N180; 180 kg ha−1 N, N240; 240 kg ha−1 N, USD; United States Dollar, NPR.; Nepalese Rupees, B:C; benefit–cost.
Publisher’s Note: MDPI stays neutral with regard to jurisdictional claims in published maps and institutional affiliations.

