Neurocognitive Disorders and Dehydration in Older Patients: Clinical Experience Supports the Hydromolecular Hypothesis of Dementia

Abstract
:1. Introduction
2. Materials and Methods
2.1. Study Sample
2.2. Clinical, Cognitive, Affective and Functional Assessment
2.3. Value Quantification of Serum Osmolality
2.4. Statistical Analyses
3. Results
4. Discussion
Author Contributions
Acknowledgments
Conflicts of Interest
References
- Naitoh, M.; Burrell, L.M. Thirst in older patients subjects. J. Nutr. Health Aging 1998, 2, 172–177. [Google Scholar] [PubMed]
- Stout, N.R.; Kenny, R.A.; Baylis, P.H. A review of water balance in ageing in health and disease. Gerontology 1999, 45, 61–66. [Google Scholar] [CrossRef] [PubMed]
- Verney, E.B. The antidiuretic hormone and the factors which determine its release. Proc. R. Soc. Lond. B Biol. Sci. 1947, 135, 25–106. [Google Scholar] [CrossRef] [PubMed]
- Cowen, L.E.; Hodak, S.P.; Verbalis, J.G. Age-Associated Abnormalities of Water Homeostasis. Endocrinol. Metab. Clin. 2013, 42, 349–370. [Google Scholar] [CrossRef] [PubMed]
- Danziger, J.; Zeidel, M.L. Osmotic homeostasis. Clin. J. Am. Soc. Nephrol. 2015, 10, 852–862. [Google Scholar] [CrossRef] [PubMed]
- Beck, L.H. The aging kidney. Defending a delicate balance of fluid and electrolytes. Geriatrics 2000, 55, 26–28. [Google Scholar] [PubMed]
- Beck, L.H.; Lavizzo-Mourey, R. Geriatric hypernatremia. Ann. Intern. Med. 1987, 107, 768–769. [Google Scholar] [CrossRef] [PubMed]
- Rolls, B.J.; Phillips, P.A. Aging and disturbances of thirst and fluid balance. Nutr. Rev. 1990, 48, 137–144. [Google Scholar] [CrossRef] [PubMed]
- Sfera, A.; Cummings, M.; Osorio, C. Dehydration and Cognition in Geriatrics: A Hydromolecular Hypothesis. Front. Mol. Biosci. 2016, 3, 18. [Google Scholar] [CrossRef] [PubMed]
- Jessen, F.; Amariglio, R.E.; van Boxtel, M.; Breteler, M.; Ceccaldi, M.; Chételat, G.; Dubois, B.; Dufouil, C.; Ellis, K.A.; van der Flier, W.M.; et al. A conceptual framework for research on subjective cognitive decline in preclinical Alzheimer’s disease. Alzheimers Dement. 2014, 10, 844–852. [Google Scholar] [CrossRef] [PubMed] [Green Version]
- American Psychiatric Association: Diagnostic and Statistical Manual of Mental Disorders, 5th ed.; American Psychiatric Publishing: Washington, DC, USA, 2013.
- Albert, M.S.; DeKosky, S.T.; Dickson, D.; Dubois, B.; Feldman, H.H.; Fox, N.C.; Gamst, A.; Holtzman, D.M.; Jagust, W.J.; Petersen, R.C.; et al. The diagnosis of mild cognitive impairment due to Alzheimer’s disease: Recommendations from the National Institute on Aging-Alzheimer’s Association workgroups on diagnostic guidelines for Alzheimer’s disease. Alzheimers Dement. 2011, 7, 270–279. [Google Scholar] [CrossRef] [PubMed]
- McKhann, G.M.; Knopman, D.S.; Chertkow, H.; Hyman, B.T.; Jack, C.R., Jr.; Kawas, C.H.; Klunk, W.E.; Koroshetz, W.J.; Manly, J.J.; Mayeux, R.; et al. The diagnosis of dementia due to Alzheimer’s disease: Recommendations from the National Institute on Aging-Alzheimer’s Association workgroups on diagnostic guidelines for Alzheimer’s disease. Alzheimers Dement. 2011, 7, 263–269. [Google Scholar] [CrossRef] [PubMed]
- McKeith, I.G.; Dickson, D.W.; Lowe, J.; Emre, M.; O’Brien, J.T.; Feldman, H.; Cummings, J.; Duda, J.E.; Lippa, C.; Perry, E.K.; et al. Diagnosis and management of dementia with Lewy bodies: Third report of the DLB Consortium. Neurology 2005, 65, 1863–1872. [Google Scholar] [CrossRef] [PubMed]
- Roman, G.C.; Tatemichi, T.K.; Erkinjuntti, T.; Cummings, J.L.; Masdeu, J.C.; Garcia, J.H.; Amaducci, L.; Orgogozo, J.-M.; Brun, A.; Hofman, A.; et al. Vascular dementia: Diagnostic criteria for research studies. Report of the NINDS-AIREN International Workshop. Neurology 1993, 43, 250–260. [Google Scholar] [CrossRef] [PubMed]
- Folstein, M.; Folstein, S.; McHugh, P.R. Mini-mental state: A practical method for grading the cognitive state of patients for the clinician. J. Psychiatr. Res. 1975, 12, 189–198. [Google Scholar] [CrossRef]
- Hughes, C.P.; Berg, L.; Danziger, W.L.; Coben, L.A.; Martin, R.L. A new clinical scale for the staging of dementia. Br. J. Psychiatry 1982, 140, 566–572. [Google Scholar] [CrossRef] [PubMed]
- Hachinski, V.C.; Iliff, L.D.; Zilhka, E.; Du Boulay, G.H.; McAllister, V.L.; Marshall, J.; Russell, R.W.; Symon, L. Cerebral blood flow in dementia. Arch. Neurol. 1975, 32, 632–637. [Google Scholar] [CrossRef] [PubMed]
- Hamilton, M. A rating scale for depression. J. Neurol. Neurosurg. Psychiatry 1960, 23, 56–62. [Google Scholar] [CrossRef] [PubMed]
- Katz, S.; Downs, T.D.; Cash, H.R.; Grotz, R.C. Progress in the development of an index of ADL. Gerontologist 1970, 10, 20–30. [Google Scholar] [CrossRef] [PubMed]
- Lawton, M.P.; Brody, E.M. Assessment of older people: Self-maintaining and instrumental activities of daily living. Gerontologist 1969, 9, 179–186. [Google Scholar] [CrossRef] [PubMed]
- Vellas, B.; Guigoz, Y.; Garry, P.J.; Nourhashemi, F.; Bennahum, D.; Lauque, S.; Albarede, J.L. The Mini Nutritional Assessment (MNA) and its use in grading the nutritional state of older patients. Nutrition 1999, 15, 116–122. [Google Scholar] [CrossRef]
- Bliss, M.R.; McLaren, R.; Exton-Smith, A.N. Mattresses for preventing pressure sores in geriatric patients. Mon. Bull. Minist. Health Public Health Lab. Serv. 1966, 25, 238–268. [Google Scholar] [PubMed]
- Parmelee, P.A.; Thuras, P.D.; Katz, I.R.; Lawton, M.P. Validation of the Cumulative illness rating scale in a geriatric residential population. J. Am. Geriatr. Soc. 1995, 43, 130–137. [Google Scholar] [PubMed]
- Dickson, J.M.; Weavers, H.M.; Mitchell, N.; Winter, E.M.; Wilkinson, I.D.; Van Beek, E.J.; Wild, J.M.; Griffiths, P.D. The effects of dehydration on brain volume—Preliminary results. Int. J. Sports Med. 2005, 26, 481–485. [Google Scholar] [CrossRef] [PubMed]
- Siervo, M.; Bunn, D.; Prado, C.M.; Hooper, L. Accuracy of prediction equations for serum osmolarity in frail older people with and without diabetes. Am. J. Clin. Nutr. 2014, 100, 867–876. [Google Scholar] [CrossRef] [PubMed]
- Levey, A.S.; Stevens, L.A.; Schmid, C.H.; Zhang, Y.L.; Castro, A.F.; Feldman, H.I.; Kusek, J.W.; Eggers, P.; Van Lente, F.; Greene, T.; et al. A new equation to estimate glomerular filtration rate. Ann. Intern. Med. 2009, 150, 604–612. [Google Scholar] [CrossRef] [PubMed]
- National Kidney Foundation. K/DOQI clinical practice guidelines for chronic kidney disease: Evaluation, classification, and stratification. Am. J. Kidney Dis. 2002, 39, S1–S266. [Google Scholar]
- Johnson, A.G.; Crawford, G.A.; Kelly, D.; Nguyen, T.V.; Gyory, A.Z. Arginine vasopressin and osmolarity in the older patients. J. Am. Geriatr. Soc. 1994, 42, 399–404. [Google Scholar] [CrossRef] [PubMed]
- Kositzke, J.A. A question of balance—Dehydration in the older patients. J. Gerontol. Nurs. 1990, 16, 4–11. [Google Scholar] [CrossRef] [PubMed]
- Martin, J.H.; Larsen, P.D. Dehydration in the older patients surgical patient. AORN J. 1994, 60, 666–671. [Google Scholar] [PubMed]
- Natalie, A. Masento Effects of hydration status on cognitive performance and mood. Br. J. Nutr. 2014, 111, 1841–1852. [Google Scholar]
- Food and Nutrition Board. Dietary Reference Intakes for Water, Potassium, Sodium, Chloride, and Sulfate; The National Academies Press: Washington, DC, USA, 2004. [Google Scholar]
- Fetissov, S.O.; Thornton, S.N. Hypovolaemia-induced obesity and diabetes. Metab. Clin. Exp. 2009, 58, 1678. [Google Scholar] [CrossRef] [PubMed]
- Thornton, S.N.; Even, P.C.; van Dijk, G. Hydration increases cell metabolism. Int. J. Obes. 2009, 33, 385. [Google Scholar] [CrossRef] [PubMed]
- Thornton, S.N. Diabetes and hypertension, as well as obesity and Alzheimer’s disease, are linked to hypohydration-induced lower brain volume. Front. Aging Neurosci. 2014, 6, 279. [Google Scholar] [CrossRef] [PubMed]
- Himmelstein, D.U.; Jones, A.A.; Woolhandler, S. Hypernatremic dehydration in nursing home patients: An indicator of neglect. J. Am. Geriatr. Soc. 1983, 31, 466–471. [Google Scholar] [CrossRef] [PubMed]
- Hodgkinson, B.; Evans, D.; Wood, J. Maintaining oral hydration in older adults: A systematic review. Int. J. Nurs. Pract. 2003, 9, S19–S28. [Google Scholar] [CrossRef] [PubMed]
- Mahowald, J.M.; Himmelstein, D.U. Hypernatremia in the older patients: Relation to infection and mortality. J. Am. Geriatr. Soc. 1981, 29, 177–180. [Google Scholar] [CrossRef] [PubMed]
- Skipper, A. Dietitian’s Handbook of Enteral and Parenteral Nutrition; Aspen Publishers: Rockville, MD, USA, 1989. [Google Scholar]
- De Castro, J.M. Age-related changes in natural spontaneous fluid ingestion and thirst in humans. J. Gerontol. 1992, 47, P321–P330. [Google Scholar] [CrossRef] [PubMed]
- Grant, A.; DeHoog, S. Nutritional Assessment and Support, 4th ed.; Grant/DeHoog: Seattle, WA, USA, 1991. [Google Scholar]
- Thornton, S.N. Thirst and hydration: Physiology and consequences of dysfunction. Physiol. Behav. 2010, 100, 15–21. [Google Scholar] [CrossRef] [PubMed]
- Thornton, S.N.; Benetos, A. Dementia, Alzheimer’s and Diabetes Could Be Linked through Hypovolaemia. Posted on Neurology. 25 October 2011. Available online: http://n.neurology.org/content/dementia-alzheimers-and-diabetes-could-be-linked-through-hypovolaemia (accessed on 22 August 2017).
- Chumlea, W.C.; Guo, S.S.; Zeller, C.M.; Reo, N.V.; Siervogel, R.M. Total body water data for white adults 18 to 64 years of age: The Fels Longitudinal Study. Kidney Int. 1999, 56, 244–252. [Google Scholar] [CrossRef] [PubMed]
- Ritz, P.; Vol, S.; Berrut, G.; Tack, I.; Arnaud, M.J.; Tichet, J. Influence of gender and body composition on hydration and body water spaces. Clin. Nutr. 2008, 27, 740–746. [Google Scholar] [CrossRef] [PubMed]
- Schliess, F.; Häussinger, D. Cell volume and insulin signaling. Int. Rev. Cytol. 2003, 225, 187–228. [Google Scholar] [PubMed]
- Duning, T.; Kloska, S.; Steinsträter, O.; Kugel, H.; Heindel, W.; Knecht, S. Dehydration confounds the assessment of brain atrophy. Neurology 2005, 64, 548–550. [Google Scholar] [CrossRef] [PubMed]


| Control Group n = 520 | CD-DM n = 571 | p Value | Whole Population n = 1091 | |
|---|---|---|---|---|
| Male sex * | 326 (62.7%) | 216 (37.8%) | <0.001 | 542 (49.7%) |
| Age (years) ** | 77.64 ± 6.60 (65–95) | 79.94 ± 6.67 (65–97) | <0.001 | 78.80 ± 6.72 (65–97) |
| MMSE ** | 29.00 ± 0.61 (29–30) | 18.00 ± 6.72 (0–30) | <0.001 | 23.28 ± 7.32 (0–30) |
| HRSD-21 ** | 2.48 ± 1.61 (1–6) | 10.96 ± 6.93 (0–31) | <0.001 | 6.57 ± 6.66 (0–31) |
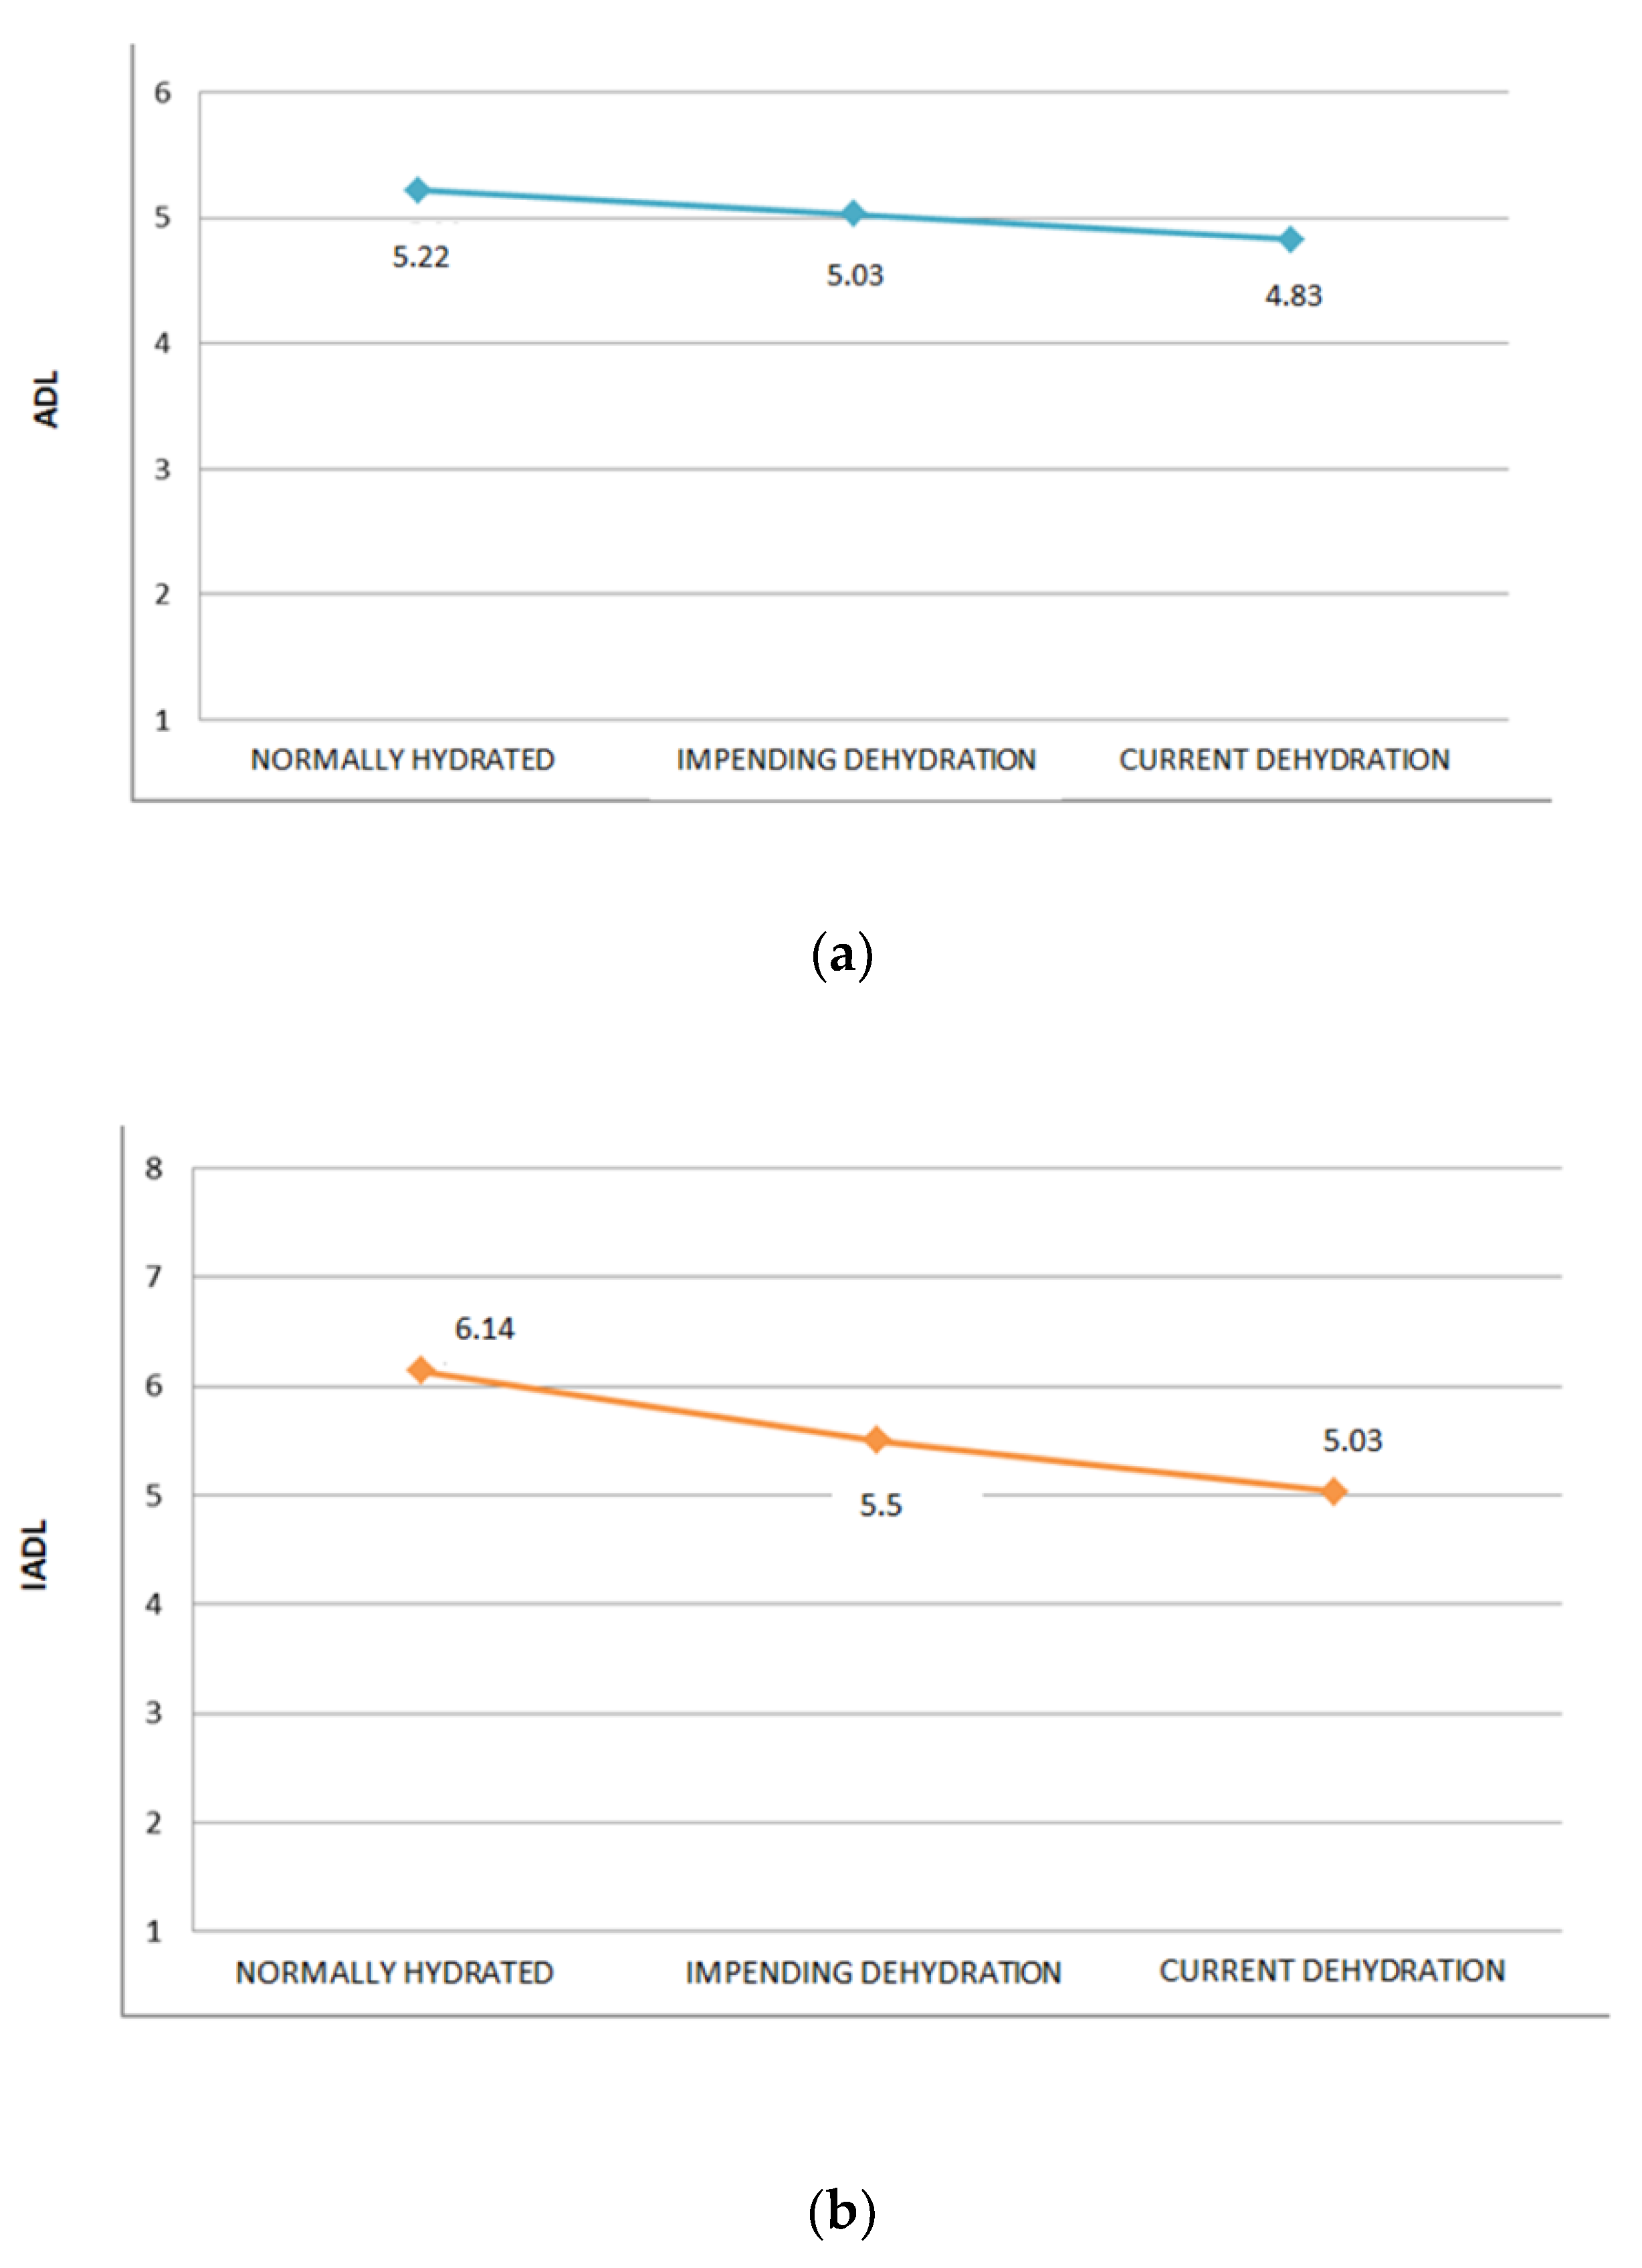
| ADL ** | 6.00 ± 0.00 (6–6) | 4.14 ± 1.88 (0–6) | <0.001 | 4.98 ± 1.65 (0–6) |
| IADL ** | 8.00 ± 0.00 (8–8) | 3.31 ± 3.18 (0–8) | <0.001 | 5.39 ± 3.38 (0–8) |
| MNA ** | 24.26 ± 3.42 (9–29) | 23.02 ± 4.45 (0–29) | <0.001 | 23.61 ± 4.00 (0–29) |
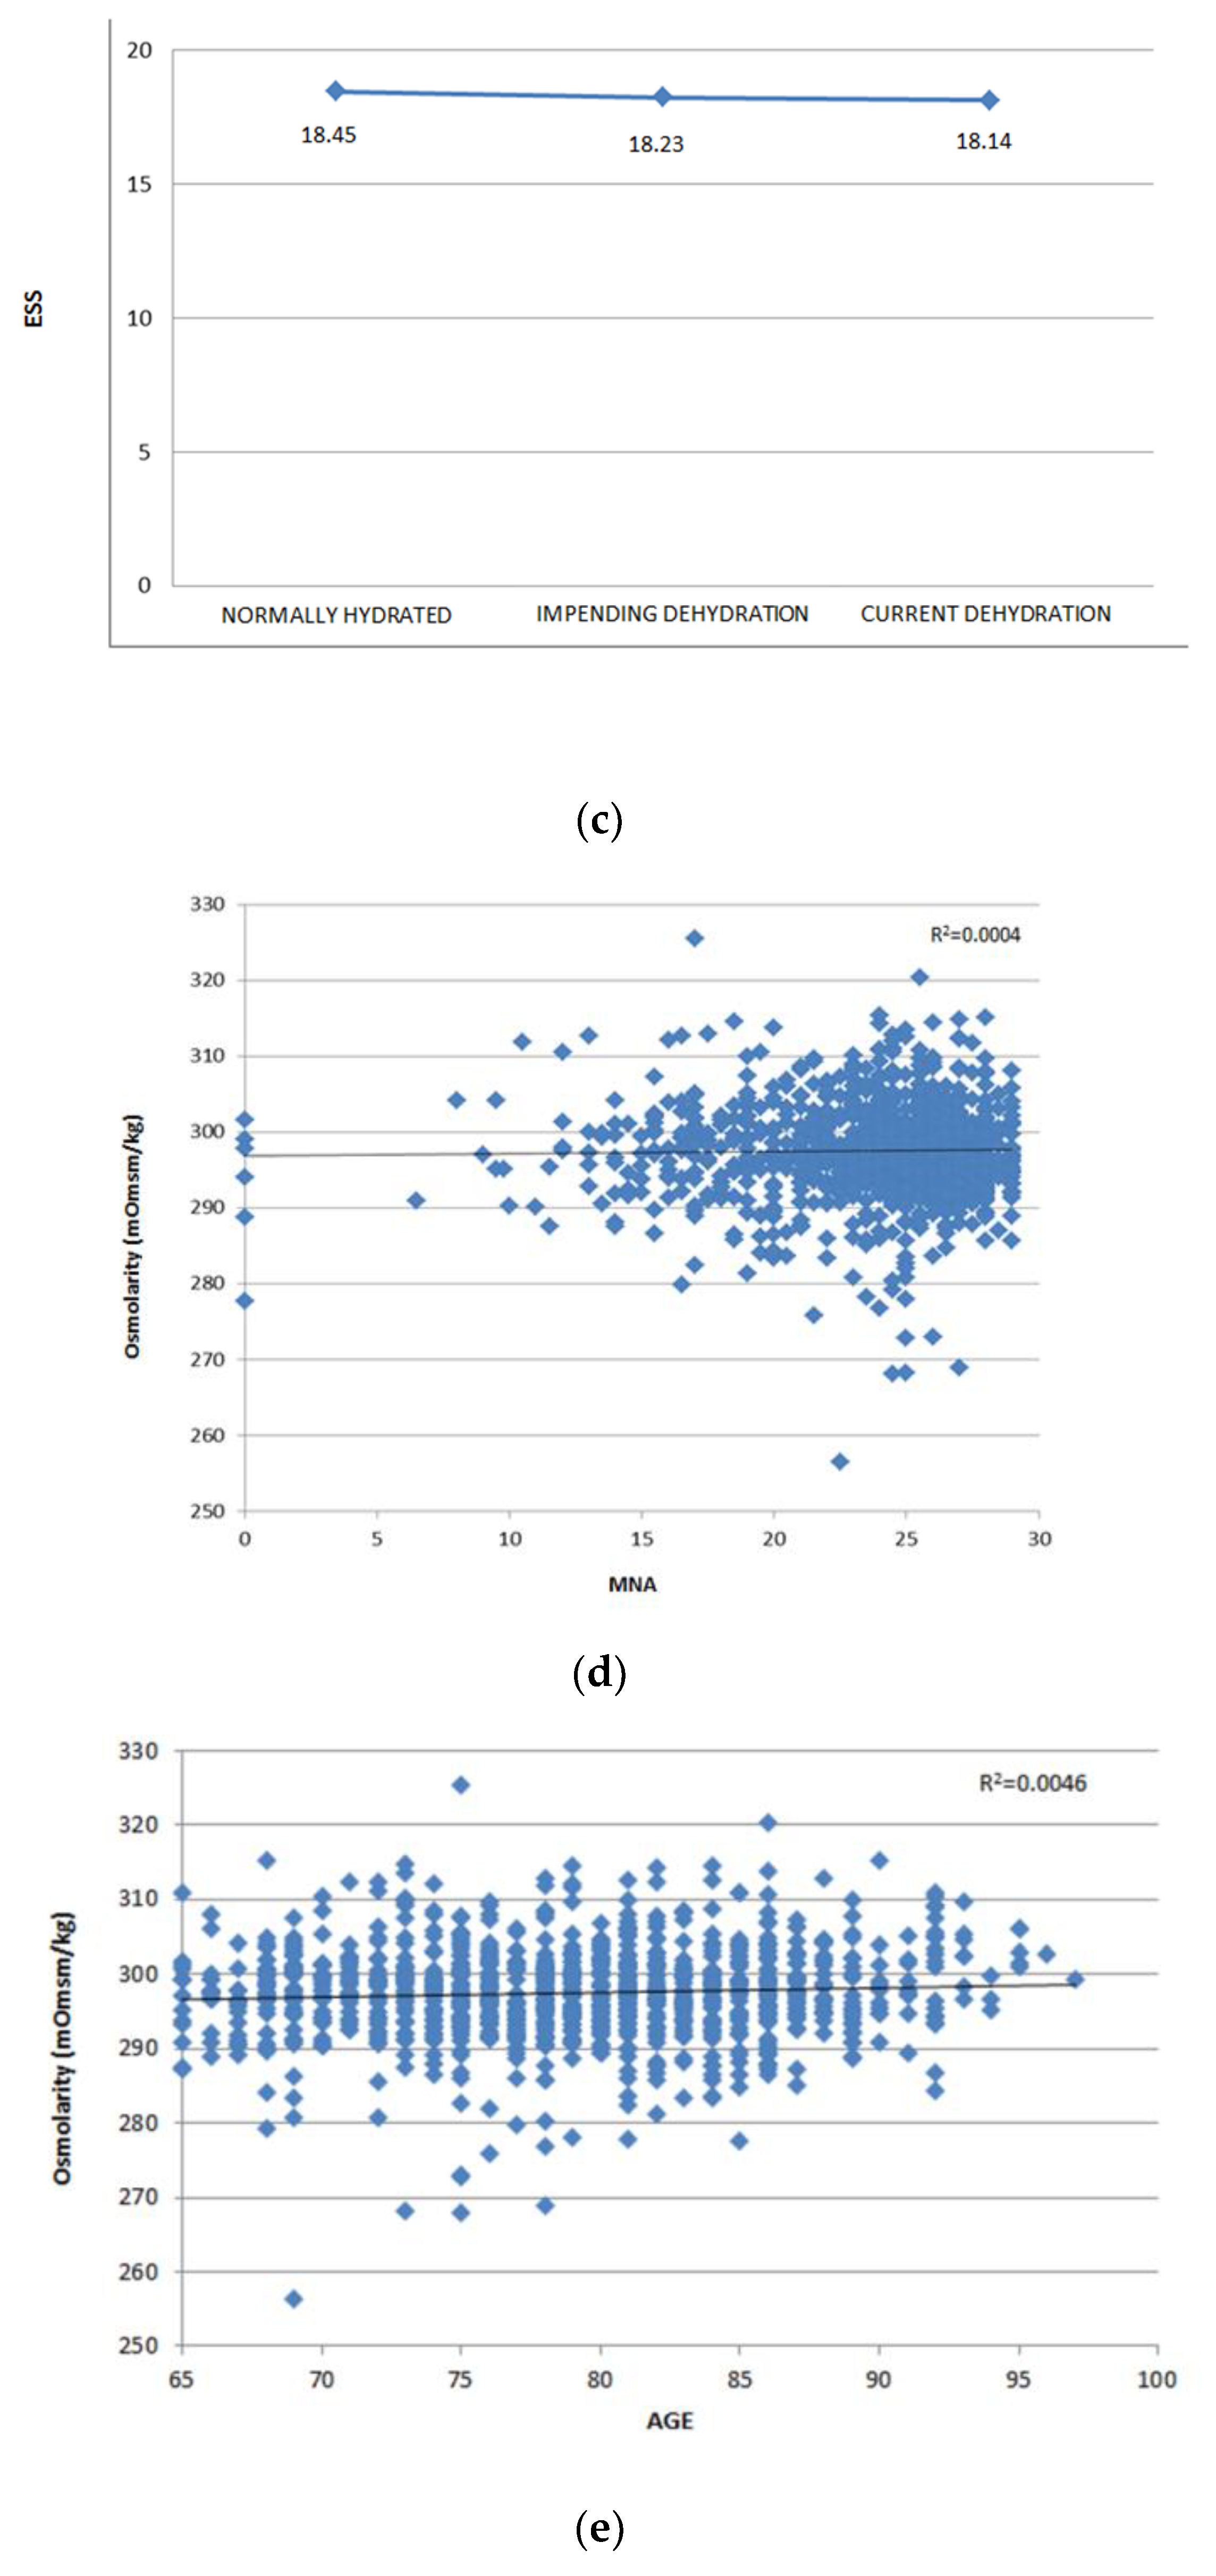
| ESS ** | 19.32 ± 0.78 (18–20) | 17.32 ± 2.35 (9–20) | <0.001 | 18.27 ± 2.05 (9–20) |
| CIRS ** | 2.23 ± 1.39 (0–7) | 2.33 ± 1.50 (0–9) | 0.241 | 2.28 ± 1.45 (0–9) |
| Glucose (mmol/L) ** | 5.53 ± 1.96 (2.24–17.22) | 5.54 ± 1.51 (3.64–14.42) | 0.903 | 5.54 ± 1.76 (2.23–17.22) |
| Urea (mmol/L) ** | 7.44 ± 2.61 (2.34–19.00) | 7.55 ± 3.12 (2.82–34.53) | 0.571 | 7.43 ± 2.82 (2.31–34.53) |
| Scr (µmol/L) ** | 83.82 ± 27.95 (35.42–221) | 81 ± 27.22 (36.21–212.20) | 0.107 | 82.40 ± 27.63 (35.42–221) |
| Na+ (mmol/L) ** | 140.28 ± 3.47 (120–151) | 141.00 ± 2.46 (133–151) | <0.001 | 140.65 ± 3.00 (120–151) |
| K+ (mmol/L) ** | 4.27 ± 0.49 (2.80–6.46) | 4.52 ± 0.46 (3.31–7.78) | <0.001 | 4.40 ± 0.50 (2.80–7.78) |
| Cl− (mmol/L) ** | 103.73 ± 4.48 (85–142) | 105.04 ± 3.08 (86–116) | <0.001 | 104.40 ± 3.86 (85–142) |
| eGFR (mL/min/1.73 m2) ** | 72.21 ± 18.03 (19.52–107.91) | 69.64 ± 18.57 (16.66–106.50) | 0.021 | 71.00 ± 18.35 (16.66–107.91) |
| Osmolality (mmol/kg) ** | 296.53 ± 6.98 (256–315) | 298.44 ± 5.53 (283–325) | <0.001 | 297.53 ± 6.33 (256–325) |
| SCI n = 27 | LLD with Cognitive Impairment n = 125 | MCI n = 78 | AD n = 122 | VaD n = 203 | LBD n = 16 | |
|---|---|---|---|---|---|---|
| Male sex * | 11 (40.70%) | 25 (20.00%) | 42 (53.80%) | 52 (42.60%) | 79 (39.00%) | 7 (43.80%) |
| Age (years) ** | 77.33 ± 6.81 (66–92) | 77.75 ± 6.50 (65–93) | 78.10 ± 6.86 (65–97) | 79.00 ± 6.31 (65–92) | 83.00 ± 6.00 (65–96) | 79.13 ± 5.32 (69–91) |
| MMSE ** | 27.64 ± 1.93 (24–30) | 19.92 ± 5.44 (0–29) | 25.14 ± 1.49 (24–28) | 13.99 ± 5.81 (0–27) | 15.24 ± 5.87 (0–29) | 17.72 ± 4.68 (9–24) |
| HRSD-21 ** | 3.30 ± 2.35 (0–7) | 14.66 ± 5.60 (8–30) | 4.91 ± 2.44 (0–7) | 10.11 ± 6.52 (0–26) | 13.09 ± 6.85 (0–31) | 12.23 ± 9.19 (0–31) |
| ADL ** | 6.00 ± 0 (6–6) | 4.45 ± 1.68 (0–6) | 6.00 ± 0 (6–6) | 3.57 ± 1.88 (0–6) | 3.36 ± 1.80 (0–6) | 3.56 ± 1.75 (1–6) |
| IADL ** | 8.00 ± 0 (8–8) | 3.82 ± 3.15 (0–8) | 8.00 ± 0 (8–8) | 1.60 ± 2.34 (0–8) | 1.71 ± 2.49 (0–8) | 2.06 ± 2.83 (0–8) |
| MNA ** | 27.03 ± 1.79 (23–29) | 23.26 ± 3.95 (9–29) | 26.00 ± 3.10 (13–29) | 21.93 ± 4.96 (0–29) | 21.90 ± 4.39 (6–28) | 22.63 ± 3.35 (16–28) |
| ESS ** | 19.00 ± 1.44 (14–20) | 17.66 ± 2.12 (12–20) | 18.88 ± 1.44 (15–20) | 17.21 ± 2.29 (9–20) | 16.32 ± 2.46 (9–20) | 17.63 ± 1.71 (14–20) |
| CIRS ** | 2.00 ± 1.17 (0–4) | 2.42 ± 1.43 (0–6) | 1.92 ± 1.54 (0–6) | 1.95 ± 1.28 (0–6) | 2.72 ± 1.60 (0–9) | 2.13 ± 1.50 (0–5) |
| Glucose (mmol/L) ** | 5.32 ± 1.33 (4.00–8.30) | 5.29 ± 1.20 (3.85–10.44) | 5.35 ± 1.50 (3.93–11.72) | 5.57 ± 1.54 (3.62–14.43) | 5.80 ± 1.81 (3.72–12.22) | 4.67 ± 0.75 (3.63–6.55) |
| Urea (mmol/L) ** | 7.14 ± 2.35 (4.25–14.00) | 7.40 ± 3.41 (3.52–34.55) | 7 ± 2.02 (4.00–16.32) | 6.82 ± 2.45 (2.84–17.33) | 8.20 ± 3.61 (2.85–28.34) | 6.63 ± 1.75 (4.72–9.73) |
| Scr (µmol/L) ** | 73.53 ± 20.81 (39.82–152.00) | 75.60 ± 25.51 (36.22–198.92) | 79.55 ± 22.47 (38.00–168) | 79.36 ± 26.78 (38.00–160.92) | 87.93 ± 30 (38.93–212.24) | 71.33 ± 21.42 (46.84–120.26) |
| Na+ (mmol/L) ** | 140.70 ± 2.31 (137–148) | 141.38 ± 2.84 (135–151) | 140.68 ± 2.17 (134–145) | 141.80 ± 2.40 (134–147) | 140.42 ± 2.24 (133–147) | 141.19 ± 2.13 (137–144) |
| K+ (mmol/L) ** | 4.49 ± 0.35 (3.97–5.20) | 4.51 ± 0.47 (3.50–6.00) | 4.44 ± 0.39 (3.70–5.62) | 4.45 ± 0.38 (3.31–5.58) | 4.60 ± 0.53 (3.44–7.78) | 4.24 ± 0.36 (3.55–4.70) |
| Cl− (mmol/L) ** | 105.30 ± 2.49 (101–110) | 104.66 ± 2.94 (98–112) | 105.00 ± 2.28 (100–109) | 105.24 ± 3.36 (86–112) | 105.02 ± 3.33 (96–116) | 105.06 ± 3.17 (97–112) |
| eGFR (mL/min/1.73 m2) ** | 76.21 ± 15.65 (36.22–100.52) | 72.39 ± 17.68 (20.72–106.50) | 73.17 ± 16.10 (30.79–97.73) | 71.82 ± 18.52 (24.26–106.24) | 63.84 ± 19.27 (16.66–100.47) | 76.92 ± 15.28 (52.21–95.16) |
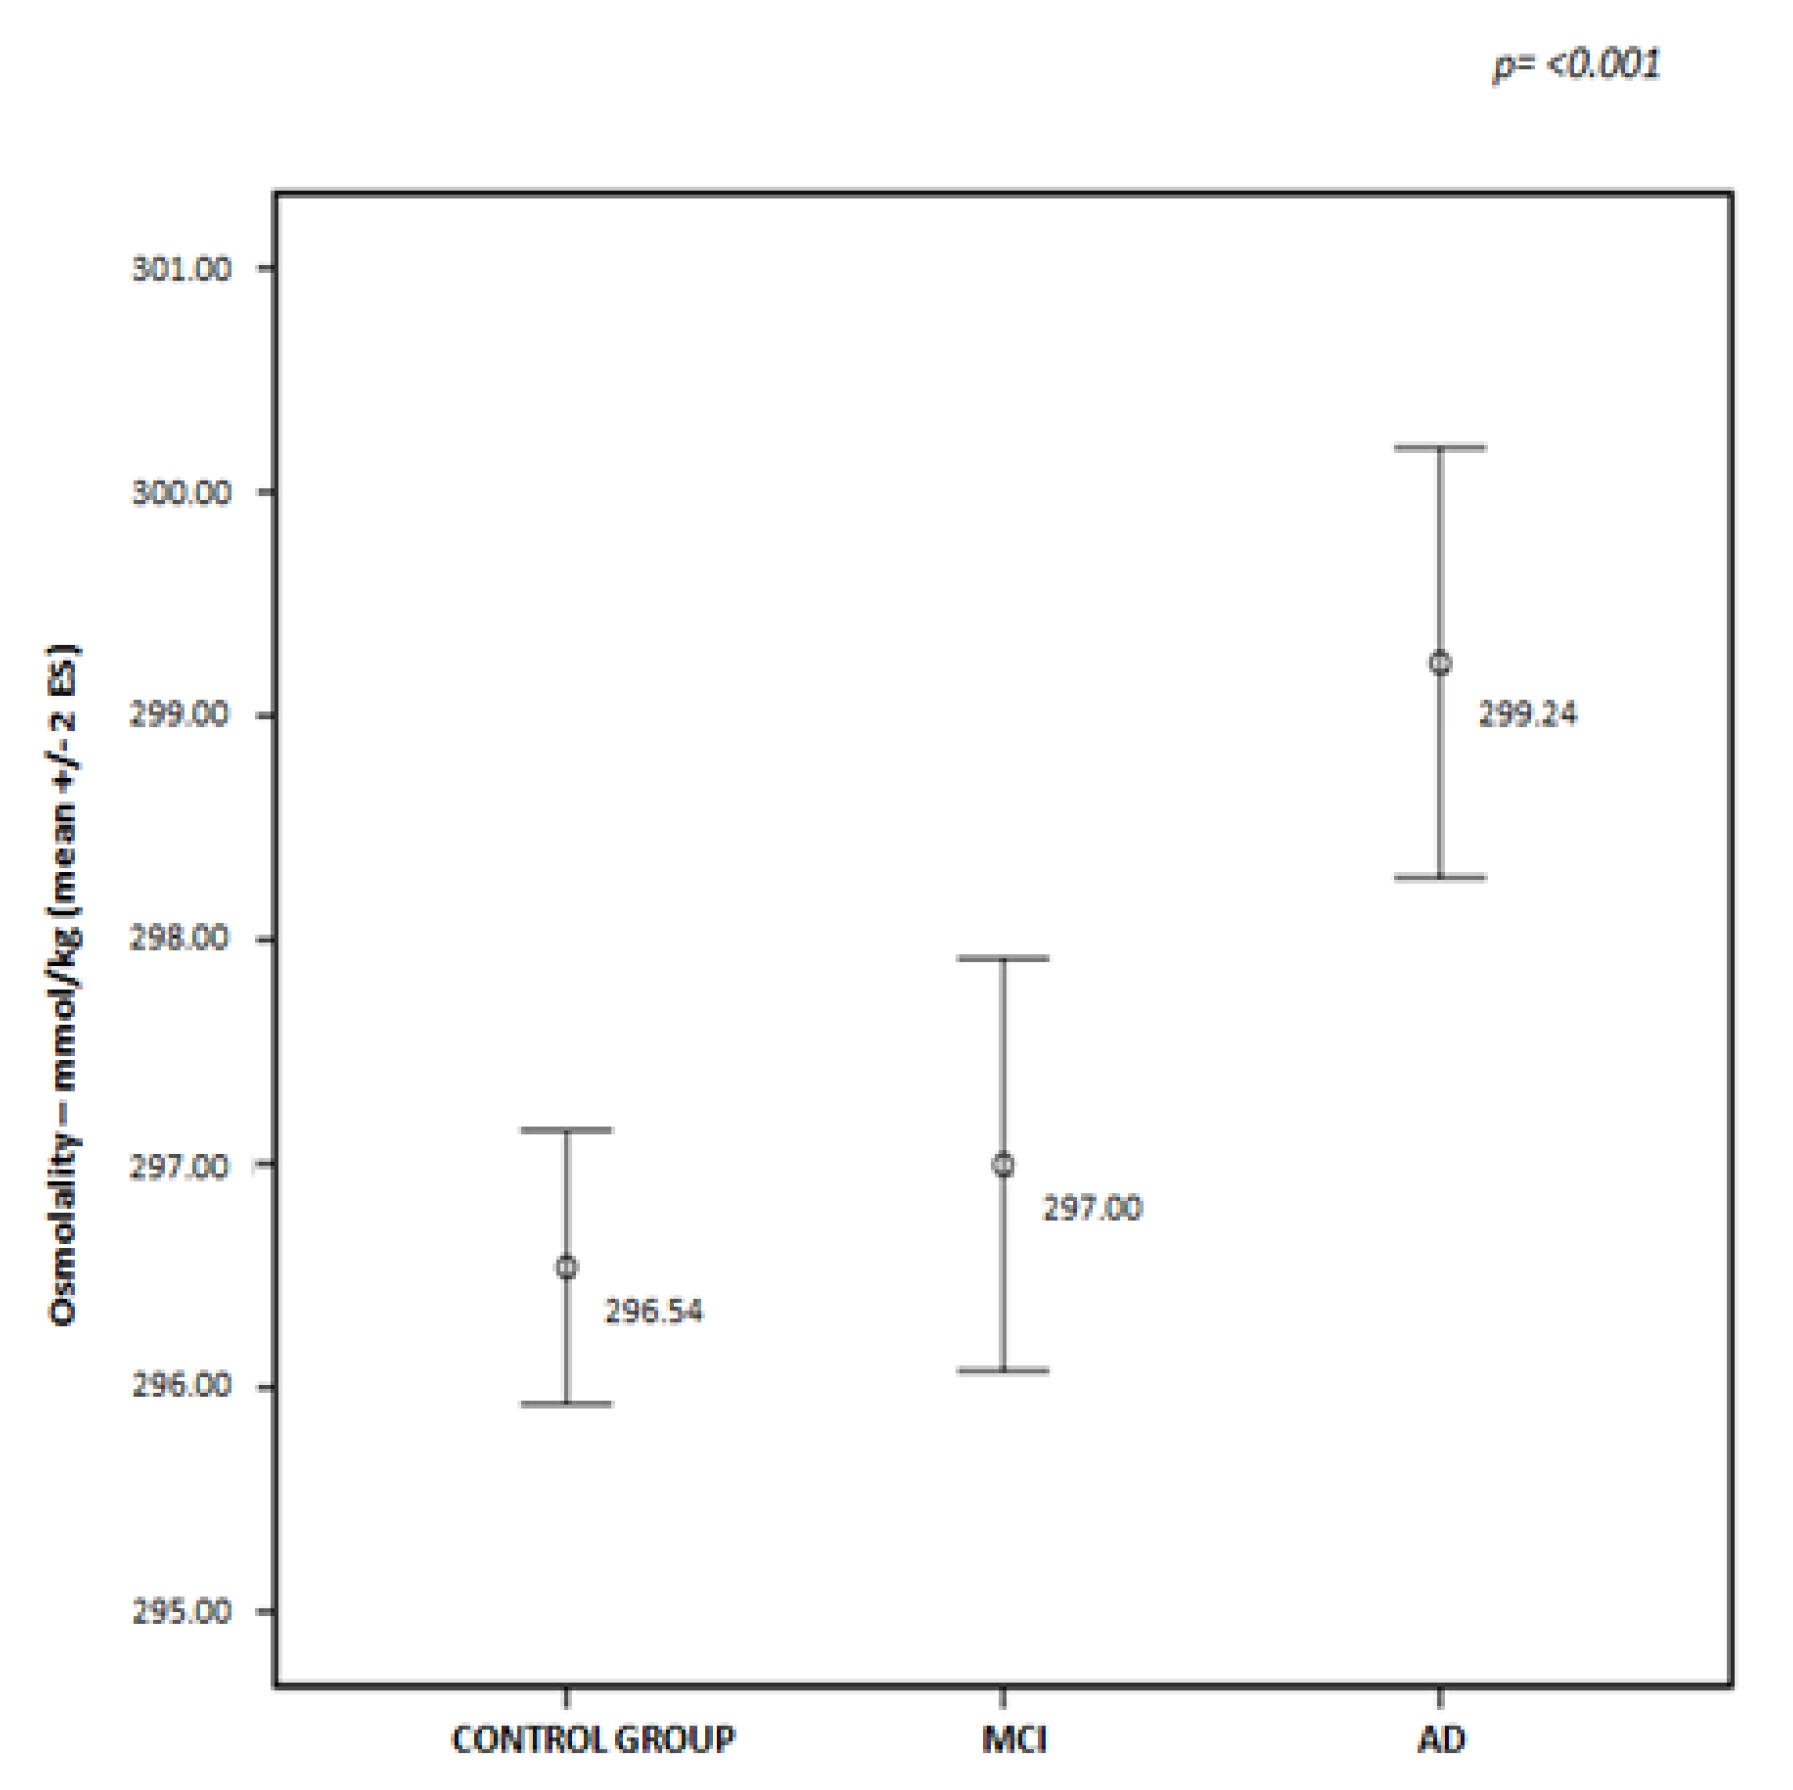
| Osmolality (mmol/kg) ** | 297.23 ± 4.43 (288.00–308.00) | 298.77 ± 6.44 (285.00–325.50) | 297.00 ± 4.05 (285.00–306.00) | 299.23 ± 5.30 (286.50–312.40) | 298.63 ± 5.66 (283.00–314.50) | 296.36 ± 4.23 (289.10–302.60) |
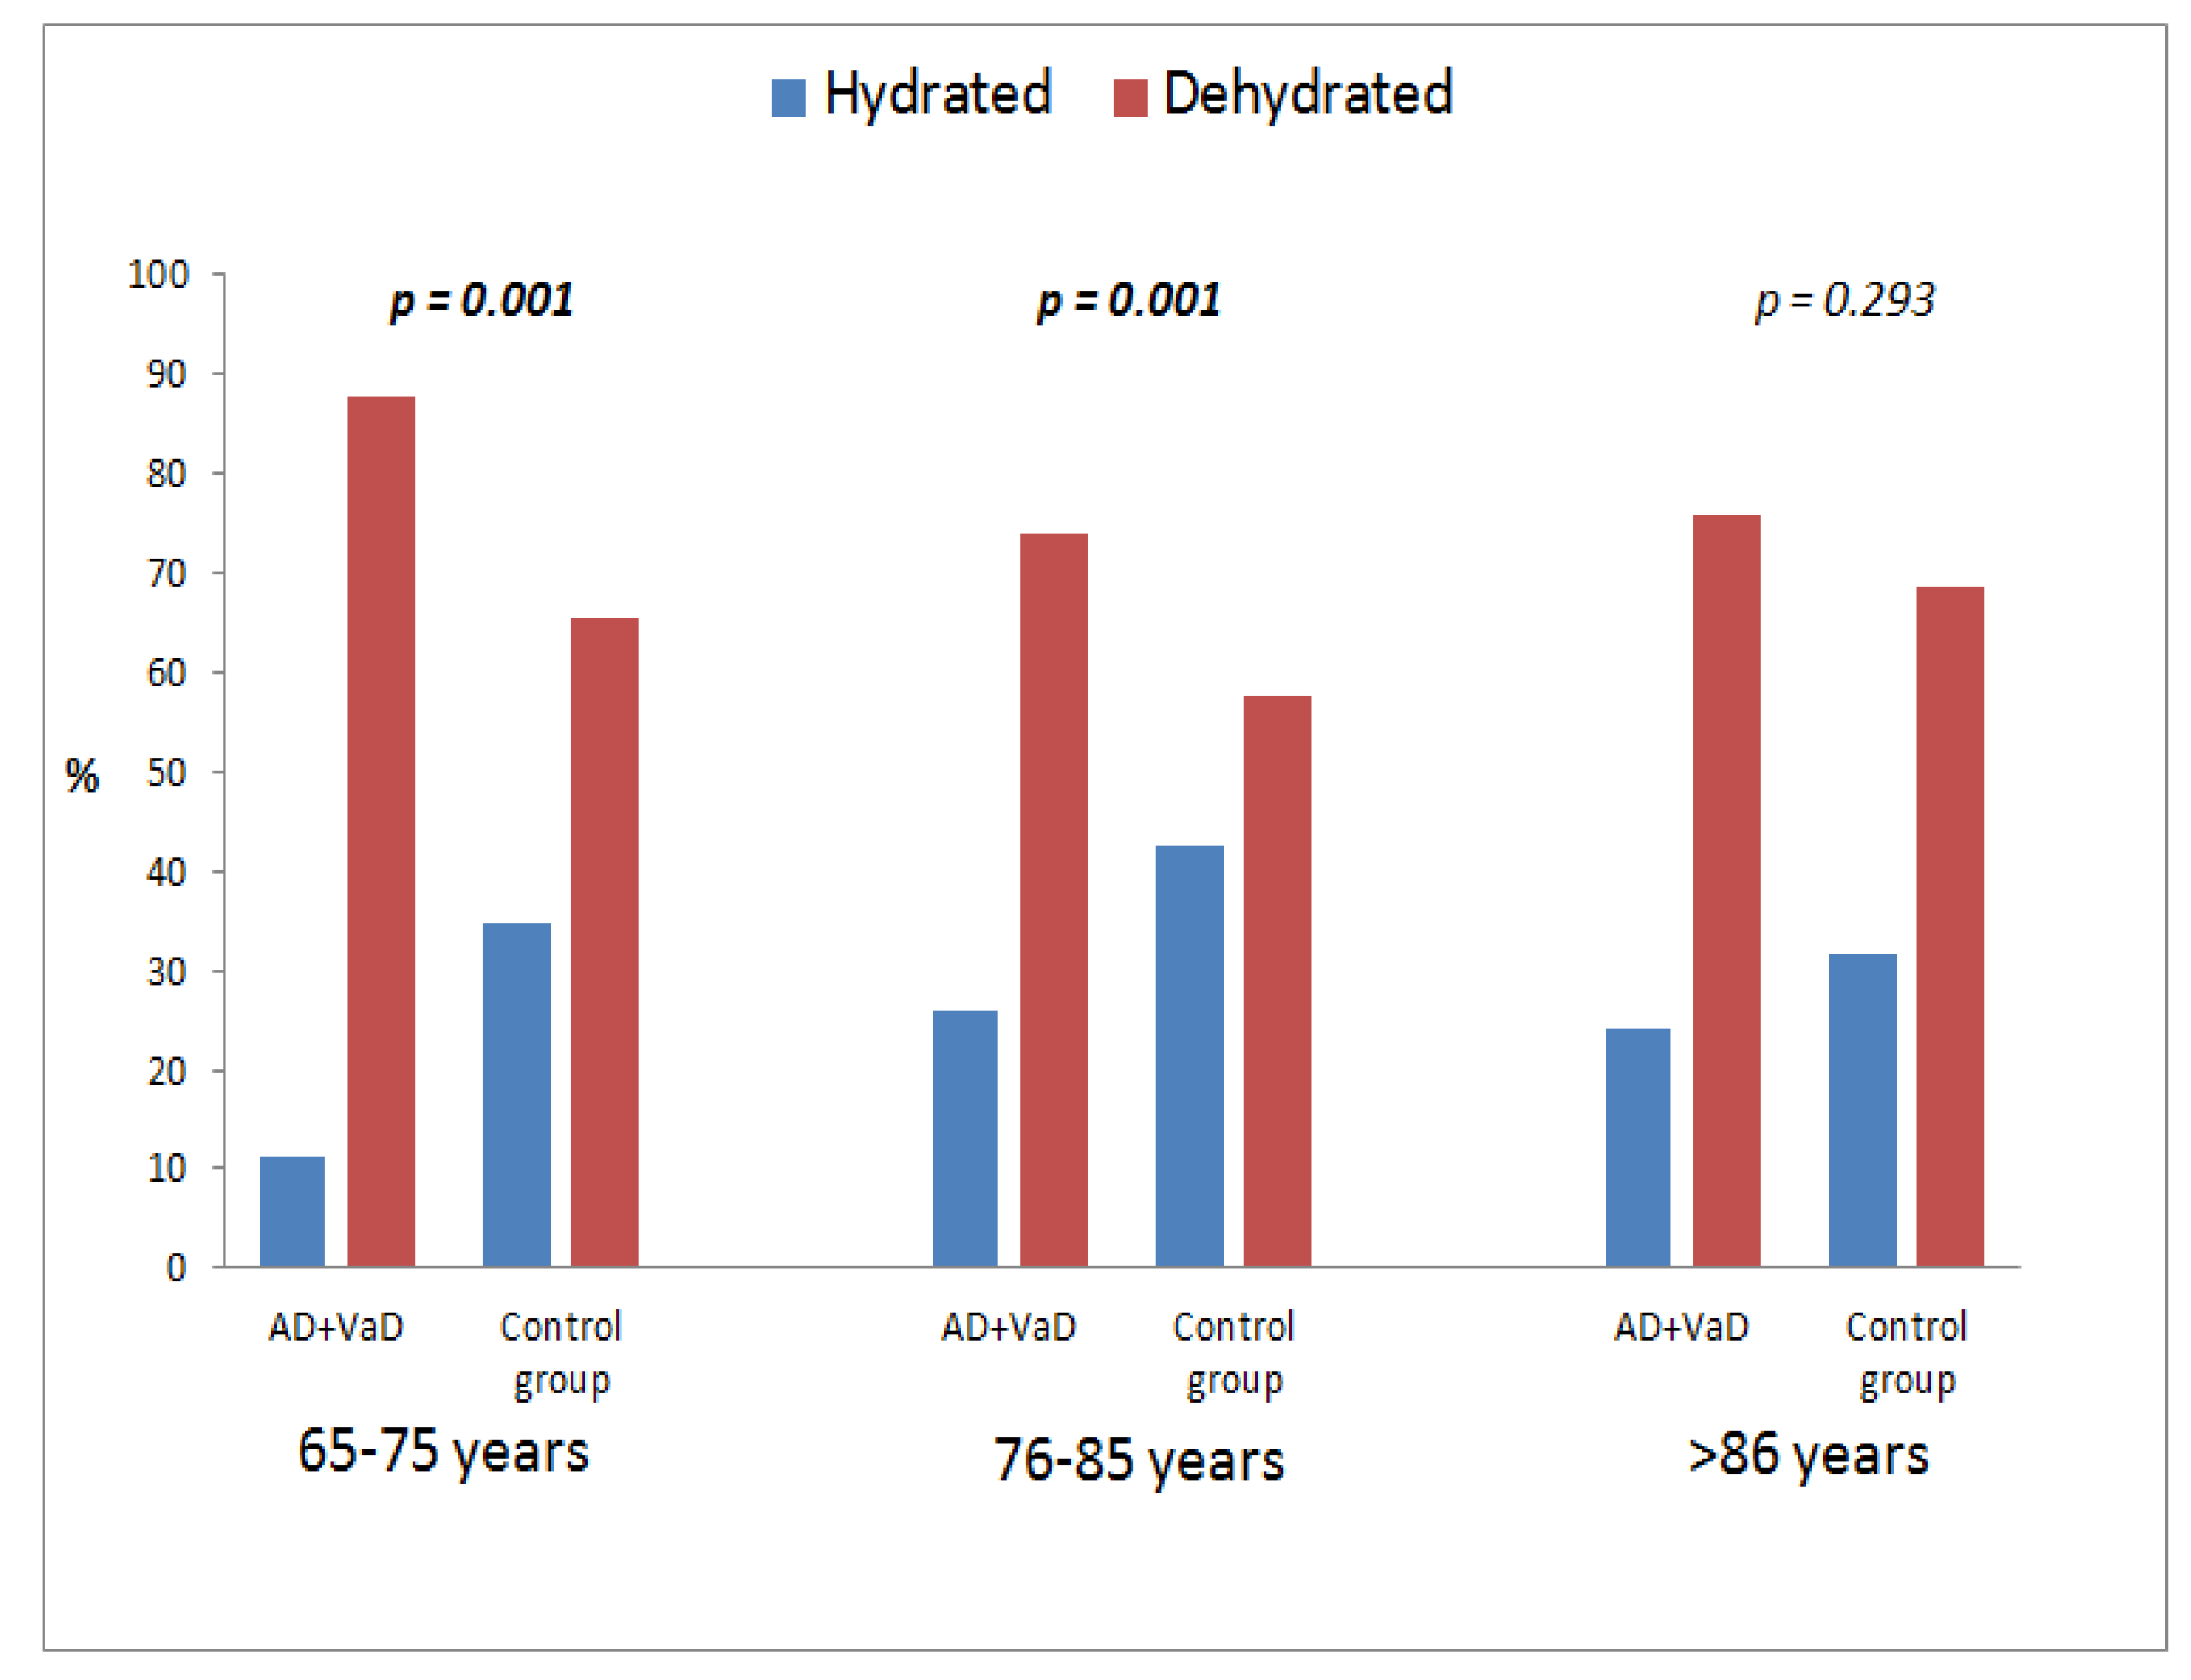
| Control Group n = 520 | AD + VaD n = 325 | OR | 95% CI | p-Value | |
|---|---|---|---|---|---|
| Hydrated * | 196 (37.7%) | 75 (23.1%) | 2.016 | 1.474–2.758 | <0.001 |
| Dehydrated * | 324 (62.3%) | 250 (76.9%) |
© 2018 by the authors. Licensee MDPI, Basel, Switzerland. This article is an open access article distributed under the terms and conditions of the Creative Commons Attribution (CC BY) license (http://creativecommons.org/licenses/by/4.0/).
Share and Cite
Lauriola, M.; Mangiacotti, A.; D’Onofrio, G.; Cascavilla, L.; Paris, F.; Paroni, G.; Seripa, D.; Greco, A.; Sancarlo, D. Neurocognitive Disorders and Dehydration in Older Patients: Clinical Experience Supports the Hydromolecular Hypothesis of Dementia. Nutrients 2018, 10, 562. https://0-doi-org.brum.beds.ac.uk/10.3390/nu10050562
Lauriola M, Mangiacotti A, D’Onofrio G, Cascavilla L, Paris F, Paroni G, Seripa D, Greco A, Sancarlo D. Neurocognitive Disorders and Dehydration in Older Patients: Clinical Experience Supports the Hydromolecular Hypothesis of Dementia. Nutrients. 2018; 10(5):562. https://0-doi-org.brum.beds.ac.uk/10.3390/nu10050562
Chicago/Turabian StyleLauriola, Michele, Antonio Mangiacotti, Grazia D’Onofrio, Leandro Cascavilla, Francesco Paris, Giulia Paroni, Davide Seripa, Antonio Greco, and Daniele Sancarlo. 2018. "Neurocognitive Disorders and Dehydration in Older Patients: Clinical Experience Supports the Hydromolecular Hypothesis of Dementia" Nutrients 10, no. 5: 562. https://0-doi-org.brum.beds.ac.uk/10.3390/nu10050562