Reproducibility of a Questionnaire for Dietary Habits, Lifestyle and Nutrition Knowledge Assessment (KomPAN) in Polish Adolescents and Adults

 ,
,  , , , ,
Abstract
:1. Introduction
2. Methods
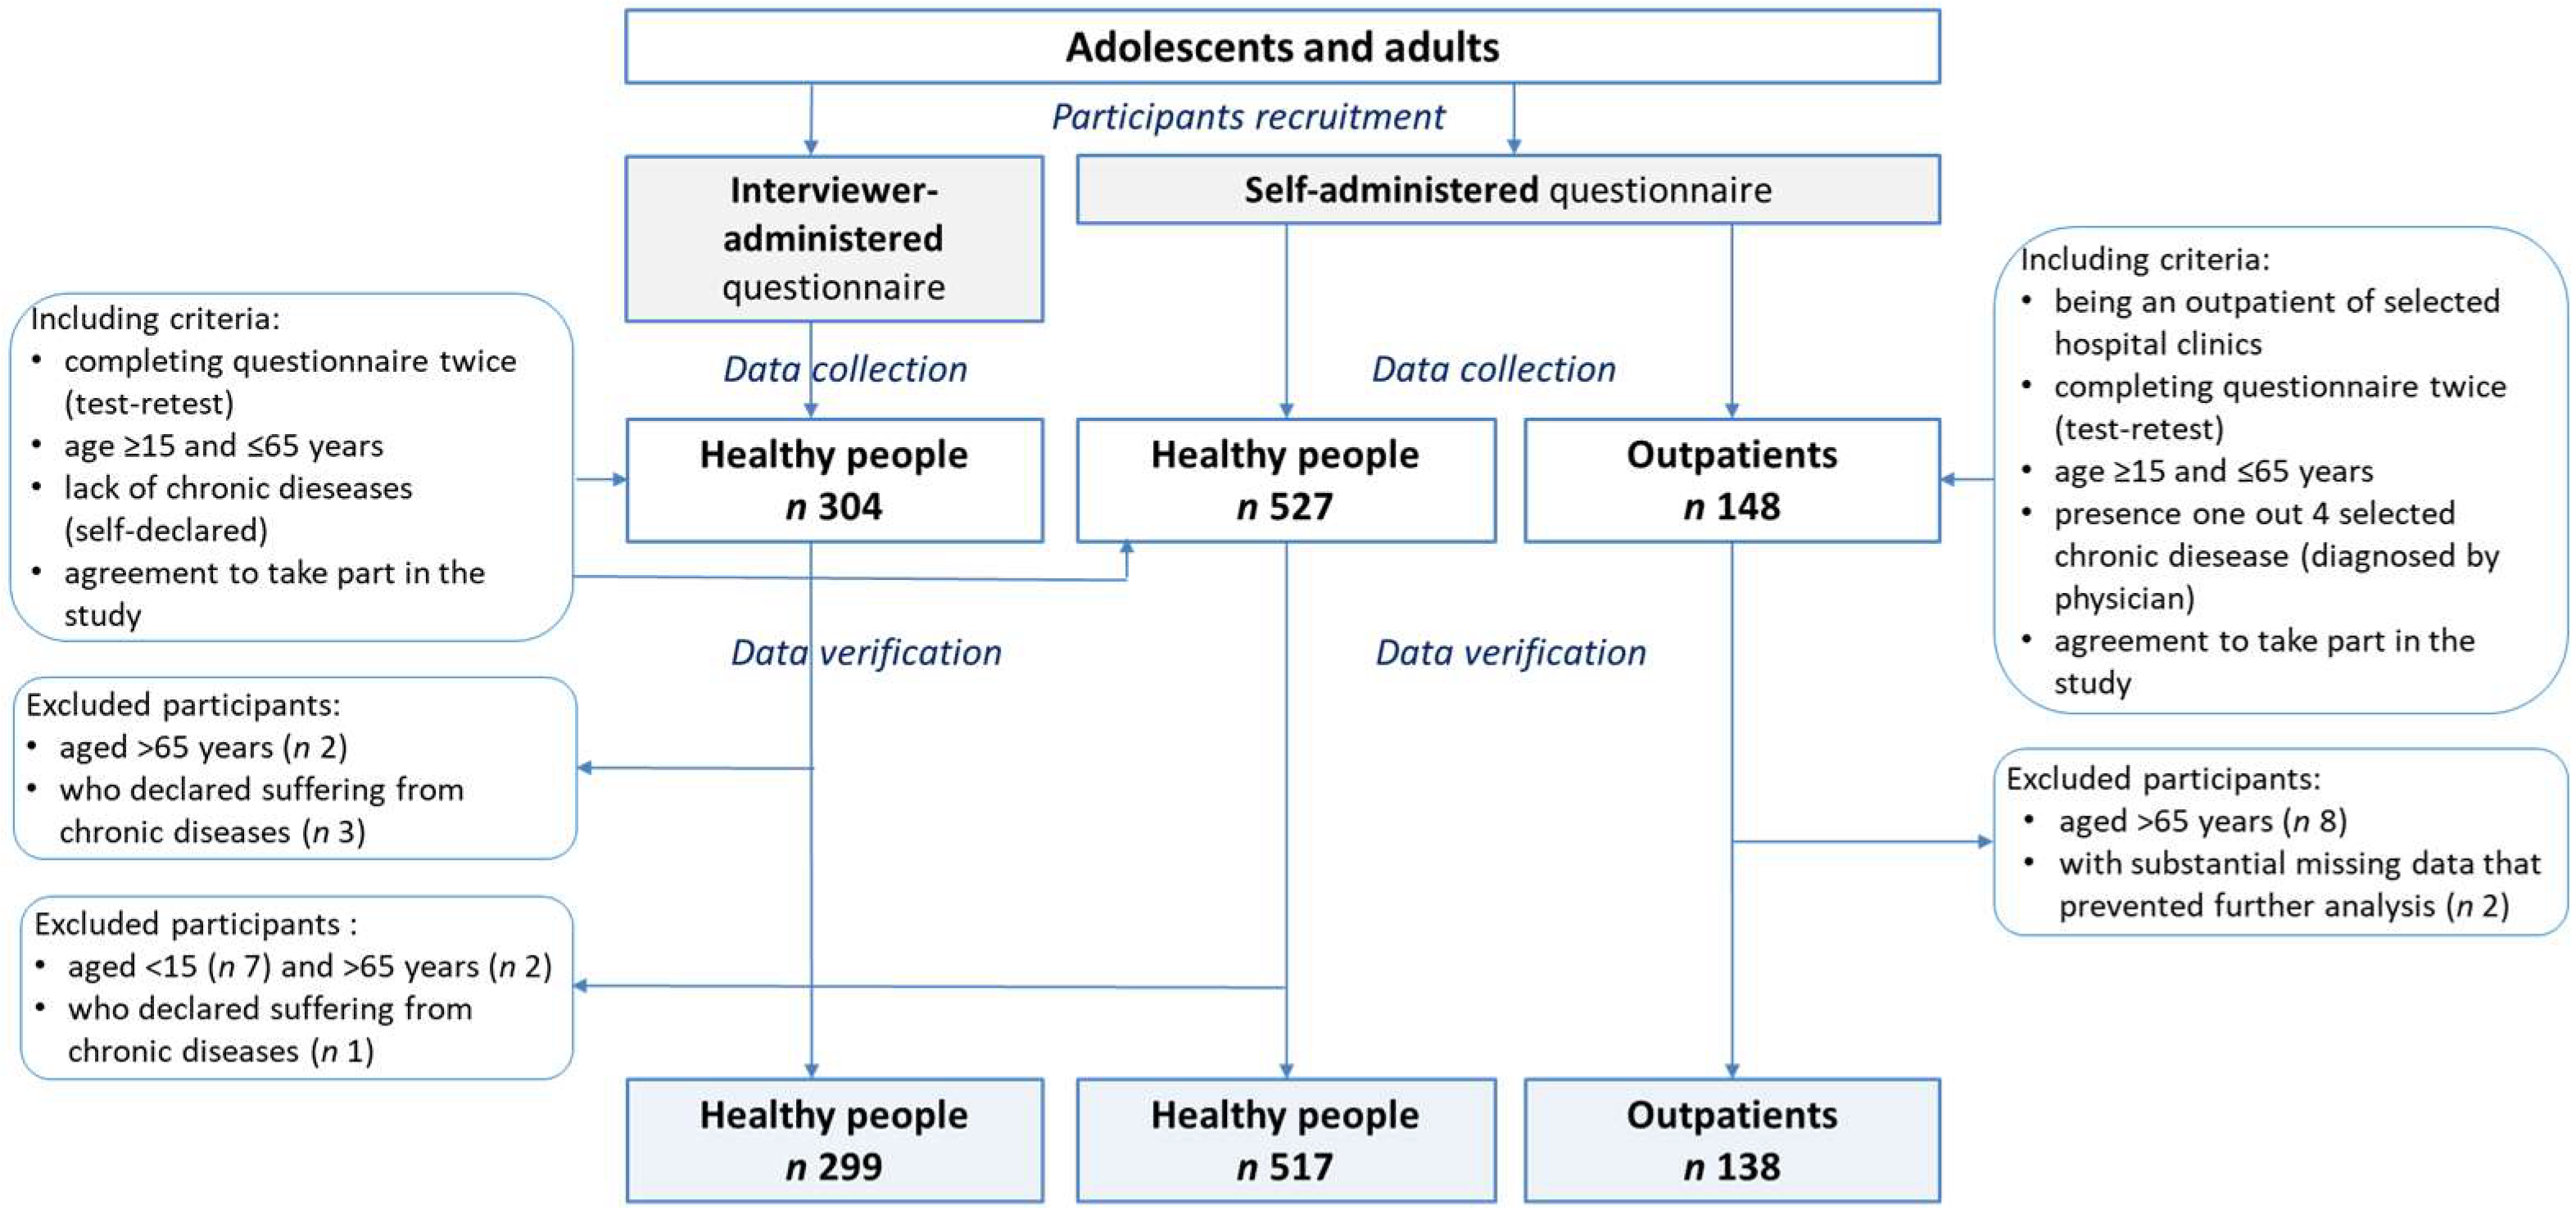
2.1. Participants and Study Design
2.2. The Dietary Habits and Nutrition Beliefs Questionnaire (KomPAN)
- dietary habits (11 questions; 3 of them (no.: 10, 12, 17) were multiple response questions and each response category was encoded in the database and analysed as an independent dichotomous question with no/yes answers–the respondent’s choice of a given category was coded in the database as the answer ‘yes’, while no selection of the given category as the answer ‘no’),
- food frequency consumption (33 questions),
- nutrition beliefs (25 questions),
- lifestyle and personal data (14/30 questions were analysed).
2.3. Statistical Analysis
3. Results
3.1. Characteristics of the Participants
3.2. Food Frequency Consumption
3.3. Other Dietary Habits
3.4. Lifestyle
3.5. Indexes Determined Based on the Questionnaire
4. Discussion
4.1. Interviewer-Administered vs. Self-Administered Questionnaire
4.2. Food Frequency Consumption
4.3. Other Dietary Habits
4.4. Diet Quality Scores
4.5. Nutrition Knowledge
4.6. Lifestyle
4.7. Strengths and Limitations
Supplementary Materials
Author Contributions
Funding
Acknowledgments
Conflicts of Interest
References
- Cade, J.E.; Burley, V.J.; Warm, D.L.; Thompson, R.L.; Margetts, B.M. Food-frequency questionnaires: A review of their design, validation and utilisation. Nutr. Res. Rev. 2004, 17, 5–22. [Google Scholar] [CrossRef] [PubMed]
- Thompson, F.E.; Byers, T. Dietary assessment resource manual. J. Nutr. 1994, 124, 2245–2317. [Google Scholar]
- Thompson, F.E.; Subar, A.F. Dietary assessment methodology. In Nutrition in the Prevention and Treatment of Disease, 2nd ed.; Coulston, A.M., Boushey, C.J., Eds.; Academic Press: San Diego, CA, USA, 2008; pp. 3–39. [Google Scholar]
- Gibson, R.S. Principles of Nutritional Assessment, 2nd ed.; Oxford University Press: New York, NY, USA, 2005. [Google Scholar]
- Handeland, K.; Kjellevold, M.; Markhus, M.W.; Graff, I.E.; Frøyland, L.; Lie, Ø.; Skotheim, S.; Stormark, K.M.; Dahl, L.; Øyen, J. A diet score assessing Norwegian adolescents’ adherence to dietary recommendations–Development and test-retest reproducibility of the score. Nutrients 2016, 8, 467. [Google Scholar] [CrossRef] [PubMed]
- Huybrechts, I.; Vereecken, C.; De Bacquer, D.; Vandevijvere, S.; Van Oyen, H.; Maes, L.; Vanhauwaert, E.; Temme, L.; De Backer, G.; De Henauw, S. Reproducibility and validity of a diet quality index for children assessed using a FFQ. Br. J. Nutr. 2010, 104, 135–144. [Google Scholar] [CrossRef] [PubMed] [Green Version]
- Wong, J.E.; Parnell, W.R.; Howe, A.S.; Black, K.E.; Skidmore, P.M. Development and validation of a food-based diet quality index for New Zealand adolescents. BMC Public Health 2013, 13, 1–10. [Google Scholar] [CrossRef] [PubMed]
- Athanasiadou, E.; Kyrkou, C.; Fotiou, M.; Tsakoumaki, F.; Dimitropoulou, A.; Polychroniadou, E.; Menexes, G.; Athanasiadis, A.P.; Biliaderis, C.G.; Michaelidou, A.M. Development and validation of a Mediterranean oriented culture-specific semi-quantitative food frequency questionnaire. Nutrients 2016, 8, 522. [Google Scholar] [CrossRef] [PubMed]
- Bjerregaard, A.A.; Tetens, I.; Olsen, S.F.; Halldorsson, T.I. Reproducibility of a web-based FFQ for 13 to 15-year-old Danish adolescents. J. Nutr. Sci. 2016, 5, e5. [Google Scholar] [CrossRef] [PubMed] [Green Version]
- Filippi, A.R.; Amodio, E.; Napoli, G.; Breda, J.; Bianco, A.; Jemni, M.; Censi, L.; Mammina, C.; Tabacchi, G. The web-based ASSO-food frequency questionnaire for adolescents: Relative and absolute reproducibility assessment. Nutr. J. 2014, 13, 119. [Google Scholar] [CrossRef] [PubMed] [Green Version]
- Ibiebele, T.I.; Parekh, S.; Mallitt, K.A.; Hughes, M.C.; O’Rourke, P.K.; Webb, P.M. Reproducibility of food and nutrient intake estimates using a semi-quantitative FFQ in Australian adults. Public Health Nutr. 2009, 12, 2359–2365. [Google Scholar] [CrossRef] [PubMed]
- Parr, C.L.; Veierød, M.B.; Laake, P.; Lund, E.; Hjartåker, A. Test-retest reproducibility of a food frequency questionnaire (FFQ) and estimated effects on disease risk in the Norwegian Women and Cancer Study (NOWAC). Nutr. J. 2006, 5, 4–13. [Google Scholar] [CrossRef] [PubMed] [Green Version]
- Farukuoye, M.; Strassburger, K.; Kacerovsky-Bielesz, G.; Giani, G.; Roden, M. Validity and reproducibility of an interviewer-administered food frequency questionnaire in Austrian adults at risk of or with overt diabetes mellitus. Nutr. Res. 2014, 34, 410–419. [Google Scholar] [CrossRef] [PubMed]
- Willett, W.C. Invited commentary: Comparison of food frequency questionnaires. Am. J. Epidemiol. 1998, 148, 1157e65. [Google Scholar] [CrossRef]
- Bowling, A. Mode of questionnaire administration can have serious effects on data quality. J. Public Health (Oxf.) 2005, 27, 281–291. [Google Scholar] [CrossRef] [PubMed] [Green Version]
- Gawęcki, J. (Ed.) Dietary Habits and Nutrition Beliefs Questionnaire and the Manual for Developing Nutritional Data; Committee of Human Nutrition Science, Polish Academy of Sciences: Olsztyn, Poland, 2018. [Google Scholar]
- Masson, L.F.; McNeill, G.; Tomany, J.O.; Simpson, J.A.; Peace, H.S.; Wie, L.; Grubb, D.A.; Bolton-Smith, C. Statistical approaches for assessing the relative validity of a food-frequency questionnaire: Use of correlation coefficients and the kappa statistic. Public Health Nutr. 2003, 6, 313–321. [Google Scholar] [CrossRef] [PubMed]
- Tavakol, M.; Dennick, R. Making sense of Cronbach’s alpha. Int. J. Med. Educ. 2011, 2, 53–55. [Google Scholar] [CrossRef] [PubMed]
- Cleghorn, C.L.; Harrison, R.A.; Ransley, J.K.; Wilkinson, S.; Thomas, J.; Cade, J.E. Can a dietary quality score derived from a short-form FFQ assess dietary quality in UK adult population surveys? Public Health Nutr. 2016, 19, 2915–2923. [Google Scholar] [CrossRef] [PubMed]
- Leighton, J.; Neugut, A.I.; Block, G. A comparison of face-to-face food frequency interviews with telephone interview and self-administered questionnaire. Am. J. Epidemiol. 1988, 128, 891. [Google Scholar]
- Shatenstein, B.; Ghadirian, P. Validity of a self-administered and an interviewer-administered food frequency questionnaire compared with 7-day estimated food records. J. Epidemiol. Biostat. 1996, 1, 89–98. [Google Scholar]
- Dehghan, M.; Ilow, R.; Zatonska, K.; Szuba, A.; Zhang, X.; Mente, A.; Regulska-Ilow, B. Development, reproducibility and validity of the food frequency questionnaire in the Poland arm of the Prospective Urban and Rural Epidemiological (PURE) study. J. Hum. Nutr. Diet. 2012, 25, 225–232. [Google Scholar] [CrossRef] [PubMed]
- Głąbska, D.; Książek, A.; Guzek, D. Development and Validation of the Brief Folate-Specific Food Frequency Questionnaire for Young Women’s Diet Assessment. Int. J. Environ. Res. Public Health 2017, 14, 1574. [Google Scholar] [CrossRef] [PubMed]
- Głąbska, D.; Staniec, A.; Guzek, D. Assessment of Validity and Reproducibility of the Zinc-Specific Dietary Intake Questionnaire Conducted for Young Polish Female Respondents. Nutrients 2018, 10, 104. [Google Scholar] [CrossRef] [PubMed]
- Szymelfejnik, E.J.; Wądołowska, L.; Cichon, R.; Przysławski, J.; Bolesławska, I. Dairy products frequency questionnnaire (ADOS-Ca) calibration for calcium intake evaluation. Pol. J. Food Nutr. Sci. 2006, 15, 229–236. [Google Scholar]
- Caan, B.J.; Lanza, E.; Schatzkin, A.; Coates, A.O.; Brewer, B.K.; Slattery, M.L.; Marshall, J.R.; Bloch, A. Does nutritionist review of a self-administered food frequency questionnaire improve data quality? Public Health Nutr. 1999, 2, 565–569. [Google Scholar] [CrossRef] [PubMed] [Green Version]
- Ortega, R.M.; Pérez-Rodrigo, C.; López-Sobaler, A.M. Dietary assessment methods: Dietary records. Nutr. Hosp. 2015, 31, 38–45. [Google Scholar] [CrossRef] [PubMed]
- Brennan, S.F.; Cantwell, M.M.; Cardwell, C.R.; Velentzis, L.S.; Woodside, J.V. Dietary patterns and breast cancer risk: A systematic review and meta-analysis. Am. J. Clin. Nutr. 2010, 91, 1294–1302. [Google Scholar] [CrossRef] [PubMed]
- Hu, F.B. Dietary pattern analysis: A new direction in nutritional epidemiology. Curr. Opin. Lipidol. 2002, 13, 3–9. [Google Scholar] [CrossRef] [PubMed]
- Kant, A.K.; Graubard, B.I. A comparison of three dietary pattern indexes for predicting biomarkers of diet and disease. J. Am. Coll. Nutr. 2005, 24, 294–303. [Google Scholar] [CrossRef] [PubMed]
- Kant, A.K. Dietary patterns: Biomarkers and chronic disease risk. Appl. Physiol. Nutr. Metab. 2010, 35, 199–206. [Google Scholar] [CrossRef] [PubMed]
- Waijers, P.M.; Feskens, E.J.; Ocké, M.C. A critical review of predefined diet quality scores. Br. J. Nutr. 2007, 97, 219–231. [Google Scholar] [CrossRef] [PubMed]
- Wirfält, E.; Drake, I.; Wallström, P. What do review papers conclude about food and dietary patterns? Food Nutr. Res. 2013, 57, 1–14. [Google Scholar] [CrossRef] [PubMed]
- Wirt, A.; Collins, C.E. Diet quality what is it and does it matter? Public Health Nutr. 2009, 12, 2473–2492. [Google Scholar] [CrossRef] [PubMed]
- Bjørnarå, H.B.; Hillesund, E.R.; Torstveit, M.K.; Stea, T.H.; Øverby, N.C.; Bere, E. An assessment of the test-retest reliability of the New Nordic Diet score. Food Nutr. Res. 2015, 59, 28397. [Google Scholar] [CrossRef] [PubMed] [Green Version]
- Turconi, G.; Celsa, M.; Rezzani, C.; Biino, G.; Sartirana, M.A.; Roggi, C. Reliability of a dietary questionnaire on food habits, eating behaviour and nutritional knowledge of adolescents. Eur. J. Clin. Nutr. 2003, 57, 753–763. [Google Scholar] [CrossRef] [PubMed] [Green Version]
- Alsaffar, A.A. Validation of a general nutrition knowledge questionnaire in a Turkish student sample. Public Health Nutr. 2012, 15, 2074–2085. [Google Scholar] [CrossRef] [PubMed] [Green Version]
- Kliemann, N.; Wardle, J.; Johnson, F.; Croker, H. Reliability and validity of a revised version of the General Nutrition Knowledge Questionnaire. Eur. J. Clin. Nutr. 2016, 70, 1174–1180. [Google Scholar] [CrossRef] [PubMed] [Green Version]
- Parmenter, K.; Wardle, J. Development of a general nutrition knowledge questionnaire for adults. Eur. J. Clin. Nutr. 1999, 53, 298–308. [Google Scholar] [CrossRef] [PubMed] [Green Version]
- Feren, A.; Torheim, L.E.; Lillegaard, I.T. Development of a nutrition knowledge questionnaire for obese adults. Food Nutr. Res. 2011, 55, 7271. [Google Scholar] [CrossRef] [PubMed] [Green Version]
- Bradette-Laplante, M.; Carbonneau, É.; Provencher, V.; Bégin, C.; Robitaille, J.; Desroches, S.; Vohl, M.C.; Corneau, L.; Lemieux, S. Development and validation of a nutrition knowledge questionnaire for a Canadian population. Public Health Nutr. 2017, 20, 1184–1192. [Google Scholar] [CrossRef] [PubMed]
- Wądołowska, L. Validation of food frequency questionnaire (FFQ). Reproducibility assessment. Bromat. Chem. Toksykol. 2005, 38, 27–33, (Abstract in English). [Google Scholar]
- Kant, A.K. Indexes of overall diet quality: A. review. J. Am. Diet. Assoc. 1996, 96, 785–791. [Google Scholar] [CrossRef]
- Kant, A.K. Dietary patterns and health outcomes. J. Am. Diet. Assoc. 2004, 104, 615–635. [Google Scholar] [CrossRef] [PubMed]
- Collins, C.E.; Burrows, T.L.; Rollo, M.E.; Boggess, M.M.; Watson, J.F.; Guest, M.; Duncanson, K.; Pezdirc, K.; Hutchesson, M.J. The comparative validity and reproducibility of a diet quality index for adults: The Australian Recommended Food Score. Nutrients 2015, 7, 785–798. [Google Scholar] [CrossRef] [PubMed]
- Rolstad, S.; Adler, J.; Rydén, A. Response burden and questionnaire length: Is shorter better? A review and meta-analysis. Value Health 2011, 14, 1101–1108. [Google Scholar] [CrossRef] [PubMed]
- Lombard, M.J.; Steyn, N.P.; Charlton, K.E.; Senekal, M. Application and interpretation of multiple statistical tests to evaluate validity of dietary intake assessment methods. Nutr. J. 2015, 14, 40–50. [Google Scholar] [CrossRef] [PubMed] [Green Version]


| Physical Activity at Work/School | Physical Activity at Leisure Time | ||
|---|---|---|---|
| Low | Moderate | High | |
| Low | Low | Low | Moderate |
| Moderate | Low | Moderate | Moderate |
| High | Moderate | Moderate | High |
| Interviewer-Administered Questionnaire | Self-Administered Questionnaire | p | |||||
|---|---|---|---|---|---|---|---|
| Healthy People | Healthy People | Outpatients # | |||||
| n | % | n | % | n | % | ||
| Sample size | 299 | 100.0 | 517 | 100.0 | 138 | 100.0 | |
| Sex | |||||||
| male | 146 | 48.8 | 227 | 43.9 | 67 | 48.6 | ns |
| female | 153 | 51.2 | 290 | 56.1 | 71 | 51.4 | |
| Age (years) † | 36.3 (14.6) | 30.2 (15.0) | 41.9 (12.0) | **** | |||
| Age (years) | |||||||
| 15–24 | 100 | 33.4 | 291 | 56.3 | 18 | 13.1 | **** |
| 25–44 | 103 | 34.5 | 107 | 20.7 | 62 | 44.9 | |
| 45–65 | 96 | 32.1 | 119 | 23.0 | 58 | 42.0 | |
| Place of residence ‡ | |||||||
| village | 74 | 24.8 | 185 | 35.8 | 26 | 19.0 | **** |
| small town (<20,000 inhabitants) | 65 | 21.8 | 81 | 15.7 | 17 | 12.4 | |
| town (20,000–100,000 inhabitants) | 58 | 19.5 | 112 | 21.6 | 24 | 17.5 | |
| city (>100,000 inhabitants) | 101 | 33.9 | 139 | 26.9 | 70 | 51.1 | |
| Economic situation of family ‡ | |||||||
| below average | 15 | 5.0 | 30 | 5.8 | 12 | 8.7 | ns |
| average | 216 | 72.5 | 381 | 73.7 | 98 | 71.0 | |
| above average | 67 | 22.5 | 106 | 20.5 | 28 | 20.3 | |
| Economic situation of household | |||||||
| we live modestly or very modestly | 19 | 6.4 | 27 | 5.2 | 8 | 5.8 | ns |
| we live normally | 123 | 41.1 | 210 | 40.6 | 75 | 54.4 | |
| we live relatively wealthy | 137 | 45.8 | 241 | 46.6 | 46 | 33.3 | |
| we live very wealthy | 20 | 6.7 | 39 | 7.6 | 9 | 6.5 | |
| Occupation status (adults) ‡ | |||||||
| retired/receiving a disability living allowance | 17 | 5.9 | 22 | 6.3 | 8 | 5.8 | **** |
| unemployed/maternity leave/other | 63 | 22.0 | 121 | 34.7 | 14 | 10.1 | |
| temporary employed | 50 | 17.4 | 26 | 7.4 | 11 | 8.0 | |
| permanently employed | 157 | 54.7 | 180 | 51.6 | 105 | 76.1 | |
| Education level (adults) ‡ | |||||||
| primary | 32 | 11.2 | 23 | 6.3 | 5 | 3.6 | * |
| lower secondary | 26 | 9.1 | 23 | 6.3 | 17 | 12.3 | |
| upper secondary | 100 | 35.0 | 126 | 34.5 | 54 | 39.2 | |
| higher | 128 | 44.7 | 193 | 52.9 | 62 | 44.9 | |
| No. | Questionnaire Items | Interviewer-Administered Questionnaire Healthy People (n 299) | Self-Administered Questionnaire Healthy People (n 517) | Self-Administered Questionnaire Outpatients # (n 138) | ||||||||||||
|---|---|---|---|---|---|---|---|---|---|---|---|---|---|---|---|---|
| Test | Retest | p | Test | Retest | p | Test | Retest | p | ||||||||
| Mean | Q25–Q75 | Mean | Q25–Q75 | Mean | Q25–Q75 | Mean | Q25–Q75 | Mean | Q25–Q75 | Mean | Q25–Q75 | |||||
| Indexes (in points) | ||||||||||||||||
| pHDI-10 † | 24.7 | (14.9–33.8) | 24.4 | (15.1–32.4) | ns | 24.9 | (15.6–31.3) | 24.3 | (15.2–30.9) | ns | 22.3 | (14.4–29.5) | 21.8 | (13.8–28.9) | ns | |
| nHDI-14 ‡ | 18.0 | (12.1–23.4) | 17.4 | (11.4–22.1) | * | 18.5 | (11.8–23.9) | 17.6 | (10.9–22.9) | *** | 16.5 | (12.3–20.9) | 15.9 | (11.1–20.6) | ns | |
| Nutrition knowledge score § | 14.1 | (11.0–18.0) | 14.4 | (11.0–18.0) | * | 13.3 | (10.0–17.0) | 13.5 | (10.0–17.0) | ns | 12.9 | (10.0–15.0) | 13.4 | (11.0–16.0) | ** | |
| Food frequency consumption ¶ (times/day) | ||||||||||||||||
| 53 | Water | 1.17 | (0.50–2.00) | 1.17 | (0.50–2.00) | ns | 1.27 | (0.50–2.00) | 1.23 | (0.50–2.00) | ns | 1.38 | (0.50–2.00) | 1.29 | (0.50–2.00) | ns |
| 43 | Vegetables | 1.03 | (0.50–2.00) | 1.00 | (0.50–2.00) | ns | 0.92 | (0.50–1.00) | 0.92 | (0.50–1.00) | ns | 0.82 | (0.50–1.00) | 0.73 | (0.50–1.00) | * |
| 42 | Fruit | 0.99 | (0.50–2.00) | 0.97 | (0.50–2.00) | ns | 0.96 | (0.50–2.00) | 0.94 | (0.50–1.00) | ns | 0.72 | (0.50–1.00) | 0.72 | (0.50–1.00) | ns |
| 50 | Sweetened hot beverages | 0.92 | (0.06–2.00) | 0.96 | (0.06–2.00) | ns | 1.02 | (0.06–2.00) | 0.97 | (0.06–2.00) | ns | 0.90 | (0.00–2.00) | 0.95 | (0.00–2.00) | ns |
| 22 | White bread | 0.85 | (0.14–2.00) | 0.79 | (0.14–1.00) | * | 0.91 | (0.14–2.00) | 0.84 | (0.14–1.00) | ** | 0.94 | (0.50–2.00) | 0.89 | (0.14–2.00) | ns |
| 35 | Cold meats, smoked sausages, hot-dogs | 0.66 | (0.50–1.00) | 0.60 | (0.14–0.50) | * | 0.68 | (0.14–1.00) | 0.62 | (0.14–1.00) | ** | 0.62 | (0.50–1.00) | 0.62 | (0.14–1.00) | ns |
| 31 | Milk | 0.65 | (0.14–1.00) | 0.63 | (0.14–1.00) | ns | 0.68 | (0.14–1.00) | 0.62 | (0.14–1.00) | ** | 0.58 | (0.06–1.00) | 0.55 | (0.06–1.00) | ns |
| 28 | Butter | 0.64 | (0.06–1.00) | 0.64 | (0.06–1.00) | ns | 0.72 | (0.06–1.00) | 0.65 | (0.06–1.00) | *** | 0.97 | (0.50–2.00) | 0.89 | (0.14–2.00) | ns |
| 30 | Vegetable oils, margarines, mixes of butter and margarines | 0.60 | (0.14–1.00) | 0.57 | (0.06–1.00) | ns | 0.48 | (0.06–0.50) | 0.49 | (0.06–0.50) | ns | 0.57 | (0.14–1.00) | 0.49 | (0.06–0.50) | ns |
| 23 | Wholemeal bread | 0.58 | (0.06–1.00) | 0.57 | (0.06–1.00) | ns | 0.57 | (0.06–1.00) | 0.54 | (0.06–0.50) | * | 0.57 | (0.06–1.00) | 0.52 | (0.06–1.00) | ns |
| 44 | Sweets | 0.57 | (0.14–1.00) | 0.54 | (0.14–1.00) | ns | 0.69 | (0.14–1.00) | 0.65 | (0.14–1.00) | * | 0.46 | (0.06–0.50) | 0.43 | (0.06–0.50) | ns |
| 34 | Cheese | 0.44 | (0.14–0.50) | 0.40 | (0.14–0.50) | ** | 0.46 | (0.14–0.50) | 0.45 | (0.14–0.50) | ns | 0.39 | (0.14–0.50) | 0.40 | (0.14–0.50) | ns |
| 32 | Fermented milk beverages | 0.43 | (0.14–0.50) | 0.42 | (0.14–0.50) | ns | 0.50 | (0.14–0.50) | 0.47 | (0.14–0.50) | ns | 0.44 | (0.06–0.50) | 0.45 | (0.14–0.50) | ns |
| 37 | White meat | 0.41 | (0.14–0.50) | 0.42 | (0.14–0.50) | ns | 0.43 | (0.14–0.50) | 0.43 | (0.14–0.50) | ns | 0.44 | (0.50–0.50) | 0.50 | (0.50–0.50) | * |
| 41 | Potatoes (excluding chips and crisps) | 0.40 | (0.14–0.50) | 0.42 | (0.14–0.50) | ns | 0.44 | (0.14–0.50) | 0.44 | (0.14–0.50) | ns | 0.35 | (0.14–0.50) | 0.35 | (0.14–0.50) | ns |
| 48 | Fruit juices | 0.36 | (0.06-0.50) | 0.37 | (0.06–0.50) | ns | 0.48 | (0.06–0.50) | 0.46 | (0.06–0.50) | ns | 0.61 | (0.14–1.00) | 0.54 | (0.06–0.50) | * |
| 24 | White rice, white pasta, fine-ground groats | 0.35 | (0.14–0.50) | 0.35 | (0.06–0.50) | ns | 0.28 | (0.06–0.50) | 0.28 | (0.06–0.50) | ns | 0.29 | (0.06–0.50) | 0.31 | (0.14–0.50) | ns |
| 27 | Fried foods | 0.35 | (0.14–0.50) | 0.36 | (0.14–0.50) | ns | 0.35 | (0.14–0.50) | 0.32 | (0.14–0.50) | ** | 0.28 | (0.06–0.50) | 0.26 | (0.06–0.50) | ns |
| 39 | Eggs | 0.33 | (0.14–0.50) | 0.32 | (0.14–0.50) | ns | 0.29 | (0.14–0.50) | 0.30 | (0.14–0.50) | ns | 0.28 | (0.14–0.50) | 0.28 | (0.14–0.50) | ns |
| 36 | Red meat | 0.32 | (0.06–0.50) | 0.32 | (0.06–0.50) | ns | 0.26 | (0.06–0.50) | 0.26 | (0.06–0.50) | ns | 0.26 | (0.06–0.50) | 0.27 | (0.06–0.50) | ns |
| 33 | Fresh cheese curd products | 0.30 | (0.06–0.50) | 0.30 | (0.06–0.50) | ns | 0.39 | (0.06–0.50) | 0.36 | (0.06–0.50) | ns | 0.32 | (0.06–0.50) | 0.33 | (0.14–0.50) | ns |
| 51 | Sweetened beverages | 0.30 | (0.06–0.50) | 0.29 | (0.00–0.50) | ns | 0.32 | (0.06–0.50) | 0.30 | (0.06–0.50) | ns | 0.15 | (0.00–0.14) | 0.13 | (0.00–0.06) | ns |
| 25 | Buckwheat, oats, wholegrain pasta, other coarse-ground groats | 0.29 | (0.06–0.50) | 0.28 | (0.06–0.50) | ns | 0.25 | (0.06–0.50) | 0.25 | (0.06–0.50) | ns | 0.29 | (0.06–0.50) | 0.30 | (0.06–0.50) | ns |
| 47 | Tinned vegetables | 0.17 | (0.06–0.14) | 0.17 | (0.06–0.14) | ns | 0.16 | (0.00–0.14) | 0.17 | (0.06–0.14) | ns | 0.22 | (0.06–0.50) | 0.23 | (0.06–0.50) | ns |
| 54 | Alcoholic beverages | 0.17 | (0.06–0.14) | 0.15 | (0.06–0.14) | ns | 0.16 | (0.00–0.14) | 0.18 | (0.00–0.14) | ns | 0.10 | (0.06–0.14) | 0.09 | (0.00–0.06) | ns |
| 38 | Fish | 0.16 | (0.06–0.14) | 0.16 | (0.06–0.14) | ns | 0.16 | (0.06–0.14) | 0.17 | (0.06–0.14) | ns | 0.17 | (0.06–0.14) | 0.17 | (0.06–0.14) | ns |
| 49 | Vegetable juices, fruit and vegetable juices | 0.16 | (0.00–0.14) | 0.19 | (0.00–0.14) | ns | 0.16 | (0.00–0.14) | 0.20 | (0.00–0.14) | ** | 0.15 | (0.00–0.14) | 0.15 | (0.00–0.14) | ns |
| 26 | Fast foods | 0.13 | (0.06–0.14) | 0.12 | (0.06–0.14) | ns | 0.10 | (0.06–0.06) | 0.10 | (0.06–0.06) | ns | 0.05 | (0.00–0.06) | 0.05 | (0.00–0.06) | ns |
| 29 | Lard | 0.11 | (0.00–0.06) | 0.12 | (0.00–0.06) | ns | 0.05 | (0.00–0.06) | 0.08 | (0.00–0.06) | * | 0.04 | (0.00–0.06) | 0.03 | (0.00–0.06) | ns |
| 40 | Pulse-based foods | 0.11 | (0.06–0.14) | 0.12 | (0.06–0.14) | ns | 0.13 | (0.06–0.14) | 0.15 | (0.06–0.14) | * | 0.09 | (0.00–0.06) | 0.08 | (0.06–0.06) | ns |
| 52 | Energy drinks | 0.10 | (0.00–0.06) | 0.10 | (0.00–0.06) | ns | 0.12 | (0.00–0.06) | 0.12 | (0.00–0.06) | ns | 0.02 | (0.00–0.00) | 0.01 | (0.00–0.00) | ns |
| 45 | Instant soups, ready-made soups | 0.08 | (0.00–0.06) | 0.09 | (0.00–0.06) | ns | 0.07 | (0.00–0.06) | 0.09 | (0.00–0.06) | ns | 0.20 | (0.00–0.14) | 0.23 | (0.00–0.50) | ns |
| 46 | Tinned meat | 0.07 | (0.00–0.06) | 0.07 | (0.00–0.06) | * | 0.06 | (0.00–0.06) | 0.08 | (0.00–0.06) | ns | 0.04 | (0.00–0.06) | 0.07 | (0.00–0.06) | ns |
| No. | Questionnaire Items | Cat. | Interviewer-Administered Questionnaire Healthy People (n 299) | Self-Administered Questionnaire Healthy People (n 517) | Self-Administered Questionnaire Outpatients # (n 138) | |||||||||
|---|---|---|---|---|---|---|---|---|---|---|---|---|---|---|
| Total Agreement | Misclassification | Total Agreement | Misclassification | Total Agreement | Misclassification | |||||||||
| ±1 Cat. | ±2 Cat. | ±3 Cat. or More | ±1 Cat. | ±2 Cat. | ±3 Cat. or More | ±1 Cat. | ±2 Cat. | ±3 Cat. or More | ||||||
| Indexes | ||||||||||||||
| nHDI-14 (a priori categories) † | 3 | 97.3 | 2.7 | 0.0 | 96.1 | 3.9 | 0.0 | 98.6 | 1.4 | 0.0 | ||||
| pHDI-10 (a priori categories) ‡ | 3 | 93.0 | 7.0 | 0.0 | 90.1 | 9.9 | 0.0 | 83.3 | 16.7 | 0.0 | ||||
| Physical activity level § | 3 | 91.3 | 8.7 | 0.0 | 87.4 | 12.4 | 0.2 | 79.4 | 20.6 | 0.0 | ||||
| Nutrition knowledge level ¶ | 3 | 83.9 | 16.1 | 0.0 | 83.0 | 16.2 | 0.8 | 75.4 | 24.6 | 0.0 | ||||
| pHDI-10 (tertiles) ¥ | 3 | 83.3 | 15.7 | 1.0 | 77.6 | 20.3 | 2.1 | 63.0 | 34.1 | 2.9 | ||||
| nHDI-14 (tertiles) ¥ | 3 | 77.6 | 20.7 | 1.7 | 77.4 | 19.7 | 2.9 | 62.3 | 34.1 | 3.6 | ||||
| Dietary habits (mean value of 25 items) | 91.0 | 8.5 | 1.1 | 0.7 | 87.5 | 11.1 | 2.9 | 2.5 | 80.7 | 16.9 | 4.4 | 4.5 | ||
| 12.6 | Type of heat treatment of meat–I don’t eat meat | 2 | 100.0 | 0.0 | 99.4 | 0.6 | 100.0 | 0.0 | ||||||
| 17.1 | Type of water consumed–I don’t drink water | 2 | 97.7 | 2.3 | 97.9 | 2.1 | 95.7 | 4.3 | ||||||
| 12.3 | Type of heat treatment of meat–grilled | 2 | 95.3 | 4.7 | 89.7 | 10.3 | 91.3 | 8.7 | ||||||
| 17.4 | Type of water consumed–flavoured water | 2 | 95.0 | 5.0 | 90.3 | 9.7 | 92.0 | 8.0 | ||||||
| 17.2 | Type of water consumed–still water | 2 | 94.3 | 5.7 | 93.0 | 7.0 | 87.0 | 13.0 | ||||||
| 15 | Sweetening hot beverages | 4 | 94.0 | 5.7 | 0.3 | 0.0 | 91.9 | 6.4 | 1.5 | 0.2 | 83.3 | 14.5 | 1.4 | 0.7 |
| 10.7 | Snacking–nuts, almonds, seeds | 2 | 93.6 | 6.4 | 88.4 | 11.6 | 89.9 | 10.1 | ||||||
| 10.6 | Snacking–savoury snacks | 2 | 93.3 | 6.7 | 87.8 | 12.2 | 86.2 | 13.8 | ||||||
| 17.3 | Type of water consumed–sparkling water | 2 | 93.3 | 6.7 | 91.3 | 8.7 | 89.1 | 10.9 | ||||||
| 11 | Type of milk and dairy beverages (by fat content) | 3 | 93.2 | 6.5 | 0.3 | 88.0 | 10.8 | 1.2 | 74.6 | 23.0 | 2.4 | |||
| 13 | Type of bread spread | 7 | 93.0 | 4.3 | 1.3 | 1.3 | 85.4 | 5.1 | 3.3 | 6.3 | 86.2 | 5.1 | 1.4 | 7.2 |
| 10.2 | Snacking–vegetables | 2 | 92.0 | 8.0 | 87.2 | 12.8 | 83.3 | 16.7 | ||||||
| 14 | Type of frying fat | 6 | 91.6 | 5.4 | 2.3 | 0.7 | 86.4 | 7.4 | 3.3 | 2.9 | 85.5 | 8.7 | 4.3 | 1.4 |
| 10.1 | Snacking–fruit | 2 | 91.3 | 8.7 | 89.9 | 10.1 | 65.9 | 34.1 | ||||||
| 10.3 | Snacking–unsweetened dairy beverages and desserts | 2 | 90.6 | 9.4 | 83.9 | 16.1 | 74.6 | 25.4 | ||||||
| 10.4 | Snacking–sweetened dairy beverages and desserts | 2 | 90.3 | 9.7 | 82.6 | 17.4 | 87.7 | 12.3 | ||||||
| 12.2 | Type of heat treatment of meat–stewed | 2 | 89.0 | 11.0 | 89.5 | 10.5 | 76.1 | 23.9 | ||||||
| 10.5 | Snacking–sweet snacks | 2 | 88.6 | 11.4 | 84.5 | 15.5 | 79.0 | 21.0 | ||||||
| 16 | Adding salt to meals | 3 | 88.6 | 11.1 | 0.3 | 86.8 | 11.8 | 1.4 | 82.6 | 15.9 | 1.4 | |||
| 12.1 | Type of heat treatment of meat–boiled | 2 | 87.6 | 12.4 | 85.3 | 14.7 | 75.4 | 24.6 | ||||||
| 12.5 | Type of heat treatment of meat–fried | 2 | 87.3 | 12.7 | 86.6 | 13.4 | 77.5 | 22.5 | ||||||
| 12.4 | Type of heat treatment of meat–roasted | 2 | 86.3 | 13.7 | 85.9 | 14.1 | 75.4 | 24.6 | ||||||
| 7 | Number of meals a day | 5 | 86.0 | 13.4 | 0.7 | 0.0 | 82.2 | 15.7 | 1.9 | 0.2 | 74.6 | 22.5 | 2.9 | 0.0 |
| 8 | Regularity of consuming meals | 3 | 86.0 | 13.7 | 0.3 | 83.8 | 15.3 | 1.0 | 71.7 | 24.6 | 3.6 | |||
| 9 | Frequency of snacking between meals | 6 | 76.9 | 18.1 | 3.3 | 1.7 | 70.3 | 17.2 | 9.5 | 2.9 | 34.1 | 34.8 | 18.1 | 13.0 |
| Food frequency consumption (mean value of 33 items) | 79.3 | 15.6 | 3.8 | 1.3 | 74.2 | 17.5 | 5.6 | 2.7 | 59.2 | 29.0 | 7.3 | 4.4 | ||
| 52 | Energy drinks | 6 | 91.6 | 7.0 | 1.0 | 0.3 | 84.5 | 9.9 | 3.3 | 2.3 | 92.0 | 8.0 | 0.0 | 0.0 |
| 29 | Lard | 6 | 89.0 | 7.7 | 1.3 | 2.0 | 84.7 | 9.7 | 3.3 | 2.3 | 84.1 | 11.6 | 0.7 | 3.6 |
| 46 | Tinned meat | 6 | 88.6 | 9.7 | 1.0 | 0.7 | 82.2 | 13.3 | 3.1 | 1.4 | 76.1 | 20.3 | 1.4 | 2.2 |
| 54 | Alcoholic beverages | 6 | 88.0 | 10.4 | 1.0 | 0.7 | 83.6 | 12.8 | 2.7 | 1.0 | 74.6 | 22.5 | 2.2 | 0.7 |
| 45 | Instant soups, ready-made soups | 6 | 84.9 | 14.0 | 0.7 | 0.3 | 81.8 | 13.7 | 3.1 | 1.4 | 51.4 | 20.3 | 5.8 | 22.5 |
| 38 | Fish | 6 | 83.9 | 14.4 | 1.0 | 0.7 | 78.5 | 16.8 | 3.7 | 1.0 | 65.2 | 31.9 | 2.9 | 0.0 |
| 26 | Fast foods | 6 | 83.6 | 13.7 | 2.3 | 0.3 | 82.0 | 14.0 | 3.3 | 0.8 | 73.2 | 26.1 | 0.7 | 0.0 |
| 41 | Potatoes (excluding chips and crisps) | 6 | 83.3 | 14.0 | 2.3 | 0.3 | 79.9 | 15.9 | 3.3 | 1.0 | 61.6 | 28.3 | 6.5 | 3.6 |
| 42 | Fruit | 6 | 81.6 | 13.7 | 3.7 | 1.0 | 72.3 | 19.5 | 5.6 | 2.5 | 57.2 | 35.5 | 5.1 | 2.2 |
| 53 | Water | 6 | 81.6 | 13.0 | 3.7 | 1.7 | 74.9 | 12.0 | 7.9 | 5.2 | 64.5 | 22.5 | 8.7 | 4.3 |
| 43 | Vegetables | 6 | 80.9 | 14.4 | 4.3 | 0.3 | 70.8 | 20.9 | 6.0 | 2.3 | 60.1 | 30.4 | 8.7 | 0.7 |
| 37 | White meat | 6 | 80.6 | 16.7 | 2.3 | 0.3 | 77.6 | 17.2 | 3.3 | 1.9 | 65.2 | 27.5 | 7.2 | 0.0 |
| 51 | Sweetened beverages | 6 | 80.6 | 14.0 | 4.0 | 1.3 | 77.0 | 15.3 | 5.4 | 2.3 | 59.4 | 26.8 | 10.1 | 3.6 |
| 50 | Sweetened hot beverages | 6 | 79.3 | 11.0 | 2.7 | 7.0 | 75.0 | 11.4 | 4.6 | 8.9 | 63.0 | 10.1 | 1.4 | 25.4 |
| 39 | Eggs | 6 | 78.9 | 17.4 | 3.0 | 0.7 | 74.9 | 21.3 | 2.9 | 1.0 | 64.5 | 34.1 | 1.4 | 0.0 |
| 40 | Pulses-based foods | 6 | 78.9 | 17.4 | 3.0 | 0.7 | 77.6 | 16.4 | 4.1 | 1.9 | 66.7 | 28.3 | 4.3 | 0.7 |
| 49 | Vegetable juices, fruit and vegetable juices | 6 | 78.6 | 14.4 | 5.0 | 2.0 | 70.2 | 19.5 | 5.4 | 4.8 | 54.3 | 33.3 | 4.3 | 8.0 |
| 36 | Red meat | 6 | 78.5 | 15.1 | 5.7 | 0.7 | 73.9 | 17.2 | 6.8 | 2.1 | 60.1 | 29.7 | 10.1 | 0.0 |
| 25 | Buckwheat, oats, wholegrain pasta, other coarse-ground groats | 6 | 78.2 | 16.8 | 3.0 | 2.0 | 69.2 | 22.2 | 6.0 | 2.5 | 48.6 | 31.9 | 15.9 | 3.6 |
| 24 | White rice, white pasta, fine-ground groats | 6 | 77.3 | 18.1 | 4.3 | 0.3 | 70.6 | 22.2 | 6.4 | 0.8 | 42.0 | 44.9 | 10.9 | 2.2 |
| 28 | Butter | 6 | 77.3 | 14.0 | 5.7 | 3.0 | 66.5 | 17.4 | 9.5 | 6.6 | 53.6 | 32.6 | 8.0 | 5.8 |
| 23 | Wholemeal bread | 6 | 76.9 | 15.7 | 5.0 | 2.3 | 72.3 | 19.3 | 5.8 | 2.5 | 43.5 | 34.1 | 13.0 | 9.4 |
| 32 | Fermented milk beverages | 6 | 76.3 | 20.1 | 3.0 | 0.7 | 69.4 | 21.5 | 7.2 | 1.9 | 58.7 | 32.6 | 7.2 | 1.4 |
| 34 | Cheese | 6 | 75.9 | 19.4 | 4.3 | 0.3 | 73.3 | 18.2 | 7.2 | 1.4 | 59.4 | 34.8 | 4.3 | 1.4 |
| 27 | Fried foods | 6 | 75.3 | 19.7 | 4.0 | 1.0 | 74.5 | 18.2 | 6.8 | 0.6 | 57.2 | 35.5 | 7.2 | 0.0 |
| 33 | Fresh cheese curd products | 6 | 74.9 | 21.7 | 3.3 | 0.0 | 70.0 | 21.7 | 6.0 | 2.3 | 50.7 | 38.4 | 7.2 | 3.6 |
| 44 | Sweets | 6 | 74.6 | 17.7 | 6.4 | 1.3 | 70.2 | 20.7 | 6.8 | 2.3 | 53.6 | 29.7 | 10.9 | 5.8 |
| 47 | Tinned vegetables | 6 | 74.2 | 20.4 | 4.3 | 1.0 | 67.7 | 22.4 | 7.4 | 2.5 | 52.9 | 36.2 | 9.4 | 1.4 |
| 30 | Vegetable oils, margarines, mixes of butter and margarines | 6 | 73.2 | 14.7 | 7.7 | 4.3 | 63.8 | 17.4 | 10.6 | 8.1 | 43.1 | 31.4 | 13.9 | 11.7 |
| 31 | Milk | 6 | 72.9 | 18.7 | 6.0 | 2.3 | 68.9 | 20.5 | 7.0 | 3.7 | 56.2 | 32.8 | 8.0 | 2.9 |
| 35 | Cold meats, smoked sausages, hot-dogs | 6 | 72.6 | 19.1 | 8.0 | 0.3 | 71.8 | 20.3 | 5.2 | 2.7 | 47.1 | 39.1 | 12.3 | 1.4 |
| 22 | White bread | 6 | 72.5 | 19.1 | 6.4 | 2.0 | 69.1 | 16.8 | 8.7 | 5.4 | 51.4 | 26.8 | 12.3 | 9.4 |
| 48 | Fruit juices | 6 | 72.2 | 21.4 | 5.7 | 0.7 | 69.8 | 20.7 | 6.6 | 2.9 | 42.0 | 30.4 | 18.8 | 8.7 |
| Lifestyle (mean value of 14 items) | 90.4 | 8.9 | 0.6 | 0.6 | 87.4 | 10.5 | 1.8 | 1.5 | 75.7 | 21.1 | 3.0 | 1.5 | ||
| 85 | Smoking currently | 2 | 98.7 | 1.3 | 96.1 | 3.9 | 94.2 | 5.8 | ||||||
| 80 | Following a diet (currently) | 3 | 98.0 | 0.7 | 1.3 | 95.2 | 1.4 | 3.5 | 65.9 | 21.0 | 13.0 | |||
| 86 | Smoking in the past | 2 | 96.0 | 4.0 | 93.2 | 6.8 | 96.4 | 3.6 | ||||||
| 84 | Type of alcohol usually consumed | 4 | 94.0 | 4.4 | 0.4 | 1.2 | 91.3 | 3.8 | 2.2 | 2.7 | 79.8 | 11.1 | 6.1 | 3.0 |
| 92 | Self-assessment of health status compared to other people of the same age | 3 | 92.6 | 7.0 | 0.3 | 90.5 | 9.1 | 0.4 | 76.1 | 22.5 | 1.4 | |||
| 87 | Sleep time on weekdays | 3 | 92.0 | 8.0 | 0.0 | 90.1 | 9.7 | 0.2 | 79.0 | 21.0 | 0.0 | |||
| 90 | Physical activity at work/school | 3 | 90.6 | 9.1 | 0.3 | 85.7 | 12.8 | 1.5 | 70.2 | 29.8 | 0.0 | |||
| 94 | Self-assessment of diet | 4 | 90.6 | 9.4 | 0.0 | 0.0 | 89.7 | 8.7 | 1.4 | 0.2 | 78.3 | 21.0 | 0.7 | 0.0 |
| 88 | Sleep time on weekends | 3 | 90.0 | 9.0 | 1.0 | 85.0 | 14.0 | 1.0 | 77.5 | 21.0 | 1.4 | |||
| 83 | Eating out | 6 | 87.0 | 11.4 | 0.7 | 1.0 | 81.6 | 14.0 | 2.9 | 1.6 | 66.7 | 28.3 | 3.6 | 1.4 |
| 93 | Self-assessment of nutrition knowledge | 4 | 87.0 | 12.7 | 0.3 | 0.0 | 82.8 | 15.5 | 1.5 | 0.2 | 70.3 | 27.5 | 2.2 | 0.0 |
| 91 | Physical activity at leisure time | 3 | 86.6 | 13.0 | 0.3 | 86.2 | 13.2 | 0.6 | 73.2 | 26.1 | 0.7 | |||
| 89 | Time spent watching TV or using a computer | 6 | 81.9 | 15.7 | 1.3 | 1.0 | 76.7 | 15.7 | 4.7 | 2.9 | 63.8 | 27.5 | 5.8 | 2.9 |
| 95 | Self-assessment of diet during weekdays compared to weekend | 3 | 80.6 | 18.4 | 1.0 | 79.9 | 18.8 | 1.4 | 68.8 | 29.7 | 1.4 | |||
| No. | Questionnaire Items | Cat. | Interviewer-Administered Questionnaire | Self-Administered Questionnaire | |
|---|---|---|---|---|---|
| Healthy People | Healthy People | Outpatients # | |||
| Sample size | 299 | 517 | 138 | ||
| Indexes | |||||
| Physical activity level † | 3 | 0.83 | 0.76 | 0.52 | |
| pHDI-10 (a priori categories) ‡ | 3 | 0.80 | 0.69 | 0.43 | |
| pHDI-10 (tertiles) § | 3 | 0.75 | 0.66 | 0.45 | |
| Nutrition knowledge level ¶ | 3 | 0.73 | 0.71 | 0.46 | |
| nHDI-14 (tertiles) § | 3 | 0.66 | 0.66 | 0.43 | |
| nHDI-14 (a priori categories) ¥ | 3 | 0.65 | 0.58 | 0.66 | |
| Dietary habits | |||||
| 12.6 | Type of heat treatment of meat–I don’t eat meat | 2 | 1.00 | 0.79 | 1.00 |
| 15 | Sweetening hot beverages | 4 | 0.91 | 0.88 | 0.74 |
| 13 | Type of bread spread | 7 | 0.90 | 0.78 | 0.76 |
| 17.2 | Type of water consumed–still water | 2 | 0.88 | 0.84 | 0.64 |
| 12.3 | Type of heat treatment of meat–grilled | 2 | 0.86 | 0.76 | 0.71 |
| 17.3 | Type of water consumed–sparkling water | 2 | 0.85 | 0.80 | 0.65 |
| 11 | Type of milk and dairy beverages (by fat content) | 3 | 0.84 | 0.75 | 0.38 |
| 10.1 | Snacking–fruit | 2 | 0.82 | 0.75 | 0.31 |
| 17.4 | Type of water consumed–flavoured water | 2 | 0.82 | 0.71 | 0.43 |
| 14 | Type of frying fat | 6 | 0.81 | 0.69 | 0.60 |
| 7 | Number of meals a day | 5 | 0.79 | 0.74 | 0.61 |
| 16 | Adding salt to meals | 3 | 0.79 | 0.77 | 0.65 |
| 17.1 | Type of water consumed–I don’t drink water | 2 | 0.78 | 0.72 | 0.64 |
| 10.5 | Snacking–sweet snacks | 2 | 0.77 | 0.68 | 0.58 |
| 10.6 | Snacking–savoury snacks | 2 | 0.77 | 0.67 | 0.43 |
| 10.7 | Snacking–nuts, almonds, seeds | 2 | 0.77 | 0.67 | 0.66 |
| 12.2 | Type of heat treatment of meat–stewed | 2 | 0.77 | 0.77 | 0.52 |
| 8 | Regularity of consuming meals | 3 | 0.76 | 0.73 | 0.55 |
| 10.3 | Snacking–unsweetened dairy beverages and desserts | 2 | 0.74 | 0.62 | 0.30 |
| 12.1 | Type of heat treatment of meat–boiled | 2 | 0.74 | 0.70 | 0.50 |
| 10.2 | Snacking–vegetables | 2 | 0.73 | 0.66 | 0.31 |
| 12.4 | Type of heat treatment of meat–roasted | 2 | 0.72 | 0.69 | 0.50 |
| 9 | Frequency of snacking between meals | 6 | 0.71 | 0.62 | 0.18 |
| 10.4 | Snacking–sweetened dairy beverages and desserts | 2 | 0.71 | 0.58 | 0.49 |
| 12.5 | Type of heat treatment of meat–fried | 2 | 0.71 | 0.69 | 0.55 |
| Food frequency consumption | |||||
| 52 | Energy drinks | 6 | 0.84 | 0.74 | 0.66 |
| 54 | Alcoholic beverages | 6 | 0.83 | 0.78 | 0.61 |
| 46 | Tinned meat | 6 | 0.81 | 0.70 | 0.49 |
| 29 | Lard | 6 | 0.80 | 0.68 | 0.62 |
| 41 | Potatoes (excluding chips and crisps) | 6 | 0.76 | 0.69 | 0.40 |
| 42 | Fruit | 6 | 0.76 | 0.62 | 0.42 |
| 26 | Fast foods | 6 | 0.75 | 0.69 | 0.53 |
| 38 | Fish | 6 | 0.75 | 0.67 | 0.44 |
| 51 | Sweetened beverages | 6 | 0.75 | 0.71 | 0.40 |
| 43 | Vegetables | 6 | 0.74 | 0.59 | 0.40 |
| 45 | Instant soups, ready-made soups | 6 | 0.74 | 0.70 | 0.29 |
| 53 | Water | 6 | 0.74 | 0.63 | 0.45 |
| 50 | Sweetened hot beverages | 6 | 0.73 | 0.67 | 0.46 |
| 28 | Butter | 6 | 0.72 | 0.60 | 0.42 |
| 23 | Wholemeal bread | 6 | 0.71 | 0.66 | 0.31 |
| 25 | Buckwheat, oats, wholegrain pasta, other coarse-ground groats | 6 | 0.71 | 0.59 | 0.34 |
| 36 | Red meat | 6 | 0.71 | 0.65 | 0.44 |
| 49 | Vegetable juices, fruit and vegetable juices | 6 | 0.71 | 0.60 | 0.38 |
| 39 | Eggs | 6 | 0.70 | 0.63 | 0.44 |
| 37 | White meat | 6 | 0.69 | 0.63 | 0.27 |
| 24 | White rice, white pasta, fine-ground groats | 6 | 0.68 | 0.58 | 0.15 |
| 32 | Fermented milk beverages | 6 | 0.68 | 0.60 | 0.46 |
| 34 | Cheese | 6 | 0.67 | 0.62 | 0.40 |
| 40 | Pulses-based foods | 6 | 0.67 | 0.62 | 0.48 |
| 30 | Vegetable oils, margarines, mixes of butter and margarines | 6 | 0.66 | 0.55 | 0.26 |
| 31 | Milk | 6 | 0.66 | 0.61 | 0.44 |
| 33 | Fresh cheese curd products | 6 | 0.66 | 0.60 | 0.32 |
| 22 | White bread | 6 | 0.65 | 0.61 | 0.39 |
| 44 | Sweets | 6 | 0.65 | 0.62 | 0.39 |
| 27 | Fried foods | 6 | 0.64 | 0.62 | 0.40 |
| 47 | Tinned vegetables | 6 | 0.64 | 0.56 | 0.37 |
| 48 | Fruit juices | 6 | 0.64 | 0.61 | 0.28 |
| 35 | Cold meats, smoked sausages, hot-dogs | 6 | 0.62 | 0.61 | 0.19 |
| Lifestyle | |||||
| 85 | Smoking currently | 2 | 0.96 | 0.87 | 0.73 |
| 86 | Smoking in the past | 2 | 0.92 | 0.85 | 0.93 |
| 80 | Following a diet (currently) | 3 | 0.91 | 0.76 | 0.48 |
| 87 | Sleep time on weekdays | 3 | 0.85 | 0.79 | 0.51 |
| 92 | Self-assessment of health status compared to other people of the same age | 3 | 0.85 | 0.79 | 0.61 |
| 90 | Physical activity at work/school | 3 | 0.84 | 0.76 | 0.46 |
| 88 | Sleep time on weekends | 3 | 0.83 | 0.73 | 0.57 |
| 83 | Eating out | 6 | 0.81 | 0.71 | 0.52 |
| 93 | Self-assessment of nutrition knowledge | 4 | 0.79 | 0.72 | 0.52 |
| 94 | Self-assessment of diet | 4 | 0.79 | 0.77 | 0.43 |
| 91 | Physical activity at leisure time | 3 | 0.78 | 0.77 | 0.51 |
| 89 | Time spent watching TV or using a computer | 6 | 0.77 | 0.69 | 0.54 |
| 84 | Type of alcohol usually consumed | 4 | 0.70 | 0.53 | 0.42 |
| 95 | Self-assessment of diet during weekdays compared to weekend | 3 | 0.68 | 0.66 | 0.49 |
© 2018 by the authors. Licensee MDPI, Basel, Switzerland. This article is an open access article distributed under the terms and conditions of the Creative Commons Attribution (CC BY) license (http://creativecommons.org/licenses/by/4.0/).
Share and Cite
Kowalkowska, J.; Wadolowska, L.; Czarnocinska, J.; Czlapka-Matyasik, M.; Galinski, G.; Jezewska-Zychowicz, M.; Bronkowska, M.; Dlugosz, A.; Loboda, D.; Wyka, J. Reproducibility of a Questionnaire for Dietary Habits, Lifestyle and Nutrition Knowledge Assessment (KomPAN) in Polish Adolescents and Adults. Nutrients 2018, 10, 1845. https://0-doi-org.brum.beds.ac.uk/10.3390/nu10121845
Kowalkowska J, Wadolowska L, Czarnocinska J, Czlapka-Matyasik M, Galinski G, Jezewska-Zychowicz M, Bronkowska M, Dlugosz A, Loboda D, Wyka J. Reproducibility of a Questionnaire for Dietary Habits, Lifestyle and Nutrition Knowledge Assessment (KomPAN) in Polish Adolescents and Adults. Nutrients. 2018; 10(12):1845. https://0-doi-org.brum.beds.ac.uk/10.3390/nu10121845
Chicago/Turabian StyleKowalkowska, Joanna, Lidia Wadolowska, Jolanta Czarnocinska, Magdalena Czlapka-Matyasik, Grzegorz Galinski, Marzena Jezewska-Zychowicz, Monika Bronkowska, Anna Dlugosz, Dorota Loboda, and Joanna Wyka. 2018. "Reproducibility of a Questionnaire for Dietary Habits, Lifestyle and Nutrition Knowledge Assessment (KomPAN) in Polish Adolescents and Adults" Nutrients 10, no. 12: 1845. https://0-doi-org.brum.beds.ac.uk/10.3390/nu10121845