Impact of Grain Sorghum Polyphenols on Microbiota of Normal Weight and Overweight/Obese Subjects during In Vitro Fecal Fermentation

 ,
,
Abstract
:
1. Introduction
2. Materials and Methods
2.1. Sorghum Brans, Standards, and Reagents
2.2. Preparation of Polyphenols from Sorghum Bran Samples
2.3. Analysis of Polyphenol Content and Antioxidant Activity
2.4. Human Fecal Fermentation
2.5. Short-Chain Fatty Acid (SCFA) Analysis
2.6. Microbial Analysis
2.7. Experimental Design and Statistical Analysis
3. Results
3.1. Polyphenol Profile and Antioxidant Properties of Sorghum Bran Extracts
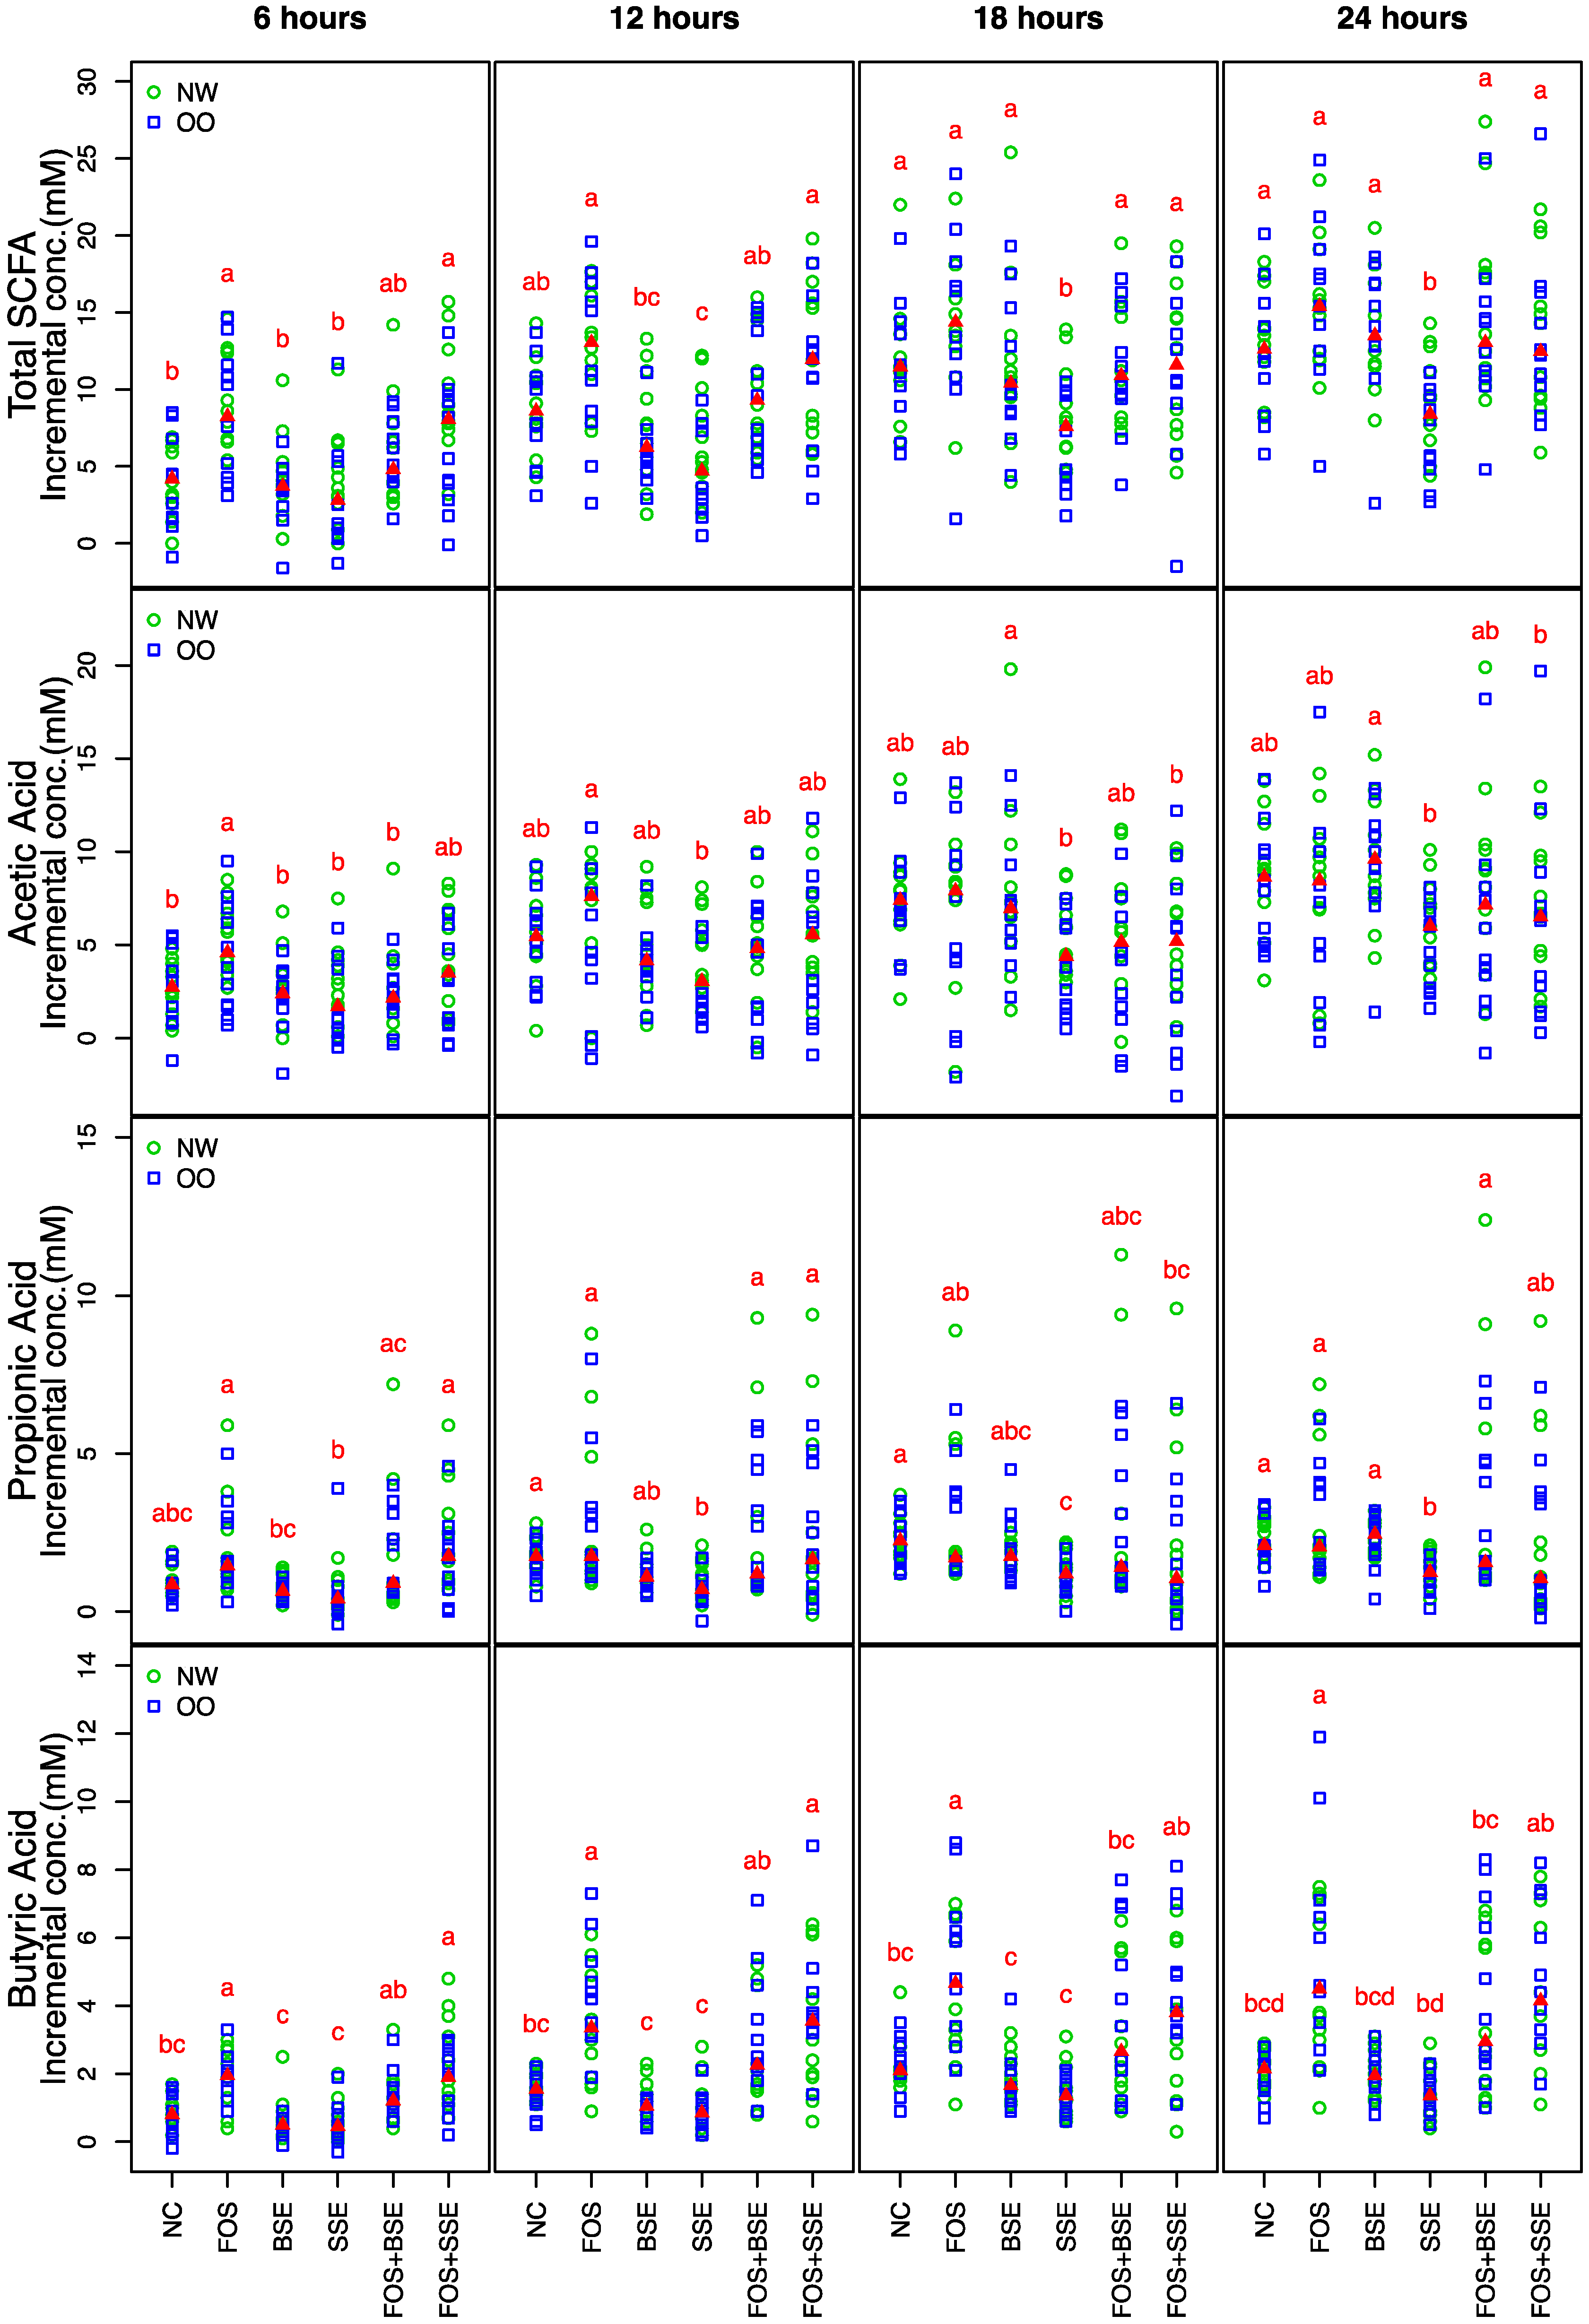
3.2. Short-Chain Fatty Acid Production
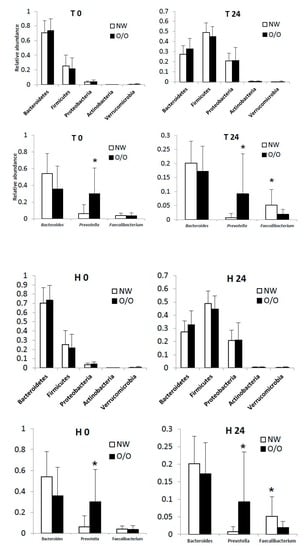
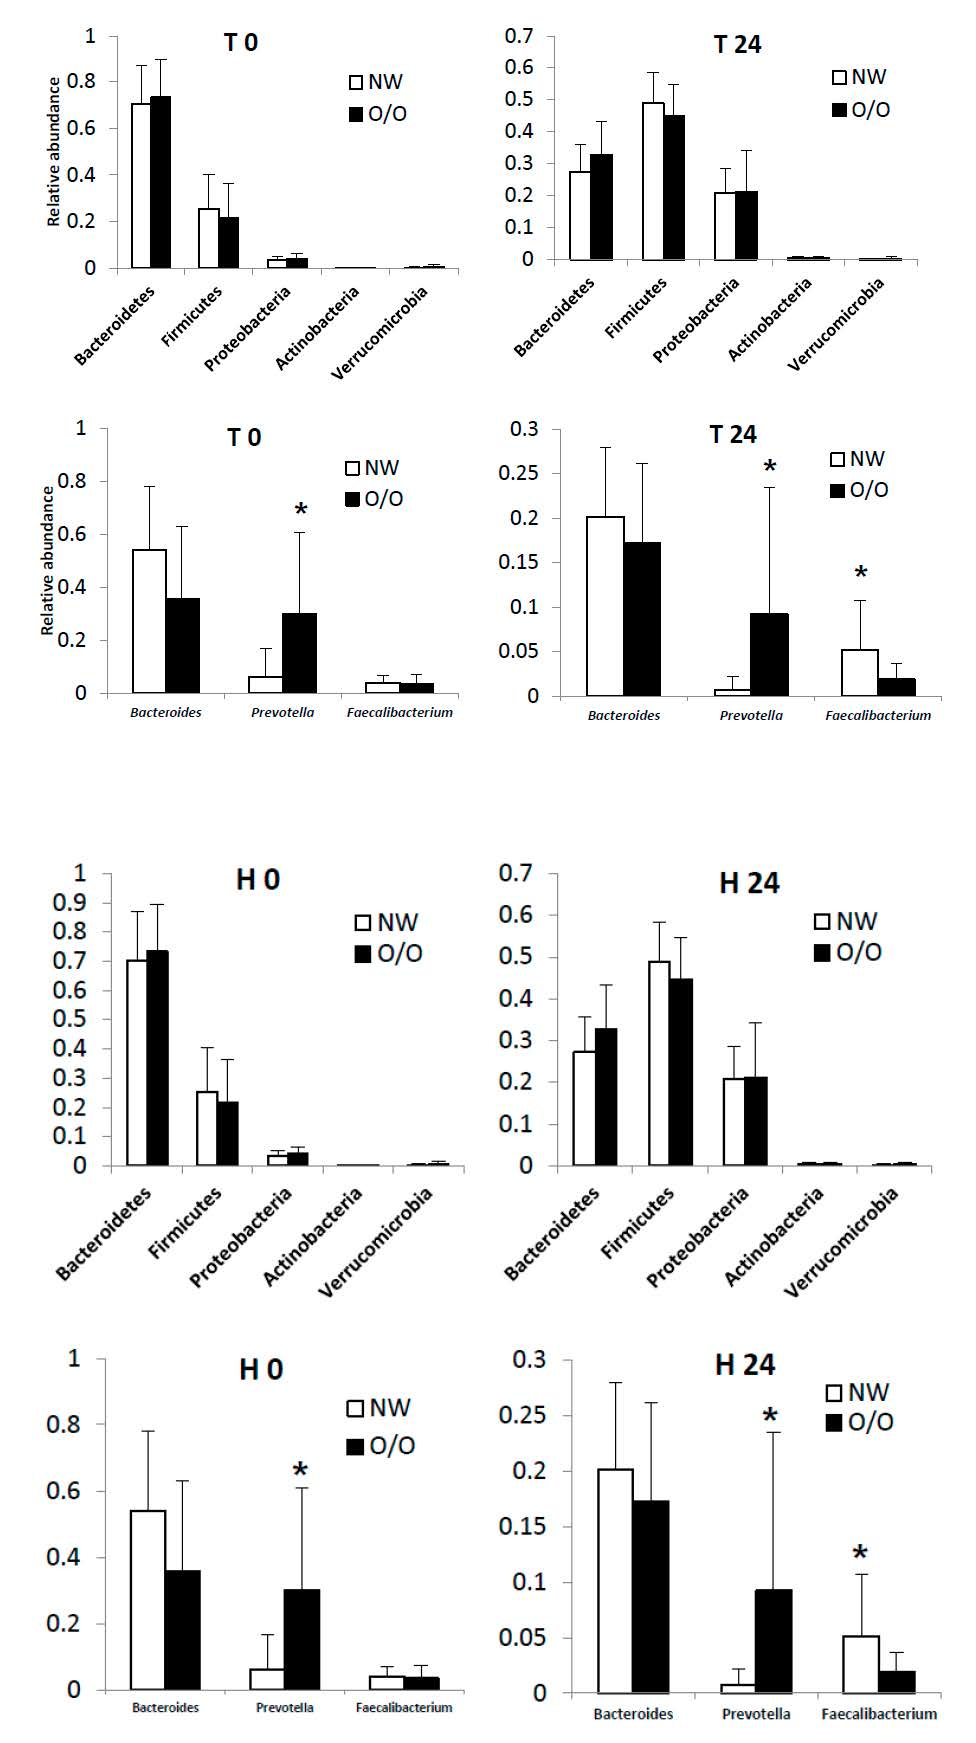
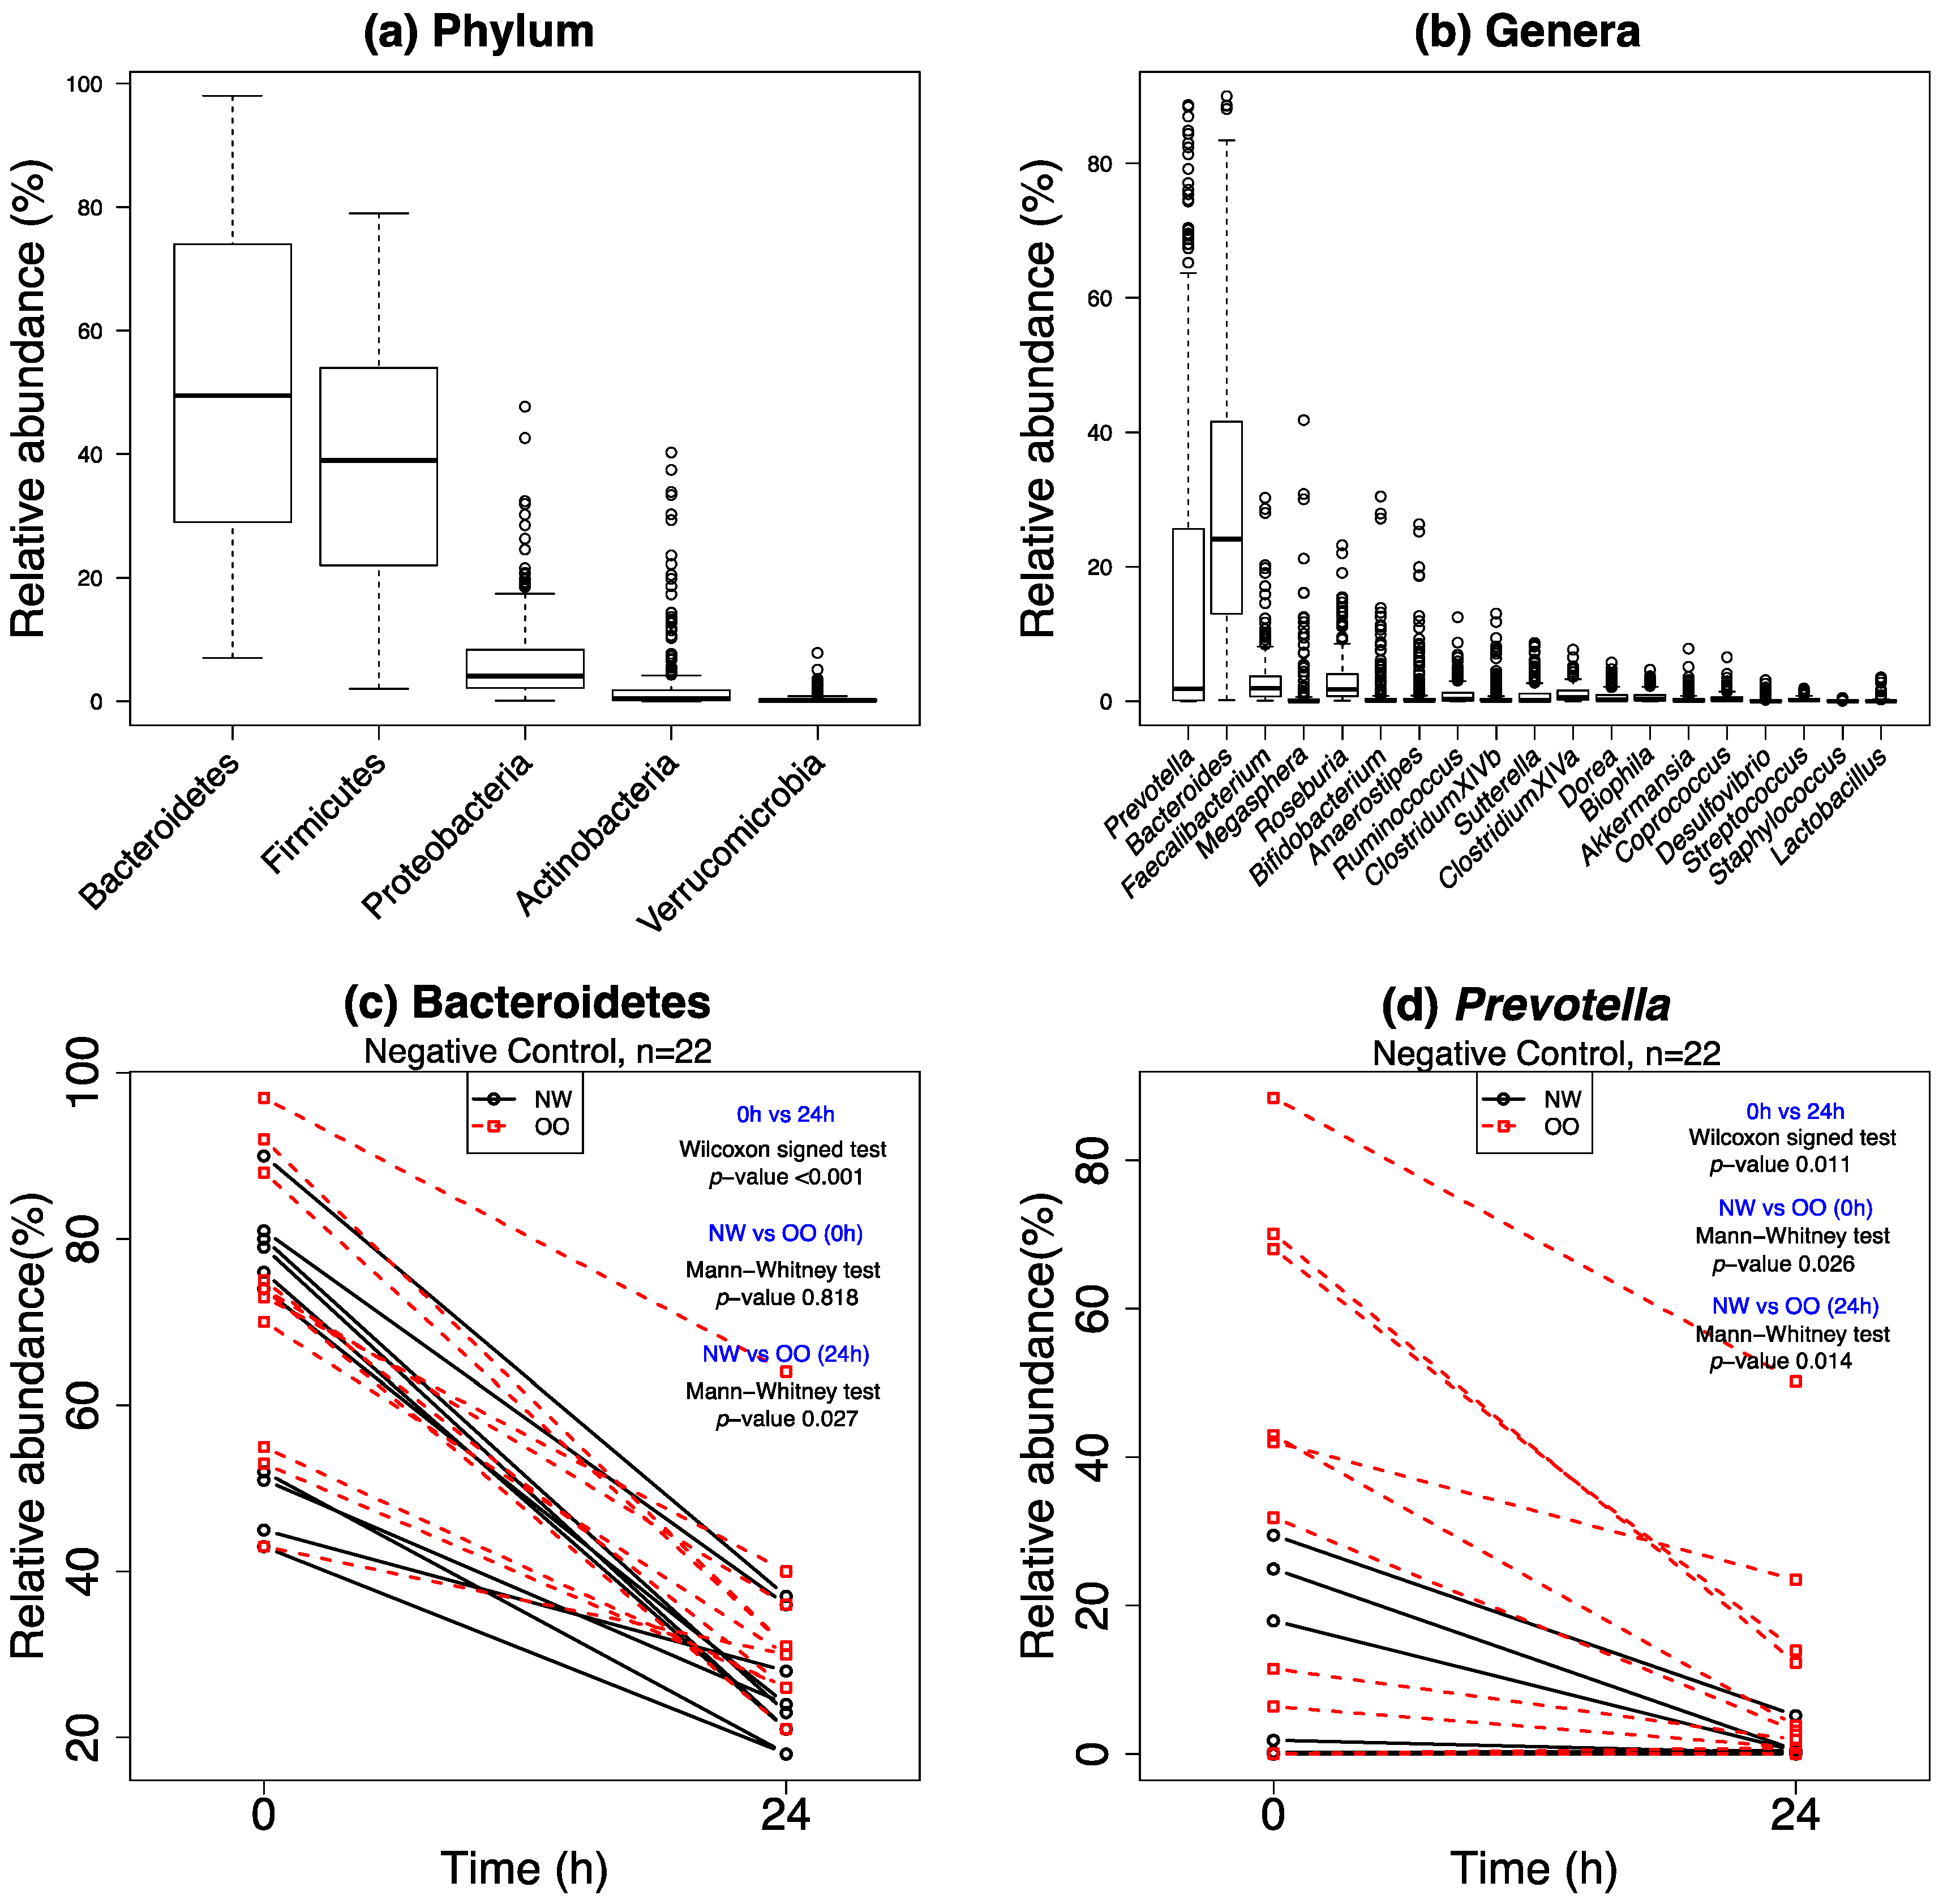
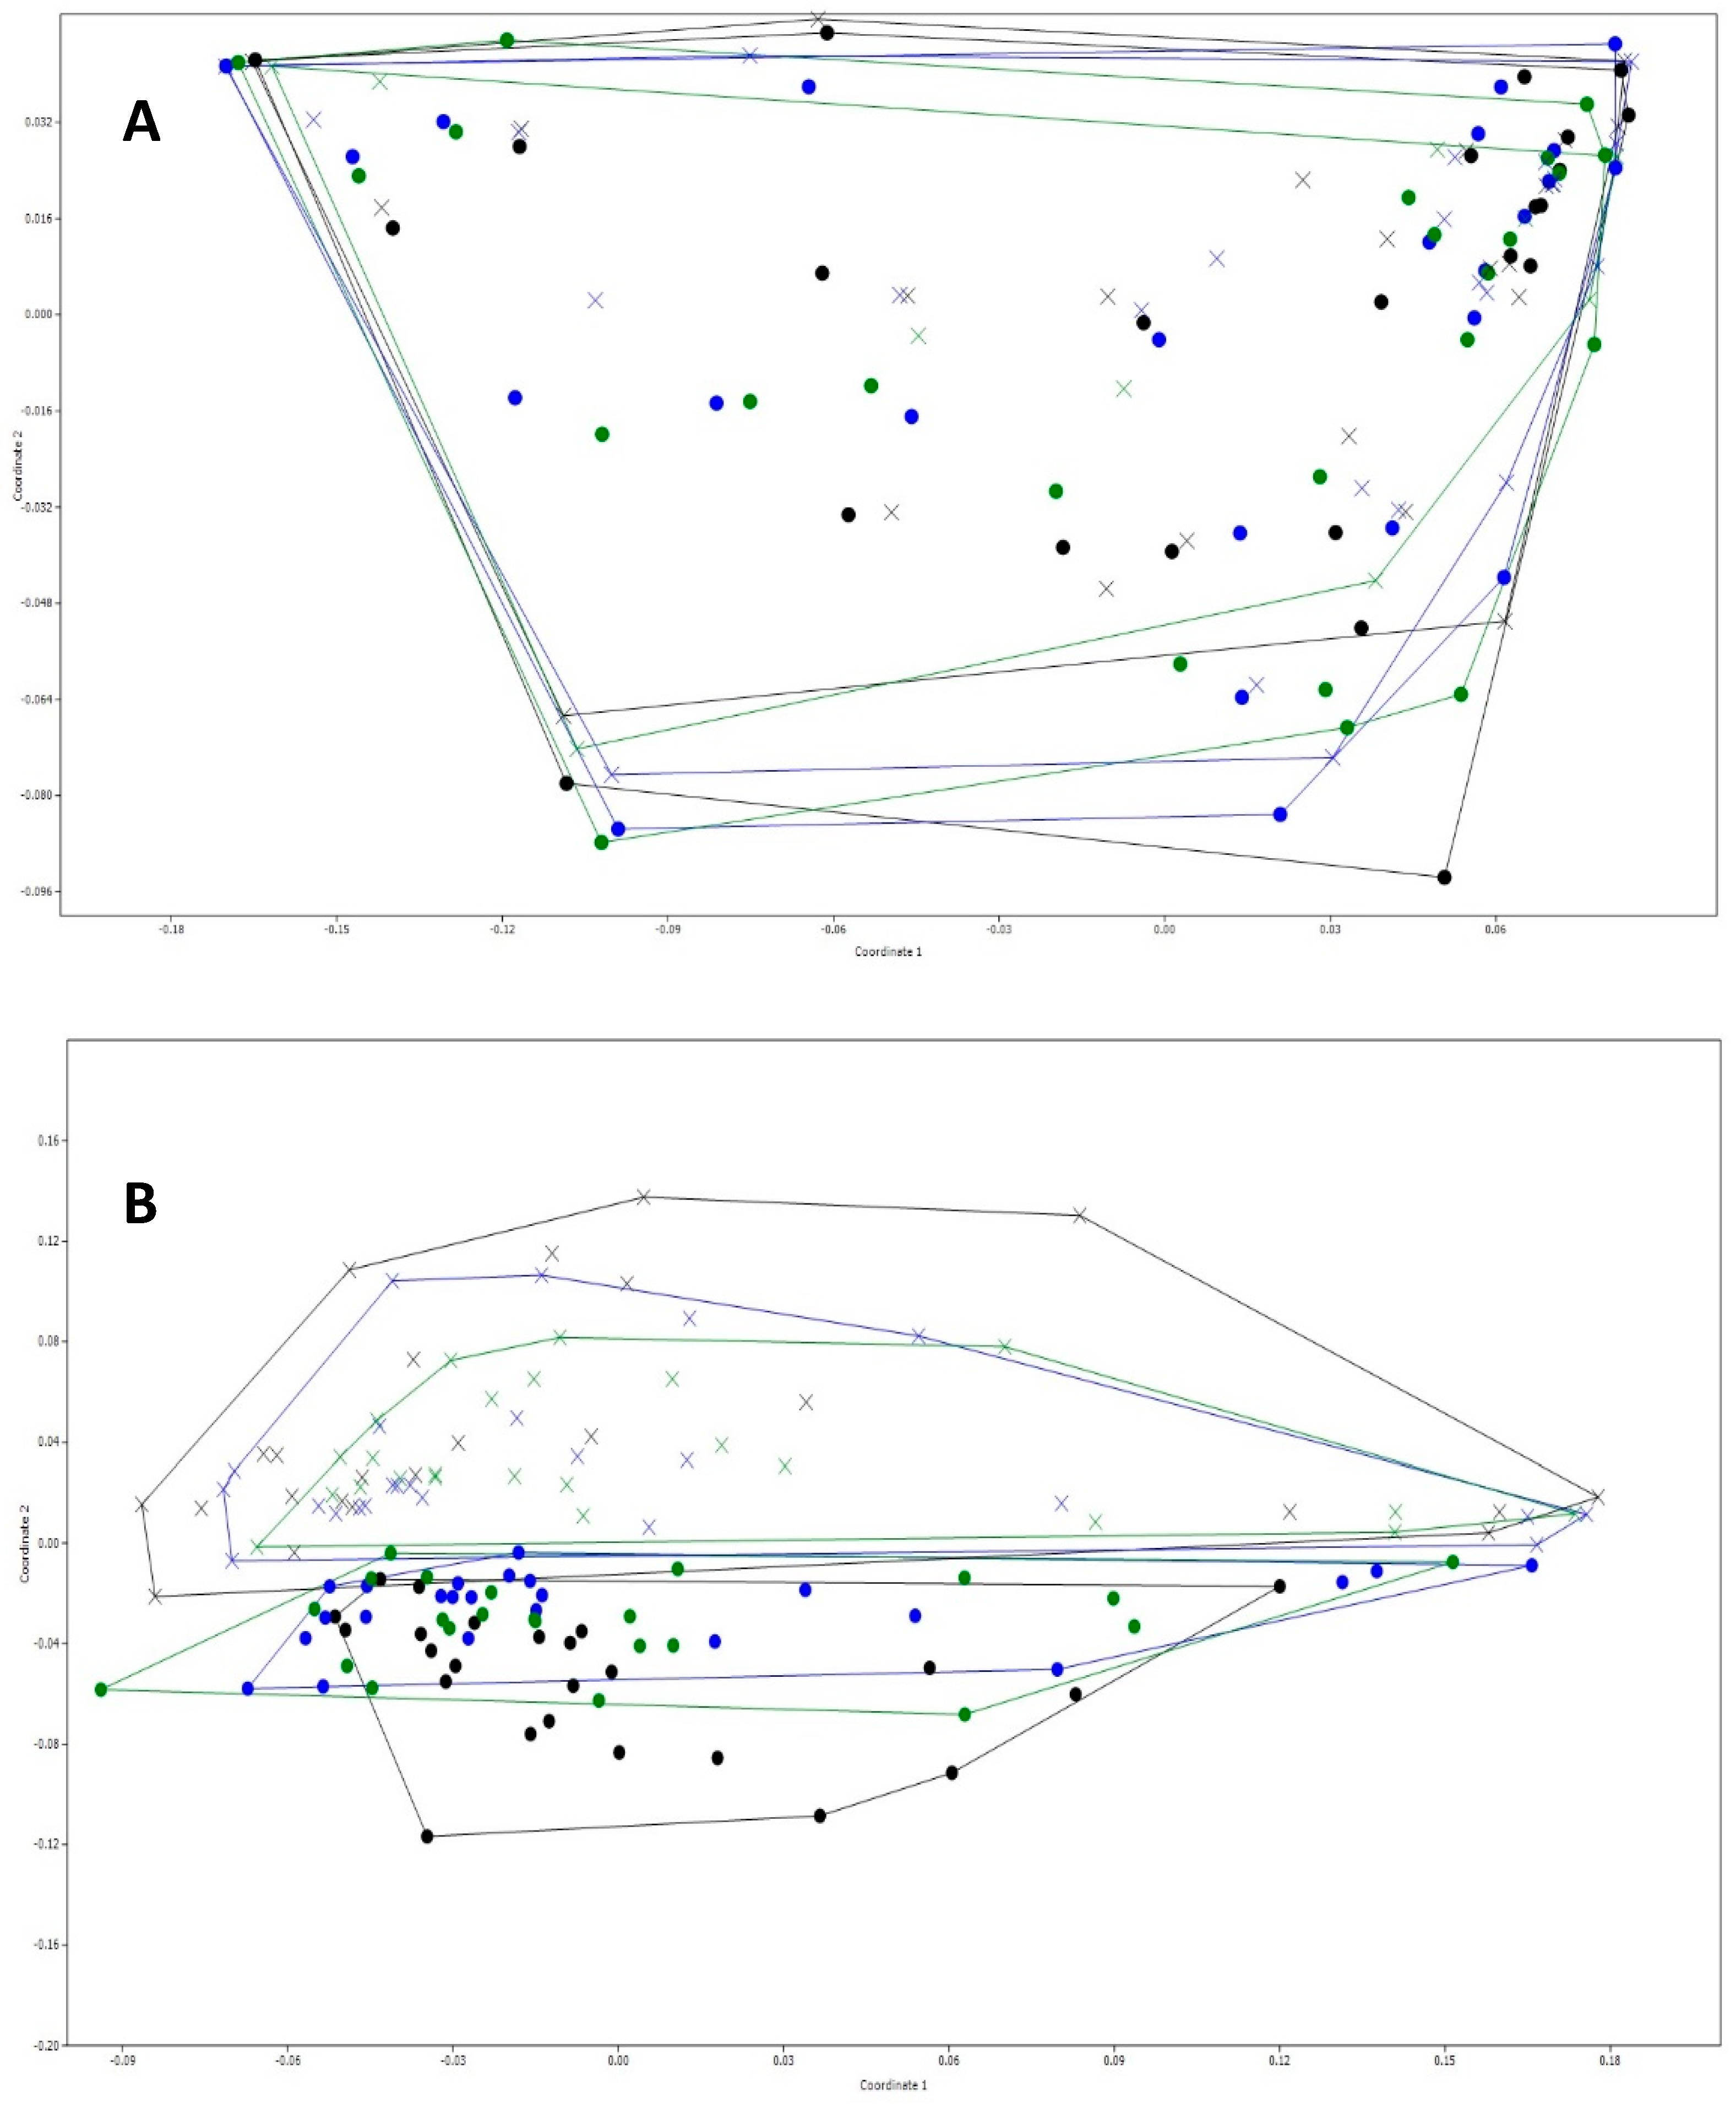
3.3. General Changes in the Microbiota
3.4. Specific Changes in Microbial Population
4. Discussion
5. Conclusions
Author Contributions
Funding
Conflicts of Interest
References
- Jandhyala, S.M.; Talukdar, R.; Subramanyam, C.; Vuyyuru, H.; Sasikala, M.; Reddy, D.N. Role of the normal gut microbiota. World J. Gastroenterol. 2015, 21, 8787–8803. [Google Scholar] [CrossRef] [PubMed]
- Obesity and Overweight. Available online: https://www.cdc.gov/nchs/fastats/obesity-overweight.htm (accessed on 23 September 2018).
- Adult Obesity Causes & Consequences. Available online: https://www.cdc.gov/obesity/adult/causes.html (accessed on 23 September 2018).
- Khan, M.J.; Gerasimidis, K.; Edwards, C.A.; Shaikh, M.G. Role of Gut Microbiota in the Aetiology of Obesity: Proposed Mechanisms and Review of the Literature. J. Obes. 2016, 2016, 7353642. [Google Scholar] [CrossRef] [PubMed]
- Collado, M.C.; Isolauri, E.; Laitinen, K.; Salminen, S. Distinct composition of gut microbiota during pregnancy in overweight and normal-weight women1–3. Am. J. Clin. Nutr. 2008, 88, 894–899. [Google Scholar] [CrossRef] [PubMed]
- Kalliomaki, M.; Collado, M.C.; Salminen, S.; Isolauri, E. Early differences in fecal microbiota composition in children may predict overweight. Am. J. Clin. Nutr. 2008, 87, 534–538. [Google Scholar] [CrossRef] [PubMed] [Green Version]
- Santacruz, A.; Collado, M.C.; García-Valdés, L.; Segura, M.T.; Martin-Lagos, J.A.; Anjos, T.; Romero, M.; Lopez, R.M.; Florido, J.; Campoy, C.; et al. Gut microbiota composition is associated with body weight, weight gain and biochemical parameters in pregnant women. Br. J. Nutr. 2010, 104, 83–92. [Google Scholar] [CrossRef] [Green Version]
- Riva, A.; Borgo, F.; Lassandro, C.; Verduci, E.; Morace, G.; Borghi, E.; Berry, D. Pediatric obesity is associated with an altered gut microbiota and discordant shifts in Firmicutes populations. Environ. Microbiol. 2017, 19, 95–105. [Google Scholar] [CrossRef] [PubMed]
- Ríos-Covián, D.; Ruas-Madiedo, P.; Margolles, A.; Gueimonde, M.; de los Reyes-Gavilán, C.G.; Salazar, N. Intestinal Short Chain Fatty Acids and their Link with Diet and Human Health. Front. Microbiol. 2016, 7, 185. [Google Scholar] [CrossRef] [PubMed]
- Canfora, E.E.; van der Beek, C.M.; Jocken, J.W.E.; Goossens, G.H.; Holst, J.J.; Olde-Damink, S.W.M.; Lenaerts, K.; Dejong, C.H.C.; Blaak, E.E. Colonic infusions of short-chain fatty acid mixtures promote energy metabolism in overweight/obese men: A randomized crossover trial. Sci. Rep. 2017, 7, 2360. [Google Scholar] [CrossRef]
- Chambers, E.S.; Viardot, A.; Psichas, A.; Morrison, D.J.; Murphy, K.; Zac-Varghese, S.E.K.; MacDougall, K.; Preston, T.; Tedford, C.; Finlayson, G.S.; et al. Effects of targeted delivery of propionate to the human colon on appetite regulation, body weight maintenance and adiposity in overweight adults. Gut 2015, 64, 1744–1754. [Google Scholar] [CrossRef] [PubMed]
- Rossi, M.; Corradini, C.; Amaretti, A.; Nicolini, M.; Pompei, A.; Zanoni, S.; Matteuzzi, D. Fermentation of Fructooligosaccharides and Inulin by Bifidobacteria: A Comparative Study of Pure and Fecal Cultures. Appl. Environ. Microbiol. 2005, 71, 6150–6158. [Google Scholar] [CrossRef]
- Gibson, G.R.; Scott, K.P.; Rastall, R.A.; Tuohy, K.M.; Hotchkiss, A.; Dubert-Ferandon, A.; Gareau, M.; Murphy, E.F.; Saulnier, D.; Loh, G.; et al. Dietary prebiotics: Current status and new definition. Food Sci. Technol. 2010, 7, 1–19. [Google Scholar] [CrossRef]
- Gibson, G.R.; Hutkins, R.; Sanders, M.E.; Prescott, S.L.; Raylene, R.A.; Salminem, S.J.; Scott, K.; Stanton, C.; Swanson, K.S.; Cani, P.D.; et al. The International Scientific Association for Probiotics and Prebiotics (ISAPP) consensus statement on the definition and scope of prebiotics. Nat. Rev. 2017, 14, 491–502. [Google Scholar]
- Pandey, K.B.; Rizvi, S.I. Plant polyphenols as dietary antioxidants in human health and disease. Oxid. Med. Cell. Longev. 2009, 25, 270–278. [Google Scholar] [CrossRef] [PubMed]
- Manach, C.; Scalbert, A.; Morand, C.; Rémésy, C.; Jiménez, L. Polyphenols: Food sources and bioavailability. Am. J. Clin. Nutr. 2004, 79, 727–747. [Google Scholar] [CrossRef] [PubMed]
- Awika, J.M.; McDonough, C.M.; Rooney, L.W. Decorticating Sorghum to Concentrate Healthy Phytochemicals. J. Agric. Food Chem. 2005, 53, 6230–6234. [Google Scholar] [CrossRef] [PubMed]
- Awika, J.M.; Rooney, L.W. Properties of 3-deoxyanthocyanins from Sorghum. J. Agric. Food Chem. 2004, 52, 4388–4394. [Google Scholar] [CrossRef] [PubMed]
- Cueva, C.; Sánchez-Patán, F.; Monagas, M.; Walton, G.E.; Gibson, G.R.; Martín-Álvarez, P.J.; Bartolomé, B.; Moreno-Arribas, M.V. In vitro fermentation of grape seed flavan-3-ol fractions by human faecal microbiota: Changes in microbial groups and phenolic metabolites. FEMS Microbiol. Ecol. 2013, 83, 792–805. [Google Scholar] [CrossRef]
- Anhê, F.F.; Roy, D.; Pilon, G.; Dudonné, S.; Matamoros, S.; Varin, T.V.; Garofalo, C.; Moine, Q.; Desjardins, Y.; Levy, E.; Marette, A. A polyphenol-rich cranberry extract protects from diet-induced obesity, insulin resistance and intestinal inflammation in association with increased Akkermansia spp. population in the gut microbiota of mice. Gut 2015, 64, 872–883. [Google Scholar]
- Roopchand, D.E.; Carmody, R.N.; Kuhn, P.; Moskal, K.; Rojas-Silva, P.; Turnbaugh, P.J.; Raskin, I. Dietary Polyphenols Promote Growth of the Gut Bacterium Akkermansia muciniphila and Attenuate High-Fat Diet–Induced Metabolic Syndrome. Diabetes 2015, 64, 2847–2858. [Google Scholar] [CrossRef]
- Song, H.; Chu, Q.; Yan, F.; Yang, Y.; Han, W.; Zheng, X. Red pitaya betacyanins protects from diet-induced obesity, liver steatosis and insulin resistance in association with modulation of gut microbiota in mice. J. Gastroenterol. Hepatol. 2016, 31, 1462–1469. [Google Scholar] [CrossRef]
- Zhou, L.; Wang, W.; Huang, J.; Ding, Y.; Pan, Z.; Zhao, Y.; Zhang, R.; Hu, B.; Zeng, X. In vitro extraction and fermentation of polyphenols from grape seeds (Vinis vinifera) by human intestinal microbiota. Food Funct. 2016, 7, 1959–1967. [Google Scholar] [CrossRef] [PubMed]
- Neyrinck, A.M.; Etxeberria, U.; Taminiau, B.; Daube, G.; Van Hul, M.; Everard, A.; Cani, P.D.; Bindels, L.B.; Delzenne, N.M. Rhubarb extract prevents hepatic inflammation induced by acute alcohol intake, an effect related to the modulation of the gut microbiota. Mol. Nutr. Food Res. 2016, 61, 1500899. [Google Scholar] [CrossRef] [PubMed] [Green Version]
- Singleton, V.L.; Rossi, J.A. Colorimetry of Total Phenolics with Phosphomolybdic-Phosphotungstic Acid Reagents. Am. J. Enol. Vitic. 1965, 16, 144–158. [Google Scholar]
- Payne, M.J.; Hurst, W.J.; Stuart, D.A.; Ou, B.; Fan, E.; Ji, H.; Kou, Y. Determination of Total Procyanidins in Selected Chocolate and Confectionary Products Using DMAC. J. AOAC Int. 2009, 93, 89–96. [Google Scholar]
- Cho, M.J.; Howard, L.R.; Prior, R.L.; Clark, J.R. Flavonoid glycosides and antioxidant capacity of various blackberry, blueberry and red grape genotypes determined by high-performance liquid chromatography/mass spectrometry. J. Sci. Food Agric. 2004, 84, 1771–1782. [Google Scholar] [CrossRef]
- Brand-Williams, W.; Cuvelier, M.E.; Berset, C. Use of a free radical method to evaluate antioxidant activity. Lebensm. Wiss. Technol. 1995, 28, 25–30. [Google Scholar] [CrossRef]
- Yang, J.; Keshavarzian, A.; Rose, D.J. Impact of dietary fiber fermentation from cereal grains on metabolite production by the fecal microbiota from normal weight and obese individuals. J. Med. Food 2013, 16, 862–867. [Google Scholar] [CrossRef]
- Bourquin, L.D.; Titgemeyer, E.C.; Fahey, G.C. Vegetable Fiber Fermentation by Human Fecal Bacteria: Cell Wall Polysaccharide Disappearance and Short-Chain Fatty Acid Production during In Vitro Fermentation and Water-Holding Capacity of Unfermented Residues. Nutr. Metab. 1993, 123, 860–869. [Google Scholar] [CrossRef] [Green Version]
- Mayta-Apaza, A.; Pottgen, E.; de Bodt, J.; Papp, N.; Daya, M.; Luke, H.; Abranko, L.; VandeWiele, T.; Lee, S.O.; Carbonero, F. Impact of tart cherry polyphenols on the human gut microbiota and phenolic metabolites in vitro and in vivo. J. Nutr. Biochem. 2018, 59, 170–172. [Google Scholar] [CrossRef]
- Kozich, J.J.; Westcott, S.L.; Baxter, N.T.; Highlander, S.K.; Schloss, P.D. Development of a dual-index sequencing strategy and curation pipeline for analyzing amplicon sequence data on the MiSeq Illumina sequencing platform. Appl. Environ. Microbiol. 2013, 79, 5112–5120. [Google Scholar] [CrossRef]
- Schloss, P.D.; Westcott, S.L.; Ryabin, T.; Hall, J.R.; Hartmann, M.; Hollister, E.B.; Lesniewski, R.A.; Oakley, B.B.; Parks, D.D.; Robinson, C.J.; et al. Introducing mothur: Open-source, platform-independent, community-supported software for describing and comparing microbial communities. Appl. Environ. Microbiol. 2009, 75, 7537–7541. [Google Scholar] [CrossRef] [PubMed]
- Sheflin, A.M.; Melby, C.L.; Carbonero, F.; Weir, T.L. Linking dietary patterns with gut microbial composition and function. Gut Microbes 2017, 8, 113–129. [Google Scholar] [CrossRef] [PubMed]
- Awika, J.M.; Rooney, L.W. Sorghum phytochemicals and their potential impact on human health. Phytochemistry 2004, 65, 1199–1221. [Google Scholar] [CrossRef] [PubMed]
- Awika, J.M.; Rooney, L.W.; Wu, X.; Prior, R.L.; Cisneros-Zevallos, L. Screening Methods to Measure Antioxidant Activity of Sorghum (Sorghum bicolor) and Sorghum Products. J. Agric. Food Chem. 2003, 51, 6657–6662. [Google Scholar] [CrossRef] [PubMed]
- Dykes, L.; Rooney, L.W.; Waniska, R.D.; Rooney, W.L. Phenolic Compounds and Antioxidant Activity of Sorghum Grain of Varying Phenotypes. J. Agric. Food Chem. 2005, 53, 6813–6818. [Google Scholar] [CrossRef] [PubMed]
- Kamath, V.G.; Chandrashekar, A.; Rajini, P.S. Antiradical properties of sorghum (Sorghum bicolor L. Moench) flour extracts. J. Cereal Sci. 2005, 40, 283–288. [Google Scholar] [CrossRef]
- Kil, H.W.; Seong, E.S.; Ghimire, B.K.; Chung, I.M.; Kwon, S.S.; Goh, E.J.; Heo, K.; Kim, M.J.; Lim, J.D.; Lee, D.; et al. Antioxidant and antimicrobial activities of crude sorghum extract. Food Chem. 2009, 115, 1234–1239. [Google Scholar] [CrossRef]
- Gross, G.; Jacobs, D.M.; Peters, S.; Possemiers, S.; van Duynhoven, J.; Vaughan, E.E.; van de Wiele, T. In vitro bioconversion of polyphenols from black tea and red wine/grape juice by human intestinal microbiota displays strong interindividual variability. J. Agric. Food Chem. 2010, 58, 10236–10246. [Google Scholar] [CrossRef]
- Kaplan, H.; Hutkins, R.W. Fermentation of Fructooligosaccharides by Lactic Acid Bacteria and Bifidobacteria. Appl. Environ. Microbiol. 2000, 66, 2682–2684. [Google Scholar] [CrossRef] [Green Version]
- Duncan, S.H.; Louis, P.; Flint, H.J. Lactate-Utilizing Bacteria, Isolated from Human Feces, That Produce Butyrate as a Major Fermentation Product. Appl. Environ. Microbiol. 2004, 70, 5810–5817. [Google Scholar] [CrossRef] [Green Version]
- Shin, N.R.; Whon, T.W.; Bae, J.W. Proteobacteria: Microbial signature of dysbiosis in gut microbiota. Trends Microbiol. 2015, 33, 496–503. [Google Scholar] [CrossRef] [PubMed]
- Pham, T.; Savary, B.J.; Teoh, K.; Chen, M.H.; McClung, A.; Lee, S.O. In Vitro Fermentation Patterns of Rice Bran Components by Human Gut Microbiota. Nutrients 2017, 9, 1237. [Google Scholar] [CrossRef] [PubMed]
- Wu, G.D.; Chen, J.; Hoffmann, C.; Bittinger, K.; Chen, Y.Y.; Keilbaugh, S.A.; Bewtra, M.; Knights, D.; Walters, W.A.; Knight, R.; et al. Linking Long-Term Dietary Patterns with Gut Microbial Enterotypes. Science 2011, 334, 105–108. [Google Scholar] [CrossRef] [PubMed] [Green Version]
- Hjorth, M.F.; Roager, H.M.; Larsen, T.M.; Poulsen, S.K.; Licht, T.R.; Bahl, M.I.; Zohar, Y.; Astrup, A. Pre-treatment microbial Prevotella-to-Bacteroides ration, determines body fat loss success during a 6-month randomized controlled diet intervention. Int. J. Obes. 2018, 42, 580–583. [Google Scholar] [CrossRef] [PubMed]
- Hidalgo, M.; Oruna-Concha, M.J.; Kolida, S.; Walton, G.E.; Kallithraka, S.; Spencer, J.P.E.; Gibson, G.R.; de Pascual-Teresa, S. Metabolism of Anthocyanins by Human Gut Microbiota and Their Influence on Gut Bacterial Growth. J. Agric. Food Chem. 2012, 60, 3882–3890. [Google Scholar] [CrossRef] [PubMed]
- Dolara, P.; Luceri, C.; De Filippo, C.; Femia, A.P.; Giovannelli, L.; Caderni, G.; Cecchini, C.; Silvi, S.; Orpianesi, C.; Cresci, A. Red wine polyphenols influence carcinogenesis, intestinal microflora, oxidative damage and gene expression profiles of colonic mucosa in F344 rats. Mutat. Res. 2005, 591, 237–246. [Google Scholar] [CrossRef] [PubMed]
- Crovesy, L.; Ostrowski, M.; Ferreira, D.M.T.P.; Rosado, E.L.; Soares-Mota, M. Effect of Lactobacillus on body weight and body fat in overweight subjects: A systematic review of randomized controlled clinical trials. Int. J. Obes. 2017, 41, 1607–1614. [Google Scholar] [CrossRef] [PubMed]
- Hamer, H.M.; Jonker, D.; Venema, K.; Vanhoutvin, S.; Troost, F.J.; Brummer, R.J. Review Article: The role of butyrate on colonic function. Aliment. Pharmacol. Therap. 2008, 27, 104–119. [Google Scholar] [CrossRef]
- Louis, P.; Flint, H.J. Formation of propionate and butyrate by the human colonic bacteria. Environ. Microbiol. 2016, 19, 29–41. [Google Scholar] [CrossRef]
- Duncan, S.H.; Hold, G.L.; Barcenilla, A.; Stewart, C.S.; Flint, H.J. Roseburia intestinalis sp. nov., a novel saccharolytic, butyrate-producing bacterium from human faeces. Int. J. Syst. Evol. Microbiol. 2002, 52, 1615–1620. [Google Scholar]
- Machiels, K.; Joosens, M.; Sabino, J.; De Preter, V.; Arijs, I.; Eeckhaut, V.; Ballet, V.; Claes, K.; Van Immerseel, F.; Verbeke, K.; et al. A decrease of the butyrate-producing species Roseburia hominis and Faecalibacterium prausnitzii defines dysbiosis in patients with ulcerative colitis. Gut 2014, 63, 1275–1283. [Google Scholar] [CrossRef] [PubMed]
- Wang, T.; Cai, G.; Qiu, Y.; Fei, N.; Zhang, M.; Pang, X.; Jia, W.; Cai, S.; Zhao, L. Structural segregation of gut microbiota between colorectal cancer patients and healthy volunteers. ISME J. 2012, 6, 320–329. [Google Scholar] [CrossRef] [PubMed]
- Neyrinck, A.M.; Possemiers, S.; Verstraete, W.; De Backer, F.; Cani, P.D.; Delzenne, N.M. Dietary modulation of clostridial cluster XIVa gut bacteria (Roseburia spp.) by chitin–glucan fiber improves host metabolic alterations induced by high-fat diet in mice. J. Nutr. Biochem. 2012, 23, 51–59. [Google Scholar] [CrossRef] [PubMed]
- Neyrinck, A.M.; Possemiers, S.; Druart, C.; Van de Wiele, T.; de Backer, F.; Cani, P.D.; Larondelle, Y.; Delzenne, N.M. Prebiotic Effects of Wheat Arabinoxylan Related to the Increase in Bifidobacteria, Roseburia and Bacteroides/Prevotella in Diet-Induced Obese Mice. PLoS ONE 2011, 6, e20944. [Google Scholar] [CrossRef] [PubMed] [Green Version]


| All (n = 22) | Normal Weight | Overweight/Obese | |||
|---|---|---|---|---|---|
| Male (n = 5) | Female (n = 6) | Male (n = 5) | Female (n = 6) | ||
| Age (years) | 29.0 ± 6.7 | 29.4 ± 4.8 | 24.2 ± 2.1 | 28.2 ± 3.5 | 34.2 ± 9.7 |
| BMI (kg/m2) | 27.1 ± 5.5 | 23.0 ± 0.7 | 22.2 ± 1.2 | 30.9 ± 2.9 | 32.2 ± 5.4 |
| FBG (mg/dL) | 92.1 ± 4.9 | 92.9 ± 3.1 | 90.6 ± 5.0 | 92.6 ± 6.9 | 96.3 ± 3.3 |
| BSE | SSE | |
|---|---|---|
| Polyphenols (mg gallic acid equiv/g extract) | 321.5 ± 2.7 | 571.7 ± 6.0 * |
| Proanthocyanidins (mg catechin equiv/g extract) | 8.4 ± 1.4 | 86.9 ± 1.1 * |
| 3-Deoxyanthocyanins (mg/g extract) | 10.1 ± 0.3 * | 2.0 ± 0.4 |
| Luteolinidin | 9.3 ± 0.4 * | 2.0 ± 0.4 |
| Apigeninidin | 0.9 ± 0.1 * | ND |
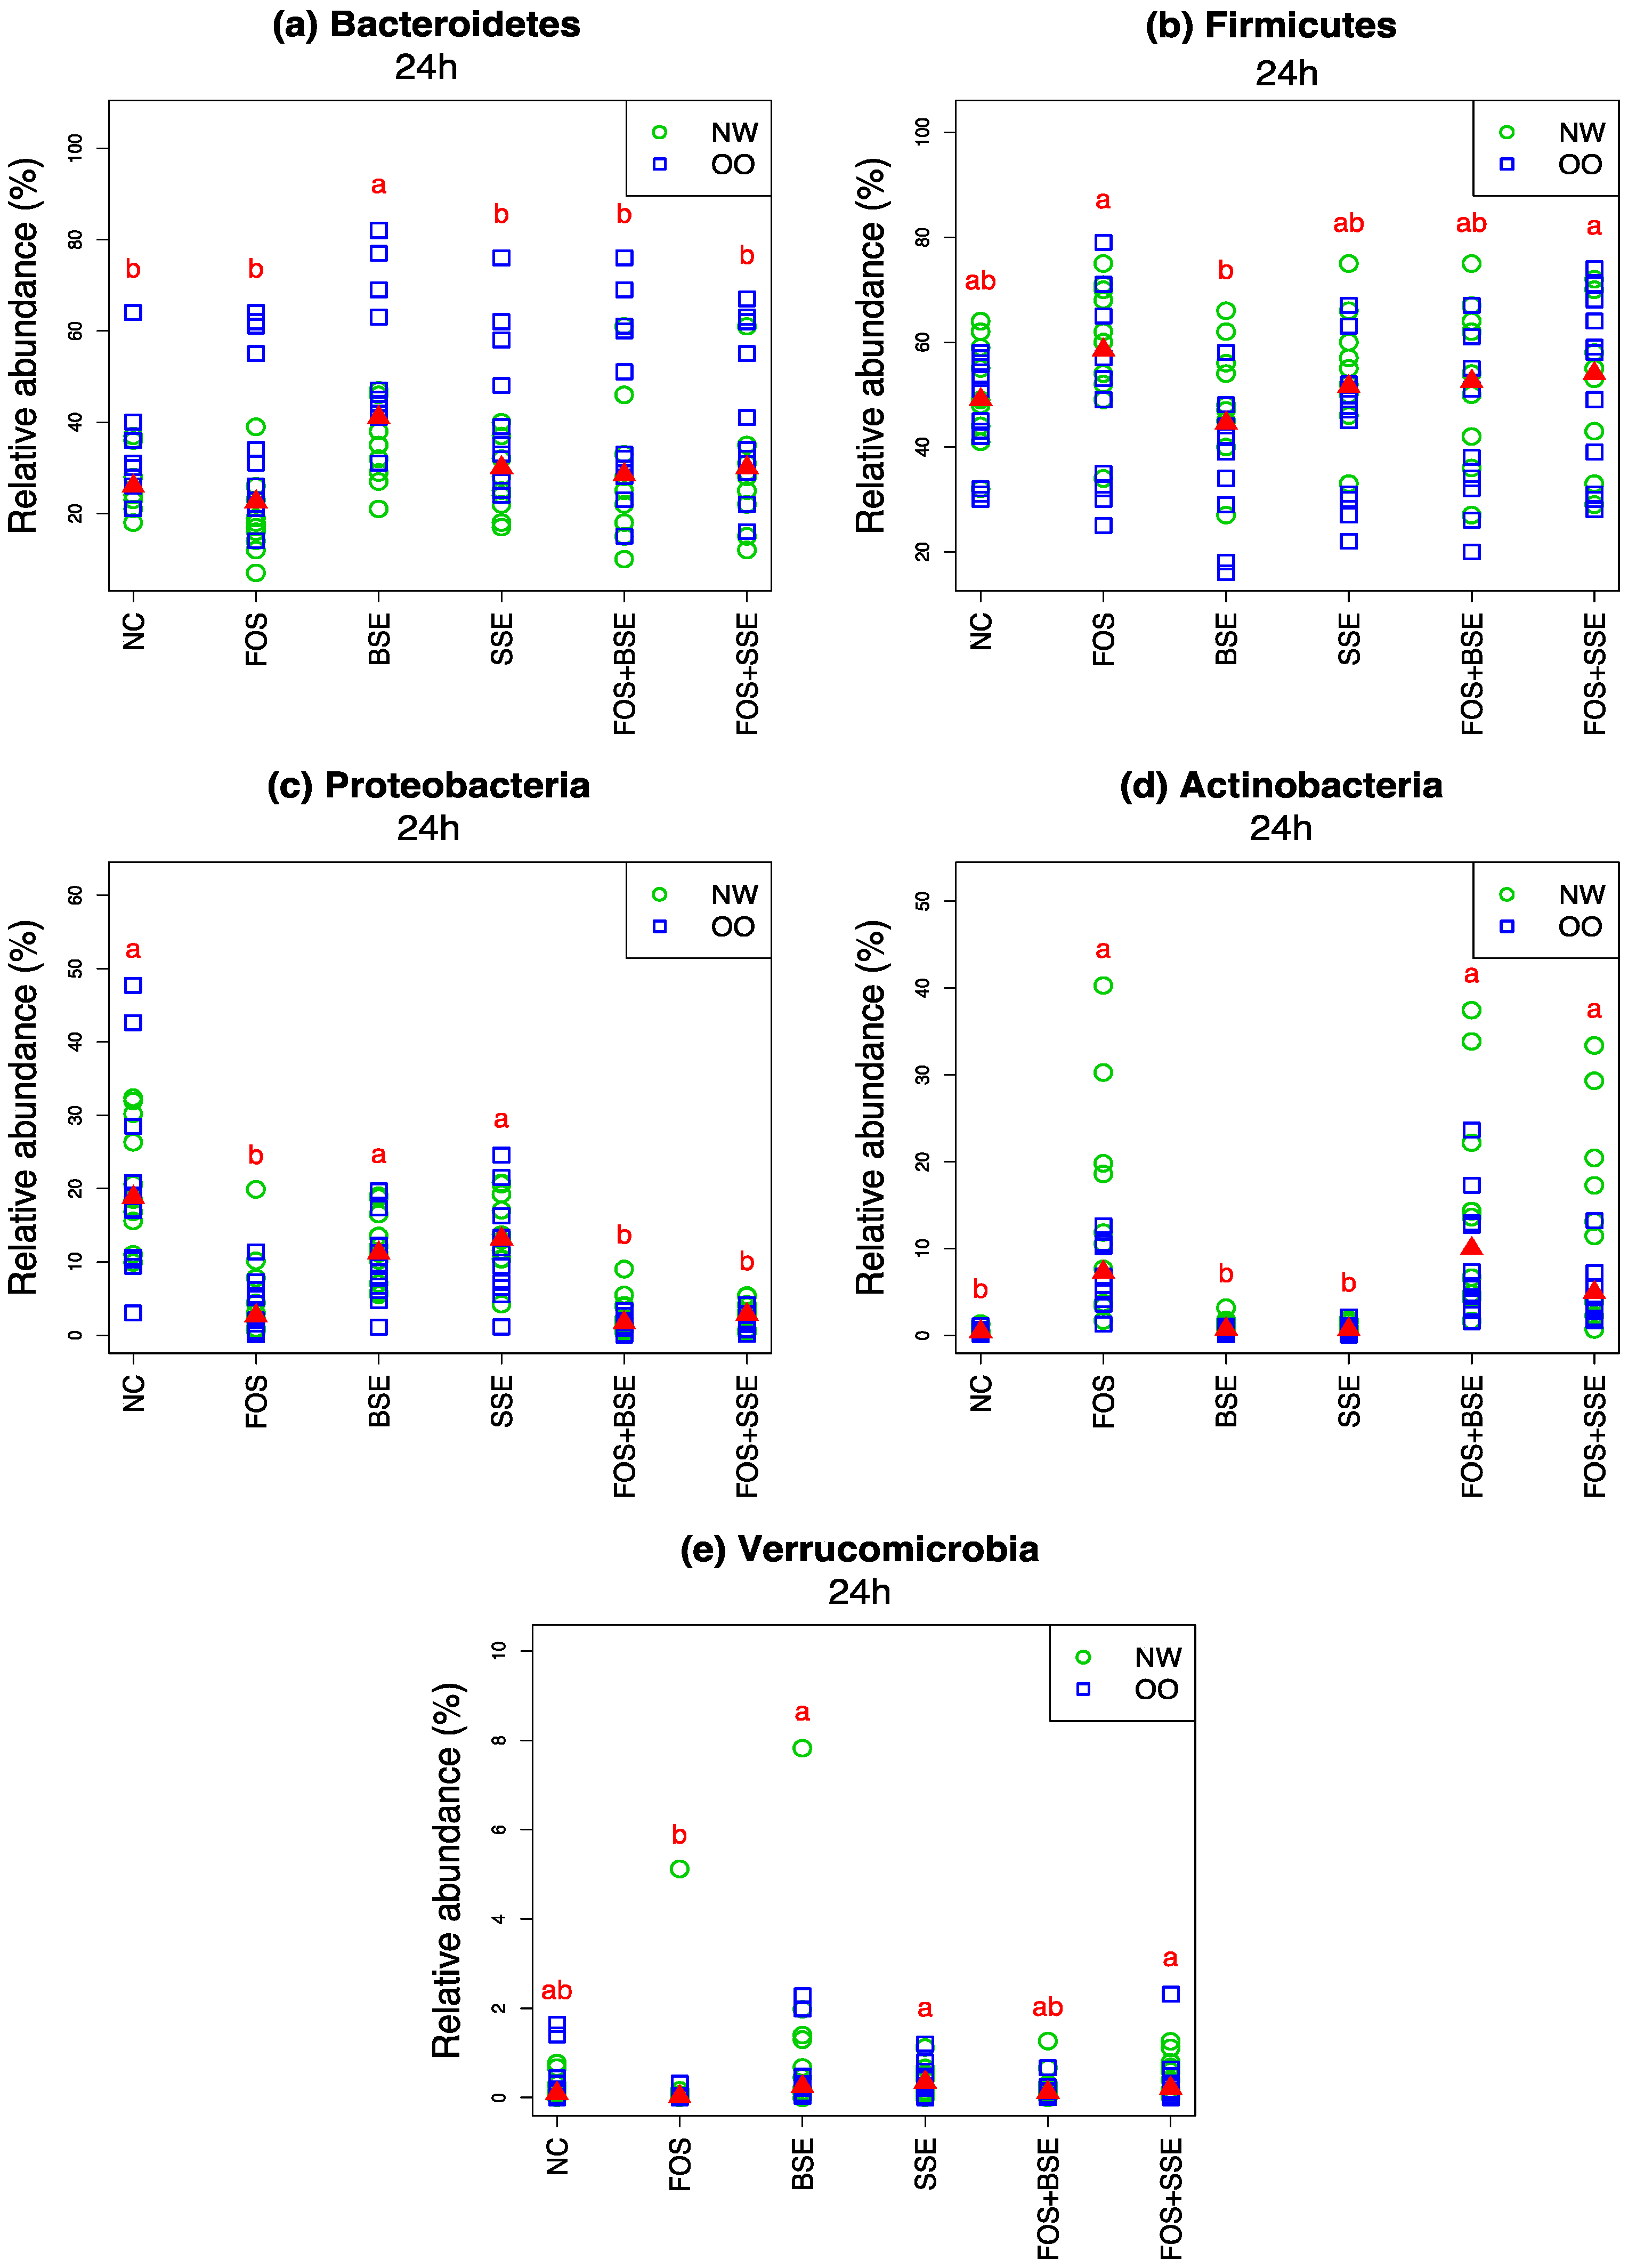
| Microbiota | Treatment | Change in 24 h Relative Abundance (%) | Wilcoxon Signed Test (0 h vs. 24 h) q-Value † | Mann-Whitney Test (NW vs. OO) at 24 h q-Value † |
|---|---|---|---|---|
| Bacteroidetes | NC | −41.10 | <0.001 | 0.136 |
| Bacteroidetes | FOS | −43.50 | <0.001 | 0.085 |
| Bacteroidetes | BSE | −23.60 | <0.001 | 0.085 |
| Bacteroidetes | SSE | −31.00 | <0.001 | 0.085 |
| Bacteroidetes | FOS + BSE | −35.10 | <0.001 | 0.177 |
| Bacteroidetes | FOS + SSE | −32.10 | <0.001 | 0.246 |
| Firmicutes | NC | 22.40 | 0.001 | 0.491 |
| Firmicutes | FOS | 32.00 | <0.001 | 0.489 |
| Firmicutes | BSE | 14.00 | 0.006 | 0.107 |
| Firmicutes | SSE | 19.70 | <0.001 | 0.180 |
| Firmicutes | FOS + BSE | 24.10 | <0.001 | 0.491 |
| Firmicutes | FOS + SSE | 23.80 | 0.002 | 0.974 |
| Proteobacteria | NC | 17.40 | <0.001 | 0.640 |
| Proteobacteria | FOS | 1.00 | 1.000 | 0.489 |
| Proteobacteria | BSE | 7.70 | <0.001 | 0.491 |
| Proteobacteria | SSE | 10.00 | <0.001 | 0.491 |
| Proteobacteria | FOS + BSE | −1.40 | 0.034 | 0.180 |
| Proteobacteria | FOS + SSE | −1.20 | 0.058 | 0.190 |
| Actinobacteria | NC | 0.30 | 0.003 | 0.825 |
| Actinobacteria | FOS | 10.30 | <0.001 | 0.491 |
| Actinobacteria | BSE | 0.70 | <0.001 | 0.061 |
| Actinobacteria | SSE | 0.60 | <0.001 | 0.180 |
| Actinobacteria | FOS + BSE | 11.80 | <0.001 | 0.280 |
| Actinobacteria | FOS + SSE | 9.20 | <0.001 | 0.180 |
| Verrucomicrobia | NC | −0.10 | 0.867 | 0.926 |
| Verrucomicrobia | FOS | −0.10 | 0.076 | 0.636 |
| Verrucomicrobia | BSE | 0.60 | 0.079 | 0.489 |
| Verrucomicrobia | SSE | 0.00 | 0.463 | 0.926 |
| Verrucomicrobia | FOS + BSE | −0.10 | 0.949 | 0.378 |
| Verrucomicrobia | FOS + SSE | 0.10 | 0.215 | 0.491 |
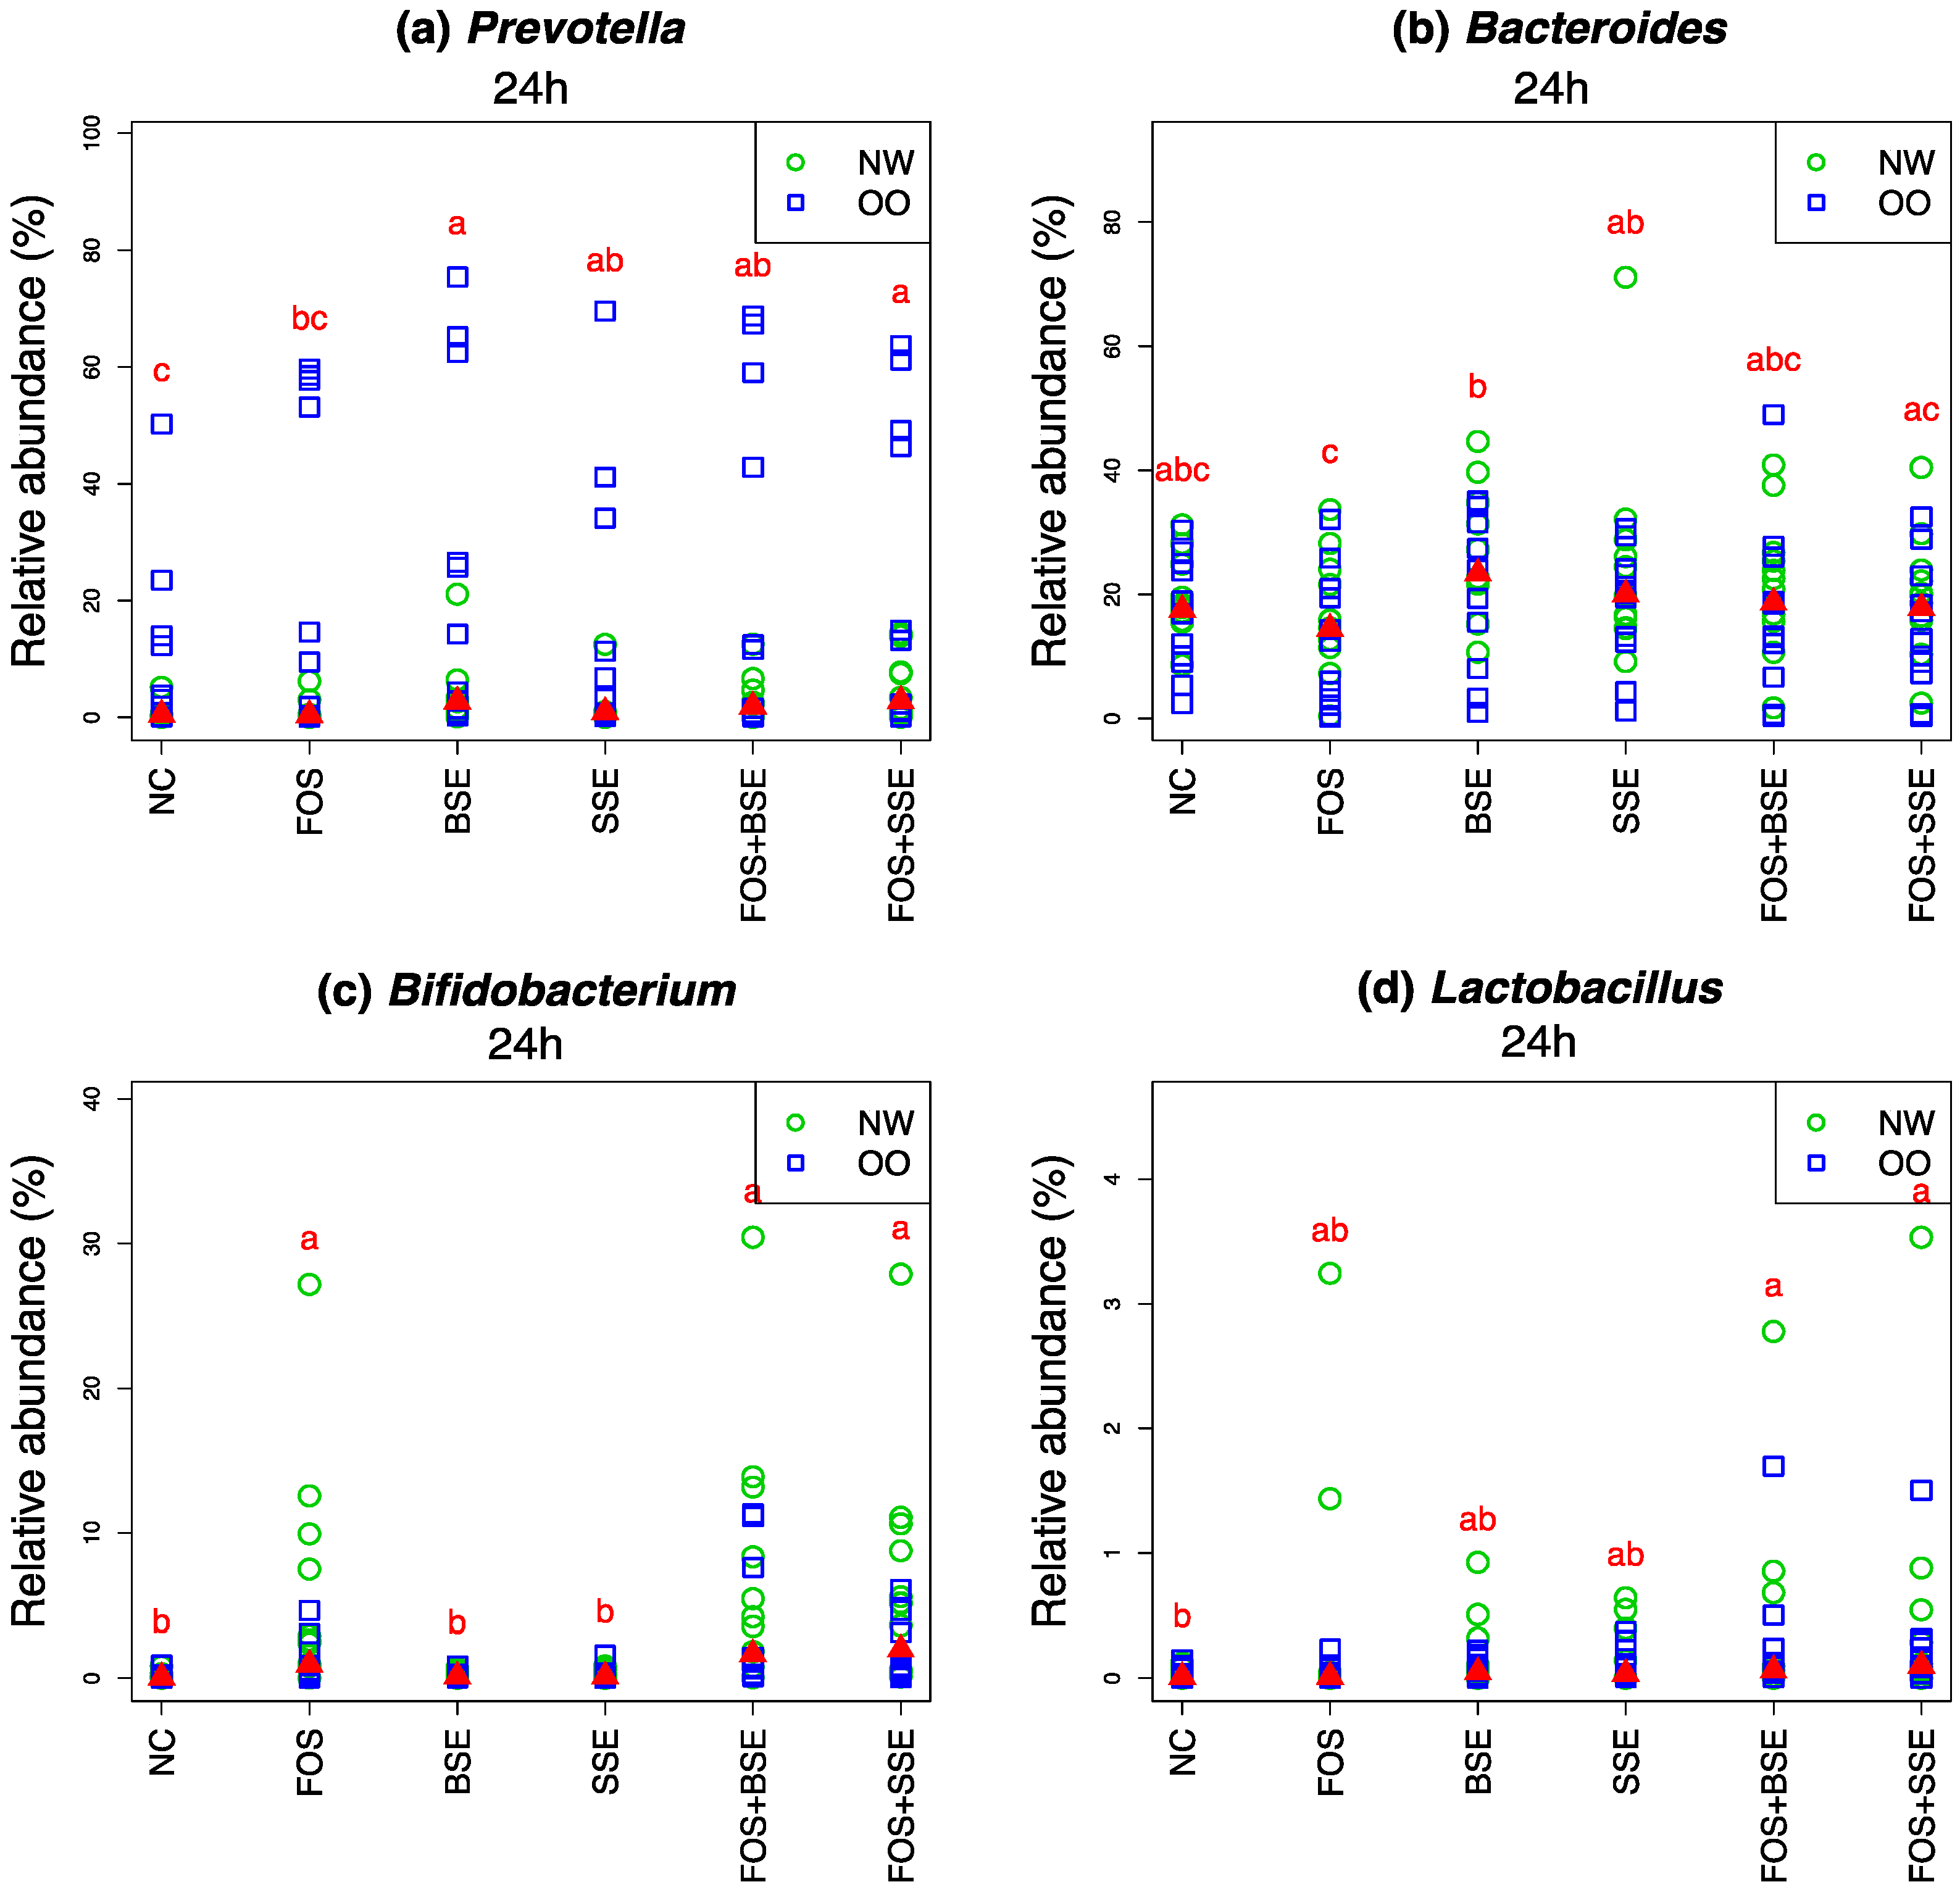
| Microbiota | Treatment | Change in 24 h Relative Abundance (%) | Wilcoxon Signed Test (0 h vs. 24 h) q-Value † | Mann-Whitney Test (NW vs. OO) at 24 h q-Value † |
|---|---|---|---|---|
| Prevotella | NC | −14.50 | 0.022 | 0.557 |
| Prevotella | FOS | −8.00 | 0.010 | 0.557 |
| Prevotella | BSE | −7.10 | 0.145 | 0.557 |
| Prevotella | SSE | −11.90 | 0.017 | 0.557 |
| Prevotella | FOS + BSE | −7.60 | 0.087 | 0.639 |
| Prevotella | FOS + SSE | −7.00 | 0.057 | 0.639 |
| Bacteroides | NC | −23.90 | 0.001 | 0.779 |
| Bacteroides | FOS | −27.90 | <0.001 | 0.727 |
| Bacteroides | BSE | −14.60 | 0.019 | 0.800 |
| Bacteroides | SSE | −14.40 | 0.028 | 0.755 |
| Bacteroides | FOS + BSE | −22.50 | 0.001 | 0.721 |
| Bacteroides | FOS + SSE | −21.40 | 0.003 | 0.719 |
| Bifidobacterium | NC | 0.10 | 0.059 | 0.875 |
| Bifidobacterium | FOS | 3.50 | 0.001 | 0.579 |
| Bifidobacterium | BSE | 0.10 | 0.018 | 0.755 |
| Bifidobacterium | SSE | 0.20 | 0.016 | 0.589 |
| Bifidobacterium | FOS + BSE | 5.30 | <0.001 | 0.638 |
| Bifidobacterium | FOS + SSE | 4.30 | <0.001 | 0.557 |
| Lactobacillus | NC | 0.00 | 0.919 | 0.721 |
| Lactobacillus | FOS | 0.20 | 0.300 | 0.957 |
| Lactobacillus | BSE | 0.10 | 0.059 | 0.782 |
| Lactobacillus | SSE | 0.10 | 0.025 | 0.721 |
| Lactobacillus | FOS + BSE | 0.30 | 0.011 | 0.755 |
| Lactobacillus | FOS + SSE | 0.30 | 0.004 | 1 |
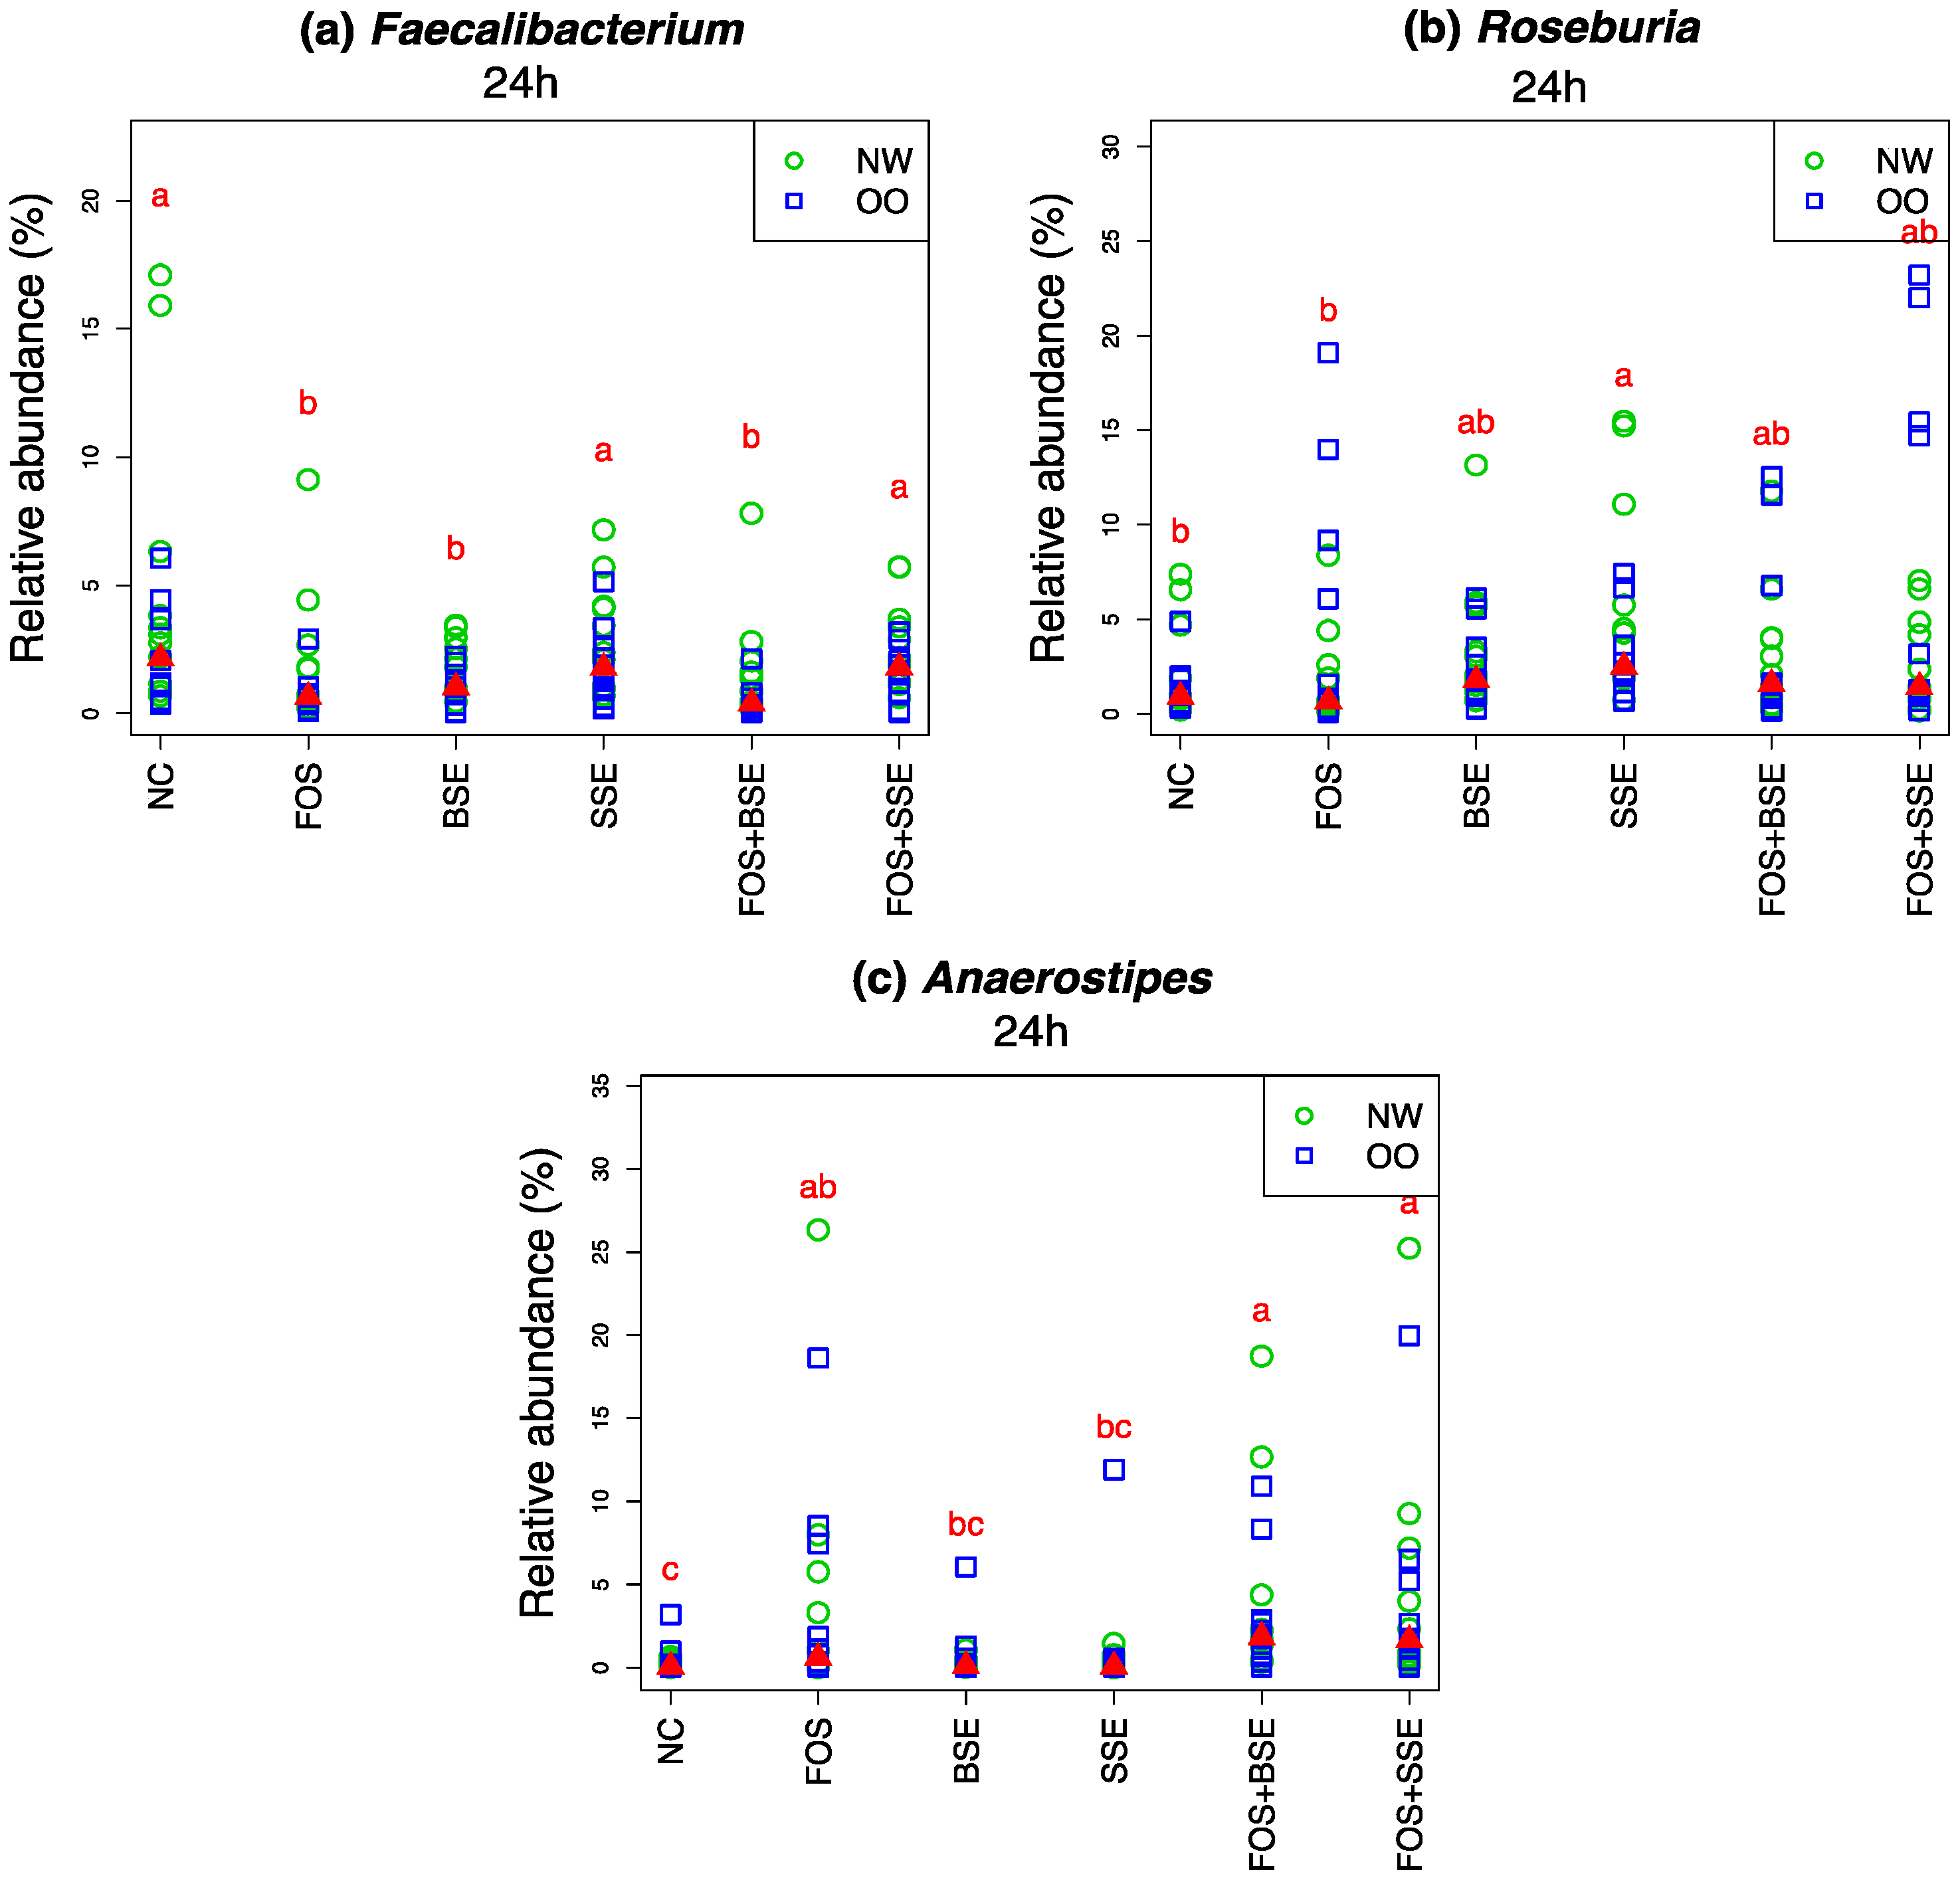
| Faecalibacterium | NC | −0.40 | 0.314 | 0.579 |
| Faecalibacterium | FOS | −2.10 | 0.007 | 0.721 |
| Faecalibacterium | BSE | −3.90 | 0.001 | 0.579 |
| Faecalibacterium | SSE | −3.10 | 0.017 | 0.684 |
| Faecalibacterium | FOS + BSE | −3.50 | <0.001 | 0.557 |
| Faecalibacterium | FOS + SSE | −2.90 | 0.145 | 0.651 |
| Roseburia | NC | −0.40 | 0.251 | 0.876 |
| Roseburia | FOS | 1.00 | 0.991 | 0.930 |
| Roseburia | BSE | 0.10 | 0.893 | 0.755 |
| Roseburia | SSE | 1.20 | 0.278 | 0.649 |
| Roseburia | FOS + BSE | 1.40 | 0.341 | 0.972 |
| Roseburia | FOS + SSE | 2.10 | 0.327 | 0.800 |
| Anaerostipes | NC | 0.30 | 0.047 | 0.755 |
| Anaerostipes | FOS | 3.80 | 0.001 | 0.972 |
| Anaerostipes | BSE | 0.40 | 0.077 | 0.755 |
| Anaerostipes | SSE | 0.70 | 0.057 | 0.779 |
| Anaerostipes | FOS + BSE | 3.40 | <0.001 | 0.957 |
| Anaerostipes | FOS + SSE | 4.10 | <0.001 | 1 |
© 2019 by the authors. Licensee MDPI, Basel, Switzerland. This article is an open access article distributed under the terms and conditions of the Creative Commons Attribution (CC BY) license (http://creativecommons.org/licenses/by/4.0/).
Share and Cite
Ashley, D.; Marasini, D.; Brownmiller, C.; Lee, J.A.; Carbonero, F.; Lee, S.-O. Impact of Grain Sorghum Polyphenols on Microbiota of Normal Weight and Overweight/Obese Subjects during In Vitro Fecal Fermentation. Nutrients 2019, 11, 217. https://0-doi-org.brum.beds.ac.uk/10.3390/nu11020217
Ashley D, Marasini D, Brownmiller C, Lee JA, Carbonero F, Lee S-O. Impact of Grain Sorghum Polyphenols on Microbiota of Normal Weight and Overweight/Obese Subjects during In Vitro Fecal Fermentation. Nutrients. 2019; 11(2):217. https://0-doi-org.brum.beds.ac.uk/10.3390/nu11020217
Chicago/Turabian StyleAshley, Danielle, Daya Marasini, Cindi Brownmiller, Jung Ae Lee, Franck Carbonero, and Sun-Ok Lee. 2019. "Impact of Grain Sorghum Polyphenols on Microbiota of Normal Weight and Overweight/Obese Subjects during In Vitro Fecal Fermentation" Nutrients 11, no. 2: 217. https://0-doi-org.brum.beds.ac.uk/10.3390/nu11020217