Metabolomic Salivary Signature of Pediatric Obesity Related Liver Disease and Metabolic Syndrome

 ,
, 
 , ,
, ,
Abstract
:1. Introduction
2. Materials and Methods
2.1. Population and Study Design
2.2. Saliva Samples
2.3. Ethical Approval
2.4. Untargeted Metabolomics Analysis
2.4.1. Metabolites Extraction and Derivatization
2.4.2. GC-MS Analysis
2.4.3. Metabolites Identification
2.5. Statistical Analysis
2.5.1. Demographical and Clinical Data
2.5.2. Metabolomics Univariate Data Analysis
2.5.3. Metabolomic Multivariate Data Analysis
3. Results
4. Discussion
Study Limitations and Strengths
5. Conclusions
Supplementary Materials
Author Contributions
Funding
Conflicts of Interest
References
- Clemente, M.G.; Mandato, C.; Poeta, M.; Vajro, P. Pediatric non-alcoholic fatty liver disease: Recent solutions, unresolved issues, and future research directions. World J. Gastroenterol. 2016, 22, 8078–8093. [Google Scholar] [CrossRef] [PubMed]
- Zheng, J.; Dixon, R.A.; Li, L. Development of Isotope Labeling LC-MS for Human Salivary Metabolomics and Application to Profiling Metabolome Changes Associated with Mild Cognitive Impairment. Anal. Chem. 2012, 84, 10802–10811. [Google Scholar] [CrossRef] [PubMed]
- Ra, S.-G.; Maeda, S.; Higashino, R.; Imai, T.; Miyakawa, S. Metabolomics of salivary fatigue markers in soccer players after consecutive games. Appl. Physiol. Nutr. Metab. 2014, 39, 1120–1126. [Google Scholar] [CrossRef] [PubMed]
- Troisi, J.; Belmonte, F.; Bisogno, A.; Lausi, O.; Marciano, F.; Cavallo, P.; Guercio Nuzio, S.; Landolfi, A.; Pierri, L.; Vajro, P. Salivary markers of hepato-metabolic comorbidities in pediatric obesity. Dig. Liver Dis. 2018. [Google Scholar] [CrossRef] [PubMed]
- Martos-Moreno, G.A.; Sackmann-Sala, L.; Barrios, V.; Berrymann, D.E.; Okada, S.; Argente, J.; Kopchick, J.J. Proteomic analysis allows for early detection of potential markers of metabolic impairment in very young obese children. Int. J. Pediatr. Endocrinol. 2014, 2014, 9. [Google Scholar] [CrossRef] [PubMed] [Green Version]
- Miccheli, A.; Capuani, G.; Marini, F.; Tomassini, A.; Pratico, G.; Ceccarelli, S.; Gnani, D.; Baviera, G.; Alisi, A.; Putignani, L.; et al. Urinary (1)H-NMR-based metabolic profiling of children with NAFLD undergoing VSL#3 treatment. Int. J. Obes. 2015, 39, 1118–1125. [Google Scholar]
- Wiklund, P.K.; Pekkala, S.; Autio, R.; Munukka, E.; Xu, L.; Saltevo, J.; Cheng, S.; Kujala, U.M.; Alen, M.; Cheng, S. Serum metabolic profiles in overweight and obese women with and without metabolic syndrome. Diabetol. Metab. Syndr. 2014, 6, 40. [Google Scholar] [CrossRef] [Green Version]
- Wurtz, P.; Makinen, V.-P.; Soininen, P.; Kangas, A.J.; Tukiainen, T.; Kettunen, J.; Savolainen, M.J.; Tammelin, T.; Viikari, J.S.; Ronnemaa, T.; et al. Metabolic signatures of insulin resistance in 7098 young adults. Diabetes 2012, 61, 1372–1380. [Google Scholar] [CrossRef]
- Jin, T.; Yu, H.; Huang, X.-F. Selective binding modes and allosteric inhibitory effects of lupane triterpenes on protein tyrosine phosphatase 1B. Sci. Rep. 2016, 6, 20766. [Google Scholar] [CrossRef] [Green Version]
- Butte, N.F.; Liu, Y.; Zakeri, I.F.; Mohney, R.P.; Mehta, N.; Voruganti, V.S.; Goring, H.; Cole, S.A.; Comuzzie, A.G. Global metabolomic profiling targeting childhood obesity in the Hispanic population. Am. J. Clin. Nutr. 2015, 102, 256–267. [Google Scholar] [CrossRef] [Green Version]
- Baek, S.H.; Kim, M.; Kim, M.; Kang, M.; Yoo, H.J.; Lee, N.H.; Kim, Y.H.; Song, M.; Lee, J.H. Metabolites distinguishing visceral fat obesity and atherogenic traits in individuals with overweight. Obesity 2017, 25, 323–331. [Google Scholar] [CrossRef] [PubMed]
- Zhong, F.; Xu, M.; Bruno, R.S.; Ballard, K.D.; Zhu, J. Targeted high performance liquid chromatography tandem mass spectrometry-based metabolomics differentiates metabolic syndrome from obesity. Exp. Biol. Med. 2017, 242, 773–780. [Google Scholar] [CrossRef]
- Pujos-Guillot, E.; Brandolini, M.; Pétéra, M.; Grissa, D.; Joly, C.; Lyan, B.; Herquelot, É.; Czernichow, S.; Zins, M.; Goldberg, M. Systems metabolomics for prediction of metabolic syndrome. J. Proteome Res. 2017, 16, 2262–2272. [Google Scholar] [CrossRef] [PubMed]
- Pierri, L.; Saggese, P.; Guercio Nuzio, S.; Troisi, J.; Di Stasi, M.; Poeta, M.; Savastano, R.; Marchese, G.; Tarallo, R.; Massa, G.; et al. Relations of gut liver axis components and gut microbiota in obese children with fatty liver: A pilot study. Clin. Res. Hepatol. Gastroenterol. 2018, 42, 387–390. [Google Scholar] [CrossRef]
- Troisi, J.; Pierri, L.; Landolfi, A.; Marciano, F.; Bisogno, A.; Belmonte, F.; Palladino, C.; Guercio Nuzio, S.; Campiglia, P.; Vajro, P. Urinary Metabolomics in Pediatric Obesity and NAFLD Identifies Metabolic Pathways/Metabolites Related to Dietary Habits and Gut-Liver Axis Perturbations. Nutrients 2017, 9, E485. [Google Scholar] [CrossRef] [PubMed]
- Dame, Z.T.; Aziat, F.; Mandal, R.; Krishnamurthy, R.; Bouatra, S.; Borzouie, S.; Guo, A.C.; Sajed, T.; Deng, L.; Lin, H.; et al. The human saliva metabolome. Metabolomics 2015, 11, 1864–1883. [Google Scholar] [CrossRef]
- Hartman, M.-L.; Goodson, J.M.; Barake, R.; Alsmadi, O.; Al-Mutawa, S.; Ariga, J.; Soparkar, P.; Behbehani, J.; Behbehani, K. Salivary Biomarkers in Pediatric Metabolic Disease Research. Pediatr. Endocrinol. Rev. 2016, 13, 602–611. [Google Scholar]
- Belmonte, F.; Bisogno, A.; Troisi, J.; Landolfi, A.M.; Lausi, O.; Lamberti, R.; Nuzio, S.G.; Pierri, L.; Siano, M.; Viggiano, C.; et al. Salivary levels of uric acid, insulin and HOMA: A promising field of study to non-invasively identify obese children at risk of metabolic syndrome and fatty liver. Dig. Liver Dis. 2017, 49, e247. [Google Scholar] [CrossRef]
- Cho, K.; Moon, J.S.; Kang, J.-H.; Jang, H.B.; Lee, H.-J.; Park, S.I.; Yu, K.-S.; Cho, J.-Y. Combined untargeted and targeted metabolomic profiling reveals urinary biomarkers for discriminating obese from normal-weight adolescents. Pediatr. Obes. 2017, 12, 93–101. [Google Scholar] [CrossRef]
- Ho, J.E.; Larson, M.G.; Ghorbani, A.; Cheng, S.; Chen, M.-H.; Keyes, M.; Rhee, E.P.; Clish, C.B.; Vasan, R.S.; Gerszten, R.E.; et al. Metabolomic Profiles of Body Mass Index in the Framingham Heart Study Reveal Distinct Cardiometabolic Phenotypes. PLoS ONE 2016, 11, e0148361. [Google Scholar] [CrossRef]
- Zheng, H.; Yde, C.C.; Arnberg, K.; Molgaard, C.; Michaelsen, K.F.; Larnkjaer, A.; Bertram, H.C. NMR-based metabolomic profiling of overweight adolescents: An elucidation of the effects of inter-/intraindividual differences, gender, and pubertal development. Biomed. Res. Int. 2014, 2014, 537157. [Google Scholar] [CrossRef] [PubMed]
- Vajro, P.; Lenta, S.; Pignata, C.; Salerno, M.; D’Aniello, R.; De Micco, I.; Paolella, G.; Parenti, G. Therapeutic options in pediatric non alcoholic fatty liver disease: Current status and future directions. Ital. J. Pediatr. 2012, 38, 55. [Google Scholar] [CrossRef]
- Schwenzer, N.F.; Springer, F.; Schraml, C.; Stefan, N.; Machann, J.; Schick, F. Non-invasive assessment and quantification of liver steatosis by ultrasound, computed tomography and magnetic resonance. J. Hepatol. 2009, 51, 433–445. [Google Scholar] [CrossRef] [PubMed]
- Schwimmer, J.B.; Dunn, W.; Norman, G.J.; Pardee, P.E.; Middleton, M.S.; Kerkar, N.; Sirlin, C.B. SAFETY study: Alanine aminotransferase cutoff values are set too high for reliable detection of pediatric chronic liver disease. Gastroenterology 2010, 138, 1357–1364. [Google Scholar] [CrossRef] [PubMed]
- Vajro, P.; Maddaluno, S.; Veropalumbo, C. Persistent hypertransaminasemia in asymptomatic children: A stepwise approach. World J. Gastroenterol. 2013, 19, 2740–2751. [Google Scholar] [CrossRef] [PubMed]
- Zimmet, P.; Alberti, K.G.M.; Kaufman, F.; Tajima, N.; Silink, M.; Arslanian, S.; Wong, G.; Bennett, P.; Shaw, J.; Caprio, S. The metabolic syndrome in children and adolescents—An IDF consensus report. Pediatr. Diabetes 2007, 8, 299–306. [Google Scholar] [CrossRef] [PubMed]
- World Medical Association. World medical association declaration of helsinki: Ethical principles for medical research involving human subjects. JAMA 2013, 310, 2191–2194. [Google Scholar] [CrossRef]
- Kovats, E.S. Gas-chromatographische charakterisierung organischer verbindungen. Teil 1: Retentionsindices aliphatischer halogenide, alkohole, aldehyde und ketone. Helv. Chim. Acta 1958, 41, 1915–1932. [Google Scholar] [CrossRef]
- van den Berg, R.A.; Hoefsloot, H.C.; Westerhuis, J.A.; Smilde, A.K.; van der Werf, M.J. Centering, scaling, and transformations: Improving the biological information content of metabolomics data. BMC Genom. 2006, 7, 142. [Google Scholar] [CrossRef]
- Sumner, L.W.; Amberg, A.; Barrett, D.; Beale, M.H.; Beger, R.; Daykin, C.A.; Fan, T.W.-M.; Fiehn, O.; Goodacre, R.; Griffin, J.L.; et al. Proposed minimum reporting standards for chemical analysis Chemical Analysis Working Group (CAWG) Metabolomics Standards Initiative (MSI). Metabolomics 2007, 3, 211–221. [Google Scholar] [CrossRef]
- Sysi-Aho, M.; Katajamaa, M.; Yetukuri, L.; Oresic, M. Normalization method for metabolomics data using optimal selection of multiple internal standards. BMC Bioinformatics 2007, 8, 93. [Google Scholar] [CrossRef] [PubMed]
- Mevik, B.-H.; Wehrens, R. The pls Package: Principal Component and Partial Least Squares Regression in R. J. Stat. Softw. 2007. [Google Scholar] [CrossRef]
- Kuhn, M. Building Predictive Models in R Using the caret Package. J. Stat. Softw. 2008, 28, 1–26. [Google Scholar] [CrossRef]
- Bijlsma, S.; Bobeldijk, I.; Verheij, E.R.; Ramaker, R.; Kochhar, S.; Macdonald, I.A.; van Ommen, B.; Smilde, A.K. Large-scale human metabolomics studies: A strategy for data (pre-) processing and validation. Anal. Chem. 2006, 78, 567–574. [Google Scholar] [CrossRef] [PubMed]
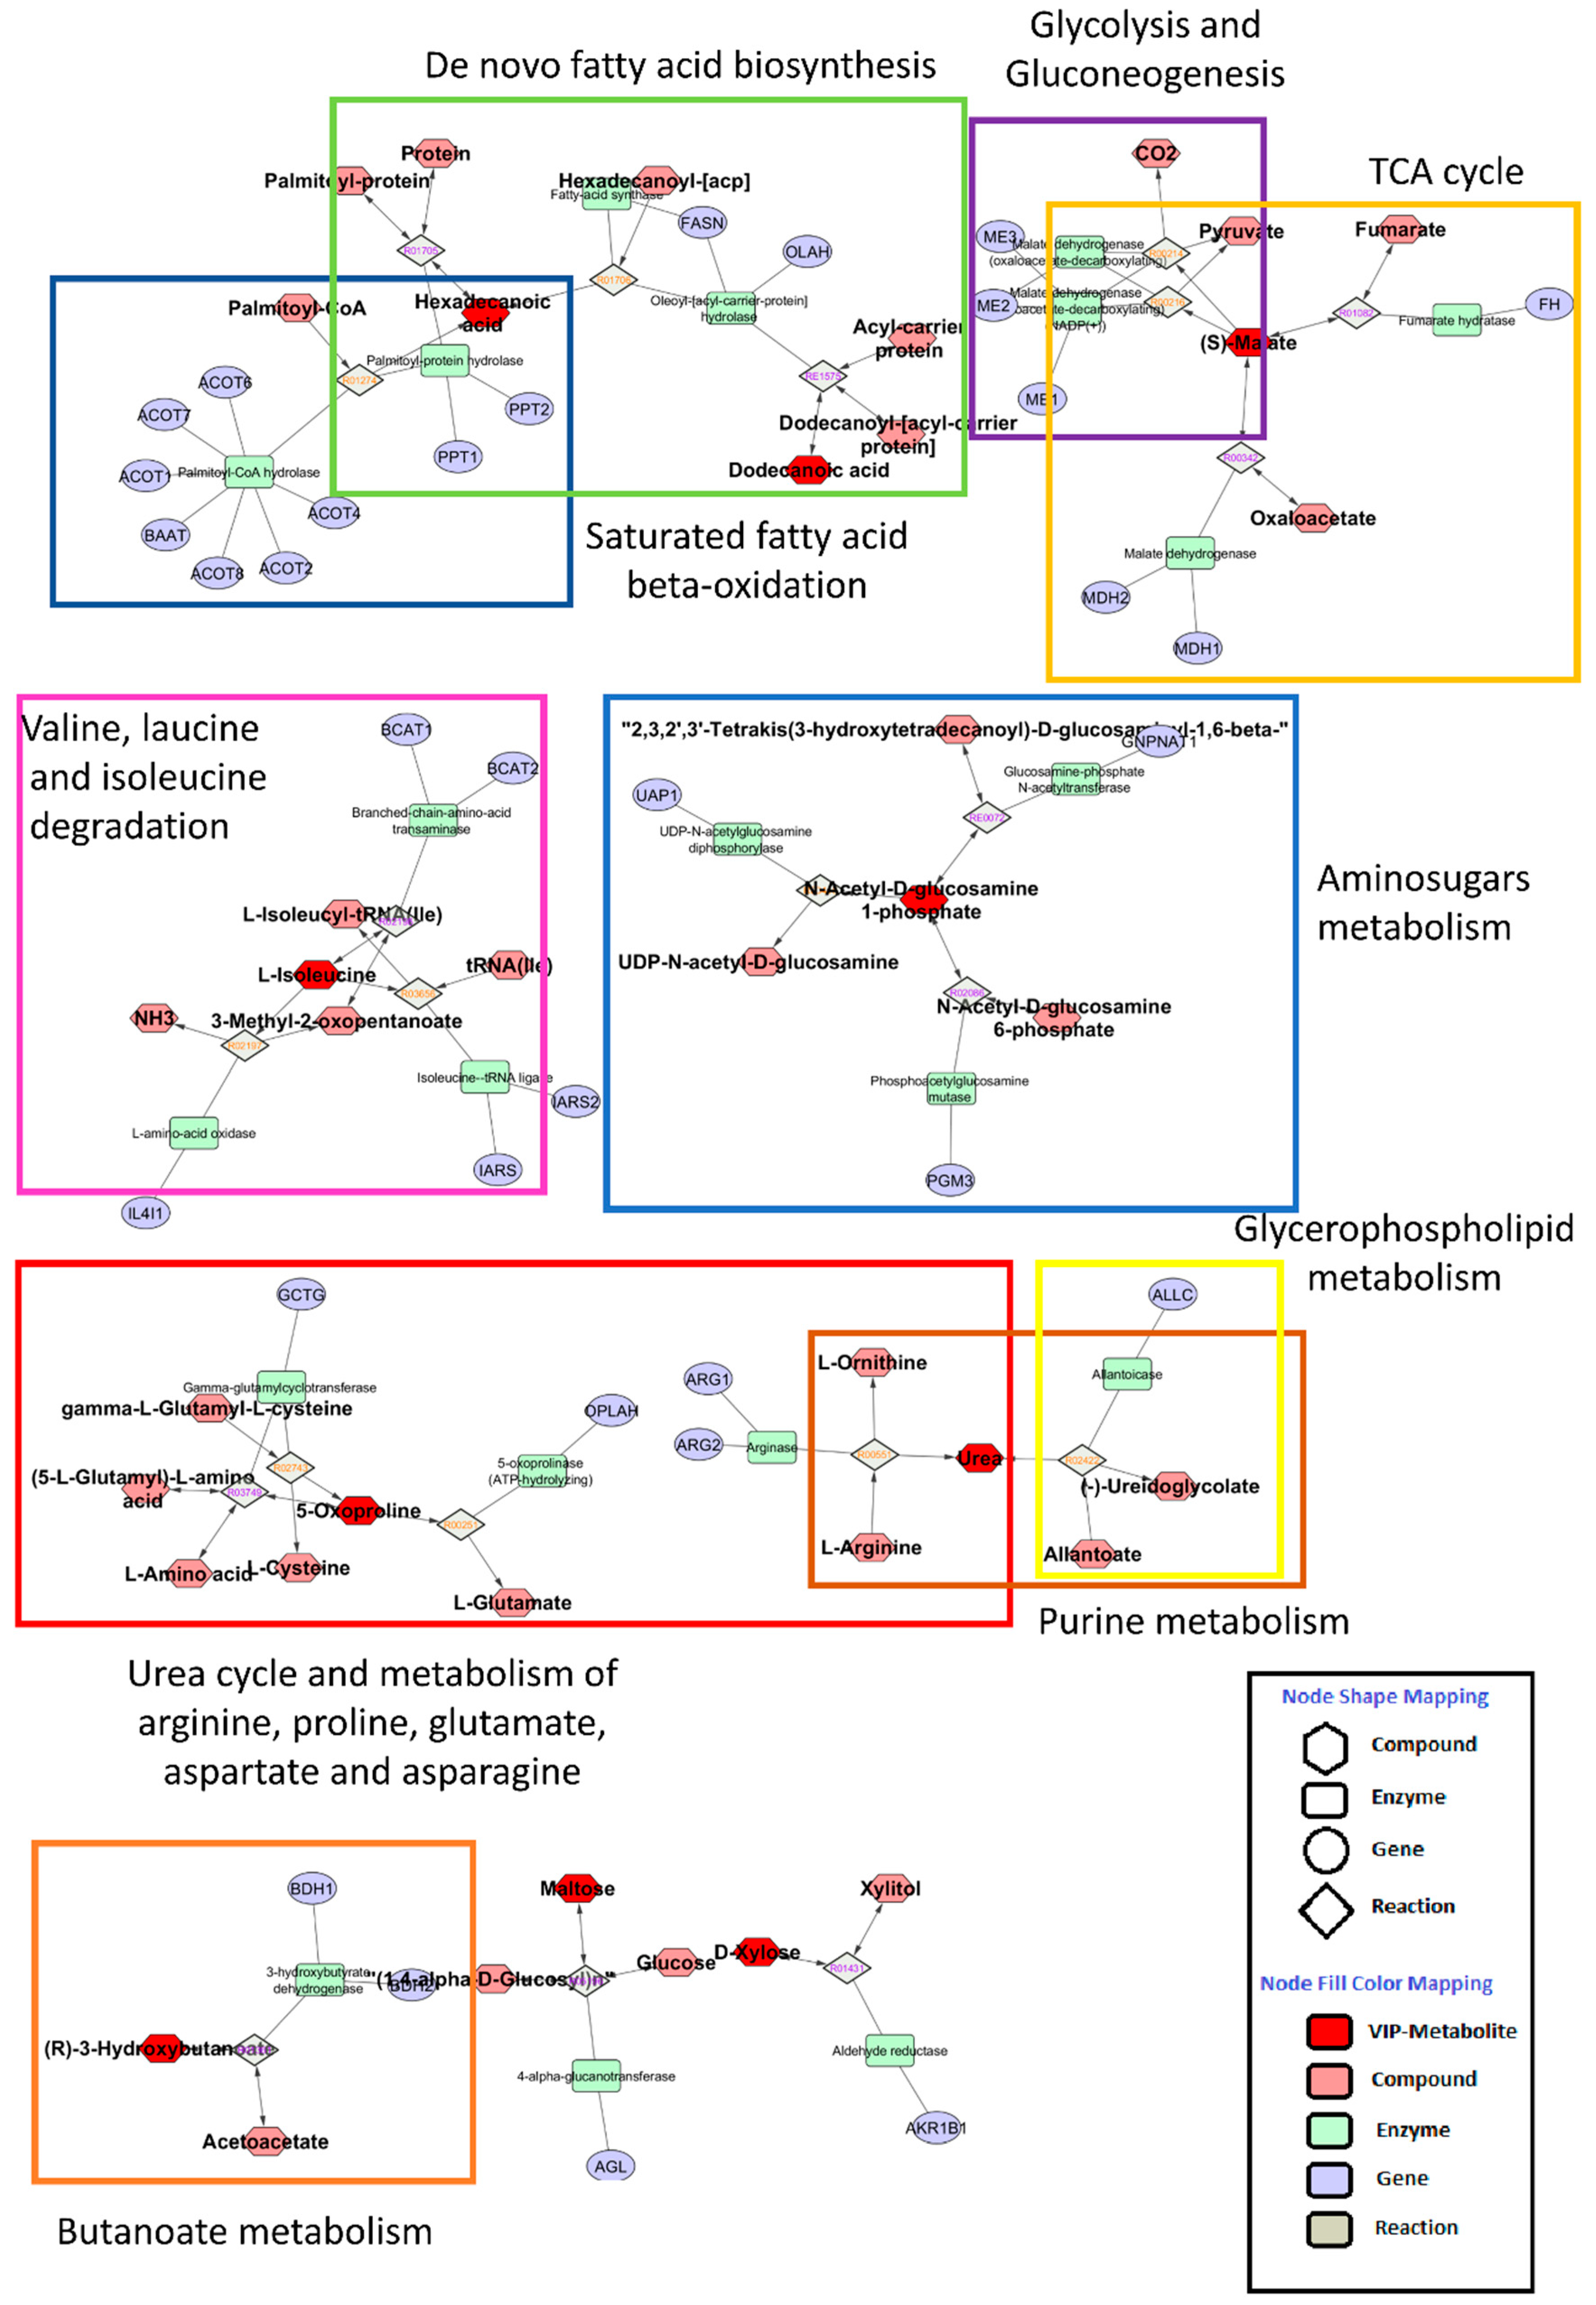
- Karnovsky, A.; Weymouth, T.; Hull, T.; Tarcea, V.G.; Scardoni, G.; Laudanna, C.; Sartor, M.A.; Stringer, K.A.; Jagadish, H.V.; Burant, C.; et al. Metscape 2 bioinformatics tool for the analysis and visualization of metabolomics and gene expression data. Bioinformatics 2012, 28, 373–380. [Google Scholar] [CrossRef] [PubMed]
- Nishida, K.; Ono, K.; Kanaya, S.; Takahashi, K. KEGGscape: A Cytoscape app for pathway data integration. F1000Research 2014, 3, 144. [Google Scholar] [CrossRef] [PubMed]
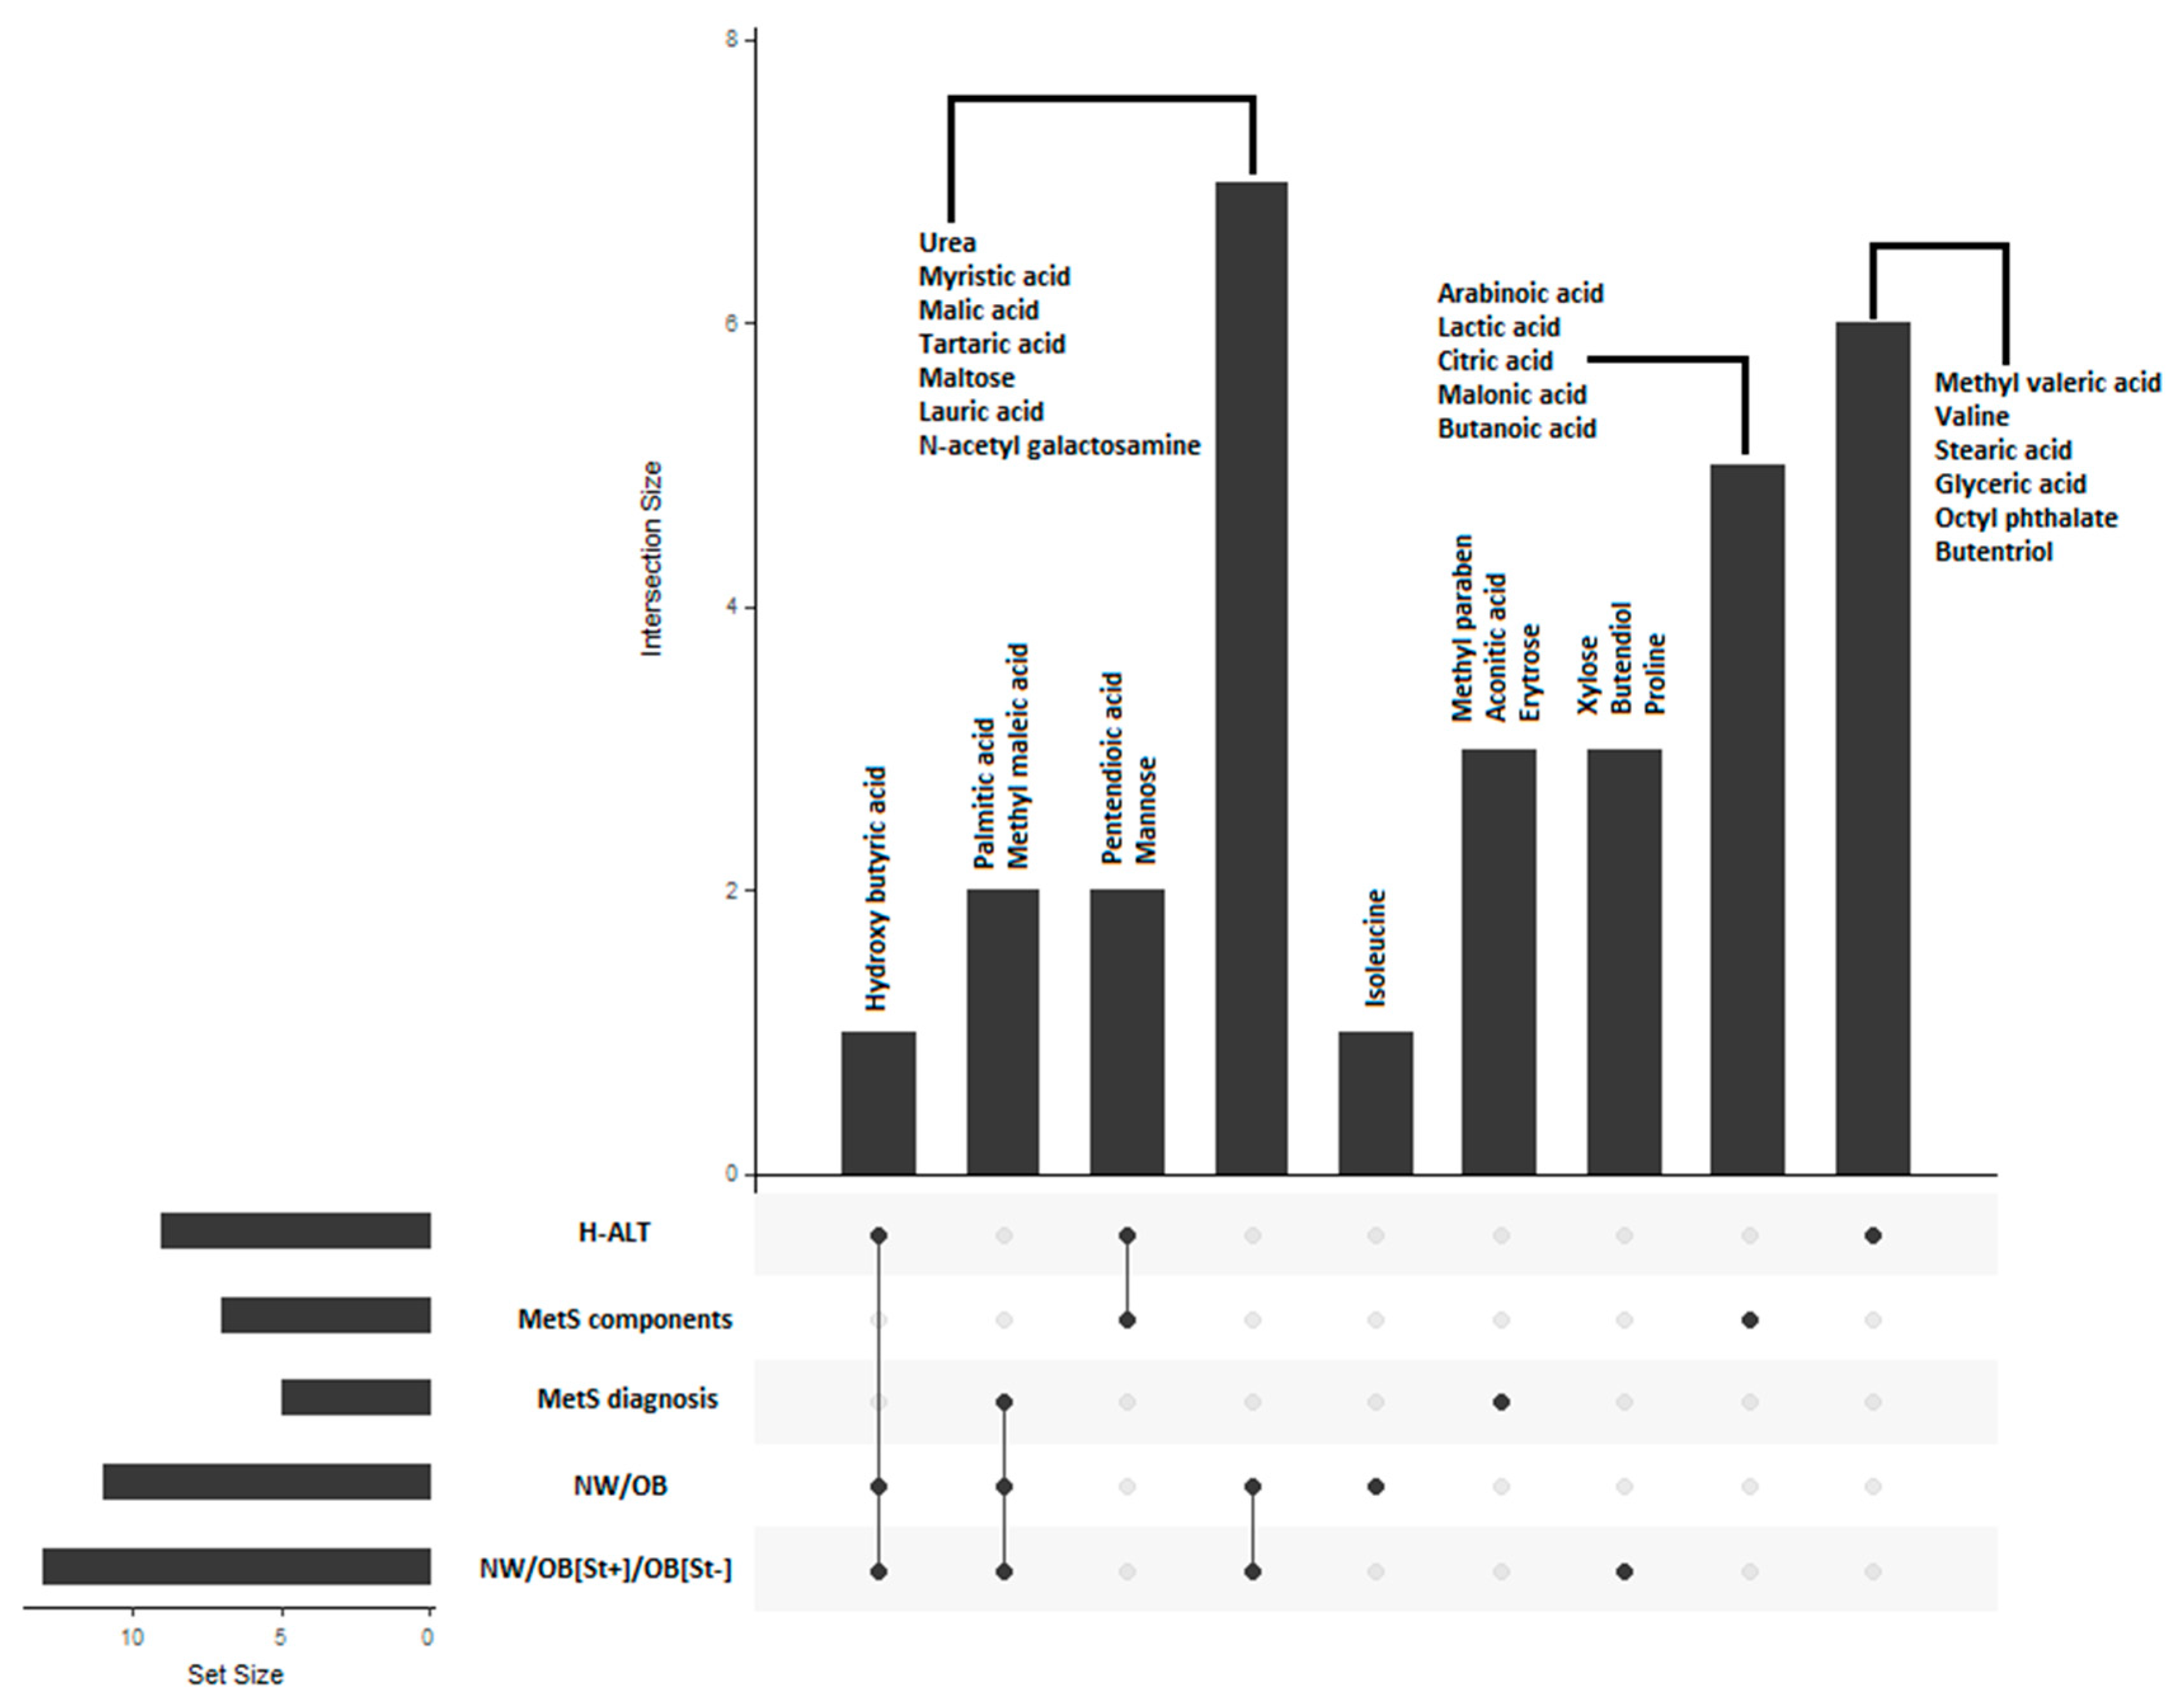
- Lex, A.; Gehlenborg, N.; Strobelt, H.; Vuillemot, R.; Pfister, H. UpSet: Visualization of Intersecting Sets. IEEE Trans. Vis. Comput. Gr. 2014, 20, 1983–1992. [Google Scholar] [CrossRef] [PubMed] [Green Version]
- Francavilla, R.; Ercolini, D.; Piccolo, M.; Vannini, L.; Siragusa, S.; De Filippis, F.; De Pasquale, I.; Di Cagno, R.; Di Toma, M.; Gozzi, G.; et al. Salivary microbiota and metabolome associated with celiac disease. Appl. Environ. Microbiol. 2014, 80, 3416–3425. [Google Scholar] [CrossRef]
- Santone, C.; Dinallo, V.; Paci, M.; D’Ottavio, S.; Barbato, G.; Bernardini, S. Saliva metabolomics by NMR for the evaluation of sport performance. J. Pharm. Biomed. 2014, 88, 441–446. [Google Scholar] [CrossRef]
- Rao, P.V.; Reddy, A.P.; Lu, X.; Dasari, S.; Krishnaprasad, A.; Biggs, E.; Roberts, C.T.; Nagalla, S.R. Proteomic identification of salivary biomarkers of type-2 diabetes. J. Proteome Res. 2009, 8, 239–245. [Google Scholar] [CrossRef]
- Pappa, E.; Vastardis, H.; Mermelekas, G.; Gerasimidi-Vazeou, A.; Zoidakis, J.; Vougas, K. Saliva Proteomics Analysis Offers Insights on Type 1 Diabetes Pathology in a Pediatric Population. Front. Physiol. 2018, 9, 444. [Google Scholar] [CrossRef] [PubMed]
- Walton, E.L. Saliva biomarkers in neurological disorders: A “spitting image” of brain health? Biomed. J. 2018, 41, 59–62. [Google Scholar] [CrossRef] [PubMed]
- Goffredo, M.; Santoro, N.; Tricò, D.; Giannini, C.; D’Adamo, E.; Zhao, H.; Peng, G.; Yu, X.; Lam, T.T.; Pierpont, B. A branched-chain amino acid-related metabolic signature characterizes obese adolescents with non-alcoholic fatty liver disease. Nutrients 2017, 9, 642. [Google Scholar] [CrossRef] [PubMed]
- Wu, N.; Wang, W.; Yi, M.; Cheng, S.; Wang, D. Study of the Metabolomics Characteristics of Patients with Metabolic Syndrome Based on Liquid Chromatography Quadrupole Time-Of-Flight Mass Spectrometry; Elsevier: Amsterdam, The Netherlands, 2018; Volume 79, pp. 37–44. [Google Scholar]
- Reddy, P.; Leong, J.; Jialal, I. Amino acid levels in nascent metabolic syndrome: A contributor to the pro-inflammatory burden. J. Diabetes Complicat. 2018, 32, 465–469. [Google Scholar] [CrossRef] [PubMed]
- Wasilewska, N.; Bobrus-Chociej, A.; Harasim-Symbor, E.; Tarasów, E.; Wojtkowska, M.; Chabowski, A.; Lebensztejn, D. Serum concentration of ceramides in obese children with nonalcoholic fatty liver disease. J. Pediatr. Gastroenterol. Nutr. 2018, 66, S2. [Google Scholar] [CrossRef] [PubMed]
- Badoud, F.; Lam, K.P.; Perreault, M.; Zulyniak, M.A.; Britz-McKibbin, P.; Mutch, D.M. Metabolomics reveals metabolically healthy and unhealthy obese individuals differ in their response to a caloric challenge. PLoS ONE 2015, 10, e0134613. [Google Scholar] [CrossRef] [PubMed]
- Aristizabal, J.C.; Barona, J.; Gonzalez-Zapata, L.I.; Deossa, G.C.; Estrada, A. Fatty acid content of plasma triglycerides may contribute to the heterogeneity in the relationship between abdominal obesity and the metabolic syndrome. Metab. Syndr. Relat. Disord. 2016, 14, 311–317. [Google Scholar] [CrossRef] [PubMed]
- Aristizabal, J.C.; González-Zapata, L.I.; Estrada-Restrepo, A.; Monsalve-Alvarez, J.; Restrepo-Mesa, S.L.; Gaitán, D. Concentrations of plasma free palmitoleic and dihomo-gamma linoleic fatty acids are higher in children with abdominal obesity. Nutrients 2018, 10, 31. [Google Scholar] [CrossRef]
- Kang, M.; Lee, A.; Yoo, H.J.; Kim, M.; Kim, M.; Shin, D.Y.; Lee, J.H. Association between increased visceral fat area and alterations in plasma fatty acid profile in overweight subjects: A cross-sectional study. Lipids Health Dis. 2017, 16, 248. [Google Scholar] [CrossRef]
- Takato, T.; Iwata, K.; Murakami, C.; Wada, Y.; Sakane, F. Chronic administration of myristic acid improves hyperglycaemia in the Nagoya–Shibata–Yasuda mouse model of congenital type 2 diabetes. Diabetologia 2017, 60, 2076–2083. [Google Scholar] [CrossRef]
- Qi, S.; Xu, D.; Li, Q.; Xie, N.; Xia, J.; Huo, Q.; Li, P.; Chen, Q.; Huang, S. Metabonomics screening of serum identifies pyroglutamate as a diagnostic biomarker for nonalcoholic steatohepatitis. Clin. Chim. Acta 2017, 473, 89–95. [Google Scholar] [CrossRef]
- Magge, S.N.; Goodman, E.; Armstrong, S.C. The Metabolic Syndrome in Children and Adolescents: Shifting the Focus to Cardiometabolic Risk Factor Clustering. Pediatrics 2017, 24, e20171603. [Google Scholar] [CrossRef]
- Denny, P.; Hagen, F.K.; Hardt, M.; Liao, L.; Yan, W.; Arellanno, M.; Bassilian, S.; Bedi, G.S.; Boontheung, P.; Cociorva, D. The proteomes of human parotid and submandibular/sublingual gland salivas collected as the ductal secretions. J. Proteome Res. 2008, 7, 1994–2006. [Google Scholar] [CrossRef]
- Tiwari, M. Science behind human saliva. J. Nat. Sci. Biol. Med. 2011, 2, 53–58. [Google Scholar] [CrossRef]
- Vajro, P.; Lenta, S.; Socha, P.; Dhawan, A.; McKiernan, P.; Baumann, U.; Durmaz, O.; Lacaille, F.; McLin, V.; Nobili, V. Diagnosis of nonalcoholic fatty liver disease in children and adolescents: Position paper of the ESPGHAN Hepatology Committee. J. Pediatr. Gastroenterol. Nutr. 2012, 54, 700–713. [Google Scholar] [CrossRef]
- Vos, M.B.; Abrams, S.H.; Barlow, S.E.; Caprio, S.; Daniels, S.R.; Kohli, R.; Mouzaki, M.; Sathya, P.; Schwimmer, J.B.; Sundaram, S.S. NASPGHAN clinical practice guideline for the diagnosis and treatment of nonalcoholic fatty liver disease in children: Recommendations from the Expert Committee on NAFLD (ECON) and the North American Society of Pediatric Gastroenterology, Hepatology and Nutrition (NASPGHAN). J. Pediatr. Gastroenterol. Nutr. 2017, 64, 319–334. [Google Scholar]
- Koot, B.G.; van der Baan-Slootweg, O.H.; Bohte, A.E.; Nederveen, A.J.; van Werven, J.R.; Tamminga-Smeulders, C.L.; Merkus, M.P.; Schaap, F.G.; Jansen, P.L.; Stoker, J. Accuracy of prediction scores and novel biomarkers for predicting nonalcoholic fatty liver disease in obese children. Obesity 2013, 21, 583–590. [Google Scholar] [CrossRef]
- Marin Martinez, L.; Molino Pagan, D.; Lopez Jornet, P. Trace Elements in Saliva as Markers of Type 2 Diabetes Mellitus. Biol. Trace Elem. Res. 2018, 186, 354–360. [Google Scholar] [CrossRef]
- Abdalla, M.M.I.; Soon, S.C. Salivary adiponectin concentration in healthy adult males in relation to anthropometric measures and fat distribution. Endocr. Regul. 2017, 51, 185–192. [Google Scholar] [CrossRef] [Green Version]
- Ibrahim Abdalla, M.M.; Siew Choo, S. Salivary Leptin Level in Young Adult Males and its Association with Anthropometric Measurements, Fat Distribution and Muscle Mass. Eur. Endocrinol. 2018, 14, 94–98. [Google Scholar] [CrossRef]
- Vriens, A.; Provost, E.B.; Saenen, N.D.; De Boever, P.; Vrijens, K.; De Wever, O.; Plusquin, M.; Nawrot, T.S. Children’s screen time alters the expression of saliva extracellular miR-222 and miR-146a. Sci. Rep. 2018, 8, 8209. [Google Scholar] [CrossRef]


| Anthropometric and Laboratory Parameters | Controls (n = 18) | Obese with Steatosis (n = 15) | Obese without Steatosis (n = 8) | All Obese (n = 23) |
|---|---|---|---|---|
| Gender (M/F) | 13/5 | 10/5 | 4/4 | 14/9 |
| Age (years) | 10.53 ± 2.57 | 12.48 ± 2.77 * | 12.51 ± 2.79 * | 12.49 ± 2.71 * |
| Weight (kg) | 37.42 ± 11.26 | 79.99 ± 28.76 * | 71.9 ± 17.31 * | 77.18 ± 25.24 * |
| Height (cm) | 140.17 ± 15.17 | 153.41 ± 19.27 * | 157.45 ± 11.97 * | 154.52 ± 16.88 * |
| BMI (kg/cm2) | 18.52 ± 2.92 | 32.80 ± 6.94 * | 28.93 ± 5.58 * | 31.45 ± 6.65 * |
| BMI percentile | 23.75 ± 34.25 | 95.14 ± 0.53 * | 95.67 ± 1.03 * | 95.40 ± 1.05 * |
| Waist circumference (cm) | 61.14 ± 7.11 | 93.27 ± 12.68 * | 86.00 ± 14.53 * | 90.74 ± 13.49 * |
| WC percentile | 65.85 ± 24.58 | 94.98 ± 0.97 * | 94.38 ± 1.77 * | 94.78 ± 1.04 * |
| Cm WC > 95th percentile | 0 | 21.03 ± 10.57 * | 14.00 ± 10.99 * | 18.59 ± 11.01 * |
| WtHR | 0.43 ± 0.03 | 0.61 ± 0.05 * | 0.55 ± 0.08 * | 0.59 ± 0.07 * |
| Neck circumference (cm) | 27.67 ± 2.41 | 36.05 ± 4.33 * | 34.69 ± 4.08 * | 35.58 ± 4.20 * |
| NC percentile | 44.12 ± 33.22 | 95.57 ± 5.35 * | 92.61 ± 3.15 | 94.09 ± 4.26 * |
| Cm NC > 95th percentile | 0 | 3.71 ± 2.77 * | 2.41 ± 2.75 * | 3.26 ± 2.77 * |
| SBP (mmHg) | 95.98 ± 11.95 | 127.47 ± 8.95 * | 125.63 ± 20.23 * | 126.83 ± 13.49 * |
| SBP percentile | 50.00 ± 0 | 86.93 ± 19.36 * | 83.50 ± 20.96 * | 85.74 ± 19.52 * |
| DBP (mmHg) | 55.00 ± 10.77 | 61.53 ± 10.42 * | 60.75 ± 11.70 * | 61.26 ± 10.62 * |
| DBP percentile | 50.00 ± 0 | 56.00 ± 15.83 * | 55.00 ± 14.14 * | 55.65 ± 14.95 * |
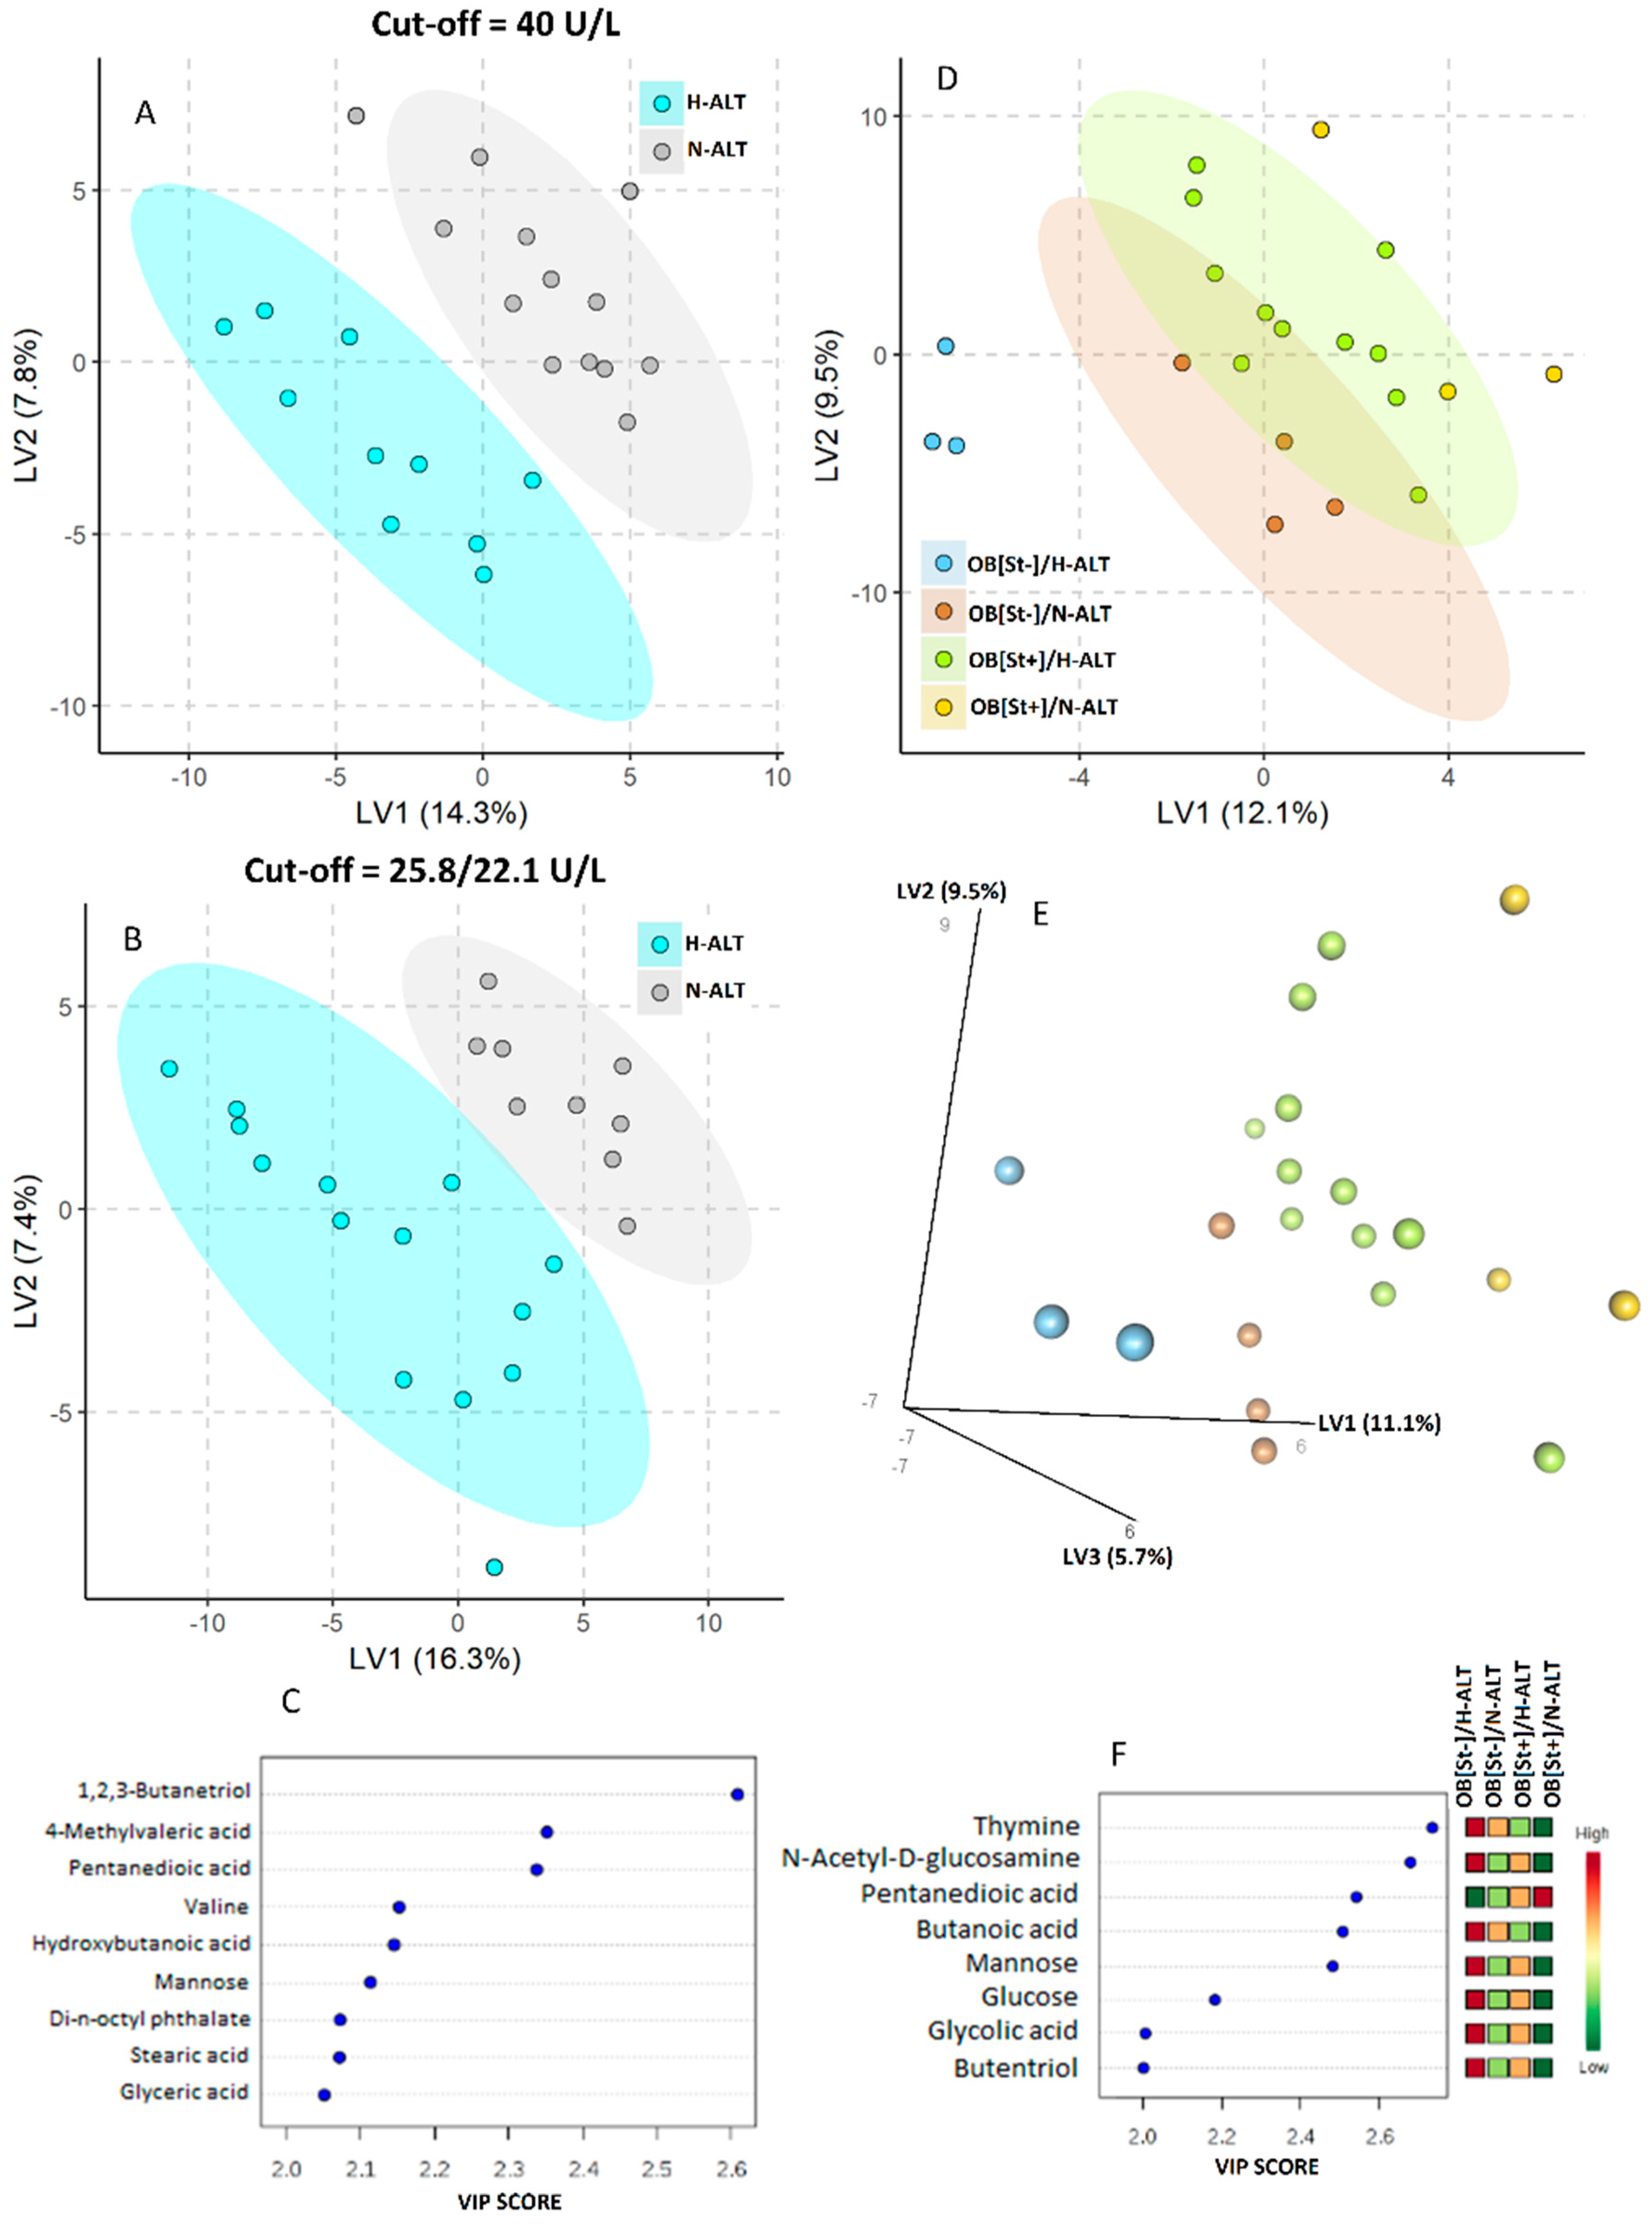
| ALT (U/L) | 17.33 ± 4.31 | 50.17 ± 28.75 * | 34.50 ± 37.74 * | 44.72 ± 32.21 * |
| AST (U/L) | 24.72 ± 4.87 | 46.19 ± 28.58 * | 19.75 ± 5.85 | 37.00 ± 26.39 * |
| Total cholesterol (mg/dL) | 148.78 ± 16.38 | 158.17 ± 21.91 * | 162.00 ± 24.20 * | 159.50 ± 22.26 * |
| HDL (mg/dL) | 56.94 ± 14.45 | 45.07 ± 10.21 * | 48.00 ± 5.50 * | 46.09 ± 8.83 * |
| Triglyceride (mg/dL) | Not available | 90.59 ± 26.97 | 138.63 ± 91.90 | 107.30 ± 60.80 |
| Blood glucose (mg/dL) | 83.17 ± 6.61 | 88.59 ± 10.36 * | 90.00 ± 10.34 * | 89.08 ± 10.14 * |
| Salivary glucose (µM) | 3338.36 ± 1274.73 | 3167.86 ± 1192.75 | 2647.09 ± 1227.77 | 2986.70 ± 1203.86 |
| Blood insulin (U/L) | 10.27 ± 5.22 | 24.24 ± 10.95 * | 19.60 ± 6.63 * | 22.62 ± 9.77 * |
| Salivary insulin (nM) | 5.79 ± 2.85 | 20.89 ± 8.69 * | 17.26 ± 6.37 * | 19.60 ± 8.00 * |
| Blood HOMA-IR | 2.01 ± 1.16 | 5.34 ± 2.60 * | 4.11 ± 2.16 * | 4.91 ± 2.48 * |
| Salivary HOMA-IR | 119.7 ± 73.99 | 401.81 ± 231.17 * | 278.79 ± 162.48 * | 358.20 ± 215.35 * |
| Blood uric acid (mg/dL) | 4.04 ± 0.76 | 5.06 ± 1.23 * | 4.42 ± 0.92 * | 4.84 ± 1.15 * |
| Salivary uric acid (µM) | 143.46 ± 4.53 | 157.29 ± 13.04 * | 156.45 ± 15.31 * | 157.00 ± 13.53 * |
| Number (%) of Obese Patients with Hepatic Steatosis | Number (%) of Obese Patients without Hepatic Steatosis | Total (%) | |
|---|---|---|---|
| Sample size | 15(65%) | 8(35%) | 23(100%) |
| Waist circumference >90th percentile | 15(65%) | 7(30%) | 22(95%) |
| Glucose blood levels >100 mg/dL | 4(17%) | 2(9%) | 6(26%) |
| Blood pressure >95th percentile | 10(43%) | 4(17%) | 14(60%) |
| HDL <40 mg/dL | 3(13%) | 0(0%) | 3(13%) |
| TG >150 mg/dL | 2(9%) | 3(13%) | 5(22%) |
| HOMA-IR > 3 | 13(57%) | 5(22%) | 18(79%) |
| Numbers of patients fulfilling MetS Criteria: (WC > 90th percentile and more than two out of four other criteria) | 7(30%) | 3(13%) | 10(43%) |
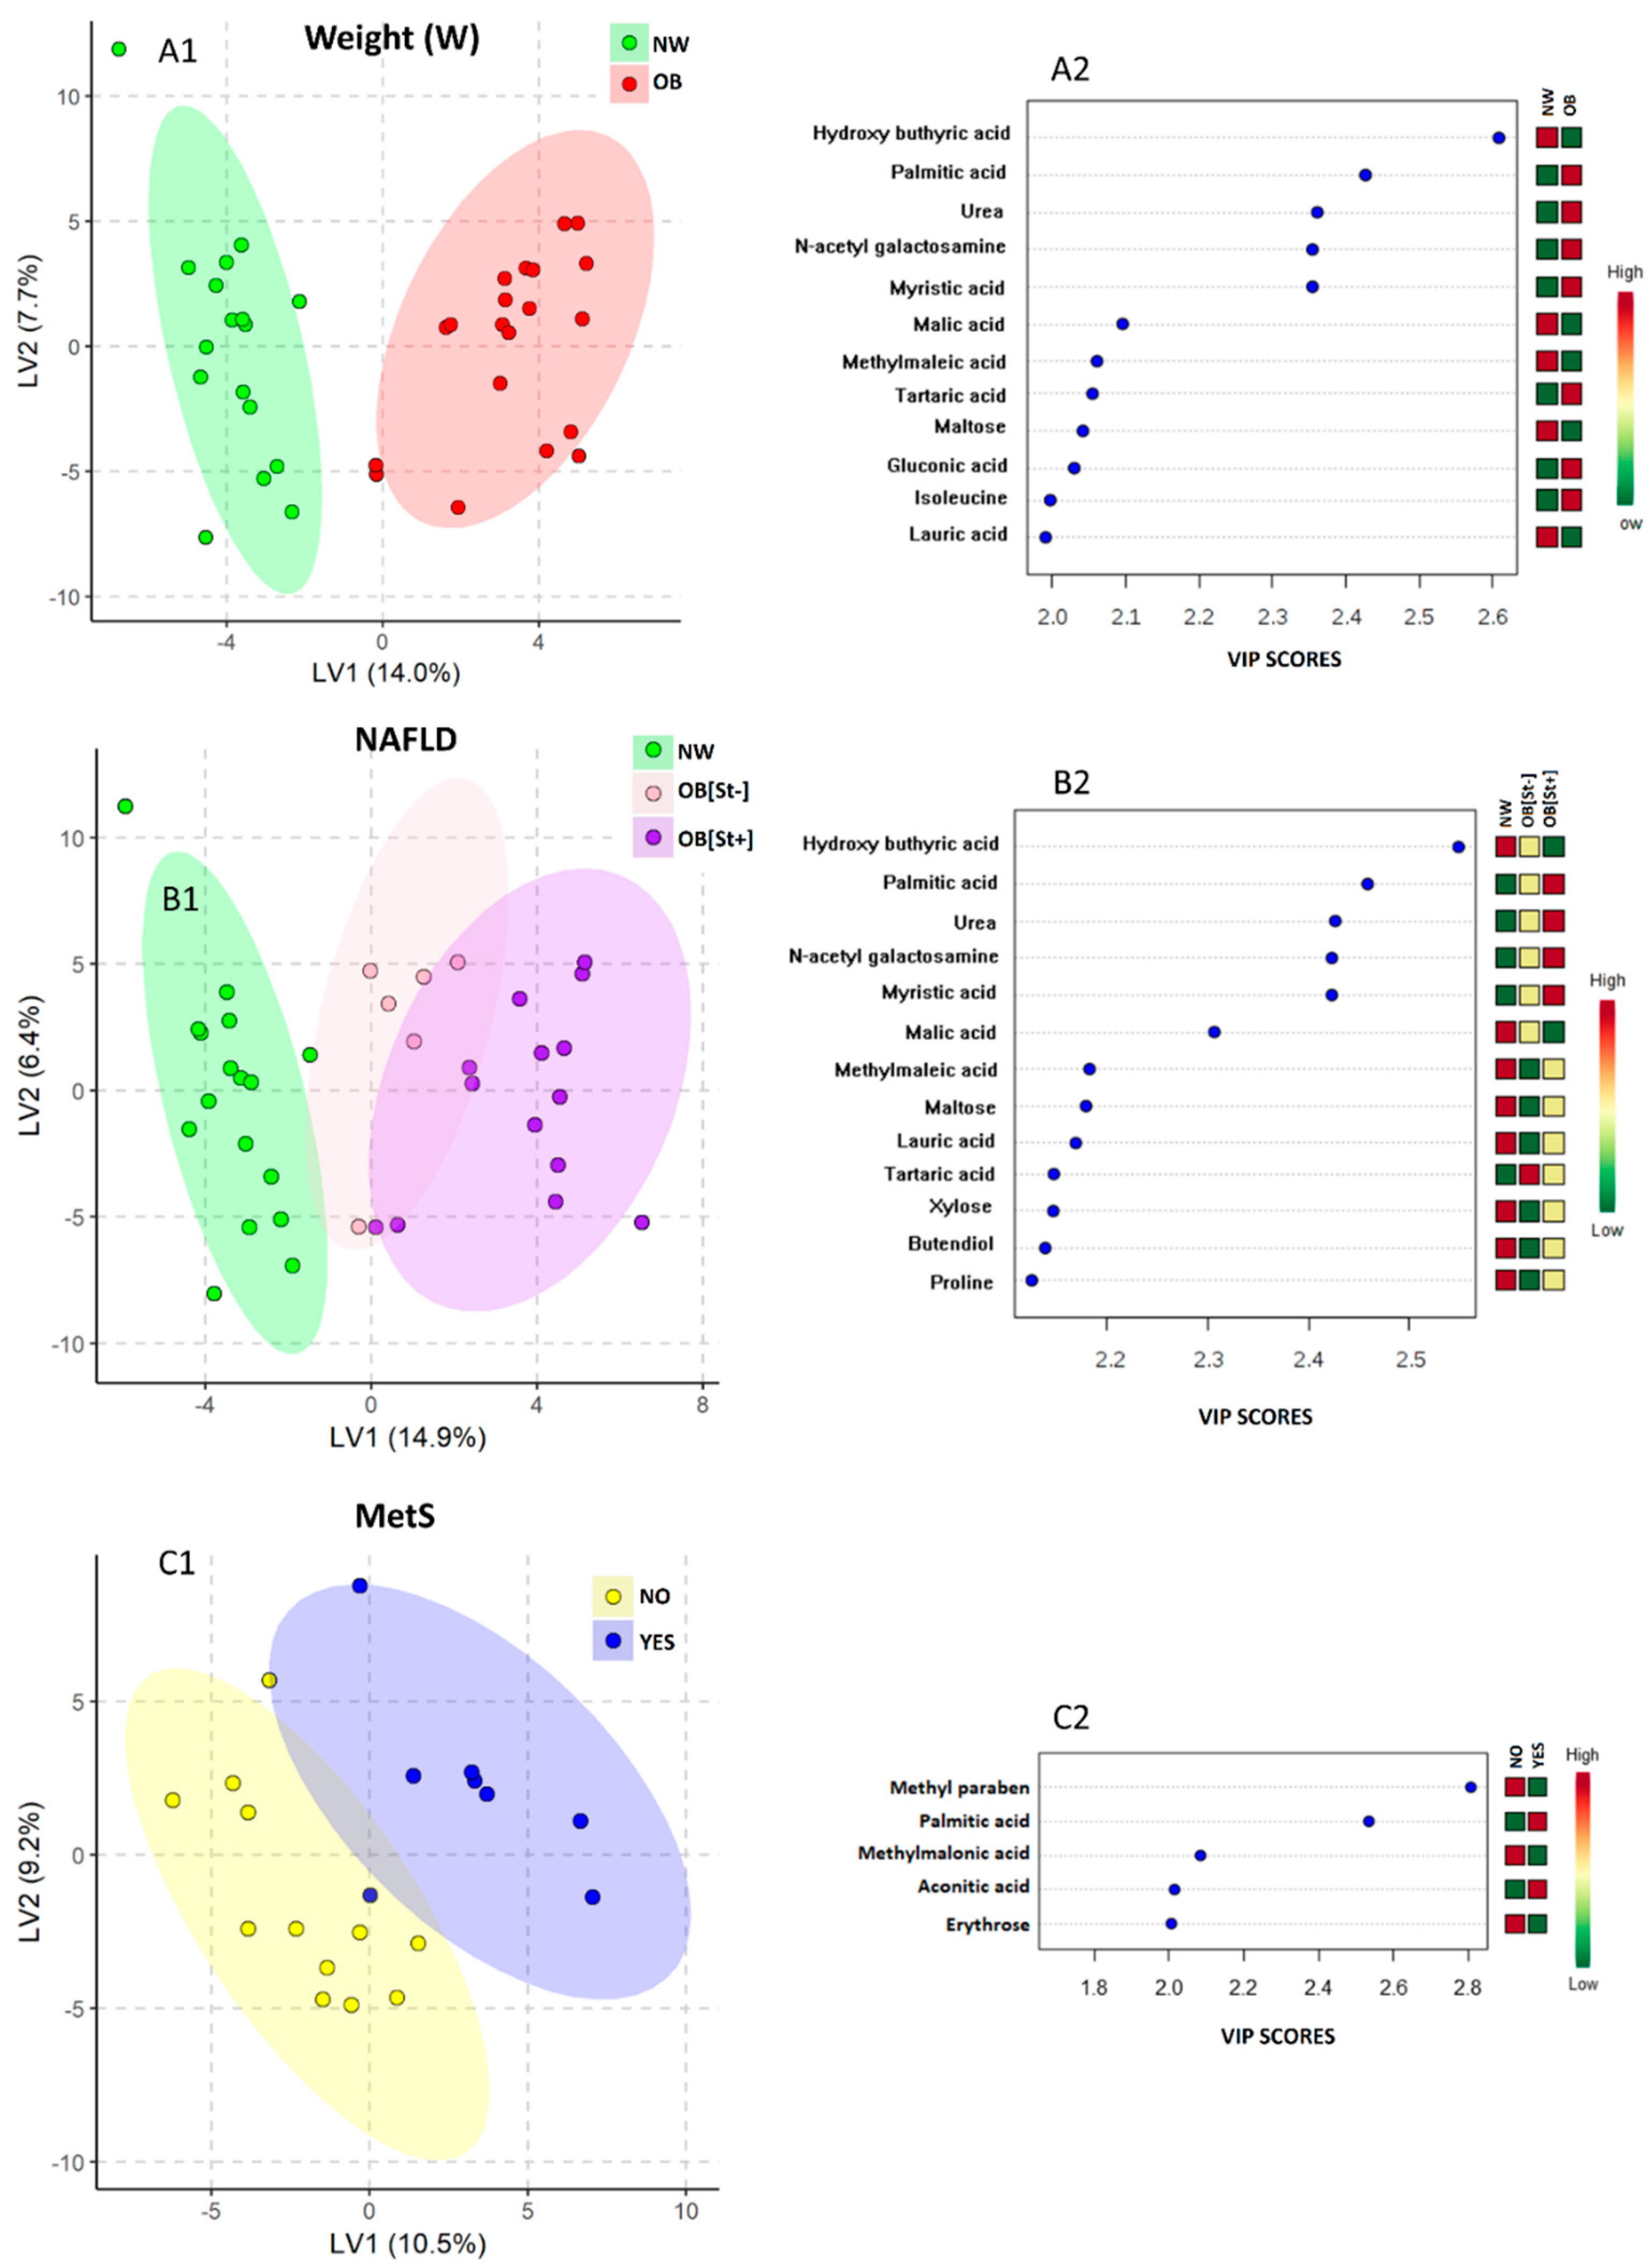
| VIP | NW (n = 18) a | OB[St−] (n = 15) | OB[St+] (n = 8) | p-Value b | MetS− (n = 38) a | MetS+ (n = 3) | p-Value c |
|---|---|---|---|---|---|---|---|
| Hydroxy butyric acid | 0.00697 | −0.14 | −0.62 * | NS | 0.00622 | −1.02 | NS |
| Palmitic acid d | 0.00088 | 4.46 *** | 8.06 ** | NS | 0.00398 | −0.74 | NS |
| Myristic acid | 0.00092 | 3.71 ** | 7.58 * | NS | 0.00375 | −0.66 | NS |
| Lauric acid | 0.00061 | −7.21 ** | −3.35 | NS | 0.00267 | 0.73 | NS |
| Urea | 0.00093 | 4.15 ** | 7.65 ** | NS | 0.00404 | −0.71 | NS |
| N-acetyl galactosamine | 0.00088 | 3.72 ** | 7.60 * | NS | 0.00375 | −0.66 | NS |
| Malic acid | 0.17825 | −0.98 | −0.98 | NS | 0.09066 | 0.96 | NS |
| Methyl maleic acid | 0.01375 | −0.72 | −0.24 | NS | 0.01164 | 0.81 | NS |
| Maltose | 0.07047 | −0.54 | −0.25 | NS | 0.05846 | 0.24 | NS |
| Xylose | 0.00864 | −0.62 | −0.34 | NS | 0.00681 | 0.27 | NS |
| Butanediol | 0.00070 | −6.16 ** | −2.79 | NS | 0.00272 | 0.34 | NS |
| Proline | 0.00999 | −0.56 | −0.25 | NS | 0.00752 | −1.02 | NS |
| Tartaric acid | 0.06401 | 0.52 | 0.40 | NS | 0.04729 | −0.40 | NS |
© 2019 by the authors. Licensee MDPI, Basel, Switzerland. This article is an open access article distributed under the terms and conditions of the Creative Commons Attribution (CC BY) license (http://creativecommons.org/licenses/by/4.0/).
Share and Cite
Troisi, J.; Belmonte, F.; Bisogno, A.; Pierri, L.; Colucci, A.; Scala, G.; Cavallo, P.; Mandato, C.; Di Nuzzi, A.; Di Michele, L.; et al. Metabolomic Salivary Signature of Pediatric Obesity Related Liver Disease and Metabolic Syndrome. Nutrients 2019, 11, 274. https://0-doi-org.brum.beds.ac.uk/10.3390/nu11020274
Troisi J, Belmonte F, Bisogno A, Pierri L, Colucci A, Scala G, Cavallo P, Mandato C, Di Nuzzi A, Di Michele L, et al. Metabolomic Salivary Signature of Pediatric Obesity Related Liver Disease and Metabolic Syndrome. Nutrients. 2019; 11(2):274. https://0-doi-org.brum.beds.ac.uk/10.3390/nu11020274
Chicago/Turabian StyleTroisi, Jacopo, Federica Belmonte, Antonella Bisogno, Luca Pierri, Angelo Colucci, Giovanni Scala, Pierpaolo Cavallo, Claudia Mandato, Antonella Di Nuzzi, Laura Di Michele, and et al. 2019. "Metabolomic Salivary Signature of Pediatric Obesity Related Liver Disease and Metabolic Syndrome" Nutrients 11, no. 2: 274. https://0-doi-org.brum.beds.ac.uk/10.3390/nu11020274