Human Tongue Electrophysiological Response to Oleic Acid and Its Associations with PROP Taster Status and the CD36 Polymorphism (rs1761667)

 , , ,
, , ,  and
and 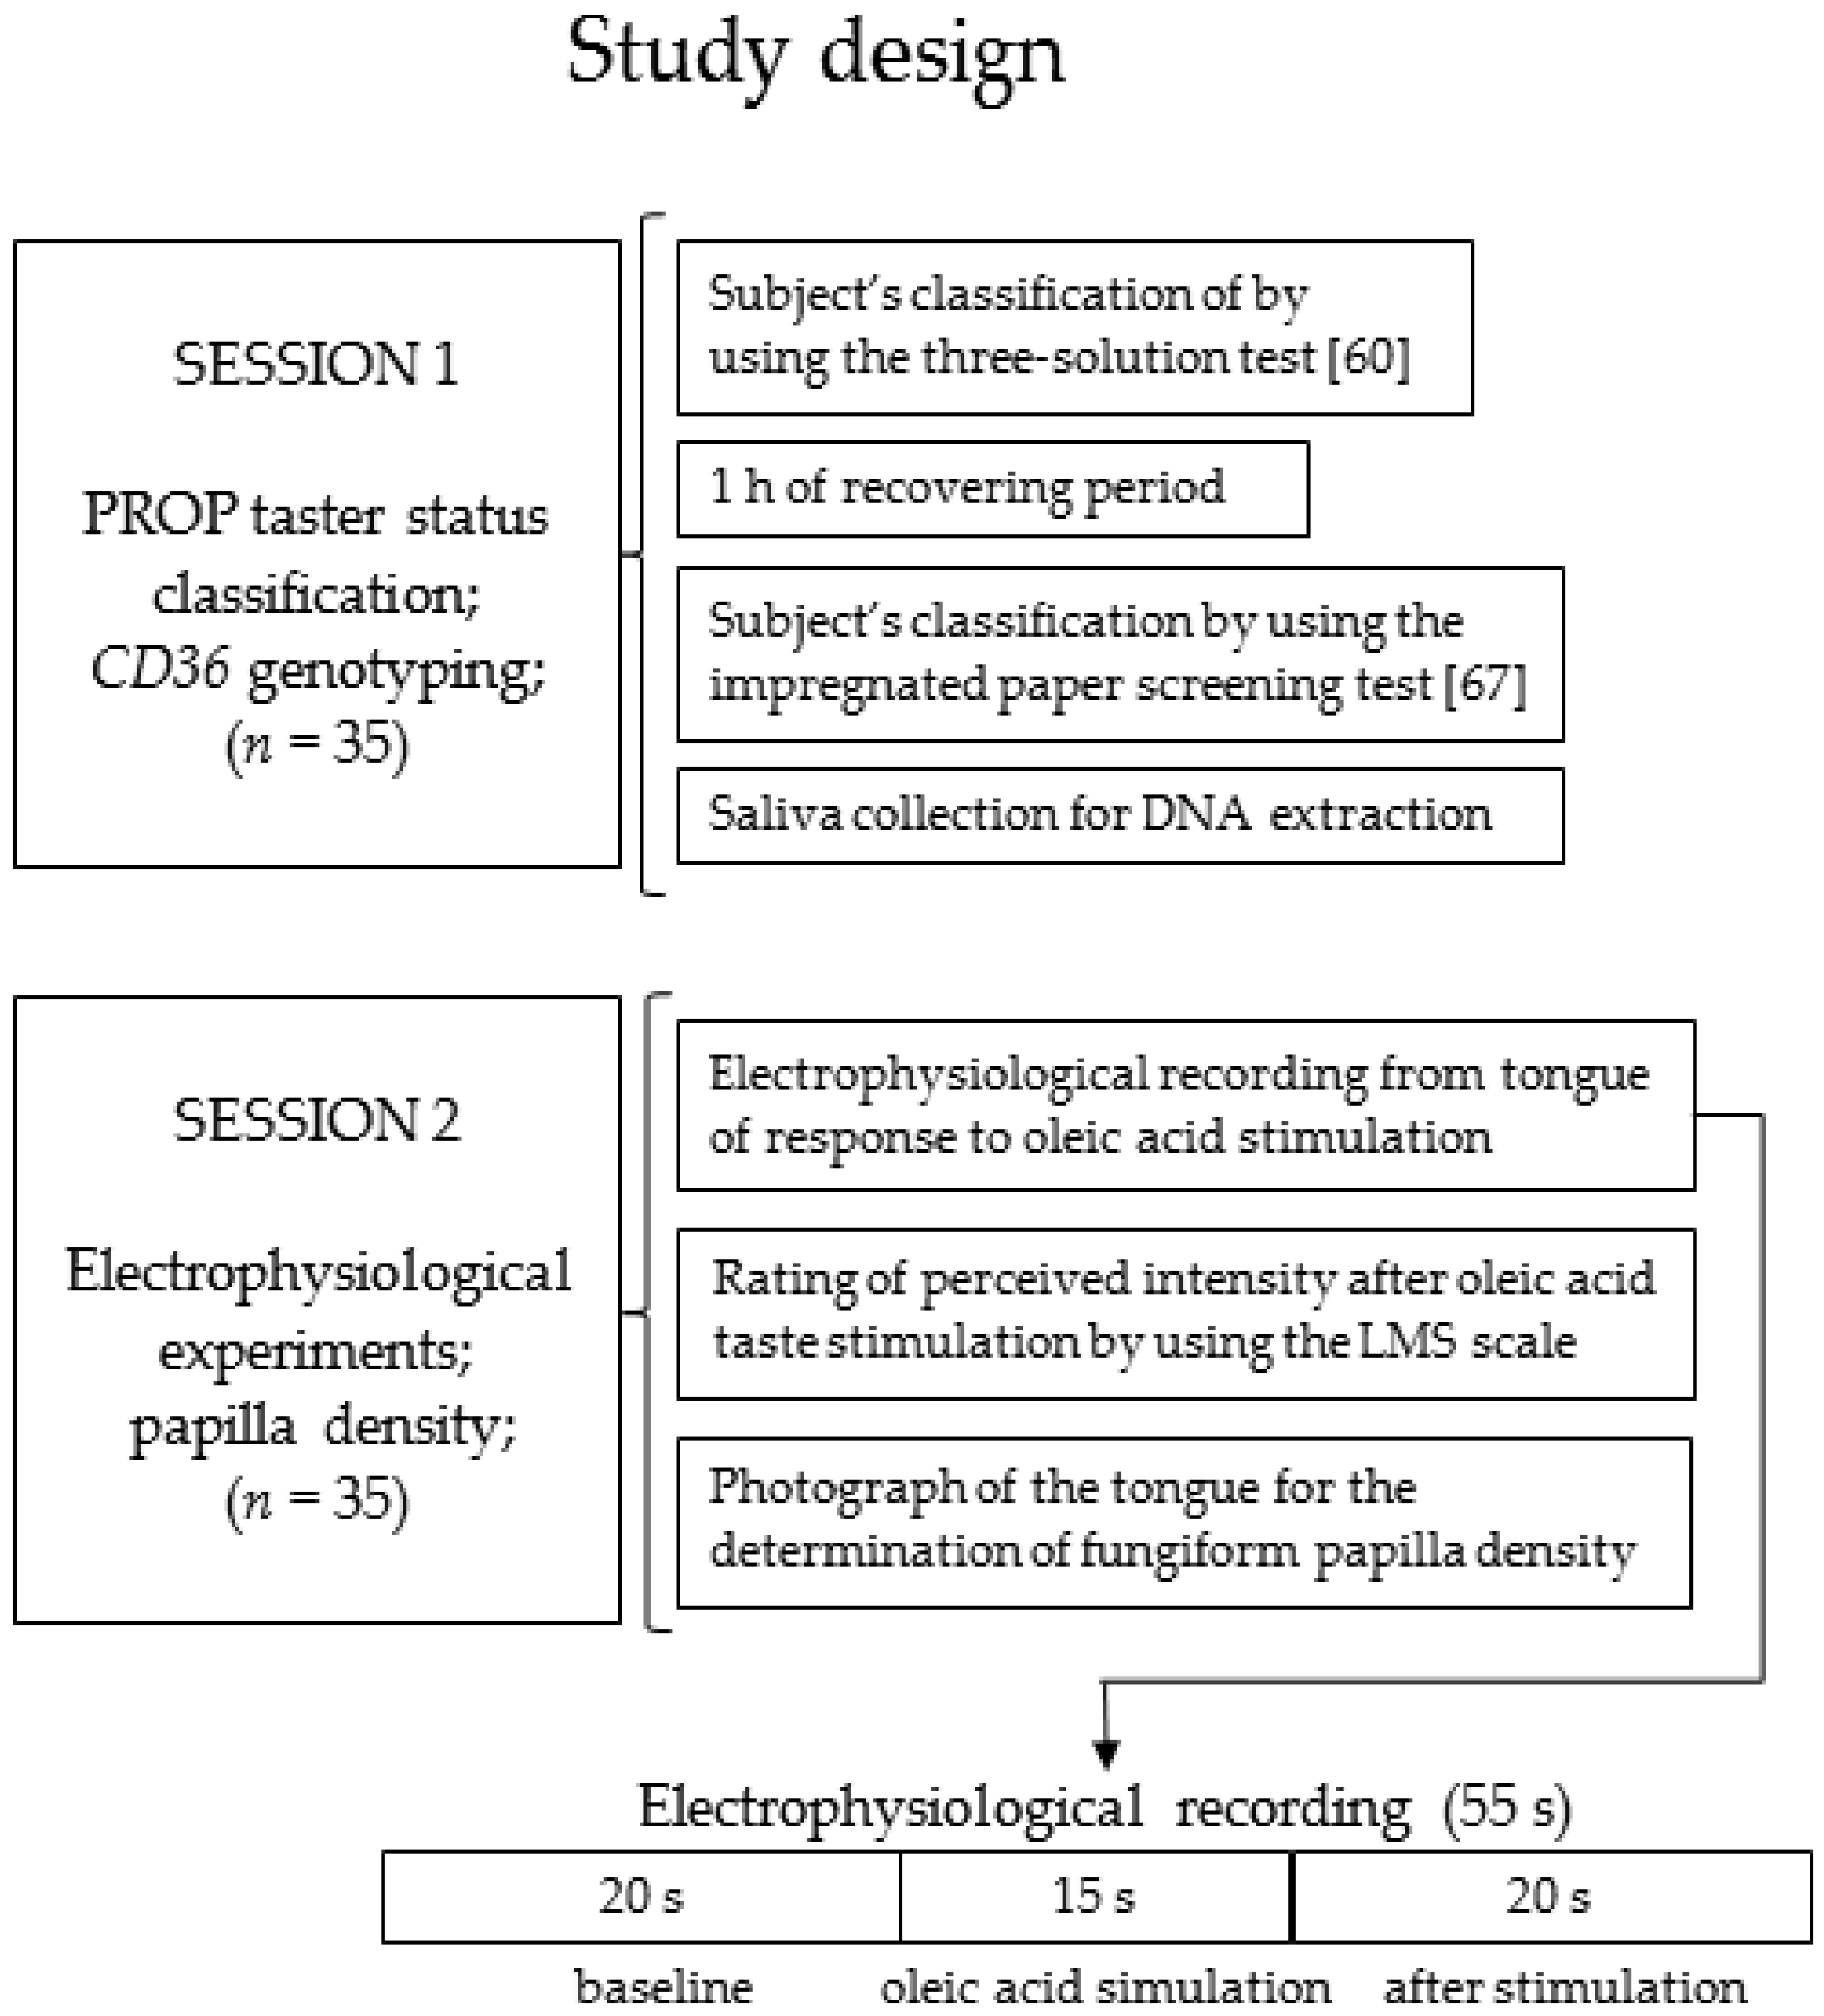
Abstract
:1. Introduction
2. Materials and Methods
2.1. Participants
2.2. Experimental Protocol
2.3. PROP Taster Status Classification
2.4. Molecular Analysis
2.5. Electrophysiological Recordings
2.6. Oleic acid Taste Stimulations
2.7. Density Measurements of Fungiform Papillae
2.8. Statistical Analysis
3. Results
3.1. CD36 Genotyping and Phenotyping
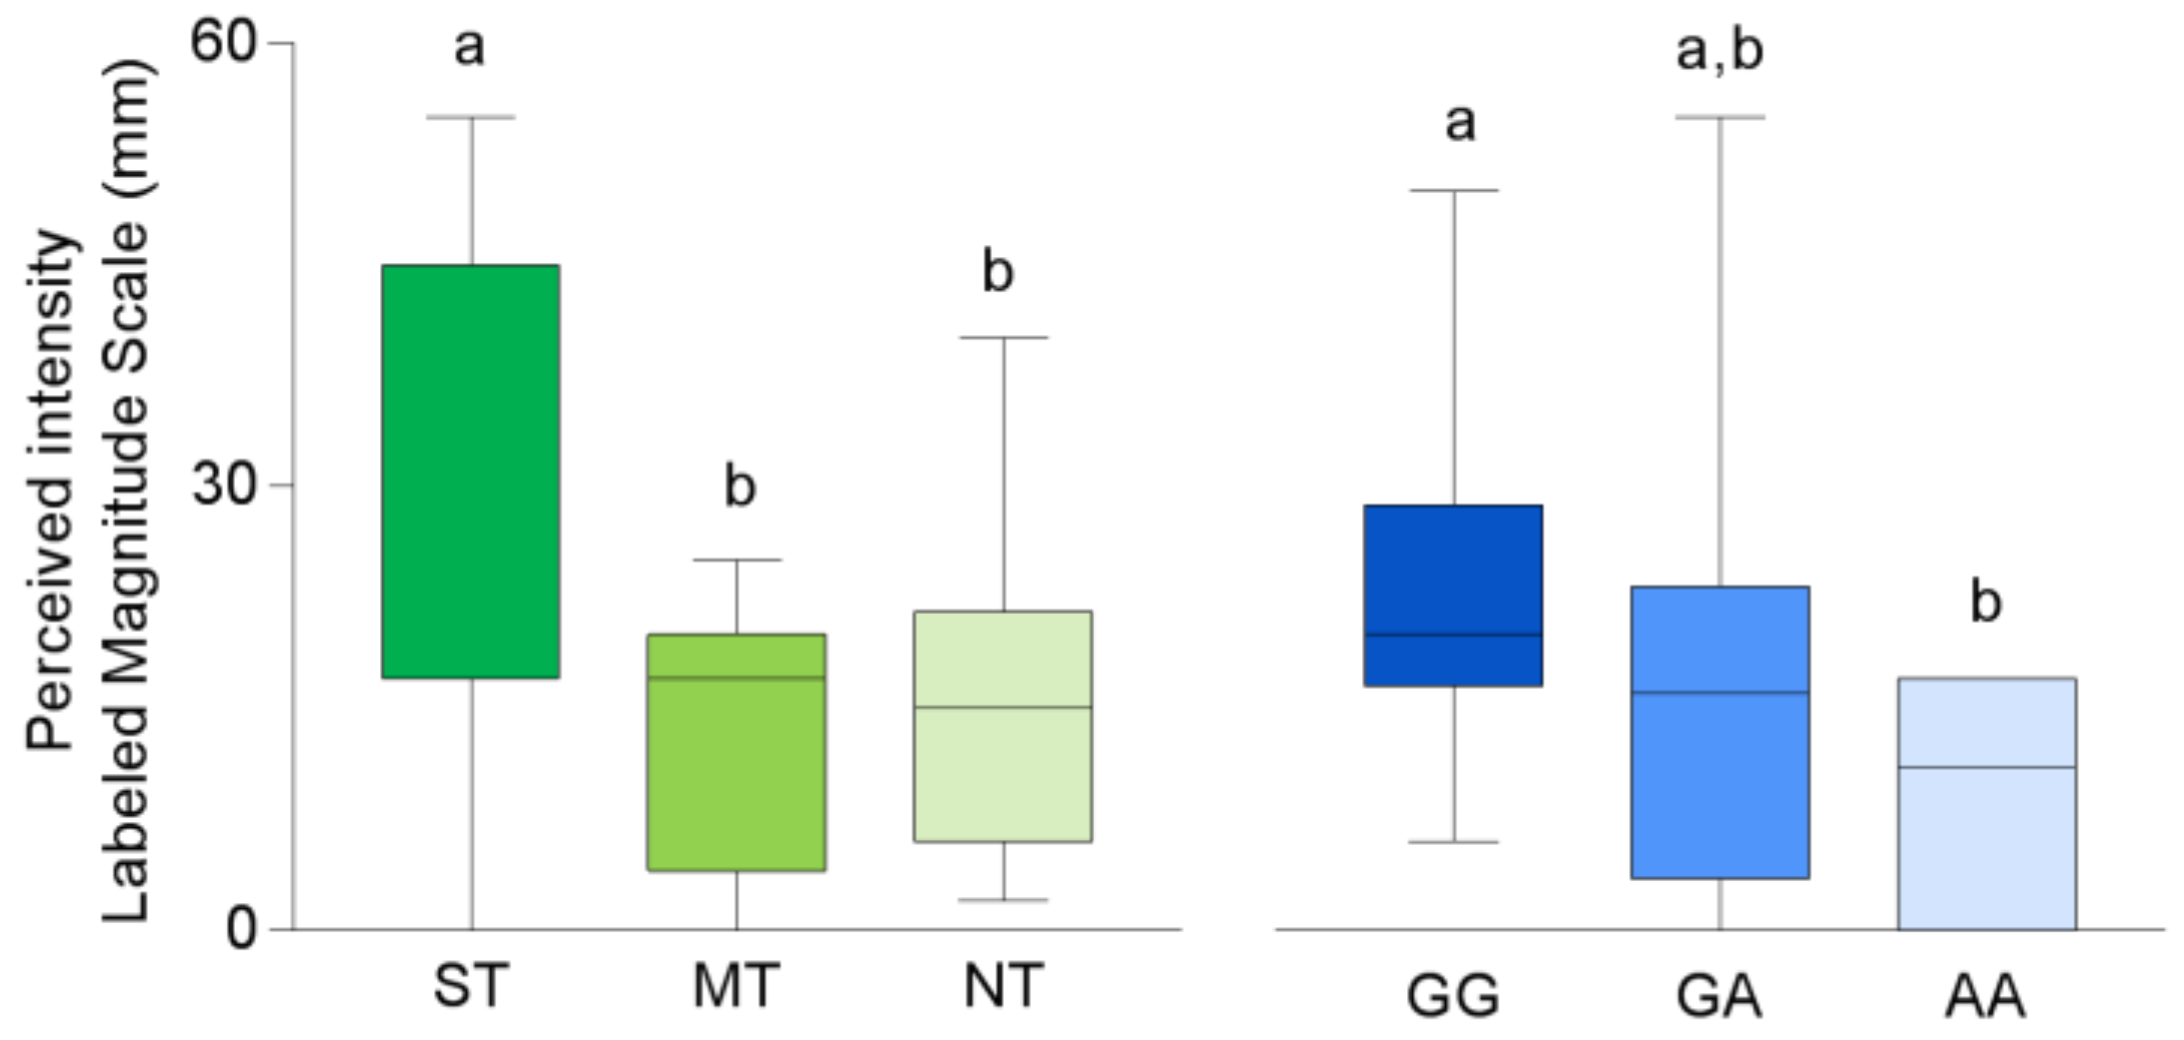
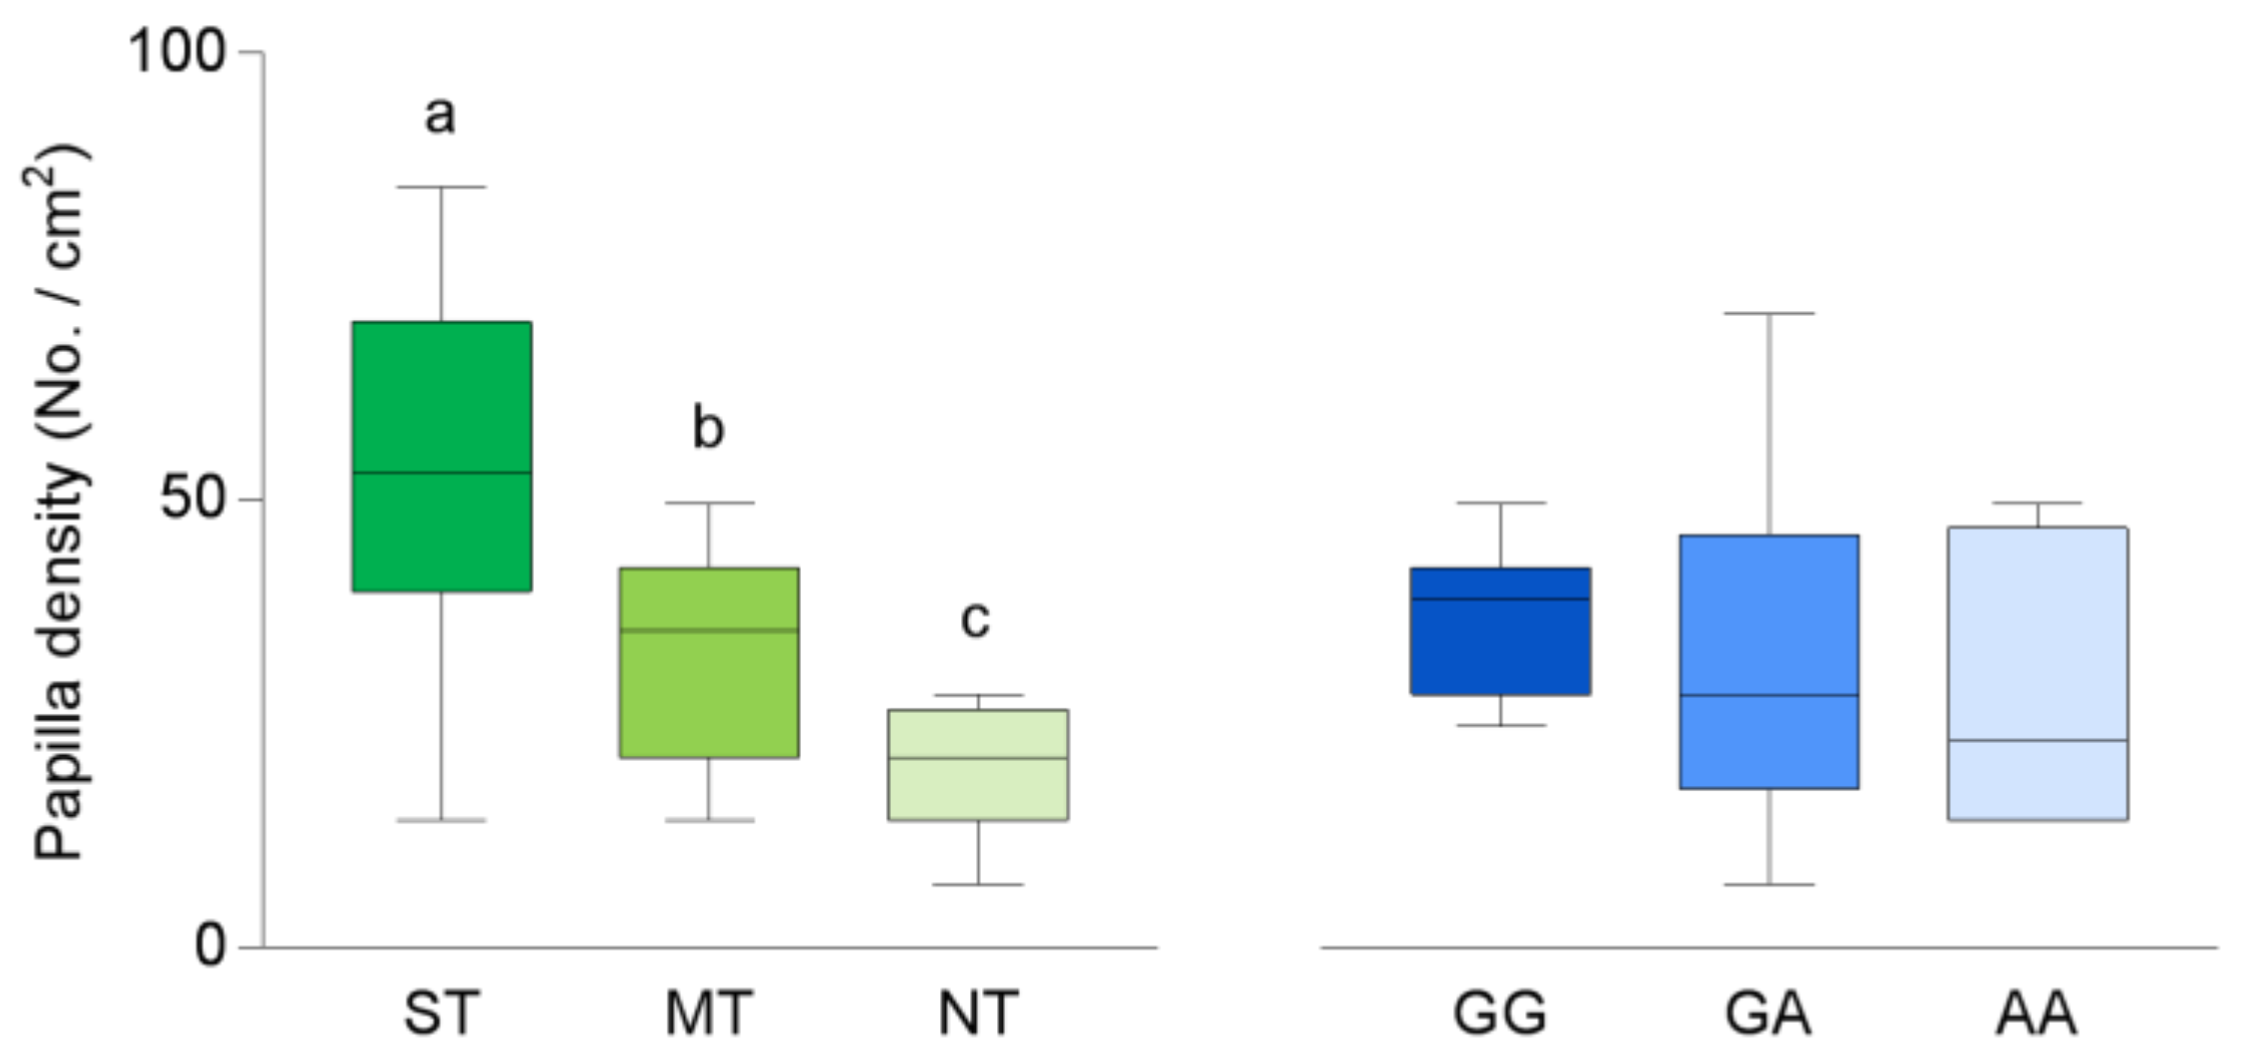
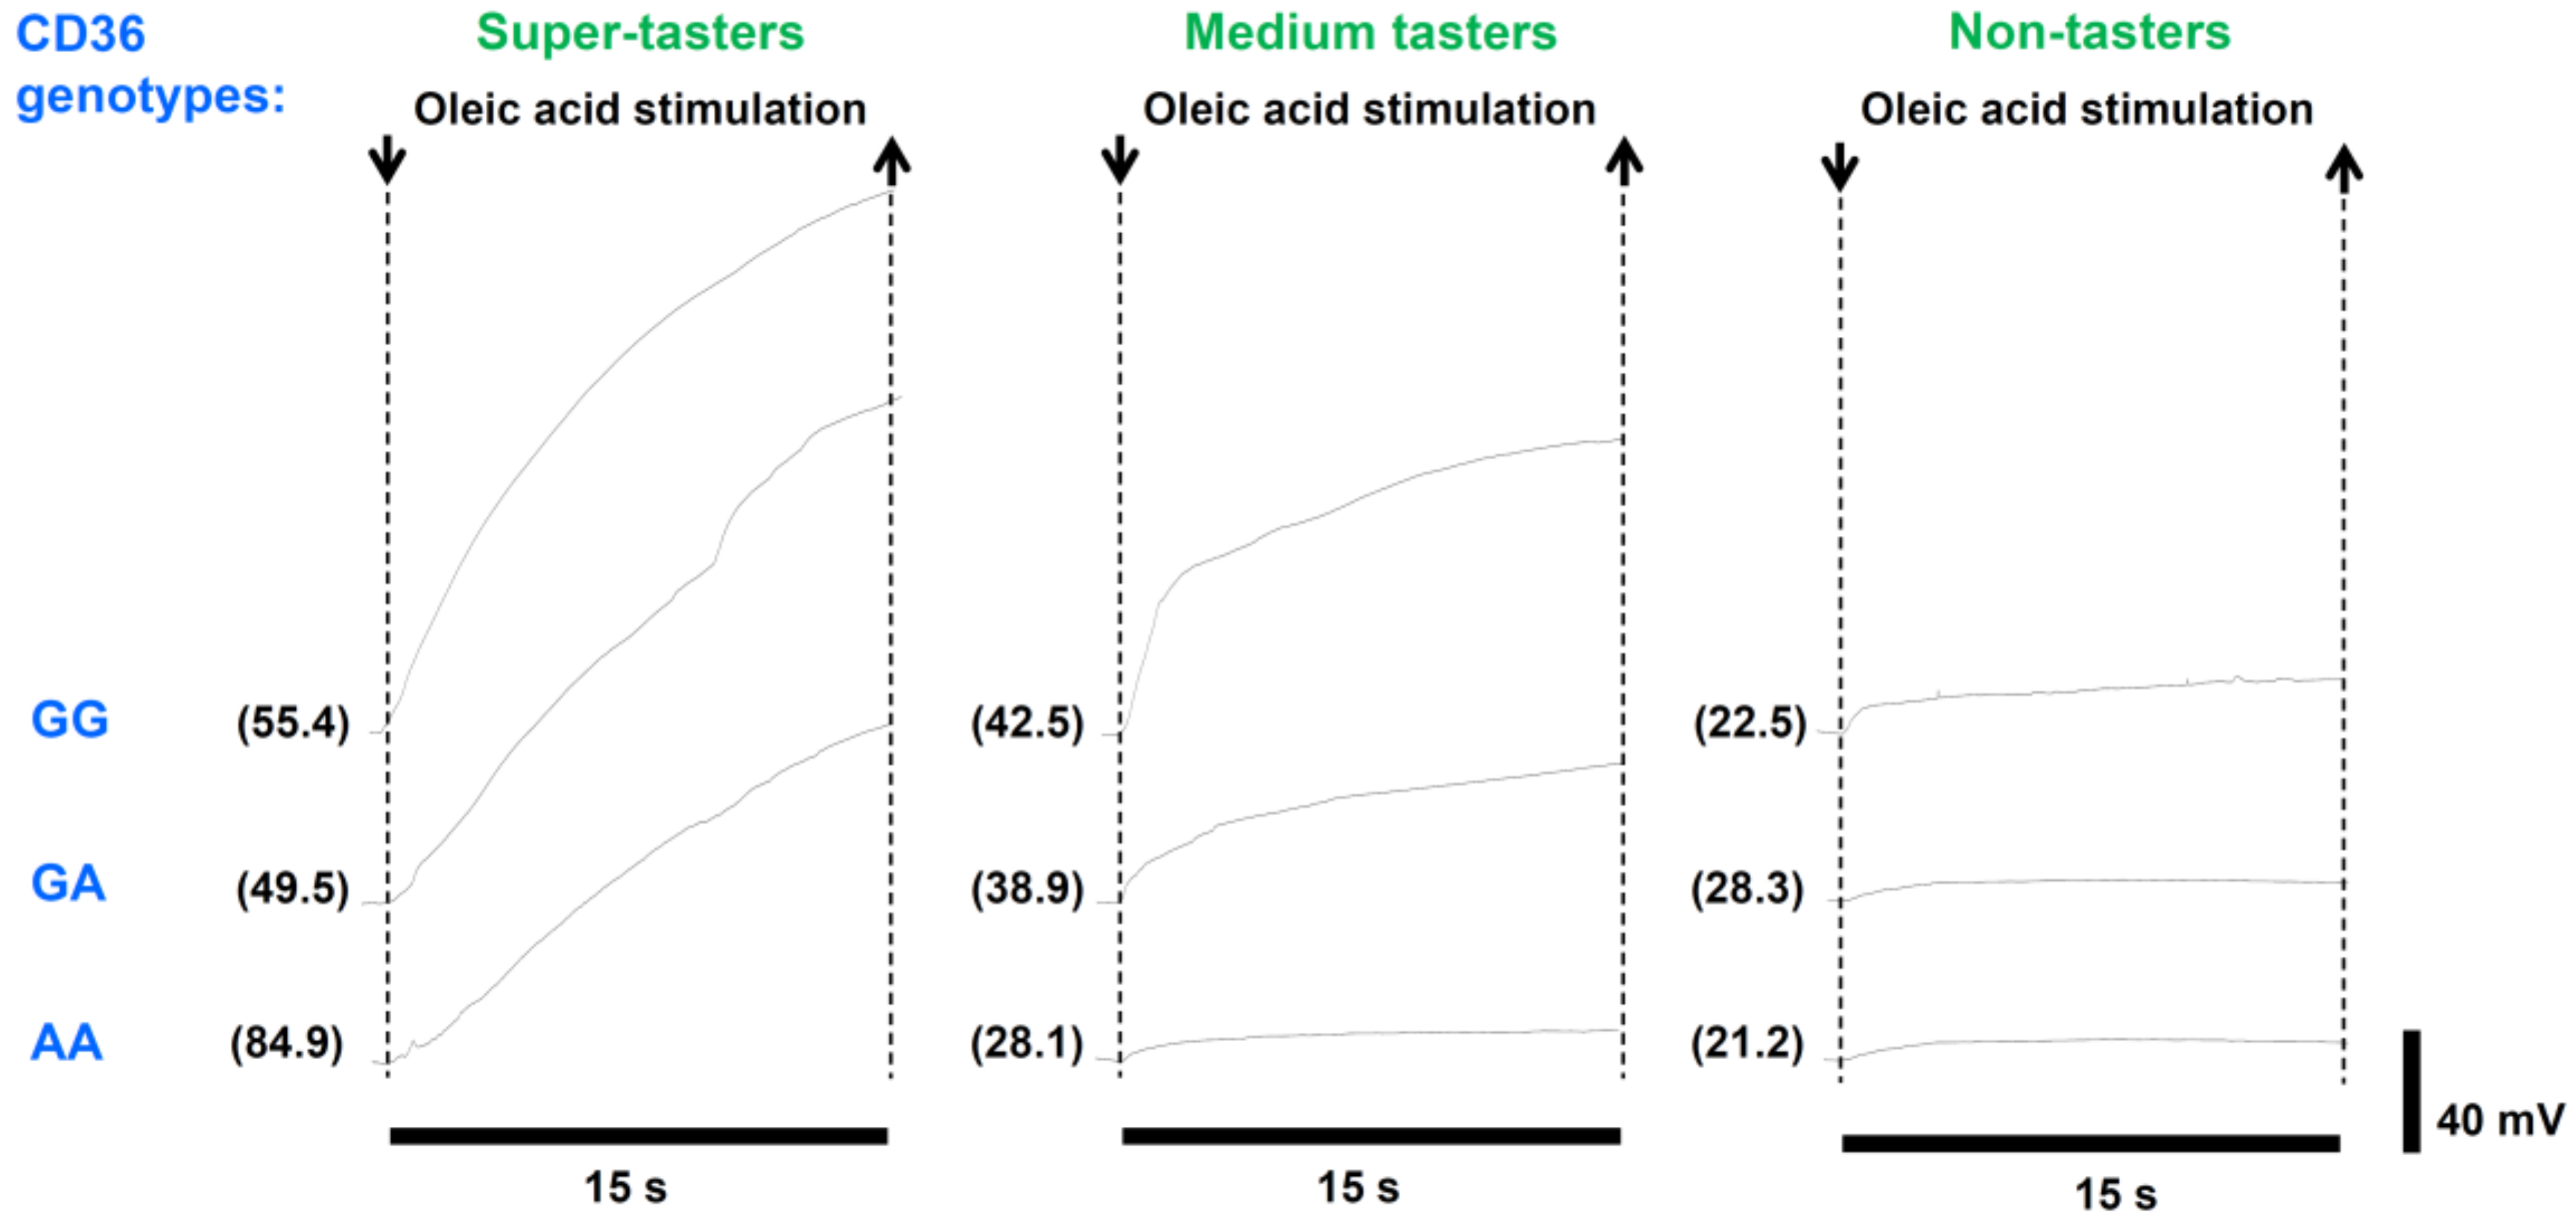
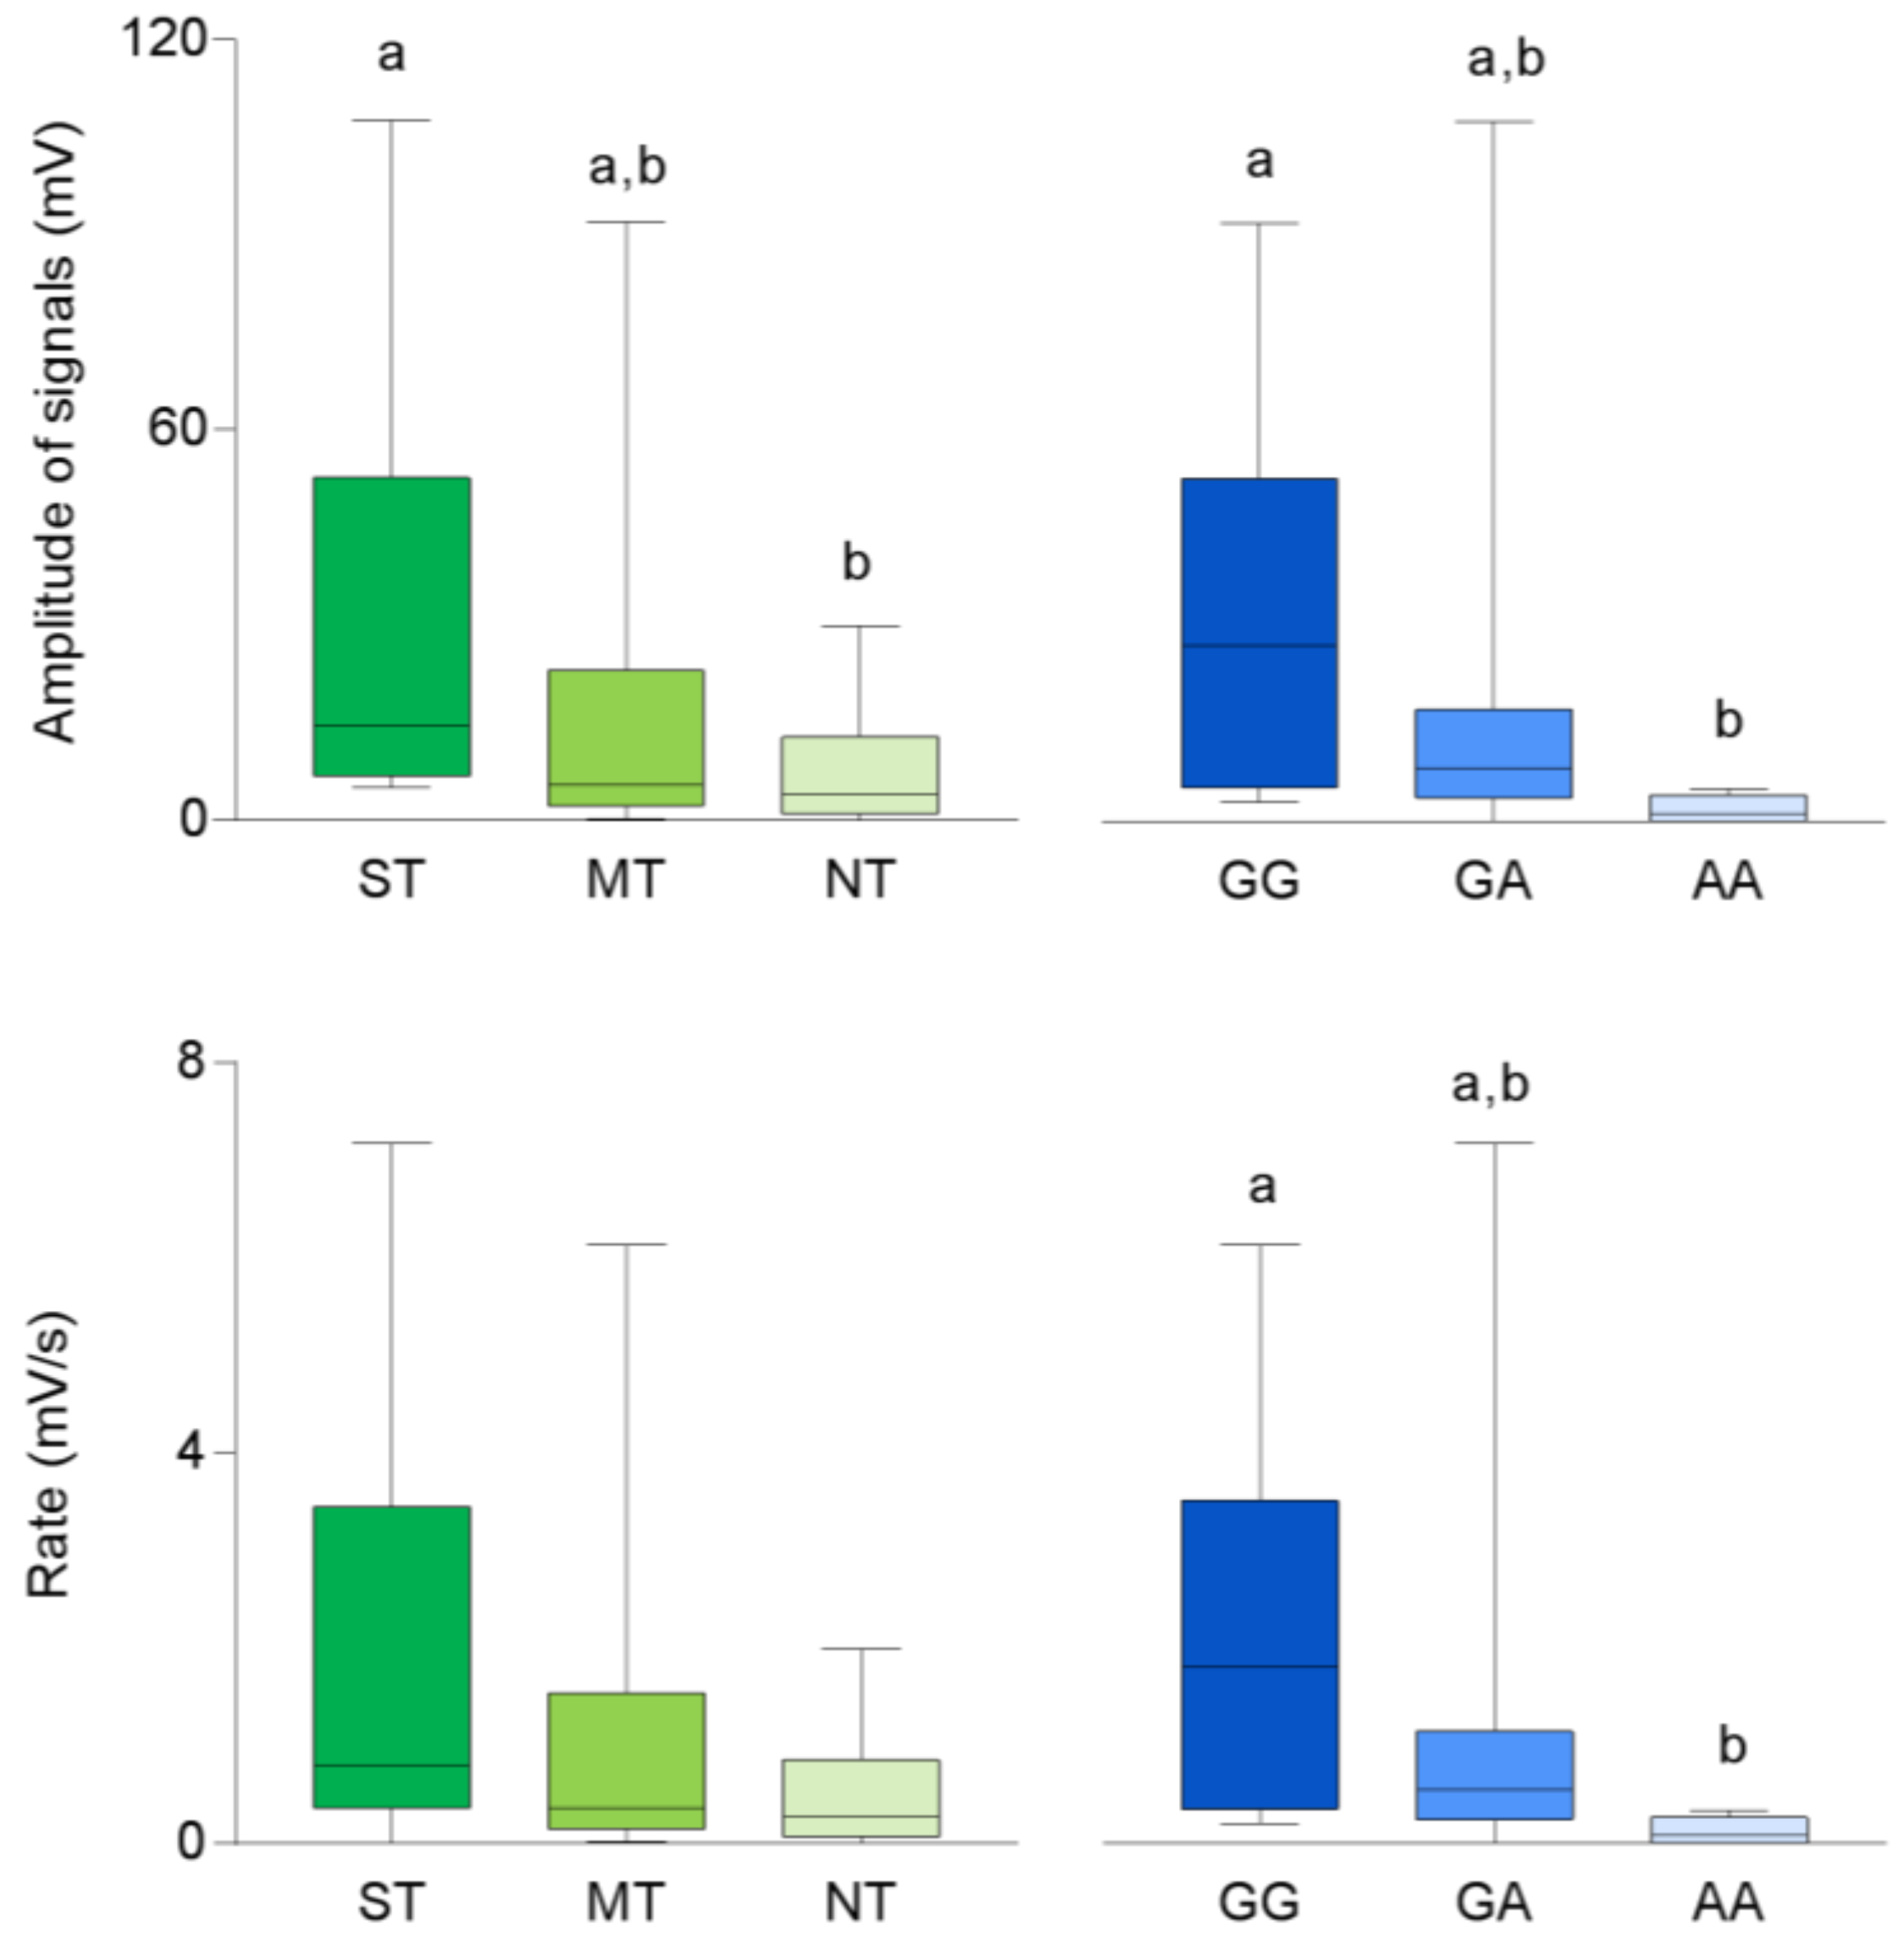
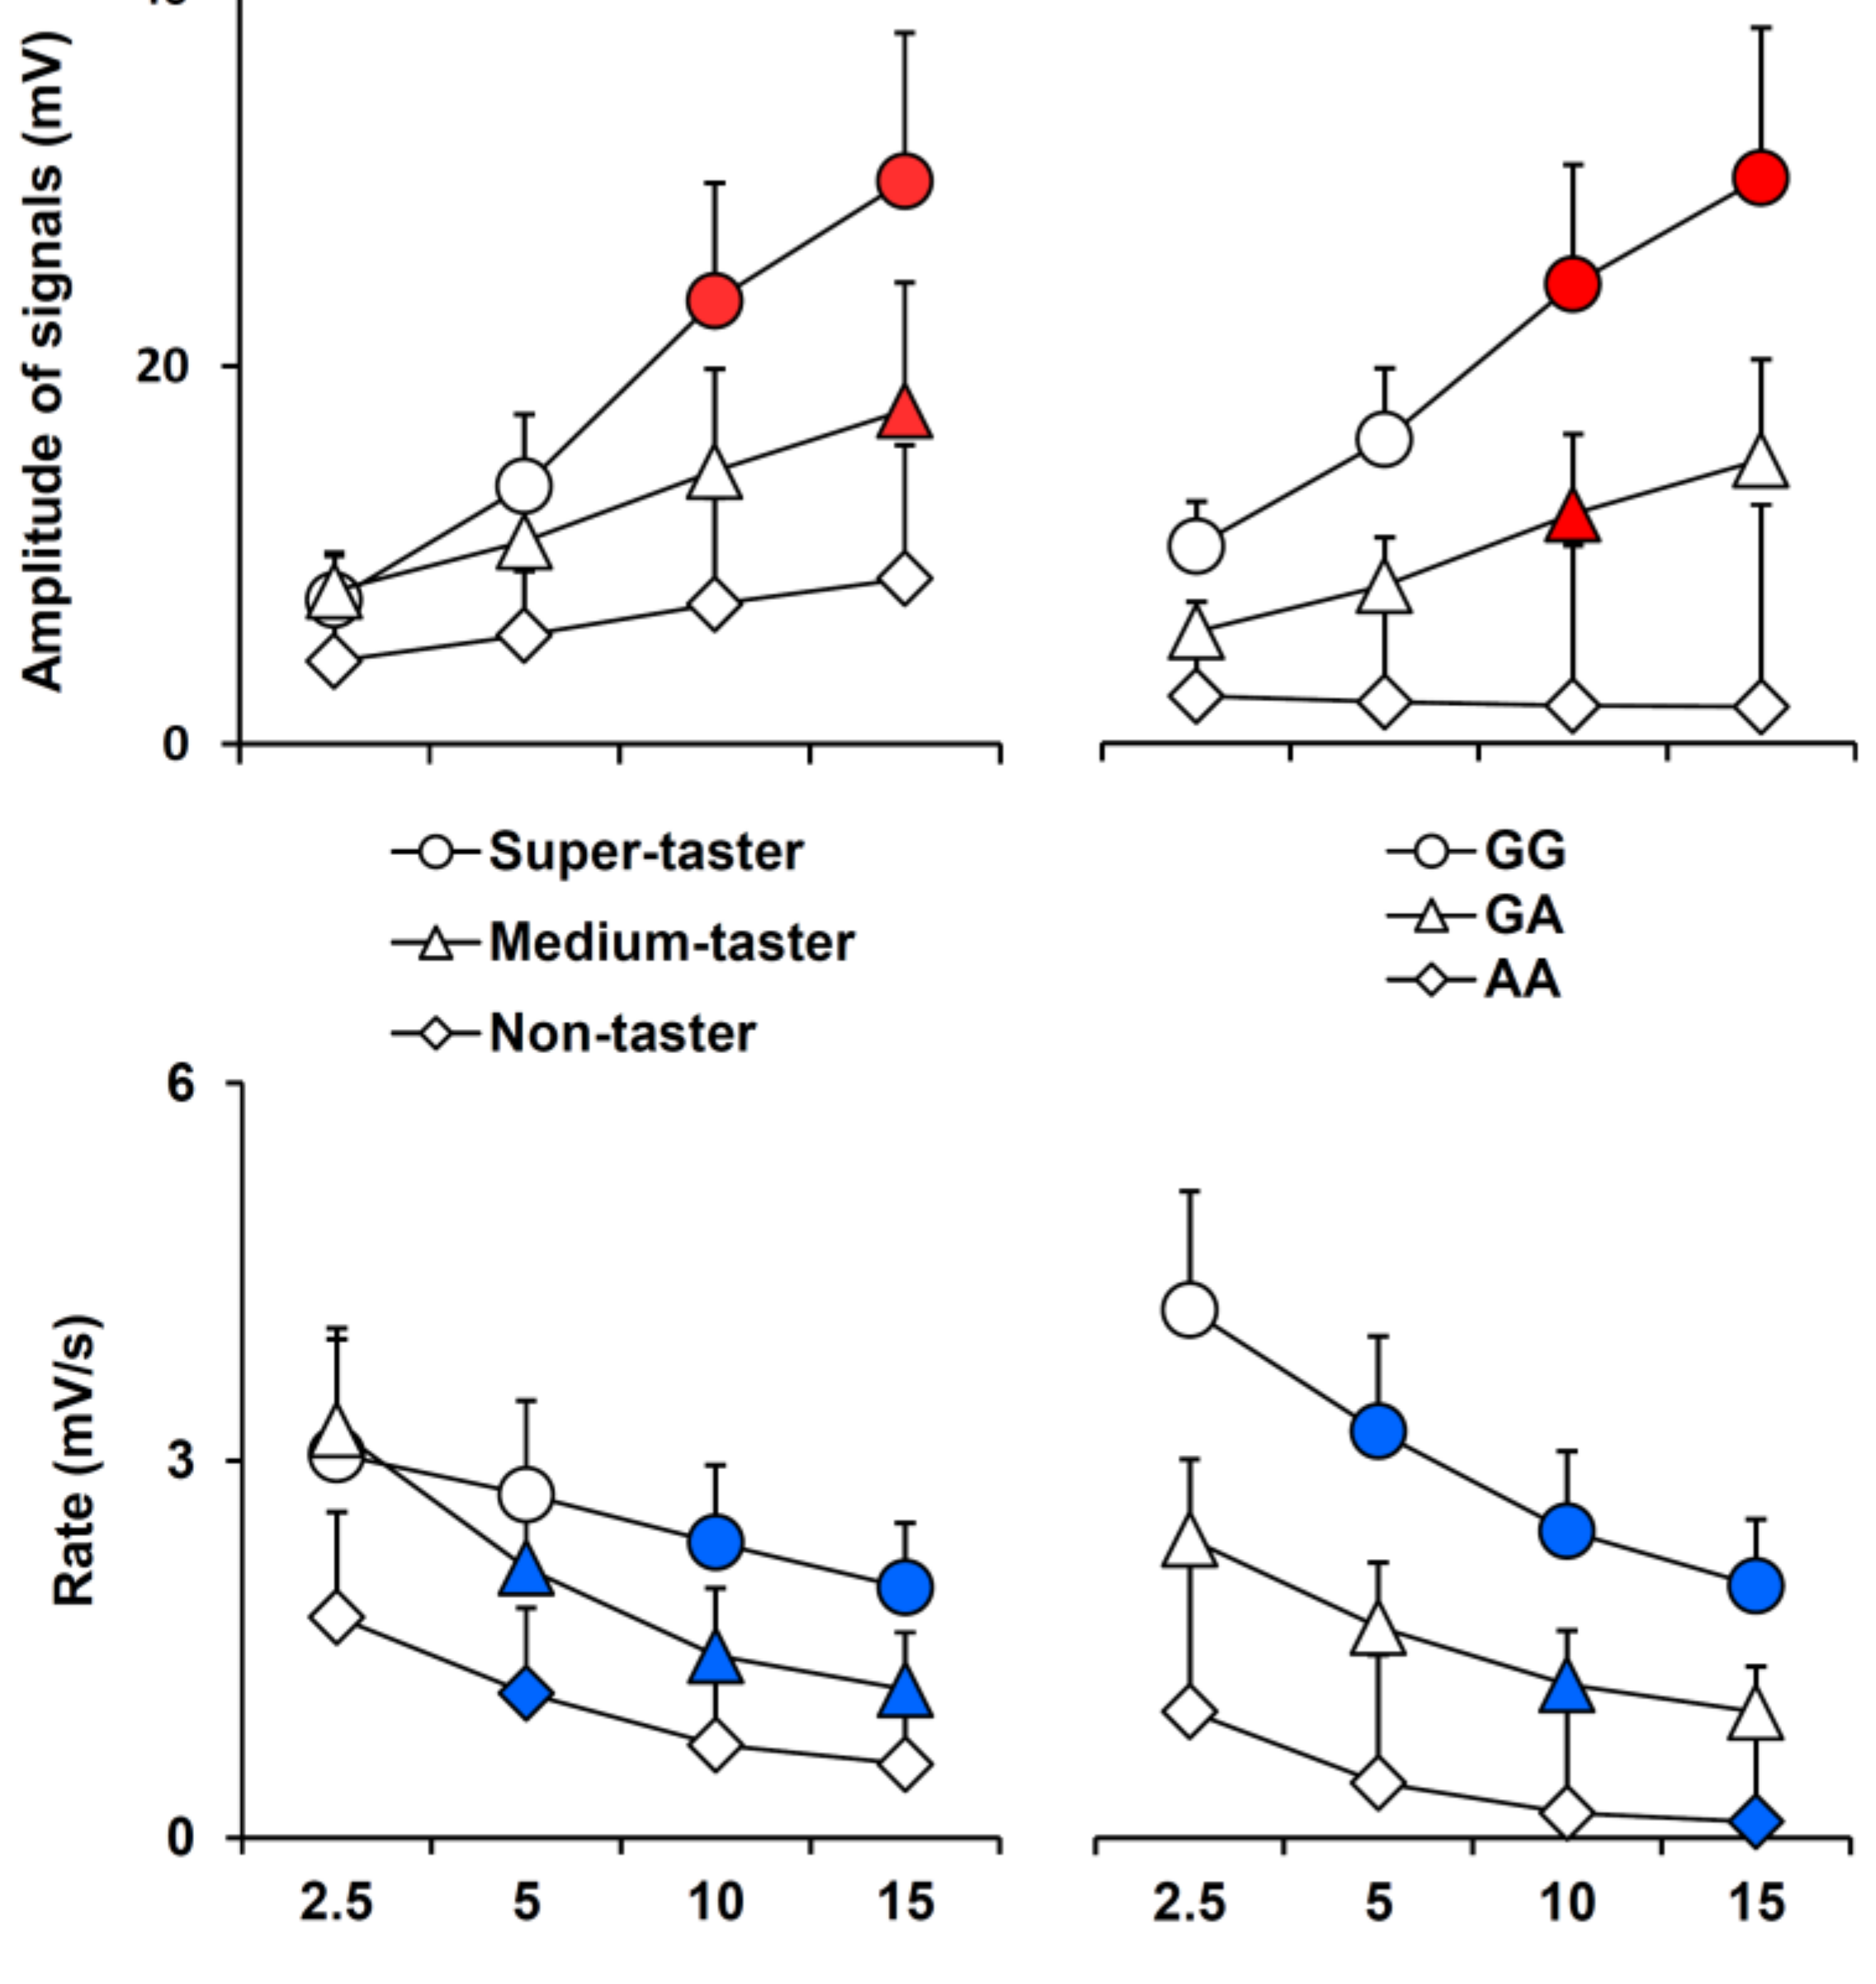
3.2. Electrophysiolgical Responses to Taste Stimulation with Oleic Acid
4. Discussion
5. Conclusions
Supplementary Materials
Author Contributions
Funding
Acknowledgments
Conflicts of Interest
References
- Smit, L.A.; Mozaffarian, D.; Willett, W. Review of fat and fatty acid requirements and criteria for developing dietary guidelines. Ann. Nutr. Metab. 2009, 55, 44–55. [Google Scholar] [CrossRef] [PubMed]
- Ebba, S.; Abarintos, R.A.; Kim, D.G.; Tiyouh, M.; Stull, J.C.; Movalia, A.; Smutzer, G. The examination of fatty acid taste with edible strips. Physiol. Behav. 2012, 106, 579–586. [Google Scholar] [CrossRef] [Green Version]
- Mattes, R.D. Is there a fatty acid taste? Annu. Rev. Nutr. 2009, 29, 305–327. [Google Scholar] [CrossRef] [PubMed]
- Mattes, R.D. Fat Taste in Humans: Is It a Primary? In Fat Detection: Taste, Texture, and Post Ingestive Effects; Montmayeur, J.P., le Coutre, J., Eds.; CRC Press: Boca Raton, FL, USA, 2010; pp. 167–193. [Google Scholar]
- Pepino, M.Y.; Love-Gregory, L.; Klein, S.; Abumrad, N.A. The fatty acid translocase gene CD36 and lingual lipase influence oral sensitivity to fat in obese subjects. J. Lipid Res. 2012, 53, 561–566. [Google Scholar] [CrossRef]
- Chalé-Rush, A.; Burgess, J.R.; Mattes, R.D. Multiple routes of chemosensitivity to free fatty acids in humans. Am. J. Physiol. Gastrointest. Liver Physiol. 2007, 292, G1206–G1212. [Google Scholar] [CrossRef] [PubMed]
- Fukuwatari, T.; Shibata, K.; Iguchi, K.; Saeki, T.; Iwata, A.; Tani, K.; Sugimoto, E.; Fushiki, T. Role of gustation in the recognition of oleate and triolein in anosmic rats. Physiol. Behav. 2003, 78, 579–583. [Google Scholar] [CrossRef]
- Smith, J.C.; Fisher, E.M.; Maleszewski, V.; McClain, B. Orosensory factors in the ingestion of corn oil/sucrose mixtures by the rat. Physiol. Behav. 2000, 69, 135–146. [Google Scholar] [CrossRef]
- Kawai, T.; Fushiki, T. Importance of lipolysis in oral cavity for orosensory detection of fat. Am. J. Physiol. Regul. Integr. Comp. Physiol. 2003, 285, R447–R454. [Google Scholar] [CrossRef]
- Cartoni, C.; Yasumatsu, K.; Ohkuri, T.; Shigemura, N.; Yoshida, R.; Godinot, N.; le Coutre, J.; Ninomiya, Y.; Damak, S. Taste Preference for Fatty Acids Is Mediated by GPR40 and GPR120. J. Neurosci. 2010, 30, 8376–8382. [Google Scholar] [CrossRef] [PubMed] [Green Version]
- Khan, N.A.; Besnard, P. Oro-sensory perception of dietary lipids: New insights into the fat taste transduction. Biochim. Biophys. Acta 2009, 1791, 149–155. [Google Scholar] [CrossRef]
- Martin, C.; Chevrot, M.; Poirier, H.; Passilly-Degrace, P.; Niot, I.; Besnard, P. CD36 as a lipid sensor. Physiol. Behav. 2011, 105, 36–42. [Google Scholar] [CrossRef] [PubMed]
- Laugerette, F.; Passilly-Degrace, P.; Patris, B.; Niot, I.; Febbraio, M.; Montmayeur, J.P.; Besnard, P. CD36 involvement in orosensory detection of dietary lipids, spontaneous fat preference, and digestive secretions. J. Clin. Invest. 2005, 115, 3177–3184. [Google Scholar] [CrossRef] [PubMed] [Green Version]
- Ibrahimi, A.; Abumrad, N.A. Role of CD36 in membrane transport of long-chain fatty acids. Curr. Opin. Clin. Nutr. Metab. Care 2002, 5, 139–145. [Google Scholar] [CrossRef] [PubMed]
- Gaillard, D.; Laugerette, F.; Darcel, N.; El-Yassimi, A.; Passilly-Degrace, P.; Hichami, A.; Khan, N.A.; Montmayeur, J.P.; Besnard, P. The gustatory pathway is involved in CD36-mediated orosensory perception of long-chain fatty acids in the mouse. FASEB J. 2008, 22, 1458–1468. [Google Scholar] [CrossRef] [PubMed]
- El-Yassimi, A.; Hichami, A.; Besnard, P.; Khan, N.A. Linoleic acid induces calcium signaling, Src kinase phosphorylation, and neurotransmitter release in mouse CD36-positive gustatory cells. J. Biol. Chem. 2008, 283, 12949–12959. [Google Scholar] [CrossRef] [PubMed]
- Ozdener, M.H.; Subramaniam, S.; Sundaresan, S.; Sery, O.; Hashimoto, T.; Asakawa, Y.; Besnard, P.; Abumrad, N.A.; Khan, N.A. CD36- and GPR120-mediated Ca(2)(+) signaling in human taste bud cells mediates differential responses to fatty acids and is altered in obese mice. Gastroenterology 2014, 146, 995–1005. [Google Scholar] [CrossRef]
- Reed, D.R.; Xia, M.B. Recent advances in fatty acid perception and genetics. Adv. Nutr. 2015, 6, 353s–360s. [Google Scholar] [CrossRef]
- Love-Gregory, L.; Sherva, R.; Schappe, T.; Qi, J.S.; McCrea, J.; Klein, S.; Connelly, M.A.; Abumrad, N.A. Common CD36 SNPs reduce protein expression and may contribute to a protective atherogenic profile. Hum. Mol. Genet. 2011, 20, 193–201. [Google Scholar] [CrossRef]
- Mrizak, I.; Sery, O.; Plesnik, J.; Arfa, A.; Fekih, M.; Bouslema, A.; Zaouali, M.; Tabka, Z.; Khan, N.A. The A allele of cluster of differentiation 36 (CD36) SNP 1761667 associates with decreased lipid taste perception in obese Tunisian women. Br. J. Nutr. 2015, 113, 1330–1337. [Google Scholar] [CrossRef] [Green Version]
- Melis, M.; Sollai, G.; Muroni, P.; Crnjar, R.; Barbarossa, I.T. Associations between orosensory perception of oleic acid, the common single nucleotide polymorphisms (rs1761667 and rs1527483) in the CD36 gene, and 6-n-propylthiouracil (PROP) tasting. Nutrients 2015, 7, 2068–2084. [Google Scholar] [CrossRef]
- Burgess, B.; Melis, M.; Scoular, K.; Driver, M.; Schaich, K.M.; Keller, K.L.; Tomassini Barbarossa, I.; Tepper, B.J. Effects of CD36 Genotype on Oral Perception of Oleic Acid Supplemented Safflower Oil Emulsions in Two Ethnic Groups: A Preliminary Study. J. Food Sci. 2018, 83, 1373–1380. [Google Scholar] [CrossRef] [PubMed] [Green Version]
- Keller, K.L.; Liang, L.C.; Sakimura, J.; May, D.; van Belle, C.; Breen, C.; Driggin, E.; Tepper, B.J.; Lanzano, P.C.; Deng, L.; et al. Common variants in the CD36 gene are associated with oral fat perception, fat preferences, and obesity in African Americans. Obesity 2012, 20, 1066–1073. [Google Scholar] [CrossRef] [PubMed]
- Melis, M.; Carta, G.; Pintus, S.; Pintus, P.; Piras, C.A.; Murru, E.; Manca, C.; Di Marzo, V.; Banni, S.; Tomassini Barbarossa, I. Polymorphism rs1761667 in the CD36 Gene Is Associated to Changes in Fatty Acid Metabolism and Circulating Endocannabinoid Levels Distinctively in Normal Weight and Obese Subjects. Front. Physiol. 2017, 8, 1006. [Google Scholar] [CrossRef] [PubMed]
- Mounayar, R.; Morzel, M.; Brignot, H.; Tremblay-Franco, M.; Canlet, C.; Lucchi, G.; Ducoroy, P.; Feron, G.; Neyraud, E. Salivary markers of taste sensitivity to oleic acid: A combined proteomics and metabolomics approach. Metabolomics 2014, 10, 688–696. [Google Scholar] [CrossRef]
- Melis, M.; Atzori, E.; Cabras, S.; Zonza, A.; Calò, C.; Muroni, P.; Nieddu, M.; Padiglia, A.; Sogos, V.; Tepper, B.J.; et al. The gustin (CA6) gene polymorphism, rs2274333 (A/G), as a mechanistic link between PROP tasting and fungiform taste papilla density and maintenance. PLoS ONE 2013, 8, e74151. [Google Scholar] [CrossRef] [PubMed]
- Barbarossa, I.T.; Melis, M.; Mattes, M.Z.; Calò, C.; Muroni, P.; Crnjar, R.; Tepper, B.J. The gustin (CA6) gene polymorphism, rs2274333 (A/G), is associated with fungiform papilla density, whereas PROP bitterness is mostly due to TAS2R38 in an ethnically-mixed population. Physiol. Behav. 2015, 138, 6–12. [Google Scholar] [CrossRef] [PubMed]
- Tepper, B.J.; Nurse, R.J. PROP taster status is related to the perception and preference for fat. Ann. N. Y. Acad. Sci. 1998, 855, 802–804. [Google Scholar] [CrossRef]
- Tepper, B.J.; Banni, S.; Melis, M.; Crnjar, R.; Tomassini Barbarossa, I. Genetic sensitivity to the bitter taste of 6-n-propylthiouracil (PROP) and its association with physiological mechanisms controlling body mass index (BMI). Nutrients 2014, 6, 3363–3381. [Google Scholar] [CrossRef]
- Tepper, B.J. Nutritional implications of genetic taste variation: The role of PROP sensitivity and other taste phenotypes. Annu. Rev. Nutr. 2008, 28, 367–388. [Google Scholar] [CrossRef]
- Hayes, J.E.; Duffy, V.B. Revisiting sugar-fat mixtures: Sweetness and creaminess vary with phenotypic markers of oral sensation. Chem. Senses 2007, 32, 225–236. [Google Scholar] [CrossRef]
- Tepper, B.J.; Nurse, R.J. Fat perception is related to PROP taster status. Physiol. Behav. 1997, 61, 949–954. [Google Scholar] [CrossRef]
- Melis, M.; Mastinu, M.; Arca, M.; Crnjar, R.; Tomassini Barbarossa, I. Effect of chemical interaction between oleic acid and L-Arginine on oral perception, as a function of polymorphisms of CD36 and OBPIIa and genetic ability to taste 6-n-propylthiouracil. PLoS ONE 2018, 13, e0194953. [Google Scholar] [CrossRef] [PubMed]
- Yeomans, M.R.; Tepper, B.J.; Rietzschel, J.; Prescott, J. Human hedonic responses to sweetness: Role of taste genetics and anatomy. Physiol. Behav. 2007, 91, 264–273. [Google Scholar] [CrossRef] [PubMed]
- Bartoshuk, L.M.; Duffy, V.B.; Miller, I.J. PTC/PROP tasting: Anatomy, psychophysics, and sex effects. Physiol. Behav. 1994, 56, 1165–1171. [Google Scholar] [CrossRef]
- Essick, G.; Chopra, A.; Guest, S.; McGlone, F. Lingual tactile acuity, taste perception, and the density and diameter of fungiform papillae in female subjects. Physiol. Behav. 2003, 80, 289–302. [Google Scholar] [CrossRef] [PubMed]
- Shahbake, M.; Hutchinson, I.; Laing, D.G.; Jinks, A.L. Rapid quantitative assessment of fungiform papillae density in the human tongue. Brain Res. 2005, 1052, 196–201. [Google Scholar] [CrossRef] [PubMed]
- Bajec, M.R.; Pickering, G.J. Thermal taste, PROP responsiveness, and perception of oral sensations. Physiol. Behav. 2008, 95, 581–590. [Google Scholar] [CrossRef] [PubMed]
- Keller, K.L.; Steinmann, L.; Nurse, R.J.; Tepper, B.J. Genetic taste sensitivity to 6-n-propylthiouracil influences food preference and reported intake in preschool children. Appetite 2002, 38, 3–12. [Google Scholar] [CrossRef]
- Duffy, V.B.; Bartoshuk, L.M. Food acceptance and genetic variation in taste. J. Am. Diet. Assoc. 2000, 100, 647–655. [Google Scholar] [CrossRef]
- Tepper, B.J.; Neilland, M.; Ullrich, N.V.; Koelliker, Y.; Belzer, L.M. Greater energy intake from a buffet meal in lean, young women is associated with the 6-n-propylthiouracil (PROP) non-taster phenotype. Appetite 2011, 56, 104–110. [Google Scholar] [CrossRef]
- Duffy, V.B.; Davidson, A.C.; Kidd, J.R.; Kidd, K.K.; Speed, W.C.; Pakstis, A.J.; Reed, D.R.; Snyder, D.J.; Bartoshuk, L.M. Bitter Receptor Gene (TAS2R38), 6-n-Propylthiouracil (PROP) Bitterness and Alcohol Intake. Alcohol. Clin. Exp. Res. 2004, 28, 1629–1637. [Google Scholar] [CrossRef] [PubMed] [Green Version]
- Hayes, J.E.; Duffy, V.B. Oral sensory phenotype identifies level of sugar and fat required for maximal liking. Physiol. Behav. 2008, 95, 77–87. [Google Scholar] [CrossRef] [PubMed] [Green Version]
- Tepper, B.J.; Ullrich, N.V. Influence of genetic taste sensitivity to 6-n-propylthiouracil (PROP), dietary restraint and disinhibition on body mass index in middle-aged women. Physiol. Behav. 2002, 75, 305–312. [Google Scholar] [CrossRef]
- Goldstein, G.L.; Daun, H.; Tepper, B.J. Influence of PROP taster status and maternal variables on energy intake and body weight of pre-adolescents. Physiol. Behav. 2007, 90, 809–817. [Google Scholar] [CrossRef] [PubMed]
- Tepper, B.J.; Koelliker, Y.; Zhao, L.; Ullrich, N.V.; Lanzara, C.; d’Adamo, P.; Ferrara, A.; Ulivi, S.; Esposito, L.; Gasparini, P. Variation in the bitter-taste receptor gene TAS2R38, and adiposity in a genetically isolated population in Southern Italy. Obesity 2008, 16, 2289–2295. [Google Scholar] [CrossRef]
- Shafaie, Y.; Koelliker, Y.; Hoffman, D.J.; Tepper, B.J. Energy intake and diet selection during buffet consumption in women classified by the 6-n-propylthiouracil bitter taste phenotype. Am. J. Clin. Nutr. 2013, 98, 1583–1591. [Google Scholar] [CrossRef] [PubMed] [Green Version]
- Tepper, B.J.; Melis, M.; Koelliker, Y.; Gasparini, P.; Ahijevych, K.L.; Tomassini Barbarossa, I. Factors Influencing the Phenotypic Characterization of the Oral Marker, PROP. Nutrients 2017, 9, 1275. [Google Scholar] [CrossRef]
- Tomassini Barbarossa, I.; Carta, G.; Murru, E.; Melis, M.; Zonza, A.; Vacca, C.; Muroni, P.; Di Marzo, V.; Banni, S. Taste sensitivity to 6-n-propylthiouracil is associated with endocannabinoid plasma levels in normal-weight individuals. Nutrition 2013, 29, 531–536. [Google Scholar] [CrossRef]
- Carta, G.; Melis, M.; Pintus, S.; Pintus, P.; Piras, C.A.; Muredda, L.; Demurtas, D.; Di Marzo, V.; Banni, S.; Barbarossa, I.T. Participants with Normal Weight or with Obesity Show Different Relationships of 6-n-Propylthiouracil (PROP) Taster Status with BMI and Plasma Endocannabinoids. Sci. Rep. 2017, 7, 1361. [Google Scholar] [CrossRef]
- Drewnowski, A.; Henderson, S.A.; Cockroft, J.E. Genetic Sensitivity to 6-n-Propylthiouracil Has No Influence on Dietary Patterns, Body Mass Indexes, or Plasma Lipid Profiles of Women. J. Am. Diet. Assoc. 2007, 107, 1340–1348. [Google Scholar] [CrossRef]
- Gorovic, N.; Afzal, S.; Tjonneland, A.; Overvad, K.; Vogel, U.; Albrechtsen, C.; Poulsen, H.E. Genetic variation in the hTAS2R38 taste receptor and brassica vegetable intake. Scand. J. Clin. Lab. Investig. 2011, 71, 274–279. [Google Scholar] [CrossRef] [PubMed]
- O’Brien, S.A.; Feeney, E.L.; Scannell, A.G.; Markey, A.; Gibney, E.R. Bitter taste perception and dietary intake patterns in irish children. J. Nutr. Nutr. 2013, 6, 43–58. [Google Scholar] [CrossRef] [PubMed]
- Timpson, N.J.; Christensen, M.; Lawlor, D.A.; Gaunt, T.R.; Day, I.N.; Ebrahim, S.; Davey Smith, G. TAS2R38 (phenylthiocarbamide) haplotypes, coronary heart disease traits, and eating behavior in the British Women’s Heart and Health Study. Am. J. Clin. Nutr. 2005, 81, 1005–1011. [Google Scholar] [CrossRef] [PubMed] [Green Version]
- Yackinous, C.A.; Guinard, J.X. Relation between PROP (6-n-propylthiouracil) taster status, taste anatomy and dietary intake measures for young men and women. Appetite 2002, 38, 201–209. [Google Scholar] [CrossRef]
- Drewnowski, A.; Henderson, S.A.; Barratt-Fornell, A. Genetic sensitivity to 6-n-propylthiouracil and sensory responses to sugar and fat mixtures. Physiol. Behav. 1998, 63, 771–777. [Google Scholar] [CrossRef]
- Sollai, G.; Melis, M.; Pani, D.; Cosseddu, P.; Usai, I.; Crnjar, R.; Bonfiglio, A.; Tomassini Barbarossa, I. First objective evaluation of taste sensitivity to 6-n-propylthiouracil (PROP), a paradigm gustatory stimulus in humans. Sci. Rep. 2017, 7, 40353. [Google Scholar] [CrossRef] [Green Version]
- Pani, D.; Usai, I.; Cosseddu, P.; Melis, M.; Sollai, G.; Crnjar, R.; Tomassini Barbarossa, I.; Raffo, L.; Bonfiglio, A. An automated system for the objective evaluation of human gustatory sensitivity using tongue biopotential recordings. PLoS ONE 2017, 12, e0177246. [Google Scholar] [CrossRef]
- Glanville, E.V.; Kaplan, A.R. Taste Perception and the Menstrual Cycle. Nature 1965, 205, 930–931. [Google Scholar] [CrossRef]
- Tepper, B.J.; Christensen, C.M.; Cao, J. Development of brief methods to classify individuals by PROP taster status. Physiol. Behav. 2001, 73, 571–577. [Google Scholar] [CrossRef]
- Calò, C.; Padiglia, A.; Zonza, A.; Corrias, L.; Contu, P.; Tepper, B.J.; Barbarossa, I.T. Polymorphisms in TAS2R38 and the taste bud trophic factor, gustin gene co-operate in modulating PROP taste phenotype. Physiol. Behav. 2011, 104, 1065–1071. [Google Scholar] [CrossRef]
- Padiglia, A.; Zonza, A.; Atzori, E.; Chillotti, C.; Calò, C.; Tepper, B.J.; Barbarossa, I.T. Sensitivity to 6-n-propylthiouracil is associated with gustin (carbonic anhydrase VI) gene polymorphism, salivary zinc, and body mass index in humans. Am. J. Clin. Nutr. 2010, 92, 539–545. [Google Scholar] [CrossRef] [PubMed] [Green Version]
- Melis, M.; Aragoni, M.C.; Arca, M.; Cabras, T.; Caltagirone, C.; Castagnola, M.; Crnjar, R.; Messana, I.; Tepper, B.J.; Barbarossa, I.T. Marked increase in PROP taste responsiveness following oral supplementation with selected salivary proteins or their related free amino acids. PLoS ONE 2013, 8, e59810. [Google Scholar] [CrossRef] [PubMed]
- Melis, M.; Tomassini Barbarossa, I. Taste Perception of Sweet, Sour, Salty, Bitter, and Umami and Changes Due to l-Arginine Supplementation, as a Function of Genetic Ability to Taste 6-n-Propylthiouracil. Nutrients 2017, 9, 541. [Google Scholar] [CrossRef] [PubMed]
- Melis, M.; Arca, M.; Aragoni, M.C.; Cabras, T.; Caltagirone, C.; Castagnola, M.; Crnjar, R.; Messana, I.; Tepper, B.J.; Tomassini Barbarossa, I. Dose-Dependent Effects of L-Arginine on PROP Bitterness Intensity and Latency and Characteristics of the Chemical Interaction between PROP and L-Arginine. PLoS ONE 2015, 10, e0131104. [Google Scholar] [CrossRef] [PubMed]
- Green, B.G.; Shaffer, G.S.; Gilmore, M.M. Derivation and evaluation of a semantic scale of oral sensation magnitude with apparent ratio properties. Chem. Senses 1993, 18, 683–702. [Google Scholar] [CrossRef]
- Zhao, L.; Kirkmeyer, S.V.; Tepper, B.J. A paper screening test to assess genetic taste sensitivity to 6-n-propylthiouracil. Physiol. Behav. 2003, 78, 625–633. [Google Scholar] [CrossRef]
- Banerjee, M.; Gautam, S.; Saxena, M.; Bid, H.K.; Agrawal, C.G. Association of CD36 gene variants rs1761667 (G > A) and rs1527483 (C > T) with Type 2 diabetes in North Indian population. Int. J. Diabetes Mellit. 2010, 2, 179–183. [Google Scholar] [CrossRef]
- Kim, U.K.; Jorgenson, E.; Coon, H.; Leppert, M.; Risch, N.; Drayna, D. Positional cloning of the human quantitative trait locus underlying taste sensitivity to phenylthiocarbamide. Science 2003, 299, 1221–1225. [Google Scholar] [CrossRef]
- Rousset, F. GENEPOP’007: A complete re-implementation of the GENEPOP software for Windows and Linux. Mol. Ecol. Resour. 2008, 8, 103–106. [Google Scholar] [CrossRef]
- Keller, K.L.; Olsen, A.; Cravener, T.L.; Bloom, R.; Chung, W.K.; Deng, L.; Lanzano, P.; Meyermann, K. Bitter taste phenotype and body weight predict children’s selection of sweet and savory foods at a palatable test-meal. Appetite 2014, 77, 113–121. [Google Scholar] [CrossRef]
- Flock, A.; Flock, B. Hydrops in the cochlea can be induced by sound as well as by static pressure. Hear. Res. 2000, 150, 175–188. [Google Scholar] [CrossRef]
- Holder, G.E. Pattern electroretinography (PERG) and an integrated approach to visual pathway diagnosis. Prog. Retin Eye Res. 2001, 20, 531–561. [Google Scholar] [CrossRef]
- Scott, J.W.; Scott-Johnson, P.E. The electroolfactogram: A review of its history and uses. Microsc. Res. Tech. 2002, 58, 152–160. [Google Scholar] [CrossRef] [PubMed]
- Kirkmeyer, S.V.; Tepper, B.J. Understanding creaminess perception of dairy products using free-choice profiling and genetic responsivity to 6-n-propylthiouracil. Chem. Senses 2003, 28, 527–536. [Google Scholar] [CrossRef]
- Dinnella, C.; Monteleone, E.; Piochi, M.; Spinelli, S.; Prescott, J.; Pierguidi, L.; Gasperi, F.; Laureati, M.; Pagliarini, E.; Predieri, S.; et al. Individual Variation in PROP Status, Fungiform Papillae Density, and Responsiveness to Taste Stimuli in a Large Population Sample. Chem. Senses 2018, 43, 697–710. [Google Scholar] [CrossRef] [PubMed]


© 2019 by the authors. Licensee MDPI, Basel, Switzerland. This article is an open access article distributed under the terms and conditions of the Creative Commons Attribution (CC BY) license (http://creativecommons.org/licenses/by/4.0/).
Share and Cite
Sollai, G.; Melis, M.; Mastinu, M.; Pani, D.; Cosseddu, P.; Bonfiglio, A.; Crnjar, R.; Tepper, B.J.; Tomassini Barbarossa, I. Human Tongue Electrophysiological Response to Oleic Acid and Its Associations with PROP Taster Status and the CD36 Polymorphism (rs1761667). Nutrients 2019, 11, 315. https://0-doi-org.brum.beds.ac.uk/10.3390/nu11020315
Sollai G, Melis M, Mastinu M, Pani D, Cosseddu P, Bonfiglio A, Crnjar R, Tepper BJ, Tomassini Barbarossa I. Human Tongue Electrophysiological Response to Oleic Acid and Its Associations with PROP Taster Status and the CD36 Polymorphism (rs1761667). Nutrients. 2019; 11(2):315. https://0-doi-org.brum.beds.ac.uk/10.3390/nu11020315
Chicago/Turabian StyleSollai, Giorgia, Melania Melis, Mariano Mastinu, Danilo Pani, Piero Cosseddu, Annalisa Bonfiglio, Roberto Crnjar, Beverly J. Tepper, and Iole Tomassini Barbarossa. 2019. "Human Tongue Electrophysiological Response to Oleic Acid and Its Associations with PROP Taster Status and the CD36 Polymorphism (rs1761667)" Nutrients 11, no. 2: 315. https://0-doi-org.brum.beds.ac.uk/10.3390/nu11020315