Food Intake during School Lunch Is Better Explained by Objectively Measured Eating Behaviors than by Subjectively Rated Food Taste and Fullness: A Cross-Sectional Study


Abstract
:1. Introduction
2. Materials and Methods
2.1. Study Design
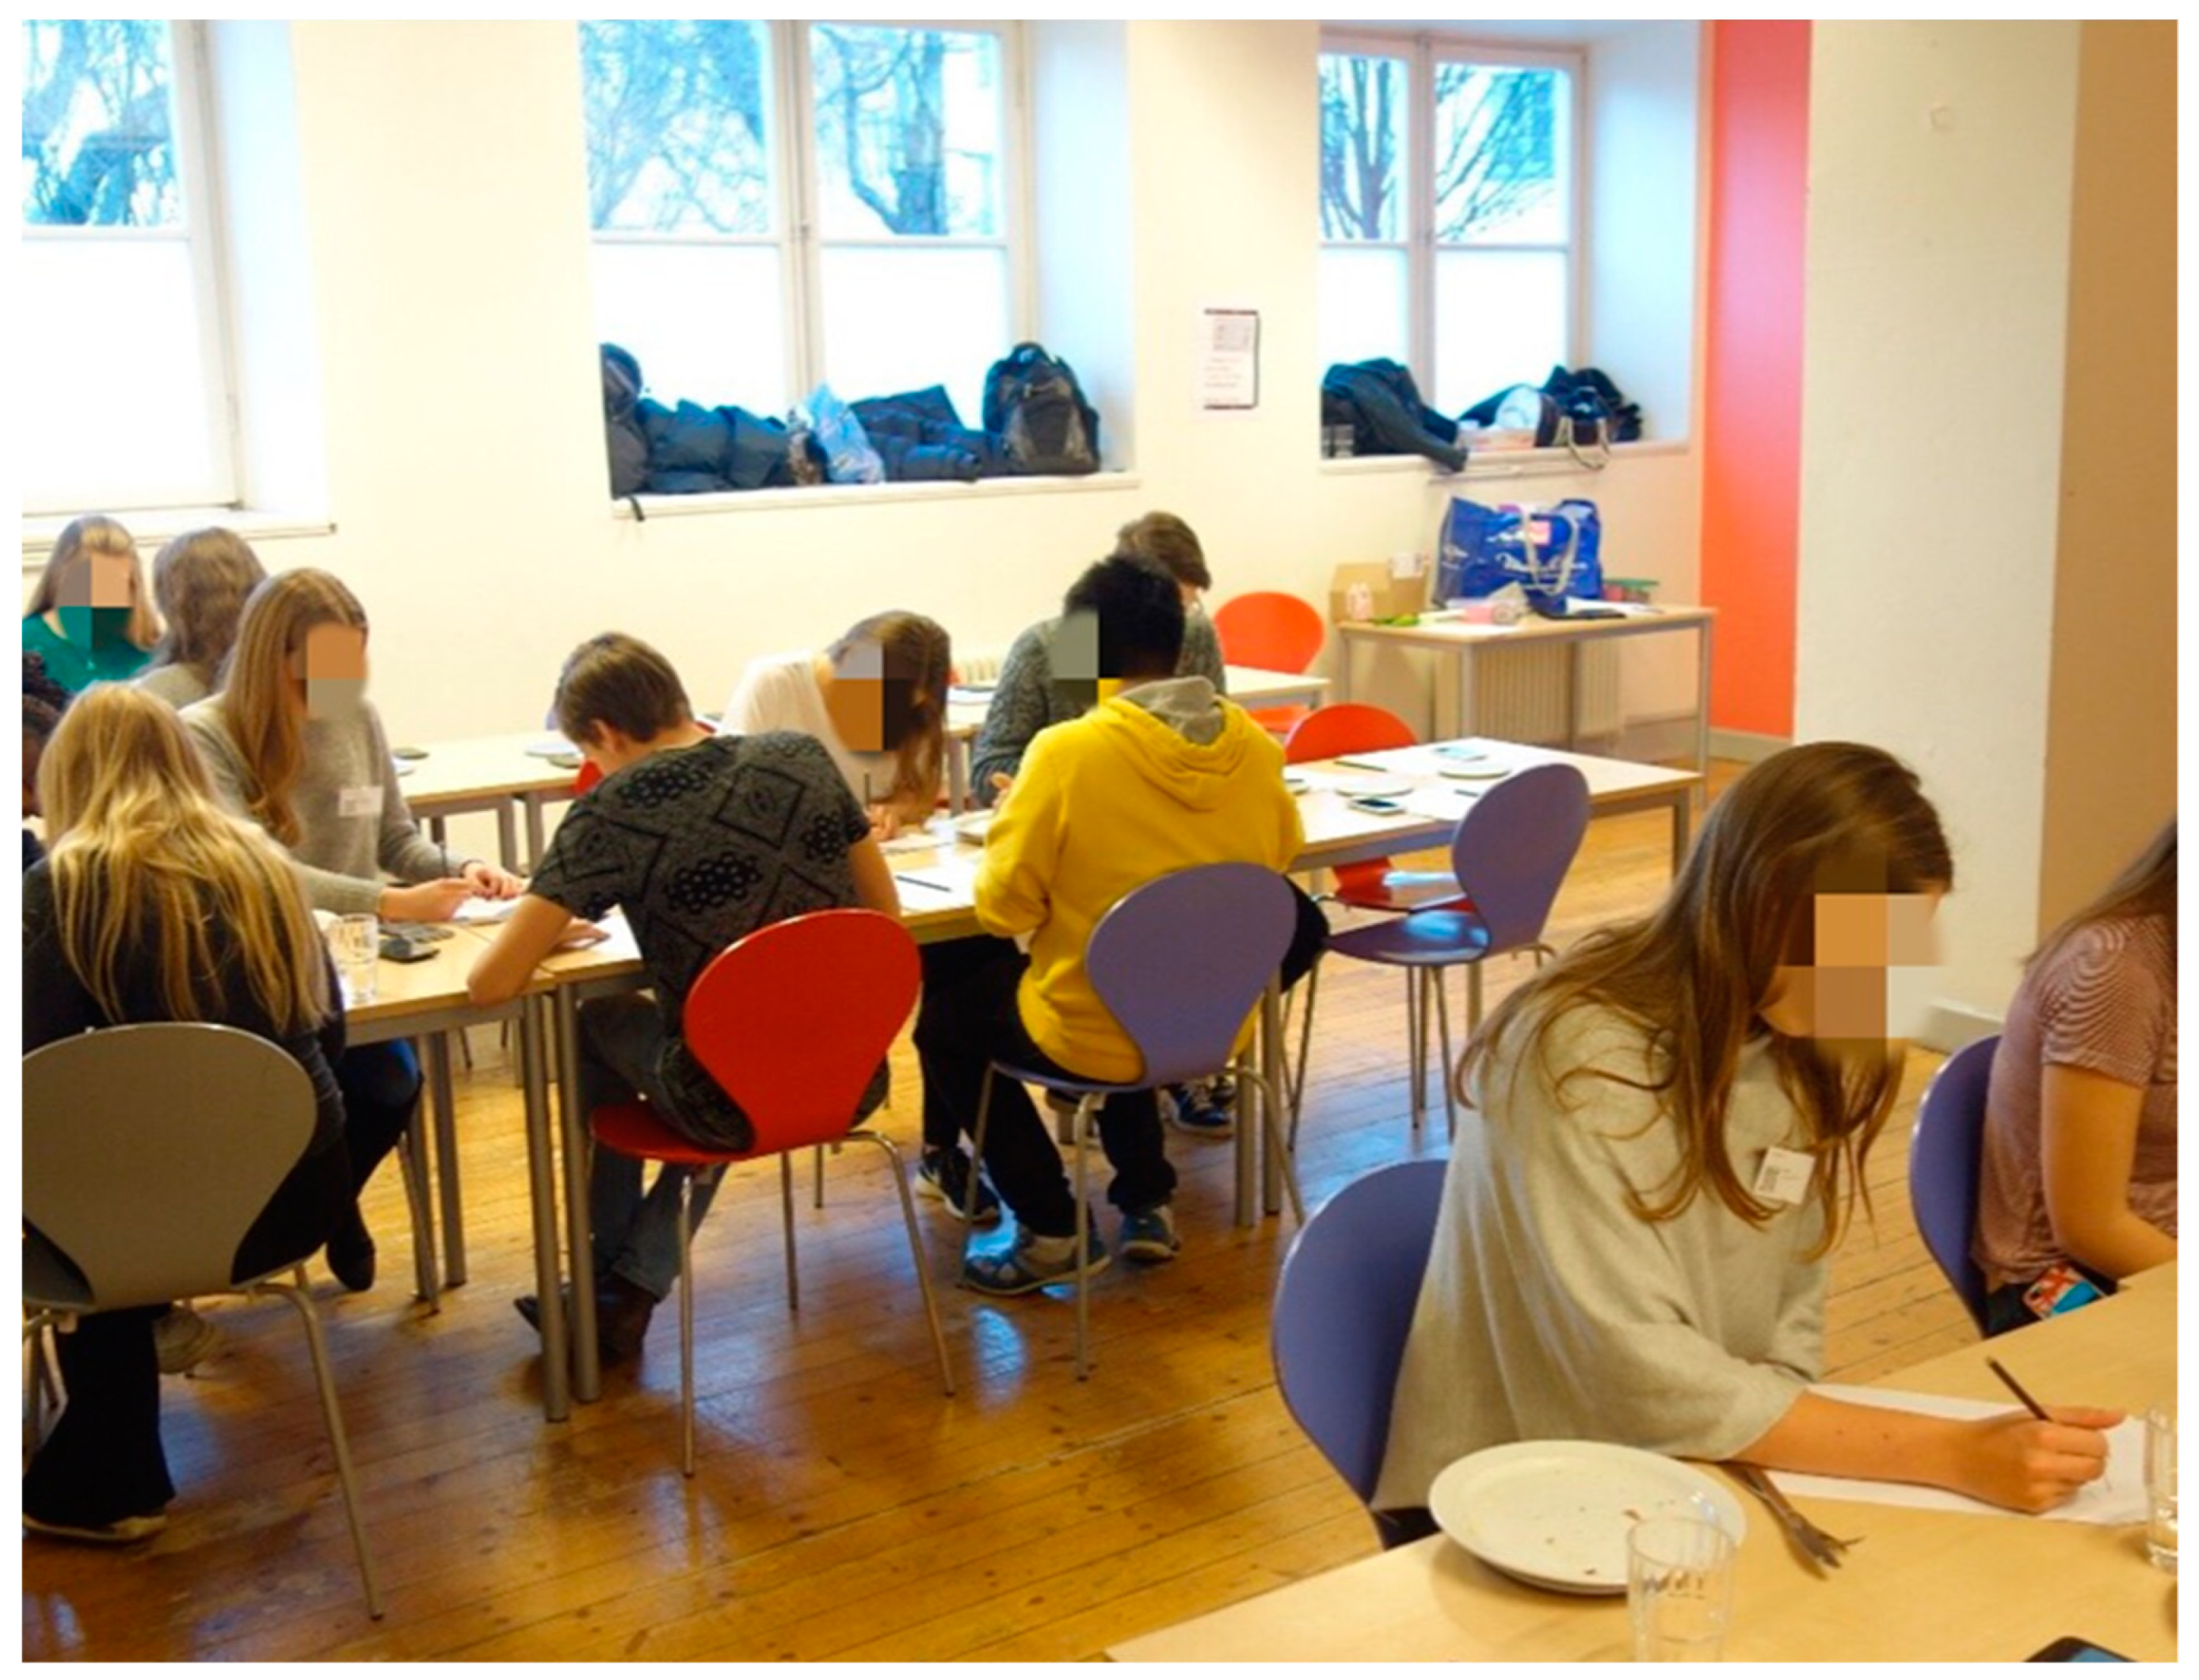
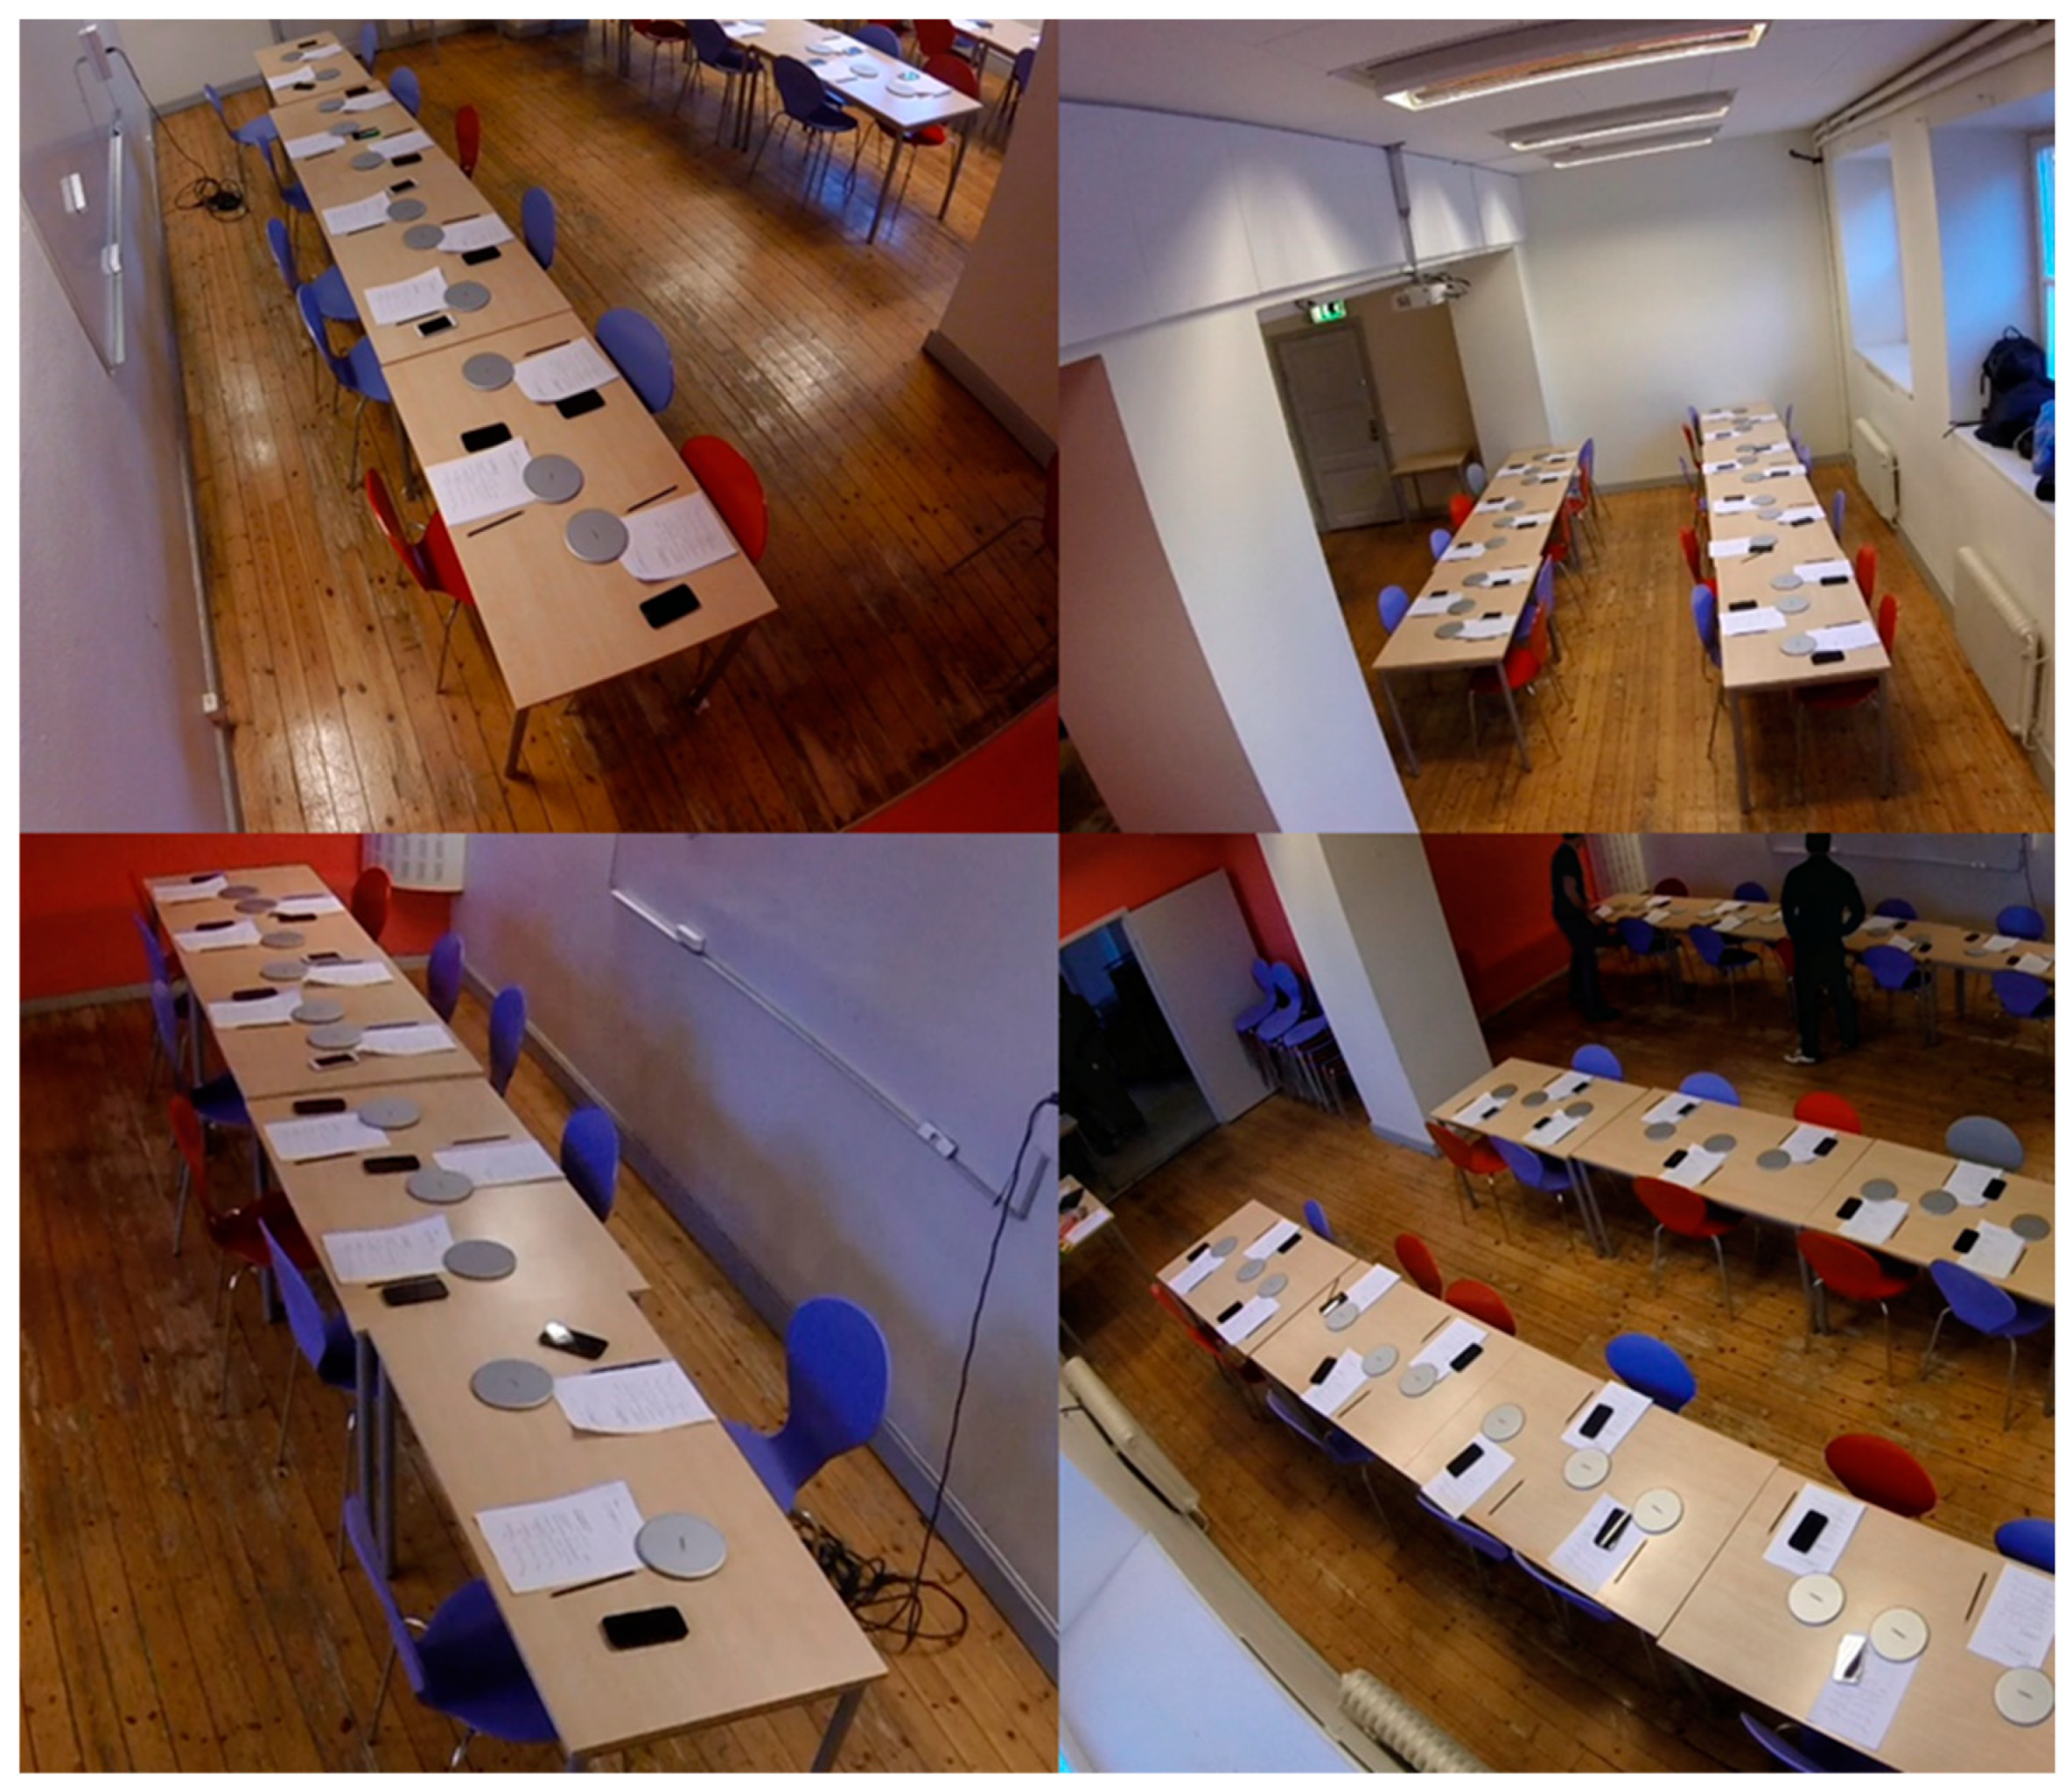
2.2. Setting
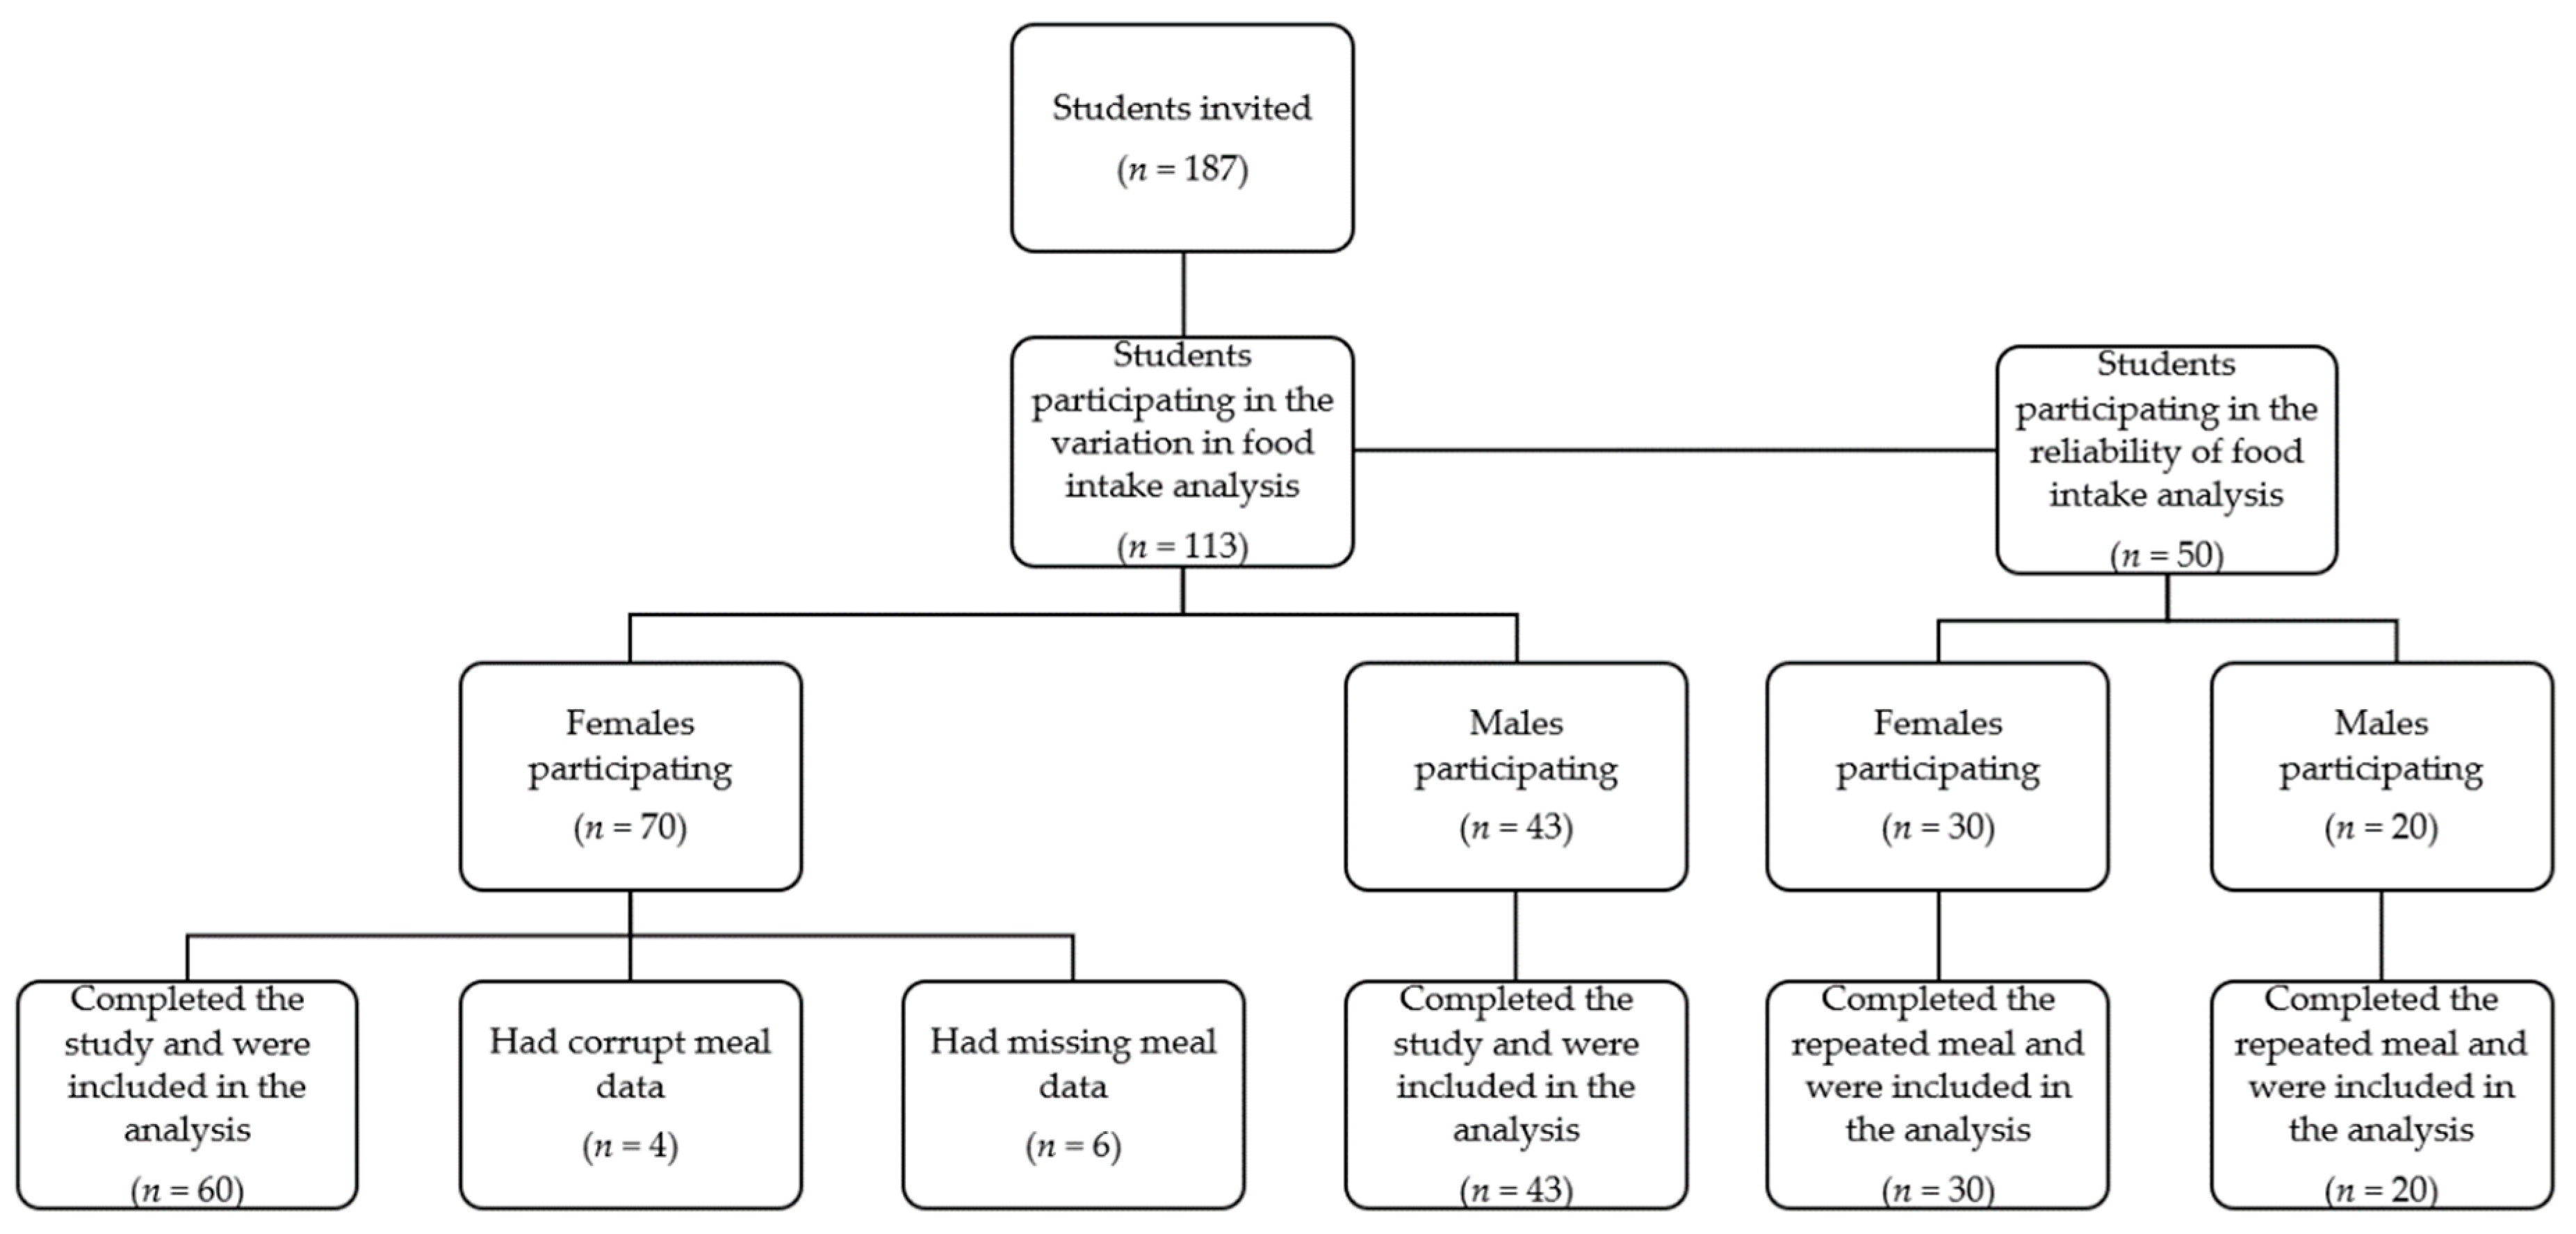
2.3. Participants
2.4. Data Sources/Measurement
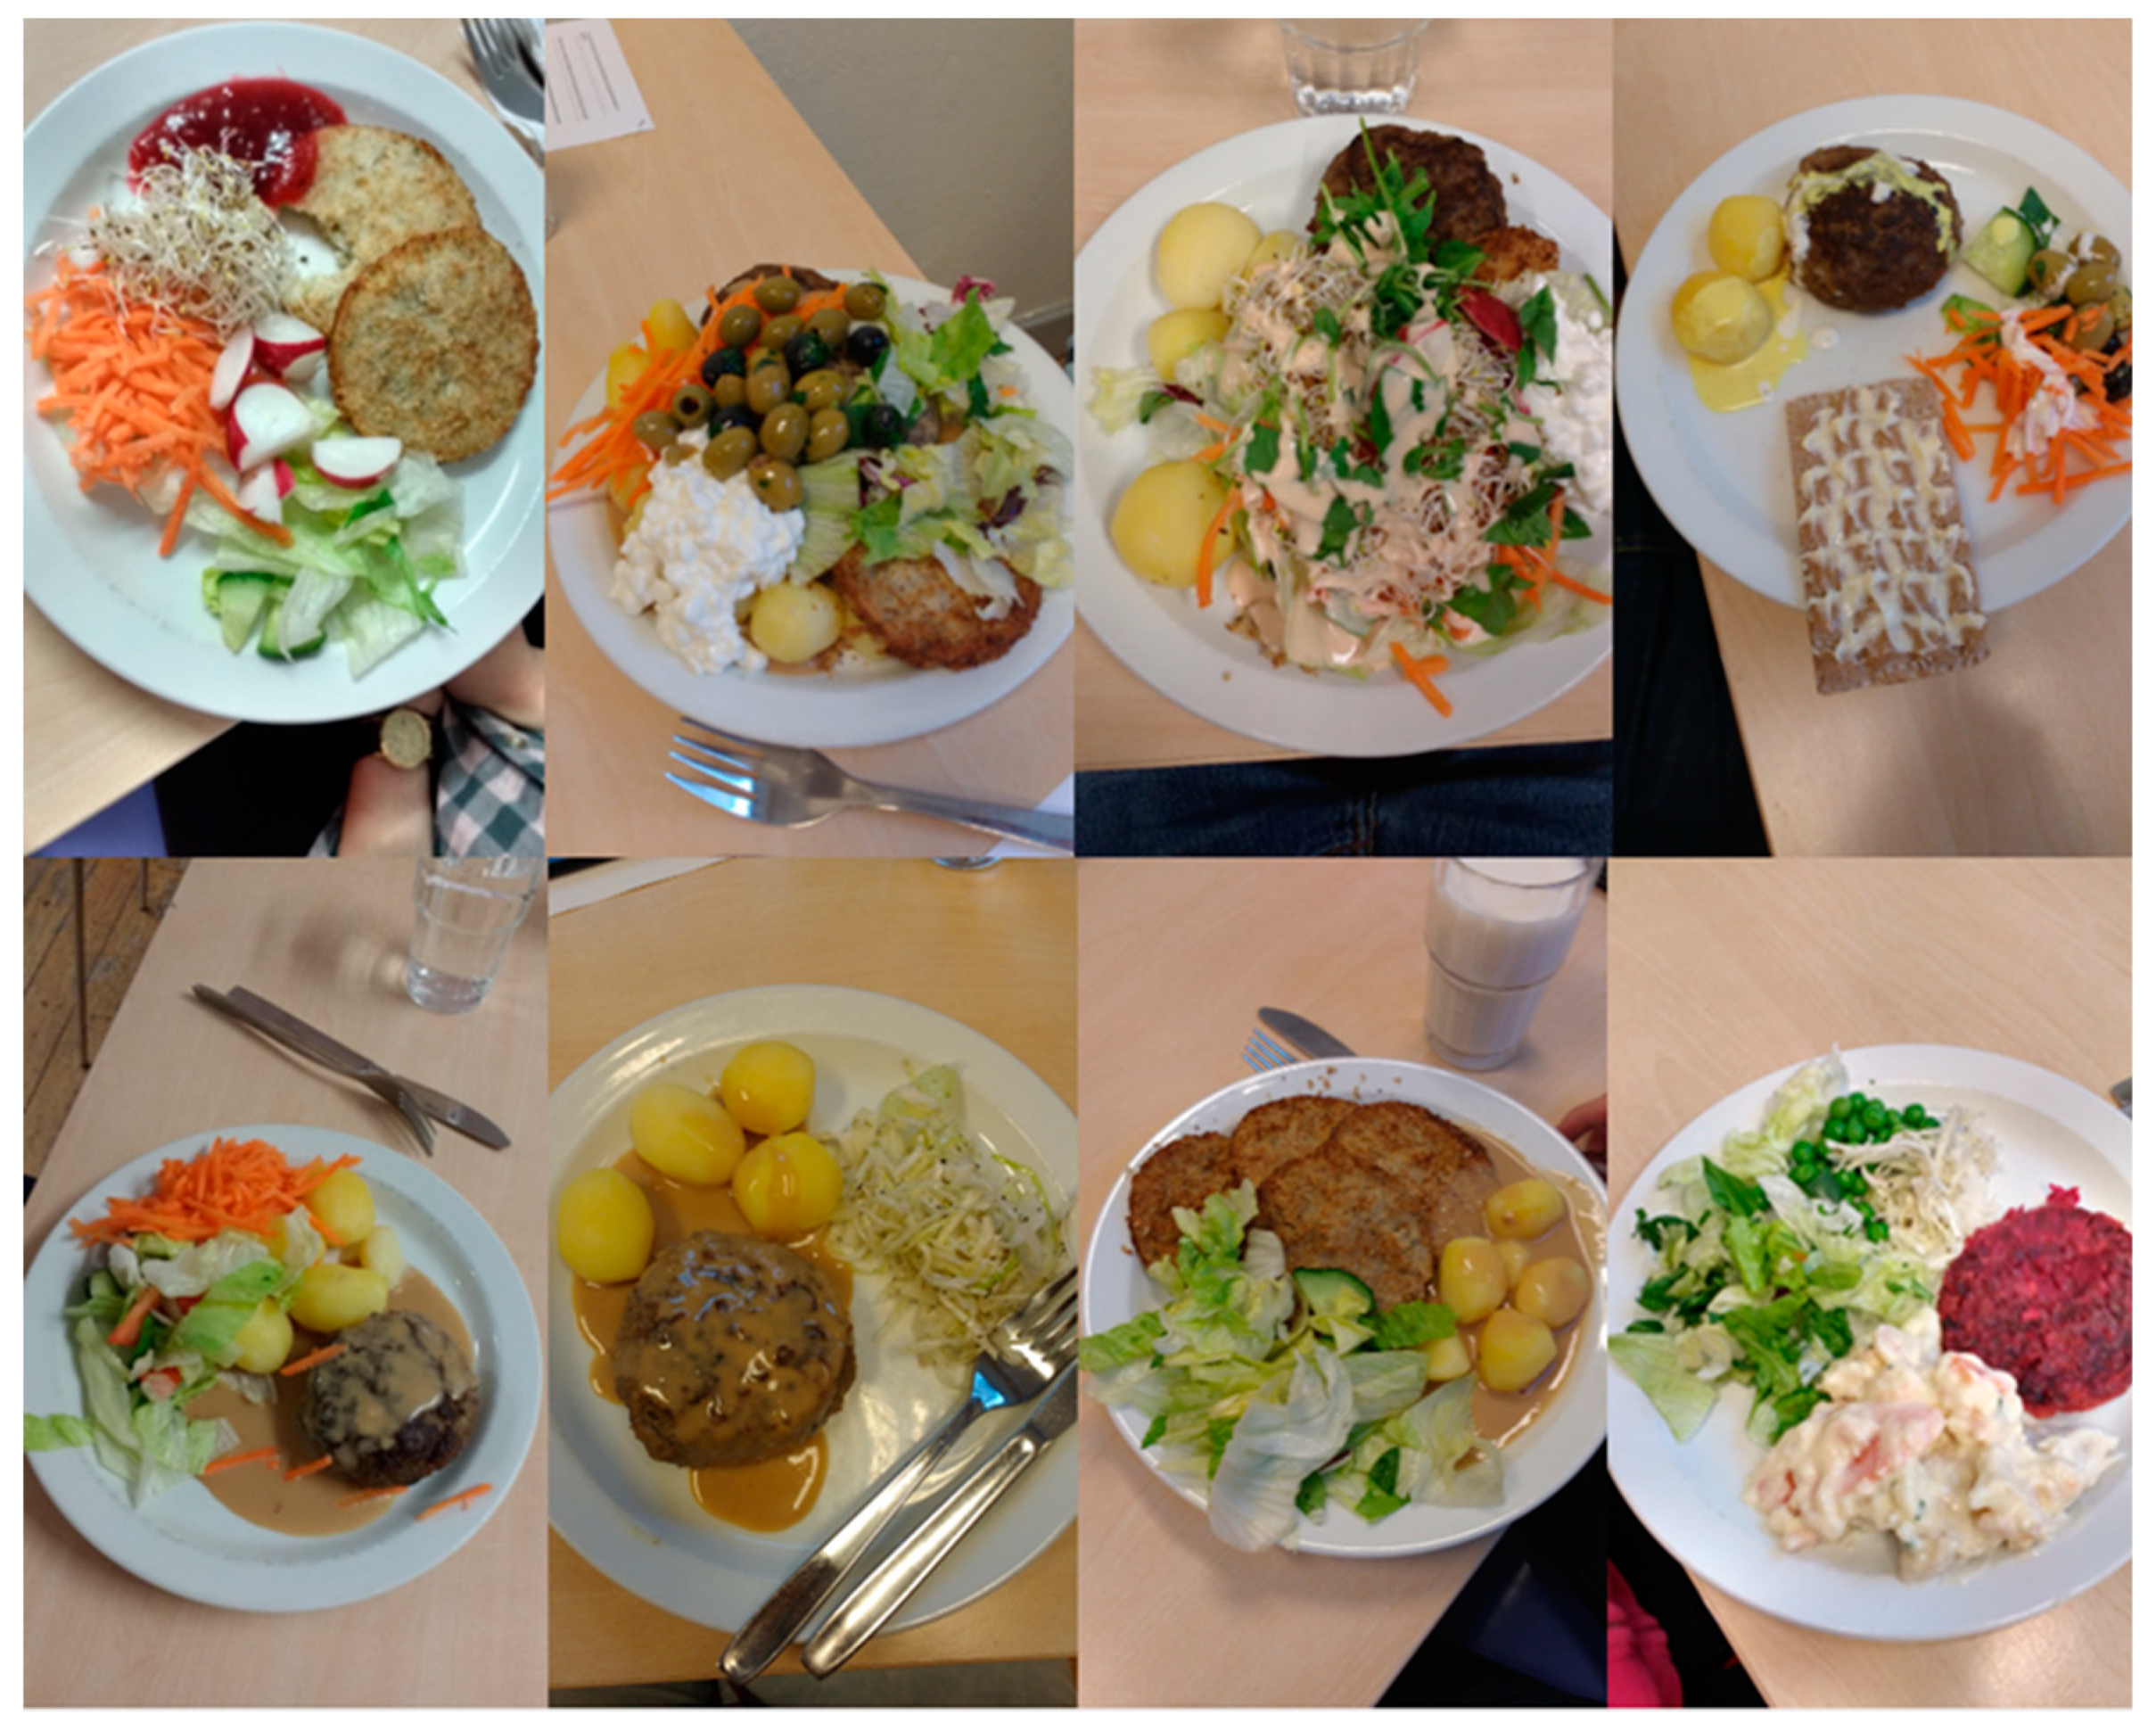
2.5. Served Food
2.6. Statistical Methods
2.7. Study Size
2.8. Ethics Approval and Consent to Participate
3. Results
3.1. Explaining Food Intake
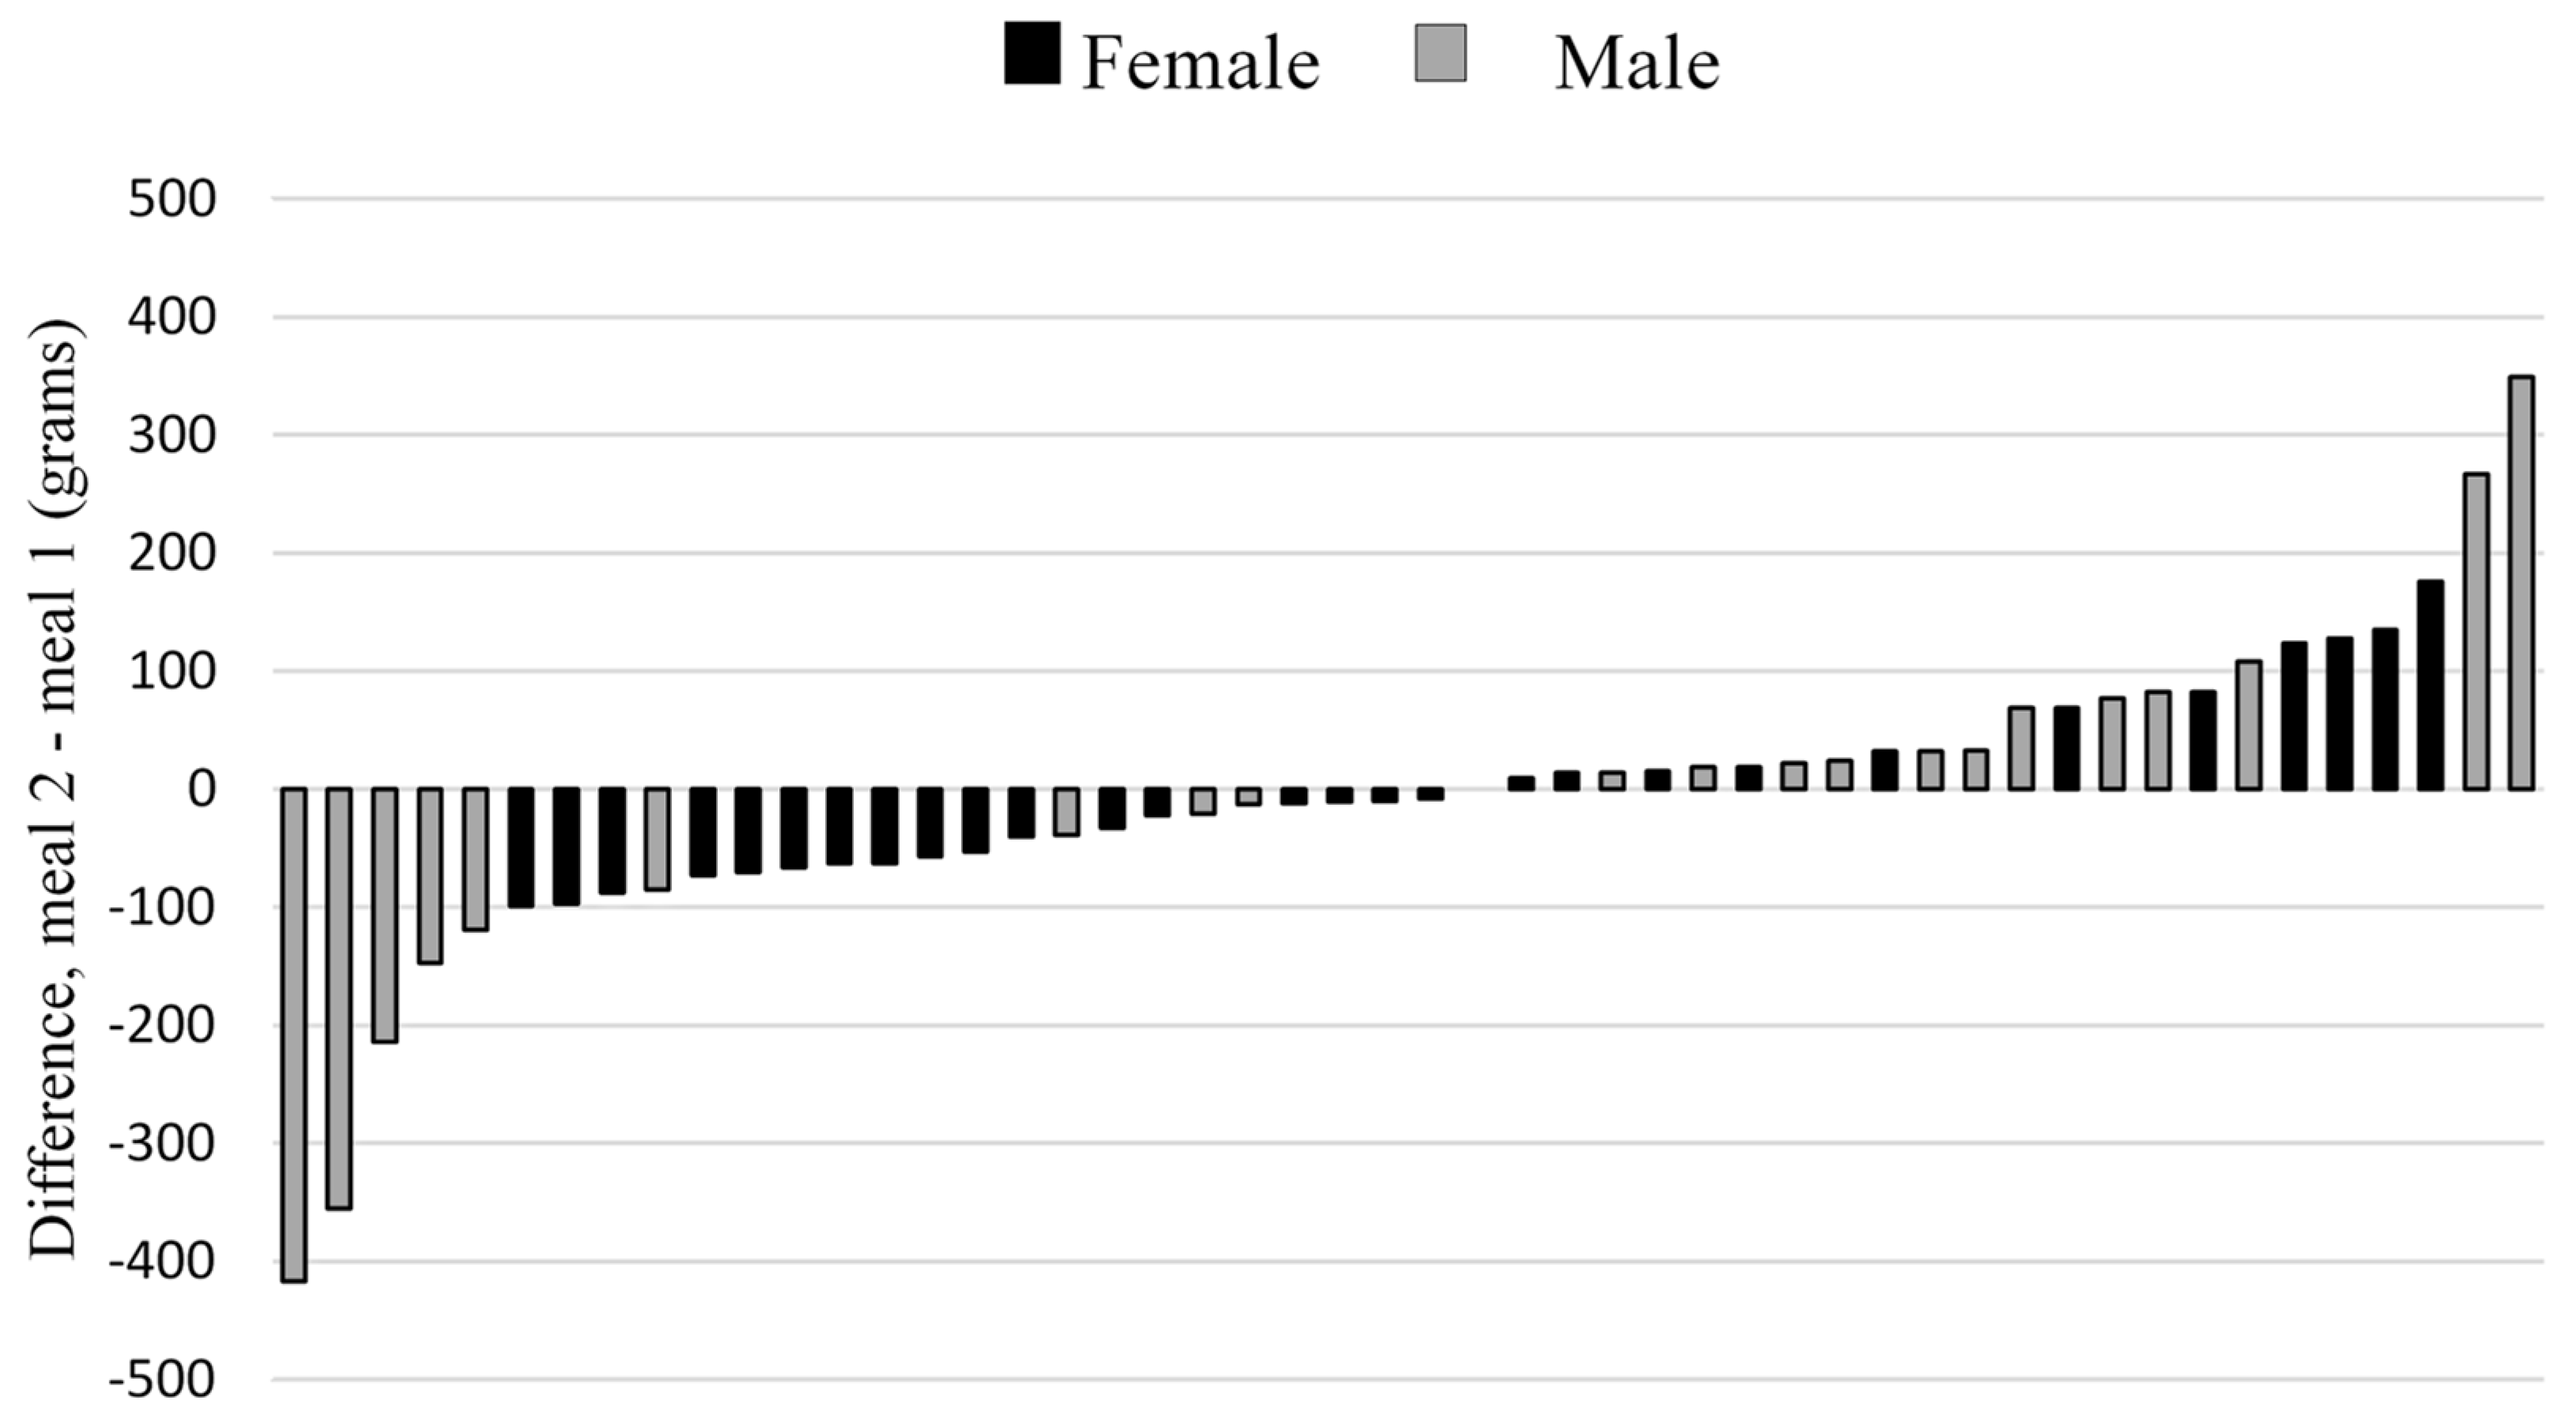
3.2. Reliability of Food Intake
4. Discussion
5. Conclusions
Author Contributions
Funding
Conflicts of Interest
References
- Mikkelsen, B.E.; Engesveen, K.; Afflerbach, T.; Barnekow, V. The human rights framework, the school and healthier eating among young people: A European perspective. Public Health Nutr. 2016, 19, 15–25. [Google Scholar] [CrossRef] [PubMed]
- WHO. Double Burden of Malnutrition. Available online: http://www.who.int/nutrition/double-burden-malnutrition/en/ (accessed on 14 December 2018).
- Bell, A.C.; Swinburn, B.A. What are the key food groups to target for preventing obesity and improving nutrition in schools? Eur. J. Clin. Nutr. 2004, 58, 258–263. [Google Scholar] [CrossRef] [PubMed] [Green Version]
- Martin, A.; Booth, J.N.; Laird, Y.; Sproule, J.; Reilly, J.J.; Saunders, D.H. Physical activity, diet and other behavioural interventions for improving cognition and school achievement in children and adolescents with obesity or overweight. Cochrane Database Syst. Rev. 2018, 3, CD009728. [Google Scholar] [PubMed]
- Riksdagsförvaltningen Skollag (2010:800). Available online: http://www.riksdagen.se/sv/dokument-lagar/dokument/svensk-forfattningssamling/skollag-2010800_sfs-2010-800#K10 (accessed on 27 November 2018).
- Osowski, C.P.; Lindroos, A.K.; Barbieri, H.E.; Becker, W. The contribution of school meals to energy and nutrient intake of Swedish children in relation to dietary guidelines. Food Nutr. Res. 2015, 59, 27563. [Google Scholar] [CrossRef] [PubMed] [Green Version]
- Vetenskaplig artikel om Riksmaten ungdom. Available online: https://www.livsmedelsverket.se/matvanor-halsa--miljo/kostrad-och-matvanor/mat-och-naring/vetenskaplig-artikel-om-riksmaten-ungdom (accessed on 20 December 2018).
- Moraeus, L.; Lemming, E.W.; Hursti, U.-K.K.; Arnemo, M.; Sipinen, J.P.; Lindroos, A.-K. Riksmaten Adolescents 2016–2017: A national dietary survey in Sweden—Design, methods, and participation. Food Nutr. Res. 2018, 62, 1381. [Google Scholar] [CrossRef] [PubMed]
- Archer, E.; Lavie, C.J.; Hill, J.O. The Failure to Measure Dietary Intake Engendered a Fictional Discourse on Diet-Disease Relations. Front. Nutr. 2018, 5, 105. [Google Scholar] [CrossRef] [PubMed]
- Dhurandhar, N.V.; Schoeller, D.; Brown, A.W.; Heymsfield, S.B.; Thomas, D.; Sørensen, T.I.A.; Speakman, J.R.; Jeansonne, M.; Allison, D.B.; Energy Balance Measurement Working Group. Energy balance measurement: When something is not better than nothing. Int. J. Obes. 2015, 39, 1109–1113. [Google Scholar] [CrossRef] [PubMed]
- Lara, J.J.; Scott, J.A.; Lean, M.E.J. Intentional mis-reporting of food consumption and its relationship with body mass index and psychological scores in women. J. Hum. Nutr. Diet. Off. J. Br. Diet. Assoc. 2004, 17, 209–218. [Google Scholar] [CrossRef]
- Lichtman, S.W.; Pisarska, K.; Berman, E.R.; Pestone, M.; Dowling, H.; Offenbacher, E.; Weisel, H.; Heshka, S.; Matthews, D.E.; Heymsfield, S.B. Discrepancy between self-reported and actual caloric intake and exercise in obese subjects. N. Engl. J. Med. 1992, 327, 1893–1898. [Google Scholar] [CrossRef] [PubMed]
- Forrestal, S.G. Energy intake misreporting among children and adolescents: A literature review. Matern. Child. Nutr. 2011, 7, 112–127. [Google Scholar] [CrossRef]
- Zandian, M.; Ioakimidis, I.; Bergström, J.; Brodin, U.; Bergh, C.; Leon, M.; Shield, J.; Södersten, P. Children eat their school lunch too quickly: An exploratory study of the effect on food intake. BMC Public Health 2012, 12, 351. [Google Scholar] [CrossRef] [PubMed]
- Langlet, B.; Anvret, A.; Maramis, C.; Moulos, I.; Papapanagiotou, V.; Diou, C.; Lekka, E.; Heimeier, R.; Delopoulos, A.; Ioakimidis, I. Objective measures of eating behaviour in a Swedish high school. Behav. Inf. Technol. 2017, 36, 1005–1013. [Google Scholar] [CrossRef]
- Robinson, E.; Almiron-Roig, E.; Rutters, F.; de Graaf, C.; Forde, C.G.; Tudur Smith, C.; Nolan, S.J.; Jebb, S.A. A systematic review and meta-analysis examining the effect of eating rate on energy intake and hunger. Am. J. Clin. Nutr. 2014, 100, 123–151. [Google Scholar] [CrossRef] [PubMed] [Green Version]
- Robinson, E.; Haynes, A.; Hardman, C.A.; Kemps, E.; Higgs, S.; Jones, A. The bogus taste test: Validity as a measure of laboratory food intake. Appetite 2017, 116, 223–231. [Google Scholar] [CrossRef] [PubMed] [Green Version]
- Sadoul, B.C.; Schuring, E.A.H.; Mela, D.J.; Peters, H.P.F. The relationship between appetite scores and subsequent energy intake: An analysis based on 23 randomized controlled studies. Appetite 2014, 83, 153–159. [Google Scholar] [CrossRef] [PubMed]
- Splendid. Available online: https://splendid-program.eu/ (accessed on 8 February 2019).
- Maramis, C.; Diou, C.; Ioakeimidis, I.; Lekka, I.; Dudnik, G.; Mars, M.; Maglaveras, N.; Bergh, C.; Delopoulos, A. Preventing obesity and eating disorders through behavioural modifications: The SPLENDID vision. In Proceedings of the 2014 4th International Conference on Wireless Mobile Communication and Healthcare—Transforming Healthcare through Innovations in Mobile and Wireless Technologies (MOBIHEALTH), Athens, Greece, 3–5 November 2014; pp. 7–10. [Google Scholar]
- Esfandiari, M.; Papapanagiotou, V.; Diou, C.; Zandian, M.; Nolstam, J.; Södersten, P.; Bergh, C. Control of Eating Behavior Using a Novel Feedback System. J. Vis. Exp. 2018, 35, e57432. [Google Scholar] [CrossRef]
- Ioakimidis, I.; Zandian, M.; Eriksson-Marklund, L.; Bergh, C.; Grigoriadis, A.; Södersten, P. Description of chewing and food intake over the course of a meal. Physiol. Behav. 2011, 104, 761–769. [Google Scholar] [CrossRef]
- Hopkins, W.G. Measures of reliability in sports medicine and science. Sports Med. 2000, 30, 1–15. [Google Scholar] [CrossRef]
- IBM SPSS Software. Available online: https://www.ibm.com/analytics/spss-statistics-software (accessed on 12 December 2018).
- Spreadsheets for Analysis of Validity and Reliability. Available online: http://www.sportsci.org/2015/ValidRely.htm (accessed on 10 December 2018).
- Faul, F.; Erdfelder, E.; Buchner, A.; Lang, A.-G. Statistical power analyses using G*Power 3.1: Tests for correlation and regression analyses. Behav. Res. Methods 2009, 41, 1149–1160. [Google Scholar] [CrossRef]
- Ford, A.L.; Bergh, C.; Södersten, P.; Sabin, M.A.; Hollinghurst, S.; Hunt, L.P.; Shield, J.P.H. Treatment of childhood obesity by retraining eating behaviour: Randomised controlled trial. BMJ 2009, 340, b5388. [Google Scholar] [CrossRef]
- Hermsen, S.; Frost, J.H.; Robinson, E.; Higgs, S.; Mars, M.; Hermans, R.C.J. Evaluation of a Smart Fork to Decelerate Eating Rate. J. Acad. Nutr. Diet. 2016, 116, 1068. [Google Scholar] [CrossRef]
- Kyritsis, K.; Tatli, C.L.; Diou, C.; Delopoulos, A. Automated analysis of in meal eating behavior using a commercial wristband IMU sensor. In Proceedings of the 2017 39th Annual International Conference of the IEEE Engineering in Medicine and Biology Society (EMBC), Jeju Island, Korea, 11–15 July 2017; pp. 2843–2846. [Google Scholar]
- Kyritsis, K.; Diou, C.; Delopoulos, A. End-to-end Learning for Measuring in-meal Eating Behavior from a Smartwatch. In Proceedings of the 2018 40th Annual International Conference of the IEEE Engineering in Medicine and Biology Society (EMBC), Honolulu, HI, USA, 18–21 July 2018; pp. 5511–5514. [Google Scholar]
- Robinson, E.; Hardman, C.A.; Halford, J.C.G.; Jones, A. Eating under observation: A systematic review and meta-analysis of the effect that heightened awareness of observation has on laboratory measured energy intake. Am. J. Clin. Nutr. 2015, 102, 324–337. [Google Scholar] [CrossRef]
- Stubbs, R.J.; O’Reilly, L.M.; Whybrow, S.; Fuller, Z.; Johnstone, A.M.; Livingstone, M.B.E.; Ritz, P.; Horgan, G.W. Measuring the difference between actual and reported food intakes in the context of energy balance under laboratory conditions. Br. J. Nutr. 2014, 111, 2032–2043. [Google Scholar] [CrossRef] [Green Version]
- Rolls, B.J.; Roe, L.S.; Halverson, K.H.; Meengs, J.S. Using a smaller plate did not reduce energy intake at meals. Appetite 2007, 49, 652–660. [Google Scholar] [CrossRef] [Green Version]
- New View of Statistics: Effect Magnitudes. Available online: https://www.sportsci.org/resource/stats/effectmag.html (accessed on 20 December 2018).
- Langlet, B.; Tang Bach, M.; Odegi, D.; Fagerberg, P.; Ioakimidis, I. The Effect of Food Unit Sizes and Meal Serving Occasions on Eating Behaviour Characteristics: Within Person Randomised Crossover Studies on Healthy Women. Nutrients 2018, 10, 880. [Google Scholar] [CrossRef]
- Hollands, G.J.; Shemilt, I.; Marteau, T.M.; Jebb, S.A.; Lewis, H.B.; Wei, Y.; Higgins, J.P.T.; Ogilvie, D. Portion, package or tableware size for changing selection and consumption of food, alcohol and tobacco. Cochrane Database Syst. Rev. 2015, 9, CD011045. [Google Scholar] [CrossRef]
- Periwal, V.; Chow, C.C. Patterns in food intake correlate with body mass index. Am. J. Physiol. Endocrinol. Metab. 2006, 291, E929–E936. [Google Scholar] [CrossRef]
- Mack, I.; Sauer, H.; Weimer, K.; Dammann, D.; Zipfel, S.; Enck, P.; Teufel, M. Obese children and adolescents need increased gastric volumes in order to perceive satiety. Obesity 2014, 22, 2123–2125. [Google Scholar] [CrossRef] [Green Version]


| Variation in Food Intake (n = 103) | Reliability of Food Intake (n = 50) | |
|---|---|---|
| Age, year | 16.7 ± 0.6 | 16.8 ± 0.6 |
| Female sex, (%) | 60 (58%) | 30 (60%) |
| Weight, kg | 61.8 ± 12.1 | 61.2 ± 11.1 |
| Height, cm | 170.3 ± 9.5 | 169.0 ± 9.0 |
| BMI, kg/m2 | 21.2 ± 3.2 | 21.4 ± 3.1 |
| Model | B | Lower Bound 95% Confidence Interval for B | Upper Bound 95% Confidence Interval for B | t | p |
|---|---|---|---|---|---|
| Constant | −212.978 | −341.133 | −84.823 | −3.300 | 0.001 |
| Eating rate (grams/minute) | 5.419 | 4.276 | 6.562 | 9.414 | <0.001 |
| Number of spoonfuls | 4.143 | 3.111 | 5.175 | 7.969 | <0.001 |
| Sex 2 | 58.326 | 19.824 | 96.827 | 3.008 | 0.003 |
| Number of food additions | 48.210 | 16.570 | 79.850 | 3.025 | 0.003 |
| Food taste | 1.159 | 0.097 | 2.221 | 2.167 | 0.033 |
| BMI | 5.008 | −0.677 | 10.693 | 1.749 | 0.084 |
| Change in fullness 3 | 0.021 | −0.702 | 0.744 | 0.058 | 0.954 |
| Lunches | Difference (Second − First) | ||
|---|---|---|---|
| First (n = 50) | Second (n = 50) | ||
| Food intake (grams) | 351.8 ± 171.0 | 344.3 ± 171.6 | −7.5 ± 125.1 |
| Eating rate (grams/minute) | 30.2 ± 15.4 | 34.6 ± 19.3 | 4.4 ± 12.9 |
| Number of spoonfuls | 42.7 ± 18.8 | 39.0 ± 16.2 | −3.7 ± 15.5 |
| Number of food additions | 0.3 ± 0.5 | 0.1 ± 0.4 | −0.2 ± 0.6 |
| Food taste | 48.4 ± 15.1 | 49.0 ± 16.2 | 0.6 ± 14.9 |
| Change in fullness | 33.4 ± 25.2 | 40.3 ± 32.2 | 6.9 ± 32.0 |
© 2019 by the authors. Licensee MDPI, Basel, Switzerland. This article is an open access article distributed under the terms and conditions of the Creative Commons Attribution (CC BY) license (http://creativecommons.org/licenses/by/4.0/).
Share and Cite
Fagerberg, P.; Langlet, B.; Glossner, A.; Ioakimidis, I. Food Intake during School Lunch Is Better Explained by Objectively Measured Eating Behaviors than by Subjectively Rated Food Taste and Fullness: A Cross-Sectional Study. Nutrients 2019, 11, 597. https://0-doi-org.brum.beds.ac.uk/10.3390/nu11030597
Fagerberg P, Langlet B, Glossner A, Ioakimidis I. Food Intake during School Lunch Is Better Explained by Objectively Measured Eating Behaviors than by Subjectively Rated Food Taste and Fullness: A Cross-Sectional Study. Nutrients. 2019; 11(3):597. https://0-doi-org.brum.beds.ac.uk/10.3390/nu11030597
Chicago/Turabian StyleFagerberg, Petter, Billy Langlet, Andrew Glossner, and Ioannis Ioakimidis. 2019. "Food Intake during School Lunch Is Better Explained by Objectively Measured Eating Behaviors than by Subjectively Rated Food Taste and Fullness: A Cross-Sectional Study" Nutrients 11, no. 3: 597. https://0-doi-org.brum.beds.ac.uk/10.3390/nu11030597