Relationship between the Intake of n-3 Polyunsaturated Fatty Acids and Depressive Symptoms in Elderly Japanese People: Differences According to Sex and Weight Status

 , , , ,
Abstract
:1. Introduction
2. Materials and Methods
2.1. Study Population
2.2. Depressive States
2.3. Nutrient Assessment
2.4. Other Variables
2.5. Statistical Analysis
3. Results
3.1. Participant Characteristics
3.2. Participant Characteristics and n-3 PUFAs Intake According to Depressive States
3.3. Influence of Sex on the Association between n-3 PUFAs Intake and Depressive States
3.4. Influence of Weight Status on the Association between n-3 PUFAs Intake and Depressive States
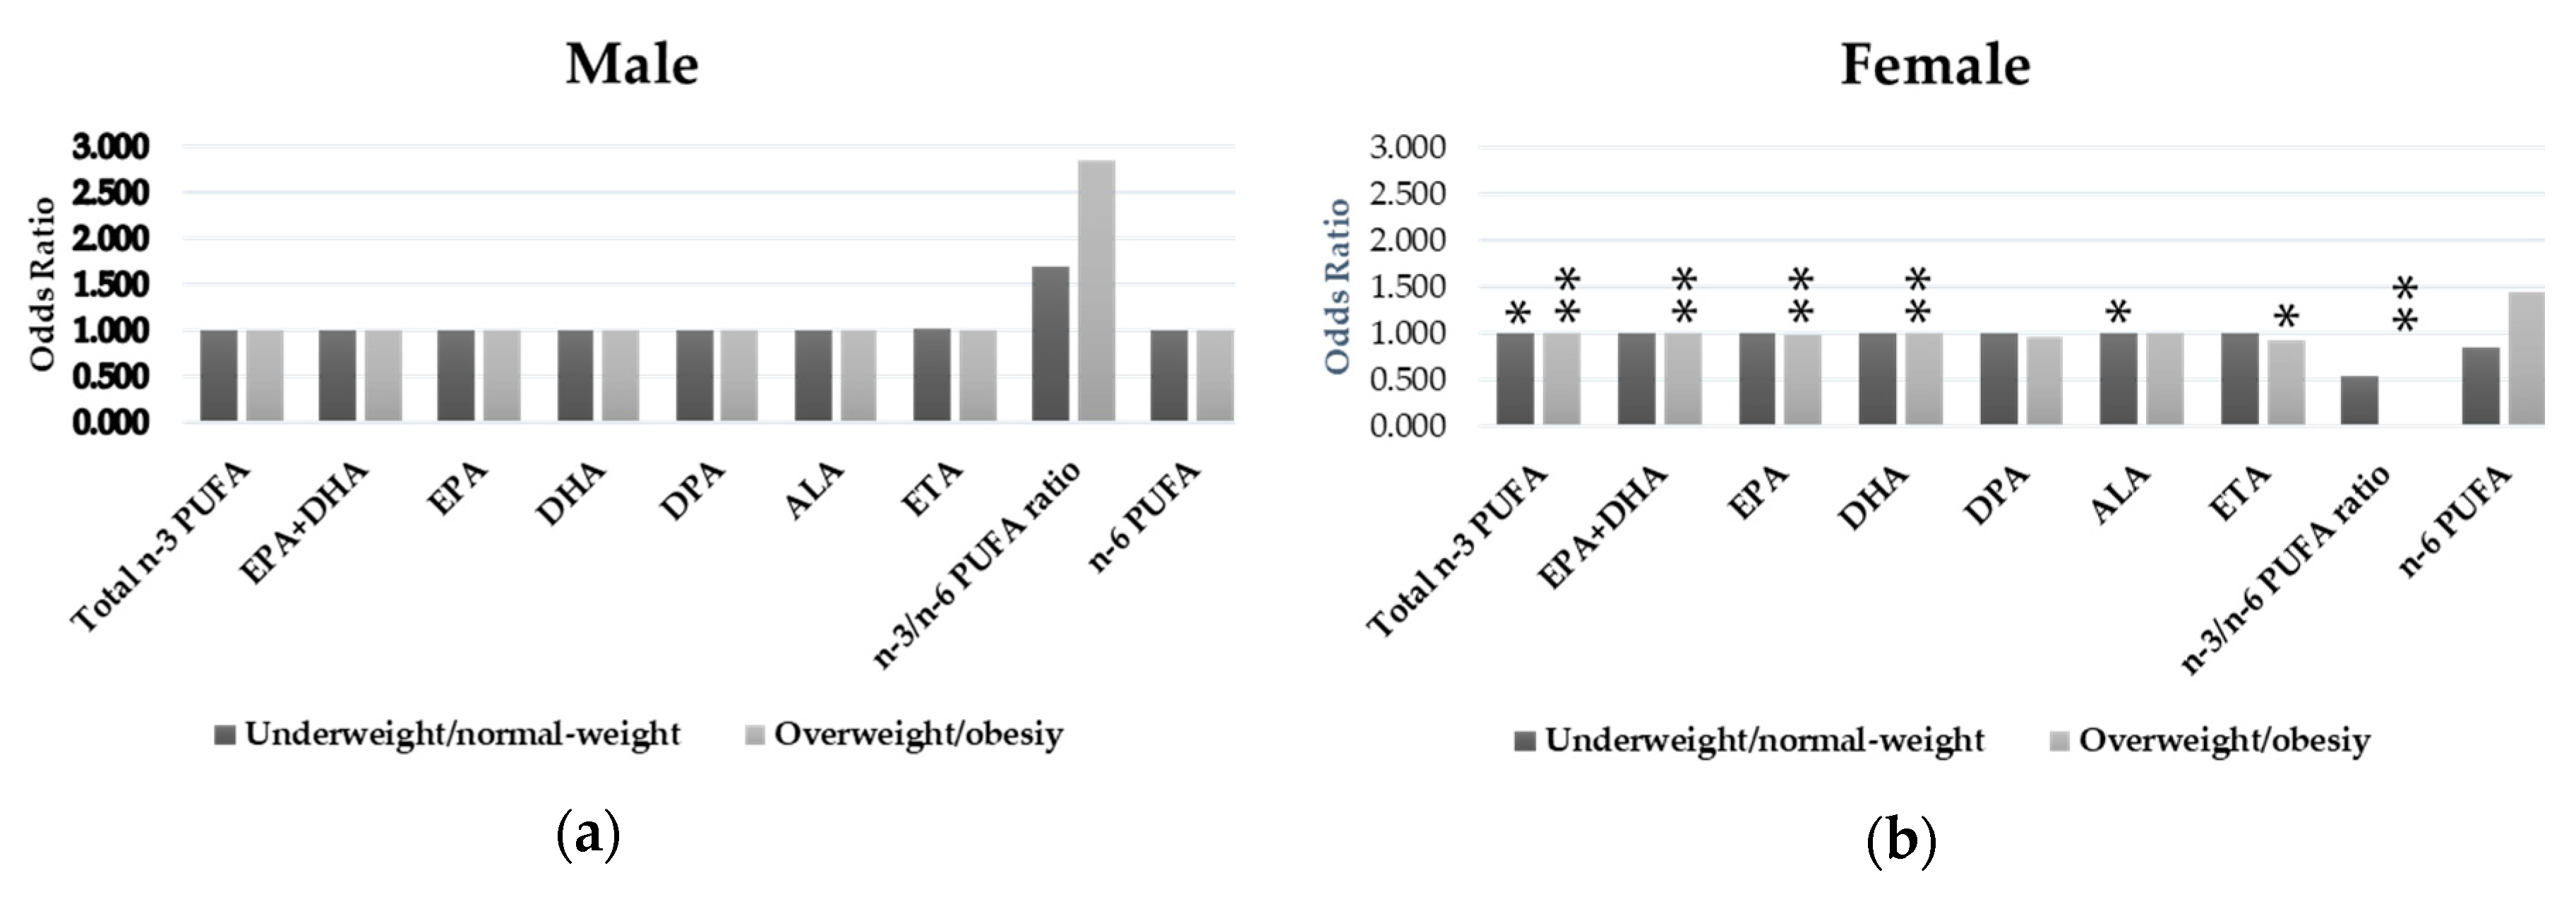
3.5. Relationships between n-3 PUFAs Intake and Depressive States by Sex and Weight Status
4. Discussion
5. Conclusions
Supplementary Materials
Author Contributions
Funding
Acknowledgments
Conflicts of Interest
References
- Wittchen, H.U.; Jacobi, F.; Rehm, J.; Gustavsson, A.; Svensson, M.; Jönsson, B.; Olesen, J.; Allgulander, C.; Alonso, J.; Faravelli, C.; et al. The size and burden of mental disorders and other disorders of the brain in Europe 2010. Eur. Neuropsychopharmacol. 2011, 21, 655–679. [Google Scholar] [CrossRef] [PubMed]
- American Psychiatric Association. Diagnostic and Statistical Manual for Psychiatric Disorders, 5th ed.; American Psychiatric Association: Washington, DC, USA, 2013. [Google Scholar]
- World Health Organization. Depression and Other Common Mental Disorders: Global Health Estimates; World Health Organization: Geneva, Switzerland, 2017; pp. 1–24. [Google Scholar]
- Sekita, A.; Arima, H.; Ninomiya, T.; Ohara, T.; Doi, Y.; Hirakawa, Y.; Fukuhara, M.; Hata, J.; Yonemoto, K.; Ga, Y.; et al. Elevated depressive symptoms in metabolic syndrome in a general population of Japanese men: A cross-sectional study. BMC Public Health. 2013, 13, 862. [Google Scholar] [CrossRef] [PubMed]
- Murray, C.J.; Lopez, A.D. Global mortality, disability, and the contribution of risk factors: Global Burden of Disease Study. Lancet 1997, 349, 1436–1442. [Google Scholar] [CrossRef]
- Sobocki, P.; Jönsson, B.; Angst, J.; Rehnberg, C. Cost of depression in Europe. J. Ment. Health Policy Econ. 2006, 9, 87–98. [Google Scholar] [PubMed]
- Grosso, G.; Galvano, F.; Marventano, S.; Malaguarnera, M.; Bucolo, C.; Drago, F.; Caraci, F. Omega-3 fatty acids and depression: Scientific evidence and biological mechanisms. Oxid. Med. Cell. Longev. 2014, 2014, 313570. [Google Scholar] [CrossRef]
- Appleton, K.M.; Rogers, P.J.; Ness, A.R. Is there a role for n-3 long-chain polyunsaturated fatty acids in the regulation of mood and behaviour? A review of the evidence to date from epidemiological studies, clinical studies and intervention trials. Nutr. Res. Rev. 2008, 21, 13–41. [Google Scholar] [CrossRef]
- Eaton, S.B.; Konner, M. Paleolithic nutrition. A consideration of its nature and current implications. N. Engl. J. Med. 1985, 312, 283–289. [Google Scholar] [CrossRef] [PubMed]
- Haag, M. Essential Fatty Acids and the Brain. Can. J. Psychiatry-Revue Can. Psychiatr. 2003, 48, 195–203. [Google Scholar] [CrossRef]
- Ruxton, C.H.S.; Calder, P.C.; Reed, S.C.; Simpson, M.J.A. The impact of long-chain n-3 polyunsaturated fatty acids on human health. Nutr. Res. Rev. 2005, 18, 113. [Google Scholar] [CrossRef]
- Ma, J.; Folsom, A.R.; Eckfeldt, J.H.; Lewis, L.; Chambless, L.E. Short- and long-term repeatability of fatty acid composition of human plasma phospholipids and cholesterol esters. The Atherosclerosis Risk in Communities (ARIC) Study Investigators. Am. J. Clin. Nutr. 1995, 62, 572–578. [Google Scholar] [CrossRef]
- Giles, G.E.; Mahoney, C.R.; Kanarek, R.B. Omega-3 fatty acids influence mood in healthy and depressed individuals. Nutr. Rev. 2013, 71, 727–741. [Google Scholar] [CrossRef] [PubMed]
- Piccinelli, M.; Wilkinson, G. Gender differences in depression. Critical review. Br. J. Psychiatry 2000, 177, 486–492. [Google Scholar] [CrossRef] [PubMed]
- Mannan, M.; Mamun, A.; Doi, S.; Clavarino, A. Is there a bi-directional relationship between depression and obesity among adult men and women? Systematic review and bias-adjusted meta analysis. Asian J. Psychiatry 2016, 21, 51–66. [Google Scholar] [CrossRef]
- Simopoulos, A.P. The importance of the ratio of omega-6/omega-3 essential fatty acids. Biomed. Pharmacother. 2002, 56, 365–379. [Google Scholar] [CrossRef]
- Shika Town Shikatown Population. Available online: http://www.town.shika.ishikawa.jp/jyuumin/shika_town_pop/shika_population.html (accessed on 1 March 2019).
- Ishikawa Prefecture Ishikawa Statistical Information. Available online: http://toukei.pref.ishikawa.jp/search/detail.asp?d_id=2489 (accessed on 1 March 2019).
- Burke, W.J.; Roccaforte, W.H.; Wengel, S.P. The short form of the Geriatric Depression Scale: A comparison with the 30-item form. J. Geriatr. Psychiatry Neurol. 1991, 4, 173–178. [Google Scholar] [CrossRef]
- Sugishita, K.; Sugishita, M.; Hemmi, I.; Asada, T.; Tanigawa, T. A Validity and Reliability Study of the Japanese Version of the Geriatric Depression Scale 15 (GDS-15-J). Clin. Gerontol. 2017, 40, 233–240. [Google Scholar] [CrossRef]
- Okubo, H.; Sasaki, S.; Rafamantanantsoa, H.H.; Ishikawa-Takata, K.; Okazaki, H.; Tabata, I. Validation of self-reported energy intake by a self-administered diet history questionnaire using the doubly labeled water method in 140 Japanese adults. Eur. J. Clin. Nutr. 2008, 62, 1343–1350. [Google Scholar] [CrossRef] [PubMed]
- Kobayashi, S.; Murakami, K.; Sasaki, S.; Okubo, H.; Hirota, N.; Notsu, A.; Fukui, M.; Date, C. Comparison of relative validity of food group intakes estimated by comprehensive and brief-type self-administered diet history questionnaires against 16 d dietary records in Japanese adults. Public Health Nutr. 2011, 14, 1200–1211. [Google Scholar] [CrossRef] [PubMed]
- Kobayashi, S.; Honda, S.; Murakami, K.; Sasaki, S.; Okubo, H.; Hirota, N.; Notsu, A.; Fukui, M.; Date, C. Both Comprehensive and Brief Self-Administered Diet History Questionnaires Satisfactorily Rank Nutrient Intakes in Japanese Adults. J. Epidemiol. 2012, 22, 151–159. [Google Scholar] [CrossRef]
- Sasaki, S.; Yanagibori, R.; Amano, K. Self-administered diet history questionnaire developed for health education: A relative validation of the test-version by comparison with 3-day diet record in women. J. Epidemiol. 1998, 8, 203–215. [Google Scholar] [CrossRef]
- Ministry of Health, Labor and Welfare of Japan. National Health and Nutrition Survey. Available online: http://ghdx.healthdata.org/record/japan-national-health-and-nutrition-survey-2013 (accessed on 1 March 2018).
- Ministry of Education, Culture, Sports and Technology of Japan. Standard Tables of Food Composition in Japan 2015 Seventh Revised Version. Available online: http://www.mext.go.jp/en/policy/science_technology/policy/title01/detail01/1374030.htm (accessed on 1 March 2019).
- Murakami, K.; Sasaki, S.; Takahashi, Y.; Okubo, H.; Hosoi, Y.; Horiguchi, H.; Oguma, E.; Kayama, F. Dietary glycemic index and load in relation to metabolic risk factors in Japanese female farmers with traditional dietary habits. Am. J. Clin. Nutr. 2006, 83, 1161–1169. [Google Scholar] [CrossRef]
- World Health Organization. BMI Classification. Available online: http://apps.who.int/bmi/index.jsp?introPage=intro_3.html (accessed on 1 March 2019).
- Grosso, G.; Micek, A.; Marventano, S.; Castellano, S.; Mistretta, A.; Pajak, A.; Galvano, F. Dietary n-3 PUFA, fish consumption and depression: A systematic review and meta-analysis of observational studies. J. Affect. Disord. 2016, 205, 269–281. [Google Scholar] [CrossRef]
- Colangelo, L.A.; He, K.; Whooley, M.A.; Daviglus, M.L.; Liu, K. Higher dietary intake of long-chain ω-3 polyunsaturated fatty acids is inversely associated with depressive symptoms in women. Nutrition 2009, 25, 1011–1019. [Google Scholar] [CrossRef]
- Beydoun, M.A.; Fanelli Kuczmarski, M.T.; Beydoun, H.A.; Hibbeln, J.R.; Evans, M.K.; Zonderman, A.B. ω-3 Fatty Acid Intakes Are Inversely Related to Elevated Depressive Symptoms among United States Women. J. Nutr. 2013, 143, 1743–1752. [Google Scholar] [CrossRef]
- Persons, J.E.; Robinson, J.G.; Ammann, E.M.; Coryell, W.H.; Espeland, M.A.; Harris, W.S.; Manson, J.E.; Fiedorowicz, J.G. Omega-3 fatty acid biomarkers and subsequent depressive symptoms. Int. J. Geriatr. Psychiatry 2014, 29, 747–757. [Google Scholar] [CrossRef]
- Lucas, M.; Mirzaei, F.; Reilly, E.J.O.; Pan, A.; Willett, W.C.; Kawachi, I.; Koenen, K.; Ascherio, A. Dietary intake of n-3 and n-6 fatty acids and the risk of clinical depression in women: A 10-y prospective follow-up study 1–4. Am. J. Clin. Nutr. 2011, 93, 1337–1343. [Google Scholar] [CrossRef]
- Häfner, S.; Baghai, T.C.; Eser, D.; Schüle, C.; Rupprecht, R.; Bondy, B.; Bedarida, G.; von Schacky, C. C-reactive protein is associated with polymorphisms of the angiotensin-converting enzyme gene in major depressed patients. J. Psychiatr. Res. 2008, 42, 163–165. [Google Scholar] [CrossRef]
- Miller, G.E.; Stetler, C.A.; Carney, R.M.; Freedland, K.E.; Banks, W.A. Clinical depression and inflammatory risk markers for coronary heart disease. Am. J. Cardiol. 2002, 90, 1279–1283. [Google Scholar] [CrossRef]
- Eller, T.; Vasar, V.; Shlik, J.; Maron, E. Pro-inflammatory cytokines and treatment response to escitaloprsam in major depressive disorder. Prog. Neuro-Psychopharmacol. Biol. Psychiatry 2008, 32, 445–450. [Google Scholar] [CrossRef]
- Caraci, F.; Copani, A.; Nicoletti, F.; Drago, F. Depression and Alzheimer’s disease: Neurobiological links and common pharmacological targets. Eur. J. Pharmacol. 2010, 626, 64–71. [Google Scholar] [CrossRef]
- Huffman, J.C.; Celano, C.M.; Beach, S.R.; Motiwala, S.R.; Januzzi, J.L. Depression and cardiac disease: Epidemiology, mechanisms, and diagnosis. Cardiovasc. Psychiatry Neurol. 2013, 2013, 695925. [Google Scholar] [CrossRef] [PubMed]
- Maes, M.; Yirmyia, R.; Noraberg, J.; Brene, S.; Hibbeln, J.; Perini, G.; Kubera, M.; Bob, P.; Lerer, B.; Maj, M. The inflammatory & neurodegenerative (I&ND) hypothesis of depression: Leads for future research and new drug developments in depression. Metab. Brain Dis. 2009, 24, 27–53. [Google Scholar] [CrossRef] [PubMed]
- Parletta, N.; Milte, C.M.; Meyer, B.J. Nutritional modulation of cognitive function and mental health. J. Nutr. Biochem. 2013, 24, 725–743. [Google Scholar] [CrossRef] [PubMed]
- Giltay, E.J.; Gooren, L.J.G.; Toorians, A.W.F.T.; Katan, M.B.; Zock, P.L. Docosahexaenoic acid concentrations are higher in women than in men because of estrogenic effects. Am. J. Clin. Nutr. 2004, 80, 1167–1174. [Google Scholar] [CrossRef]
- Bakewell, L.; Burdge, G.C.; Calder, P.C. Polyunsaturated fatty acid concentrations in young men and women consuming their habitual diets. Br. J. Nutr. 2006, 96, 93–99. [Google Scholar] [CrossRef] [PubMed]
- Jantaratnotai, N.; Mosikanon, K.; Lee, Y.; McIntyre, R.S. The interface of depression and obesity. Obes. Res. Clin. Pract. 2017, 11, 1–10. [Google Scholar] [CrossRef]
- Kurhe, Y.; Mahesh, R. Mechanisms linking depression co-morbid with obesity: An approach for serotonergic type 3 receptor antagonist as novel therapeutic intervention. Asian J. Psychiatry 2015, 17, 3–9. [Google Scholar] [CrossRef]
- Manzel, A.; Muller, D.N.; Hafler, D.A.; Erdman, S.E.; Linker, R.A.; Kleinewietfeld, M. Role of “western diet” in inflammatory autoimmune diseases. Curr. Allergy Asthma Rep. 2014, 14, 404. [Google Scholar] [CrossRef]
- Byelashov, O.A.; Sinclair, A.J.; Kaur, G. Dietary sources, current intakes, and nutritional role of omega-3 docosapentaenoic acid. Lipid Technol. 2015, 27, 79–82. [Google Scholar] [CrossRef] [PubMed]
- Papanikolaou, Y.; Brooks, J.; Reider, C.; Fulgoni, V.L. U.S. adults are not meeting recommended levels for fish and omega-3 fatty acid intake: Results of an analysis using observational data from NHANES 2003–2008. Nutr. J. 2014, 13, 31. [Google Scholar] [CrossRef]
- Cutolo, M.; Straub, R.H.; Bijlsma, J.W.J. Neuroendocrine-Immune interactions in synovitis. Nat. Clin. Pract. Rheumatol. 2007, 3, 627–634. [Google Scholar] [CrossRef]
- Byrne, M.L.; O’Brien-Simpson, N.M.; Mitchell, S.A.; Allen, N.B. Adolescent-Onset Depression: Are Obesity and Inflammation Developmental Mechanisms or Outcomes? Child Psychiatry Hum. Dev. 2015, 46, 839–850. [Google Scholar] [CrossRef]
- Klein, S.L. The effects of hormones on sex differences in infection: From genes to behavior. Neurosci. Biobehav. Rev. 2000, 24, 627–638. [Google Scholar] [CrossRef]
- Hibbeln, J.R.; Nieminen, L.R.; Blasbalg, T.L.; Riggs, J.A.; Lands, W.E. Healthy intakes of n-3 and n-6 fatty acids: Estimations considering. Am. J. Clin. Nutr. 2006, 6, 1483S–1493S. [Google Scholar] [CrossRef]
- World Health Organization; Uauy, R.E.A. Fats and Fatty Acids in Human Nutrition, Report of an Expert Consultation; Food and Agriculture Organization: Rome, Italy, 2008; Volume 91, ISBN 9789251067338. [Google Scholar]
- British Nutrition Foundation. BNF Briefing Paper: n-3 Fatty Acids and Health; British Nutrition Foundation: London, UK, 1999; Volume 24, pp. 71–73. [Google Scholar]
- Simopoulos, A.P. Evolutionary aspects of omega-3 fatty acids in the food supply. Prostaglandins. Leukot. Essent. Fatty Acids 2001, 60, 421–429. [Google Scholar] [CrossRef]
- James, M.J.; Gibson, R.A.; Cleland, L.G. Dietary polyunsaturated fatty acids and inflammatory mediator production. Am. J. Clin. Nutr. 2000, 71, 343S–348S. [Google Scholar] [CrossRef]
- Livingstone, M.B.E.; Black, A.E. Markers of the validity of reported energy intake. J. Nutr. 2003, 133, 895S–920S. [Google Scholar] [CrossRef]
- Lissner, L.; Troiano, R.P.; Midthune, D.; Heitmann, B.L.; Kipnis, V.; Subar, A.F.; Potischman, N. OPEN about obesity: Recovery biomarkers, dietary reporting errors and BMI. Int. J. Obes. 2007, 31, 956–961. [Google Scholar] [CrossRef] [PubMed]
- Murakami, K.; Sasaki, S.; Takahashi, Y.; Uenishi, K.; Yamasaki, M.; Hayabuchi, H.; Goda, T.; Oka, J.; Baba, K.; Ohki, K.; et al. Misreporting of dietary energy, protein, potassium and sodium in relation to body mass index in young Japanese women. Eur. J. Clin. Nutr. 2008, 62, 111–118. [Google Scholar] [CrossRef]


| Total (N = 1633) | Male (N = 720) | Female (N = 913) | p * | ||||
|---|---|---|---|---|---|---|---|
| Ave (n) | SD (%) | Ave (n) | SD (%) | Ave (n) | SD (%) | ||
| Age | 74.5 | 7.4 | 73.5 | 6.8 | 75.2 | 7.8 | <0.001 |
| BMI | 22.9 | 3.2 | 23.3 | 3 | 22.6 | 3.3 | <0.001 |
| Energy (kcal) | 1824.1 | 610.9 | 2014.5 | 632.3 | 1673.9 | 549.1 | <0.001 |
| Carbohydrate (% energy) | 55.4 | 8.5 | 54.0 | 8.9 | 56.5 | 8.1 | <0.001 |
| Education | 10.4 | 2.4 | 10.7 | 2.5 | 10.1 | 2.2 | <0.001 |
| Social activity (none) | 1237 | 78.3% | 523 | 75.0% | 714 | 80.9% | 0.005 |
| Household size (being single) | 207 | 12.9% | 56 | 7.9% | 151 | 16.9% | <0.001 |
| Drinking | 905 | 58.5% | 526 | 75.4% | 379 | 44.6% | <0.001 |
| Smoking | 165 | 10.4% | 146 | 20.7% | 19 | 2.1% | <0.001 |
| Hypertension | 643 | 39.4% | 310 | 43.1% | 333 | 36.5% | 0.007 |
| Diabetes | 229 | 14.0% | 122 | 16.9% | 107 | 11.7% | 0.003 |
| Hyperlipidemia | 314 | 19.2% | 102 | 14.2% | 212 | 23.2% | <0.001 |
| Depressive state | 327 | 20.0% | 147 | 20.4% | 180 | 19.7% | 0.725 |
| Total n-3 PUFAs (% energy) | 1.382 | 0.481 | 1.338 | 0.470 | 1.417 | 0.487 | 0.001 |
| EPA+DHA (% energy) | 0.539 | 0.315 | 0.531 | 0.310 | 0.545 | 0.320 | 0.368 |
| EPA (% energy) | 0.204 | 0.127 | 0.201 | 0.124 | 0.207 | 0.129 | 0.390 |
| DHA (% energy) | 0.335 | 0.189 | 0.330 | 0.186 | 0.339 | 0.192 | 0.354 |
| DPA (% energy) | 0.058 | 0.033 | 0.057 | 0.033 | 0.059 | 0.034 | 0.417 |
| ALA (% energy) | 0.714 | 0.224 | 0.679 | 0.211 | 0.741 | 0.230 | <0.001 |
| ETA (% energy) | 0.020 | 0.013 | 0.020 | 0.012 | 0.020 | 0.013 | 0.551 |
| n-3/n-6 PUFAs ratio | 0.305 | 0.107 | 0.307 | 0.105 | 0.302 | 0.108 | 0.343 |
| n-6 PUFAs | 5.149 | 1.339 | 4.928 | 1.265 | 5.323 | 1.370 | <0.001 |
| Without Depressive States (N = 1306) | With Depressive States (N = 327) | p * | |||
|---|---|---|---|---|---|
| Ave (n) | SD (%) | Ave (n) | SD (%) | ||
| Age | 73.8 | 7.1 | 77.3 | 8.1 | <0.001 |
| BMI | 23 | 3.1 | 22.6 | 3.5 | 0.064 |
| Energy (kcal) | 1852.2 | 618.2 | 1712 | 568 | <0.001 |
| Carbohydrate (% energy) | 55.1 | 8.5 | 56.6 | 8.5 | 0.004 |
| Education | 10.5 | 2.4 | 9.9 | 2.4 | <0.001 |
| Social activity (none) | 962 | 76.0% | 275 | 87.6% | <0.001 |
| Household size (being single) | 159 | 12.4% | 48 | 15.0% | 0.206 |
| Drinking | 746 | 60.3% | 159 | 51.1% | 0.003 |
| Smoking | 138 | 10.8% | 27 | 8.7% | 0.264 |
| Hypertension | 511 | 39.1% | 132 | 40.4% | 0.682 |
| Diabetes | 180 | 13.8% | 49 | 15.0% | 0.576 |
| Hyperlipidemia | 258 | 19.8% | 56 | 17.1% | 0.278 |
| Total n-3 PUFAs (% energy) | 1.402 | 0.487 | 1.303 | 0.450 | <0.001 |
| EPA+DHA (% energy) | 0.548 | 0.321 | 0.504 | 0.290 | 0.017 |
| EPA (% energy) | 0.208 | 0.129 | 0.189 | 0.117 | 0.011 |
| DHA (% energy) | 0.340 | 0.192 | 0.315 | 0.174 | 0.033 |
| DPA (% energy) | 0.059 | 0.034 | 0.055 | 0.030 | 0.032 |
| ALA (% energy) | 0.722 | 0.224 | 0.679 | 0.220 | 0.002 |
| ETA (% energy) | 0.021 | 0.013 | 0.019 | 0.011 | 0.028 |
| n-3/n-6 PUFAs ratio | 0.307 | 0.109 | 0.295 | 0.100 | 0.082 |
| n-6 PUFAs | 5.179 | 1.332 | 5.026 | 1.363 | 0.063 |
| Without Depressive States (N = 1306) | With Depressive States (N = 327) | p1 a | p2 b | p3 c | p4 d | ||||||
|---|---|---|---|---|---|---|---|---|---|---|---|
| Average | 95% CI | Average | 95% CI | ||||||||
| Lower | Upper | Lower | Upper | ||||||||
| Total n-3 PUFAs | Male (N = 720) | 1.340 | 1.301 | 1.379 | 1.329 | 1.254 | 1.403 | 0.002 | 0.008 | 0.798 | <0.001 |
| Female (N = 914) | 1.450 | 1.415 | 1.486 | 1.281 | 1.217 | 1.346 | |||||
| EPA+DHA | Male (N = 720) | 0.531 | 0.505 | 0.556 | 0.533 | 0.484 | 0.582 | 0.045 | 0.034 | 0.937 | 0.002 |
| Female (N = 914) | 0.561 | 0.537 | 0.585 | 0.480 | 0.440 | 0.521 | |||||
| EPA | Male (N = 720) | 0.201 | 0.191 | 0.211 | 0.201 | 0.181 | 0.221 | 0.030 | 0.030 | 0.995 | <0.001 |
| Female (N = 914) | 0.213 | 0.204 | 0.223 | 0.179 | 0.163 | 0.196 | |||||
| DHA | Male (N = 720) | 0.329 | 0.314 | 0.345 | 0.332 | 0.302 | 0.361 | 0.058 | 0.037 | 0.898 | 0.003 |
| Female (N = 914) | 0.348 | 0.334 | 0.362 | 0.301 | 0.277 | 0.325 | |||||
| DPA | Male (N = 720) | 0.057 | 0.055 | 0.060 | 0.058 | 0.052 | 0.063 | 0.055 | 0.043 | 0.944 | 0.003 |
| Female (N = 914) | 0.060 | 0.058 | 0.063 | 0.052 | 0.048 | 0.056 | |||||
| ALA | Male (N = 720) | 0.681 | 0.664 | 0.699 | 0.668 | 0.633 | 0.704 | 0.004 | 0.047 | 0.528 | <0.001 |
| Female (N = 914) | 0.754 | 0.738 | 0.771 | 0.687 | 0.654 | 0.720 | |||||
| ETA | Male (N = 720) | 0.020 | 0.019 | 0.021 | 0.020 | 0.018 | 0.022 | 0.047 | 0.053 | 0.976 | 0.003 |
| Female (N = 914) | 0.021 | 0.020 | 0.022 | 0.018 | 0.016 | 0.020 | |||||
| n-3/n-6 PUFAs | Male (N = 720) | 0.308 | 0.299 | 0.316 | 0.307 | 0.290 | 0.324 | 0.114 | 0.139 | 0.946 | 0.022 |
| ratio | Female (N = 914) | 0.306 | 0.298 | 0.314 | 0.286 | 0.272 | 0.300 | ||||
| n-6 PUFAs | Male (N = 720) | 4.927 | 4.819 | 5.036 | 4.933 | 4.719 | 5.147 | 0.102 | 0.089 | 0.964 | 0.013 |
| Female (N = 914) | 5.377 | 5.281 | 5.473 | 5.102 | 4.908 | 5.295 | |||||
| Without Depressive States (N = 1306) | With Depressive States (N = 327) | p1 a | p2 b | p3 cd | p4 d | ||||||
|---|---|---|---|---|---|---|---|---|---|---|---|
| Average | 95% CI | Average | 95% CI | ||||||||
| Lower | Upper | Lower | Upper | ||||||||
| Total n-3 PUFAs | Underweight/normal-weight (N = 1255) | 1.392 | 1.362 | 1.422 | 1.318 | 1.260 | 1.377 | <0.001 | 0.109 | 0.028 | 0.003 |
| Overweight/obese (N = 378) | 1.434 | 1.380 | 1.487 | 1.244 | 1.131 | 1.357 | |||||
| EPA+DHA | Underweight/normal-weight (N = 1255) | 0.544 | 0.525 | 0.564 | 0.518 | 0.480 | 0.557 | 0.005 | 0.083 | 0.235 | 0.010 |
| Overweight/obese (N = 378) | 0.559 | 0.524 | 0.594 | 0.451 | 0.376 | 0.525 | |||||
| EPA | Underweight/normal-weight (N = 1255) | 0.207 | 0.199 | 0.215 | 0.195 | 0.179 | 0.210 | 0.003 | 0.091 | 0.176 | 0.009 |
| Overweight/obese (N = 378) | 0.212 | 0.198 | 0.227 | 0.168 | 0.138 | 0.198 | |||||
| DHA | Underweight/normal-weight ( N = 1255) | 0.338 | 0.326 | 0.349 | 0.323 | 0.300 | 0.346 | 0.006 | 0.079 | 0.283 | 0.011 |
| Overweight/obese (N = 378) | 0.347 | 0.326 | 0.368 | 0.282 | 0.238 | 0.327 | |||||
| DPA | Underweight/normal-weight (N = 1255) | 0.059 | 0.057 | 0.061 | 0.056 | 0.052 | 0.060 | 0.007 | 0.094 | 0.260 | 0.013 |
| Overweight/obese (N = 378) | 0.060 | 0.056 | 0.064 | 0.049 | 0.041 | 0.057 | |||||
| ALA | Underweight/normal-weight (N = 1255) | 0.717 | 0.703 | 0.731 | 0.677 | 0.649 | 0.704 | 0.005 | 0.669 | 0.010 | 0.067 |
| Overweight/obese (N = 378) | 0.740 | 0.715 | 0.765 | 0.686 | 0.633 | 0.738 | |||||
| ETA | Underweight/normal-weight (N = 1255) | 0.020 | 0.020 | 0.021 | 0.019 | 0.018 | 0.021 | 0.007 | 0.119 | 0.221 | 0.016 |
| Overweight/obese (N = 378) | 0.021 | 0.020 | 0.022 | 0.017 | 0.014 | 0.020 | |||||
| n-3/n-6 PUFAs | Underweight/normal-weight (N = 1255) | 0.307 | 0.300 | 0.313 | 0.300 | 0.287 | 0.313 | 0.030 | 0.201 | 0.007 | 0.014 |
| ratio | Overweight/obese (N = 378) | 0.307 | 0.295 | 0.319 | 0.280 | 0.254 | 0.305 | ||||
| n-6 PUFAs | Underweight/normal-weight (N = 1255) | 5.148 | 5.065 | 5.232 | 5.018 | 4.854 | 5.181 | 0.079 | 0.647 | 0.162 | 0.211 |
| Overweight (N = 378) | 5.279 | 5.130 | 5.429 | 5.056 | 4.740 | 5.372 | |||||
| Weight Status | PUFAs | Male | Female | ||||||
|---|---|---|---|---|---|---|---|---|---|
| OR | 95% CI | p | OR | 95% CI | p * | ||||
| Lower | Upper | Lower | Upper | ||||||
| Underweight/normal-weight | Total n-3 PUFAs | 1.000 | 1.000 | 1.001 | 0.570 | 0.999 | 0.998 | 1.000 | 0.020 |
| EPA+DHA | 1.000 | 1.000 | 1.001 | 0.362 | 1.000 | 0.999 | 1.000 | 0.407 | |
| EPA | 1.001 | 0.999 | 1.003 | 0.383 | 0.999 | 0.997 | 1.001 | 0.330 | |
| DHA | 1.001 | 0.999 | 1.002 | 0.349 | 0.999 | 0.998 | 1.001 | 0.467 | |
| DPA | 1.005 | 0.996 | 1.013 | 0.317 | 0.998 | 0.990 | 1.005 | 0.544 | |
| ALA | 1.000 | 0.998 | 1.001 | 0.639 | 0.998 | 0.997 | 1.000 | 0.013 | |
| ETA | 1.011 | 0.988 | 1.034 | 0.364 | 0.994 | 0.975 | 1.014 | 0.550 | |
| n-3/n-6 PUFAs ratio | 1.691 | 0.143 | 20.050 | 0.677 | 0.544 | 0.080 | 3.719 | 0.535 | |
| n-6 PUFAs | 0.999 | 0.806 | 1.239 | 0.994 | 0.856 | 0.693 | 1.057 | 0.148 | |
| Overweight/obesity | Total n-3 PUFAs | 1.000 | 0.999 | 1.002 | 0.604 | 0.997 | 0.996 | 0.999 | 0.007 |
| EPA+DHA | 1.000 | 0.999 | 1.002 | 0.557 | 0.997 | 0.994 | 0.999 | 0.007 | |
| EPA | 1.001 | 0.997 | 1.005 | 0.547 | 0.991 | 0.985 | 0.997 | 0.005 | |
| DHA | 1.001 | 0.998 | 1.003 | 0.565 | 0.995 | 0.990 | 0.999 | 0.009 | |
| DPA | 1.004 | 0.989 | 1.020 | 0.579 | 0.968 | 0.944 | 0.992 | 0.009 | |
| ALA | 1.000 | 0.998 | 1.002 | 0.955 | 1.000 | 0.997 | 1.003 | 0.783 | |
| ETA | 1.009 | 0.970 | 1.050 | 0.640 | 0.922 | 0.866 | 0.982 | 0.012 | |
| n-3/n-6 PUFAs ratio | 2.856 | 0.063 | 130.369 | 0.590 | 0.001 | 0.001 | 0.011 | 0.003 | |
| n-6 PUFAs | 0.993 | 0.695 | 1.417 | 0.968 | 1.441 | 0.830 | 2.502 | 0.195 | |
© 2019 by the authors. Licensee MDPI, Basel, Switzerland. This article is an open access article distributed under the terms and conditions of the Creative Commons Attribution (CC BY) license (http://creativecommons.org/licenses/by/4.0/).
Share and Cite
Tsujiguchi, H.; Thi Thu Nguyen, T.; Goto, D.; Miyagi, S.; Kambayashi, Y.; Hara, A.; Yamada, Y.; Nakamura, H.; Shimizu, Y.; Hori, D.; et al. Relationship between the Intake of n-3 Polyunsaturated Fatty Acids and Depressive Symptoms in Elderly Japanese People: Differences According to Sex and Weight Status. Nutrients 2019, 11, 775. https://0-doi-org.brum.beds.ac.uk/10.3390/nu11040775
Tsujiguchi H, Thi Thu Nguyen T, Goto D, Miyagi S, Kambayashi Y, Hara A, Yamada Y, Nakamura H, Shimizu Y, Hori D, et al. Relationship between the Intake of n-3 Polyunsaturated Fatty Acids and Depressive Symptoms in Elderly Japanese People: Differences According to Sex and Weight Status. Nutrients. 2019; 11(4):775. https://0-doi-org.brum.beds.ac.uk/10.3390/nu11040775
Chicago/Turabian StyleTsujiguchi, Hiromasa, Thao Thi Thu Nguyen, Daisuke Goto, Sakae Miyagi, Yasuhiro Kambayashi, Akinori Hara, Yohei Yamada, Haruki Nakamura, Yukari Shimizu, Daisuke Hori, and et al. 2019. "Relationship between the Intake of n-3 Polyunsaturated Fatty Acids and Depressive Symptoms in Elderly Japanese People: Differences According to Sex and Weight Status" Nutrients 11, no. 4: 775. https://0-doi-org.brum.beds.ac.uk/10.3390/nu11040775