Drink Choice is Important: Beverages Make a Substantial Contribution to Energy, Sugar, Calcium and Vitamin C Intake among Australians


Abstract
:
1. Introduction
2. Materials and Methods
2.1. The Australian National Nutrition and Physical Activity Survey
2.2. Secondary Analysis Methodology
2.3. Statistical Analysis
3. Results
3.1. Assessment of Population Consumption
3.2. Assessment of Consumption by Consumers Only
4. Discussion
5. Conclusions
Supplementary Materials
Author Contributions
Funding
Acknowledgments
Conflicts of Interest
References
- FAO/WHO. Historical Overview of Food-based Dietary Guidelines. In FAO/WHO Technical Consultation on National Food-Based Dietary Guidelines; FAO/WHO: Cairo, Egypt, 2004; pp. 7–8. Available online: http://www.fao.org/3/ai216e/ai216e.pdf (accessed on 15 April 2019).
- Montagnese, C.; Santarpia, L.; Iavarone, F.; Strangio, F.; Caldera, A.R.; Silvestri, E.; Contaldo, F.; Pasanisi, F. North and South American countries food-based dietary guidelines: A comparison. Nutrition 2017, 42, 51–63. [Google Scholar] [CrossRef] [PubMed]
- Montagnese, C.; Santarpia, L.; Buonifacio, M.; Nardelli, A.; Caldera, A.R.; Silvestri, E.; Contaldo, F.; Pasanisi, F. European food-based dietary guidelines: A comparison and update. Nutrition 2015, 31, 908–915. [Google Scholar] [CrossRef] [PubMed]
- Singh, G.M.; Micha, R.; Khatibzadeh, S.; Shi, P.; Lim, S.; Andrews, K.G.; Engell, R.G.; Ezzati, M.; Mozzafarian, D. Global Burden of Diseases Nutrition and Chronic Diseases Expert Group (NutriCoDe). Global, regional and national consumption of sugar-sweetened beverages, fruit juices and milk: A systematic assessment of beverage intake in 187 countries. PLoS ONE 2015, 10, e0124845. [Google Scholar] [CrossRef] [PubMed]
- Guelinckx, I.; Ferreira-Pêgo, C.; Moreno, L.A.; Kavouras, S.A.; Gandy, J.; Martinez, H.; Bardosono, S.; Abdollahi, M.; Nasseri, E.; Jarosz, A.; et al. Intake of water and different beverages in adults across 13 countries. Eur. J. Nutr. 2015, 54, 45–55. [Google Scholar] [CrossRef] [PubMed] [Green Version]
- Guelinckx, I.; Iglesia, I.; Bottin, J.H.; De Miguel-Etayo, P.; González-Gil, E.M.; Salas-Salvadó, J.; Kavouras, S.A.; Gandy, J.; Martinez, H.; Bardosono, S.; et al. Intake of water and beverages of children and adolescents in 13 countries. Eur. J. Nutr. 2015, 54, S69–S79. [Google Scholar] [CrossRef]
- Chepulis, L.; Mearns, G.; Hill, S.; Wu, J.H.Y.; Crino, M.; Alderton, S.; Jenner, K. The nutritional content of supermarket beverages: A cross-sectional analysis of New Zealand, Australia, Canada and the UK. Public Health Nutr. 2018, 21, 2507–2516. [Google Scholar] [CrossRef]
- National Health and Medical Research Council. Australian Dietary Guidelines; National Health and Medical Research Council: Canberra, Australia, 2013.
- Popkin, B.M.; Armstrong, L.E.; Bray, G.M.; Cabellero, B.; Frei, B.; Willett, W.C. A new proposed guidance system for beverage consumption in the United States. Am. J. Clin. Nutr. 2006, 83, 529–542. [Google Scholar] [CrossRef]
- Khan, N.; Mukhtar, H. Tea polyphenols in promotion of human health. Nutrients 2019, 11, 39. [Google Scholar] [CrossRef]
- Rampersaud, G.C.; Valim, M.F. 100% citrus juice: Nutritional contribution, dietary benefits, and association with anthropometric measures. Crit. Rev. Food Sci. Nutr. 2017, 57, 129–140. [Google Scholar] [CrossRef]
- Gibson, S.; Shirreffs, S.M. Beverage consumption habits “24/7” among British adults: Association with total water intake and energy intake. Nutr. J. 2013, 12, 9. [Google Scholar] [CrossRef]
- Sui, Z.X.; Zheng, M.; Zhang, M.; Rangan, A. Water and beverage consumption: Analysis of the Australian 2011–2012 National Nutrition and Physical Activity Survey. Nutrients 2016, 8, 678. [Google Scholar] [CrossRef] [PubMed]
- Ng, S.W.; Ni Mhurchu, C.; Jebb, S.A.; Popkin, B.M. Patterns and trends of beverage consumption among children and adults in Great Britain, 1986–2009. Br. J. Nutr. 2012, 108, 536–551. [Google Scholar] [CrossRef] [PubMed]
- Stern, D.; Piernas, C.; Barquera, S.; Rivera, J.A.; Popkin, B.M. Caloric beverages were major sources of energy among children and adults in Mexico, 1999–2012. J. Nutr. 2014, 144, 949–956. [Google Scholar] [CrossRef] [PubMed]
- Sui, Z.X.; Wong, W.K.; Louie, J.C.Y.; Rangan, A. Discretionary food and beverage consumption and its association with demographic characteristics, weight status, and fruit and vegetable intakes in Australian adults. Public Health Nutr. 2017, 20, 274–281. [Google Scholar] [CrossRef]
- Hoare, E.; Varsamis, P.; Owen, N.; Dunstan, D.W.; Jennings, G.L.; Kingwell, B.A. Sugar- and intense-sweetened drinks in Australia: A systematic review on cardiometabolic risk. Nutrients 2017, 9, 1075. [Google Scholar] [CrossRef] [PubMed]
- Pollard, C.M.; Meng, X.; Hendrie, G.A.; Hendrie, D.; Sullivan, D.; Pratt, I.S.; Kerr, D.A.; Scott, J.A. Obesity, socio-demographic and attitudinal factors associated with sugar-sweetened beverage consumption: Australian evidence. Aust. N. Z. J. Public Health 2016, 40, 71–77. [Google Scholar] [CrossRef] [PubMed]
- Kit, B.K.; Fakhouri, T.H.I.; Park, S.; Neilsen, S.J.; Ogden, C.L. Trends in sugar-sweetened beverage consumption among youth and adults in the United States: 1999–2010. Am. J. Clin. Nutr. 2013, 98, 180–188. [Google Scholar] [CrossRef] [PubMed]
- O’Leary, F.; Hattersley, L.; King, L.; Allman-Farinelli, M. Sugary drink consumption behaviours among young adults at university. Nutr. Diet. 2012, 69, 119–123. [Google Scholar] [CrossRef]
- French, S.; Rosenberg, M.; Wood, L.; Maitland, C.; Shilton, T.; Pratt, I.S.; Buzzacott, P. Soft drink consumption patterns among Western Australians. J. Nutr. Educ. Behav. 2013, 45, 525–532. [Google Scholar] [CrossRef]
- Park, S.; Onufrak, S.; Blanck, H.M.; Sherry, B. Characteristics associated with the consumption of sports and energy drinks among US adults: National Health Interview Survey 2010. J. Acad. Nutr. Diet. 2013, 113, 112–119. [Google Scholar] [CrossRef]
- Friis, K.; Lyng, J.I.; Lasgaard, M.; Larsen, F.B. Energy drink consumption and the relation to socio-demographic factors and health behaviour among young adults in Denmark. A population based study. Eur. J. Public Health 2014, 24, 840–844. [Google Scholar] [CrossRef] [PubMed]
- Wymond, B.S.; Dickinson, K.M.; Riley, M.D. Alcoholic beverage intake throughout the week and contribution to dietary energy intake in Australian adults. Public Health Nutr. 2016, 19, 2592–2602. [Google Scholar] [CrossRef] [Green Version]
- Crowe-White, K.; O’Neil, C.E.; Parrott, J.S.; Benson-Davies, S.; Droke, E.; Gutschall, M.; Stote, K.S.; Wolfram, T.; Ziegler, P. Impact of 100% fruit juice consumption on diet and weight status of children: An evidence-based review. Crit. Rev. Food Sci. Nutr. 2016, 56, 871–884. [Google Scholar] [CrossRef]
- Wang, Y.; Lloyd, B.; Yang, M.; Davis, C.G.; Lee, S.G.; Lee, W.; Chung, S.J.; Chun, O. Impact of orange juice consumption on macronutrient and energy intakes and body composition in the US population. Public Health Nutr. 2012, 15, 2220–2227. [Google Scholar] [CrossRef] [PubMed] [Green Version]
- Rose, A.M.; Williams, R.A.; Rengers, B.; Kennel, J.A.; Gunther, C. Determining attitudinal and behavioral factors concerning milk and dairy intake and their association with calcium intake in college students. Nutr. Res. Prac. 2018, 12, 143–148. [Google Scholar] [CrossRef] [PubMed] [Green Version]
- Australian Bureau of Statistics 2018. National Health Survey: First Results, 2017–2018. Catalogue Number 4364.0.55.001. Available online: http://www.abs.gov.au (accessed on 15 April 2019).
- Sharma, Y.; Miller, M.; Shahi, R.; Doyle, A.; Horwood, C.; Hakendorf, P.; Thompson, C. Vitamin C deficiency in Australian hospitalized patients: An observational study. Intern. Med. J. 2019, 49, 189–196. [Google Scholar] [CrossRef] [PubMed]
- Australian Bureau of Statistics 2015. Australian Health Survey: Usual Nutrient Intakes, 2011–2012. Catalogue Number 4364.0.55.008. Available online: http://www.abs.gov.au (accessed on 15 April 2019).
- Baird, D.L.; Syrette, J.; Hendrie, G.A.; Riley, M.D.; Bowen, J.; Noakes, M. Dairy food intake of Australian children and adolescents 2–16 years of age: 2007 Australian National Children’s Nutrition and Physical Activity Survey. Public Health Nutr. 2012, 15, 2060–2073. [Google Scholar] [CrossRef] [PubMed]
- Fayet-Moore, F. Effect of flavored milk vs plain milk on total milk intake and nutrient provision in children. Nutr. Rev. 2016, 74, 1–17. [Google Scholar] [CrossRef]
- Chaloupka, F.J.; Powell, L.M.; Warner, K.E. The use of excise taxes to reduce tobacco, alcohol, and sugary beverage consumption. Annu. Rev. Public Health 2019, 40, 187–201. [Google Scholar] [CrossRef]
- Veerman, J.L.; Sacks, G.; Antonopoulos, N.; Martin, J. The impact of a tax on sugar-sweetened beverages on health and health care costs: A modelling study. PLoS ONE 2016, 11, e0151460. [Google Scholar] [CrossRef]
- Gupta, A.; Smithers, L.G.; Braunack-Mayer, A.; Harford, J. How much free sugar do Australians consume? Findings from a National survey. Aust. N. Z. J. Public Health 2018, 42, 533–540. [Google Scholar] [CrossRef]
- Thow, A.M.; Downs, S.; Jan, S. A systematic review of the effectiveness of food taxes and subsidies to improve diets: Understanding the recent evidence. Nutr. Rev. 2014, 72, 551–565. [Google Scholar] [CrossRef]
- Jithitikulchai, T.; Andreyeva, T. Sugar-sweetened beverage demand and tax simulation for Federal food assistance participants: A case study of two New England states. Appl. Health Econ. Health Policy 2018, 16, 549–558. [Google Scholar] [CrossRef] [PubMed]
- Lei, L.; Rangan, A.; Flood, V.M.; Louie, J.C.Y. Dietary intake and food sources of added sugar in the Australian population. Br. J. Nutr. 2016, 115, 868–877. [Google Scholar] [CrossRef] [PubMed] [Green Version]
- Leurs, L.J.; Schouten, L.J.; Goldbohm, R.A.; van den Brandt, P.A. Total fluid and specific beverage intake and mortality due to IHD and stroke in the Netherlands Cohort Study. Br. J. Nutr. 2010, 104, 1212–1221. [Google Scholar] [CrossRef] [PubMed] [Green Version]
- Drewnowski, A.; Rehm, C.D.; Constant, F. Water and beverage consumption among adults in the United States: Cross-sectional study using data from NHANES 2005–2010. BMC Public Health 2013, 13, 1068. [Google Scholar] [CrossRef] [PubMed]
- Gazan, R.; Sondey, J.; Maillot, M.; Guelinckx, I.; Lluch, A. Drinking water intake is associated with higher diet quality among French adults. Nutrients 2016, 8, 689. [Google Scholar] [CrossRef] [PubMed]
- Rodriguez-Ramirez, S.; de Cosio, T.G.; Mendez, M.A.; Tucker, K.L.; Mendez-Ramirez, I.; Hernandez-Cordero, S.; Popkin, B.M. A water and education provision intervention modifies the diet in overweight Mexican women in a randomized controlled trial. J. Nutr. 2015, 145, 1892–1899. [Google Scholar] [CrossRef]
- Stookey, J.J.D. Negative, null and beneficial effects of drinking water on energy intake, energy expenditure, fat oxidation and weight change in randomized trials: A qualitative review. Nutrients 2016, 8, 19. [Google Scholar] [CrossRef]
- Masood, A.; Alsheddi, L.; Alfayadh, L.; Bukhara, B.; Elawad, R.; Alfadda, A.A. Dietary and lifestyle factors serve as predictors of successful weight loss maintenance postbariatric surgery. J. Obes. 2019. [Google Scholar] [CrossRef] [PubMed]
- Tate, D.F.; Turner-McGrievy, G.; Lyons, E.; Stevens, J.; Erickson, K.; Polzien, K.; Diamond, M.; Wang, X.; Popkin, B. Replacing caloric beverages with water or diet beverages for weight loss in adults: Main results of the Choose Healthy Options Consciously Everyday (CHOICE) randomized clinical trial. Am. J. Clin. Nutr. 2012, 95, 555–563. [Google Scholar] [CrossRef] [PubMed]
- Nissensohn, M.; Sanchez-Villegas, A.; Galan, P.; Turrini, A.; Arnault, N.; Mistura, L.; Ortiz-Andrellucchi, A.; de Edelenyi, F.S.; D’Addezio, L.; Serra-Majem, L. Beverage consumption habits among the European population: Association with total water and energy intakes. Nutrients 2017, 9, 383. [Google Scholar] [CrossRef] [PubMed]
- Levy, G.S.; Shrapnel, W.S. Quenching Australia’s thirst: A trend analysis of water-based beverage sales from 1997 to 2011. Nutr. Diet. 2014, 71, 193–200. [Google Scholar] [CrossRef]
- Shi, Z.; Ruel, G.; Dal Grande, E.; Pilkington, R.; Taylor, A.W. Soft drink consumption and multimorbidity among adults. Clin. Nutr. ESPEN 2015, 10, e71–e76. [Google Scholar] [CrossRef] [PubMed]
- Lafontan, M.; Visscher, T.L.S.; Farpour-Lambert, N.; Yumak, V. Opportunities for intervention strategies for weight management: Global actions on fluid intake patterns. Obes. Facts 2015, 8, 54–76. [Google Scholar] [CrossRef] [PubMed]
- Rozin, P.; Gohar, D. The pleasures and memories of food and meals. In Handbook of Behavior, Food and Nutrition; Preedy, V.R., Watson, R., Martin, C., Eds.; Springer: New York, NY, USA, 2011; pp. 659–672. [Google Scholar] [CrossRef]
- Australian Bureau of Statistics 2014. Australian Health Survey: Users’ Guide, 2011–2013. Catalogue Number 4363.0.55.001. Available online: http://www.abs.gov.au (accessed on 15 April 2019).
- Rennie, K.L.; Coward, J.; Jebb, S.A. Estimating under-reporting of energy intake in dietary surveys using an individualised method. Br. J. Nutr. 2007, 97, 1169–1176. [Google Scholar] [CrossRef] [Green Version]
- Patterson, R.E.; Pietinen, P. Assessment of nutritional status in individuals and populations. In Public Health Nutrition; Gibney, M.J., Margetts, B.M., Kearney, J.M., Arab, L., Eds.; Blackwell Science: Oxford, UK, 2004; pp. 66–84. [Google Scholar]


 ) and adults (19 years and older,
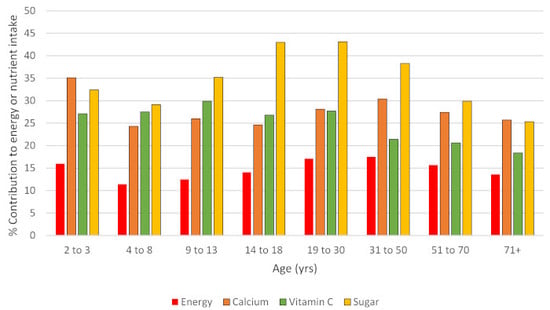
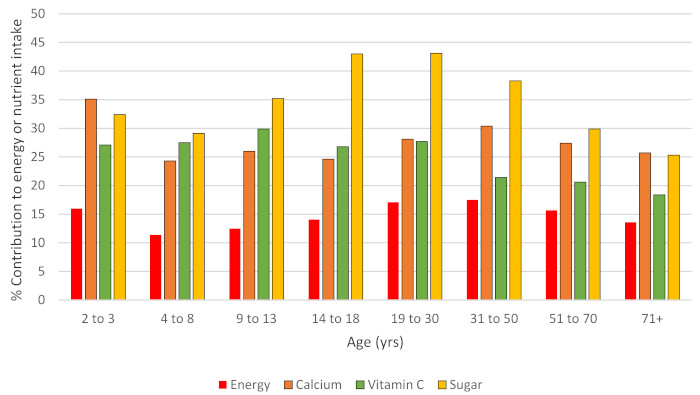
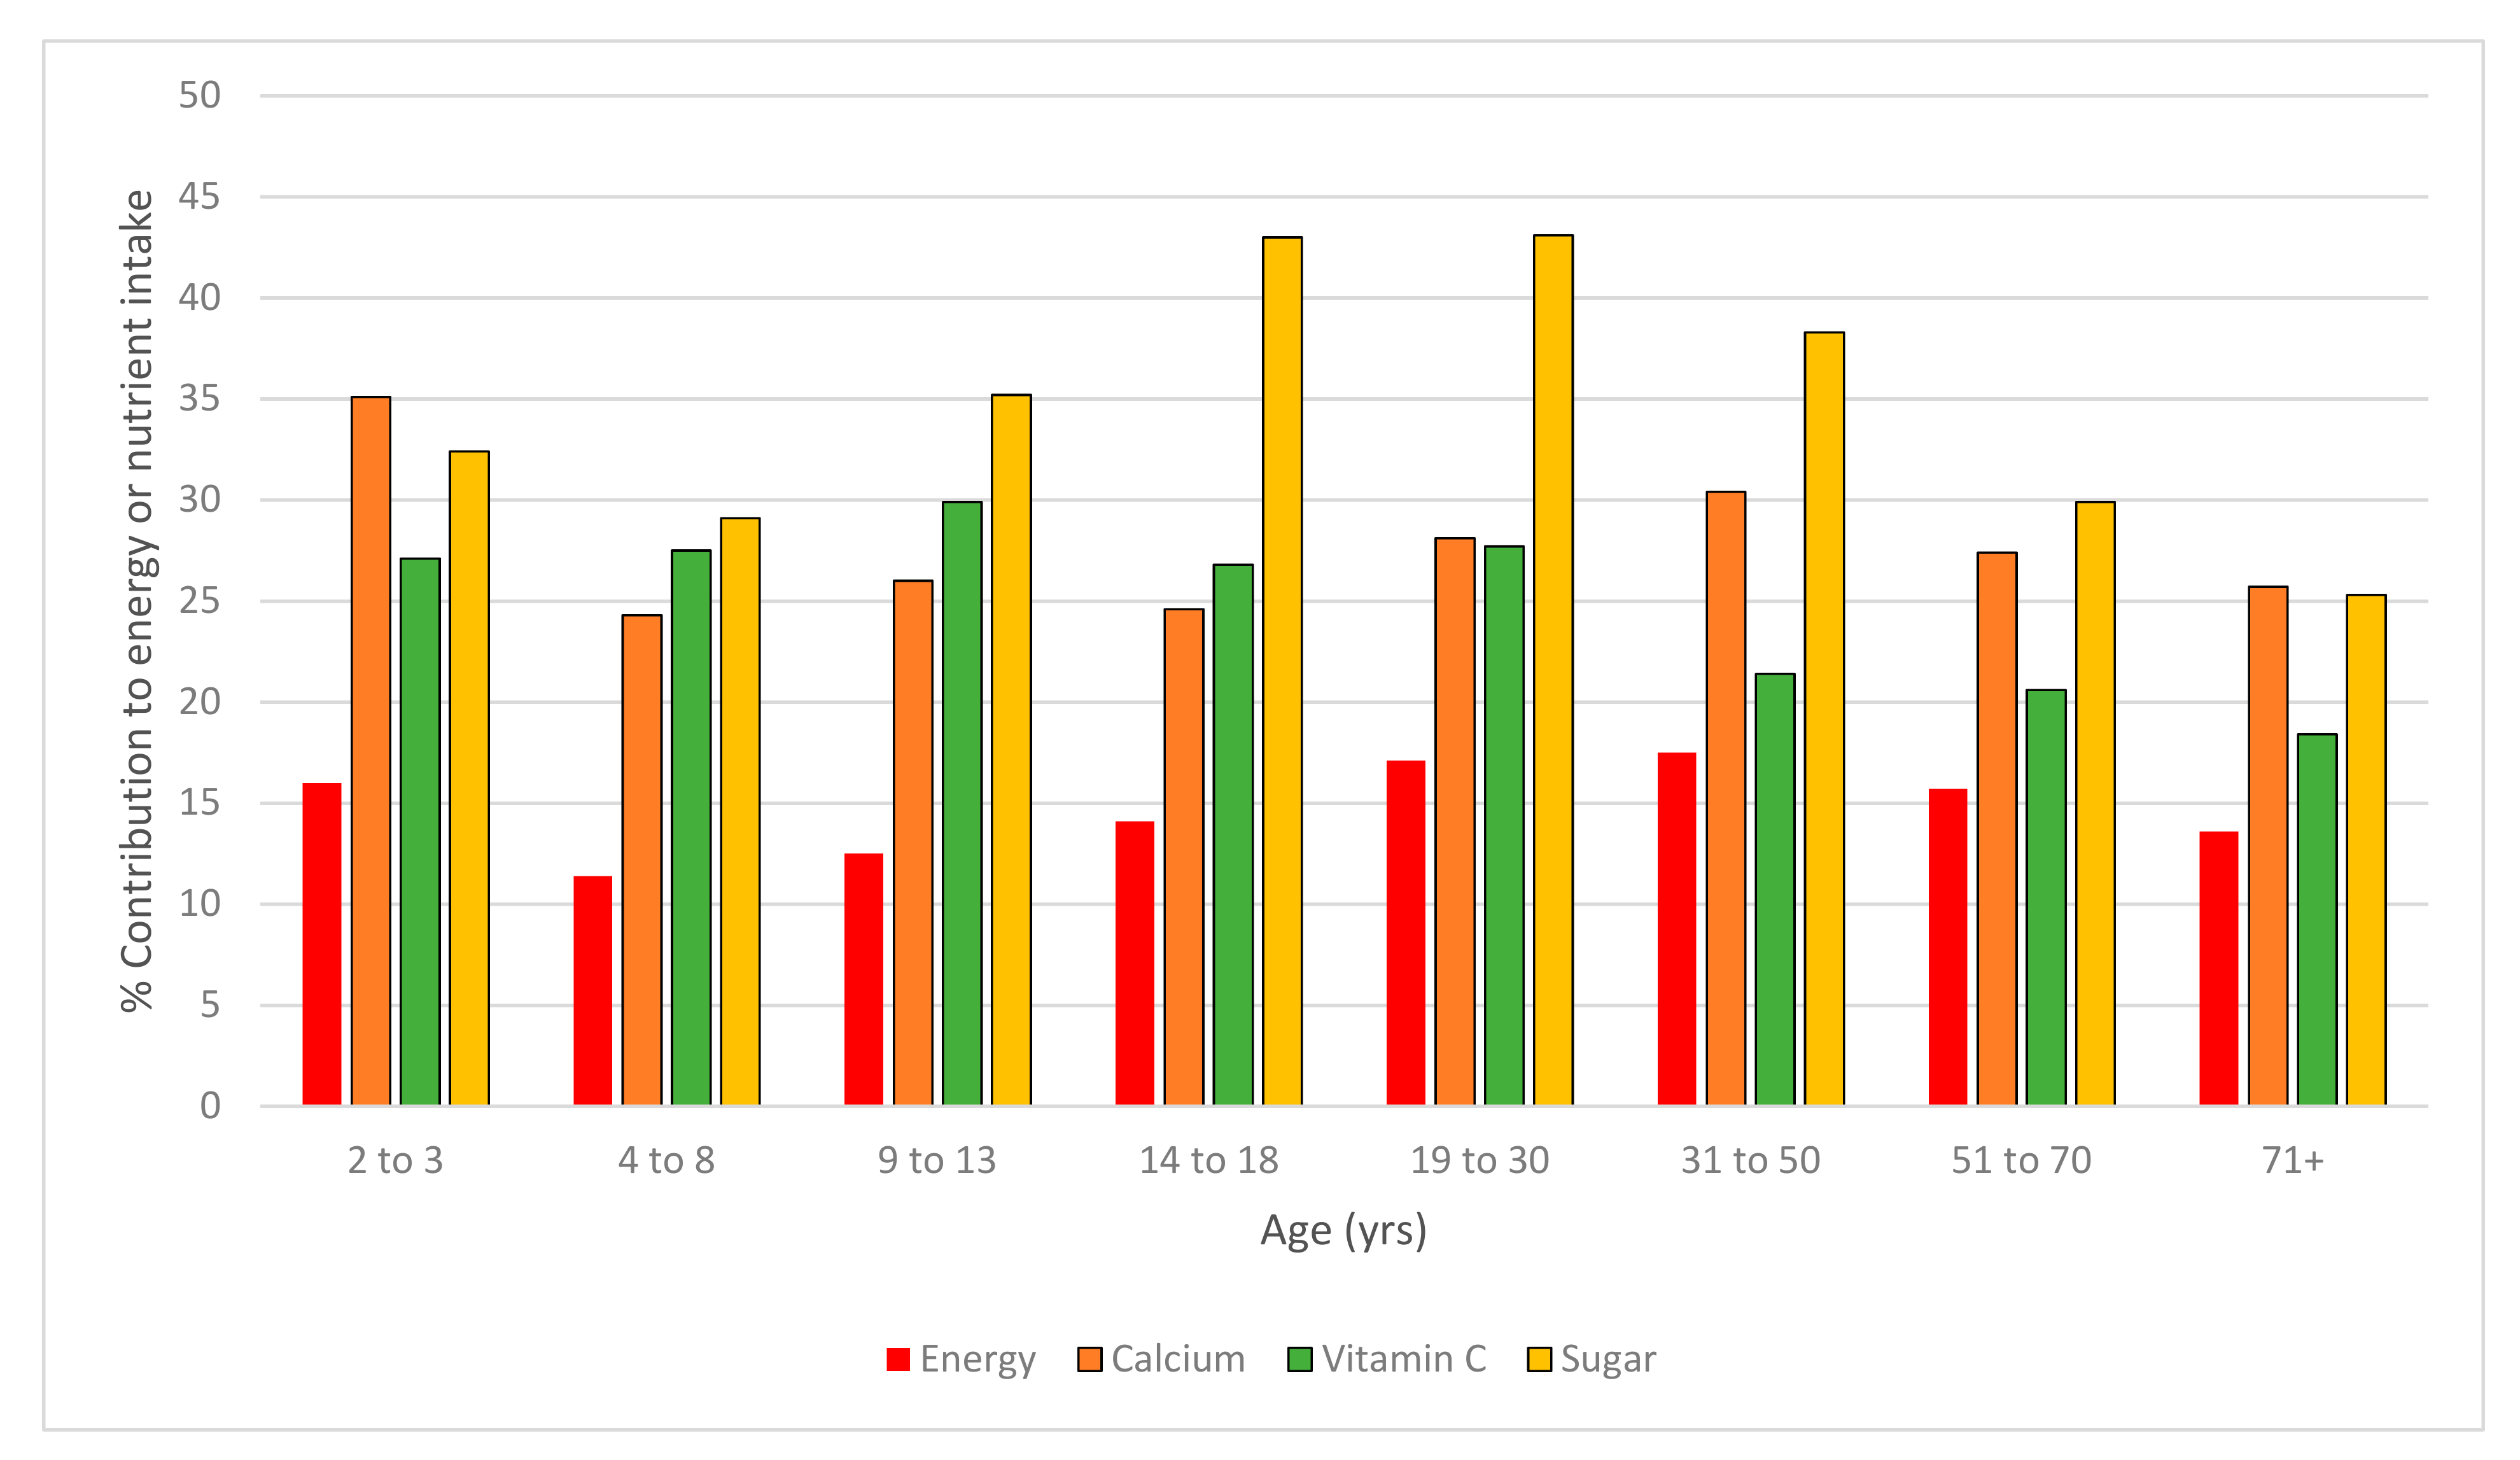
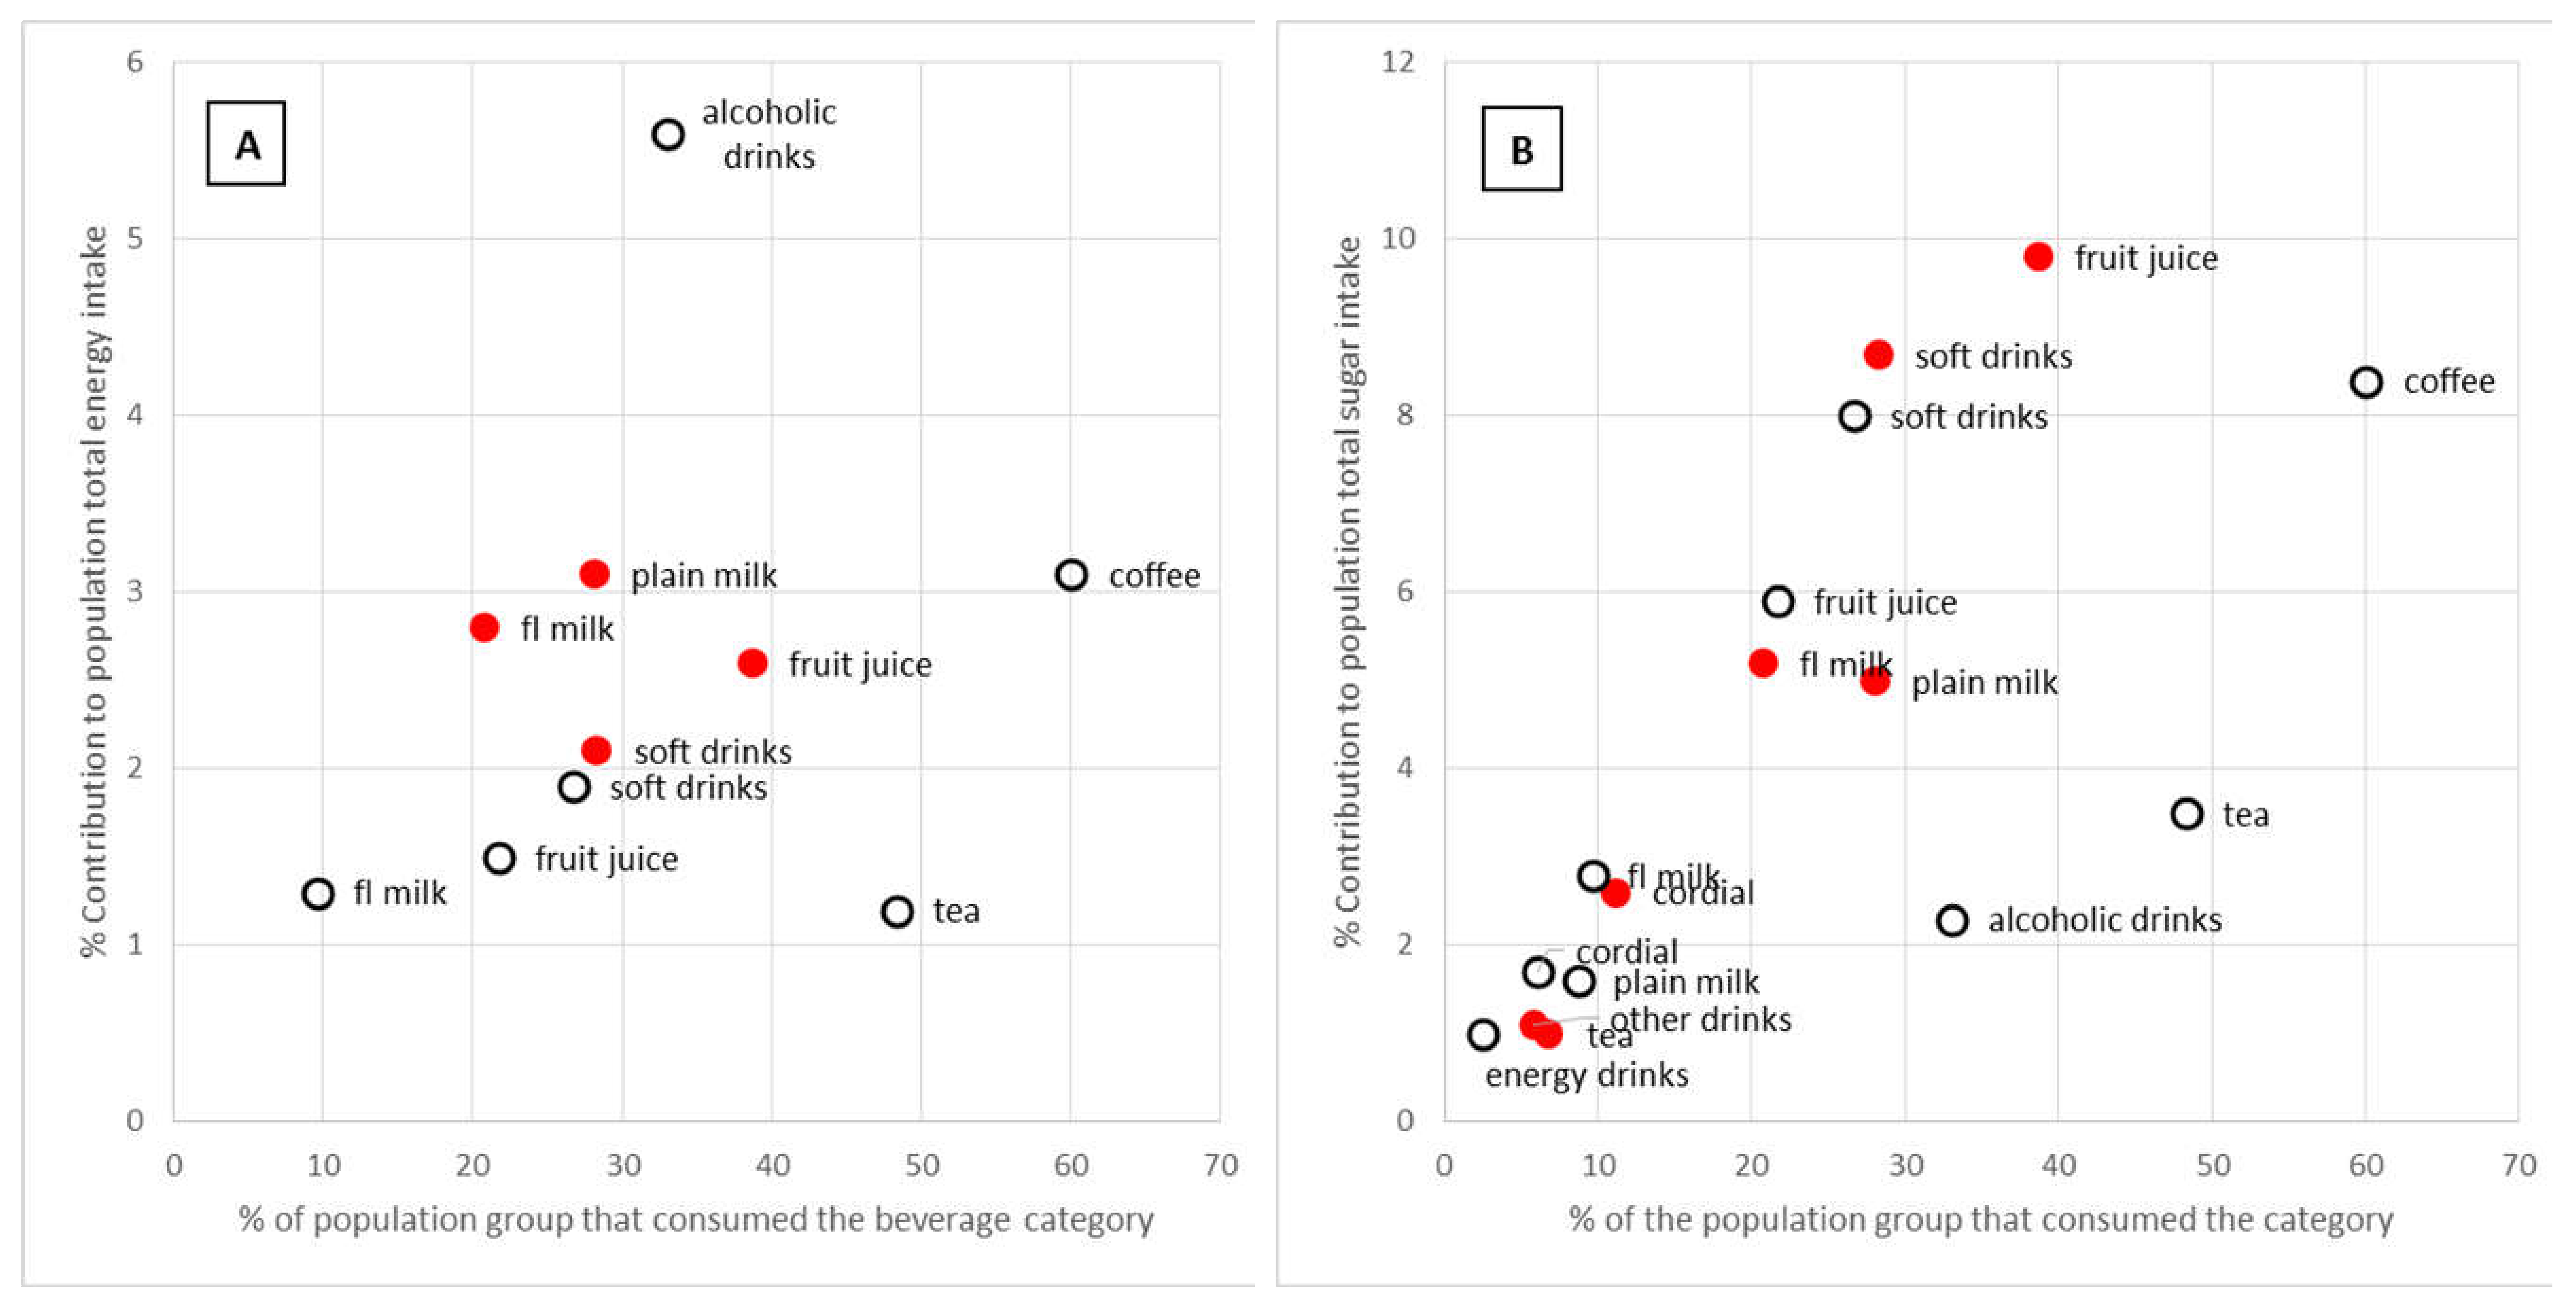
  ) by the prevalence of consumption on the day of the survey. Only categories contributing 1% or more to the total energy or nutrient intake are shown.
) and adults (19 years and older, ) by the prevalence of consumption on the day of the survey. Only categories contributing 1% or more to the total energy or nutrient intake are shown.
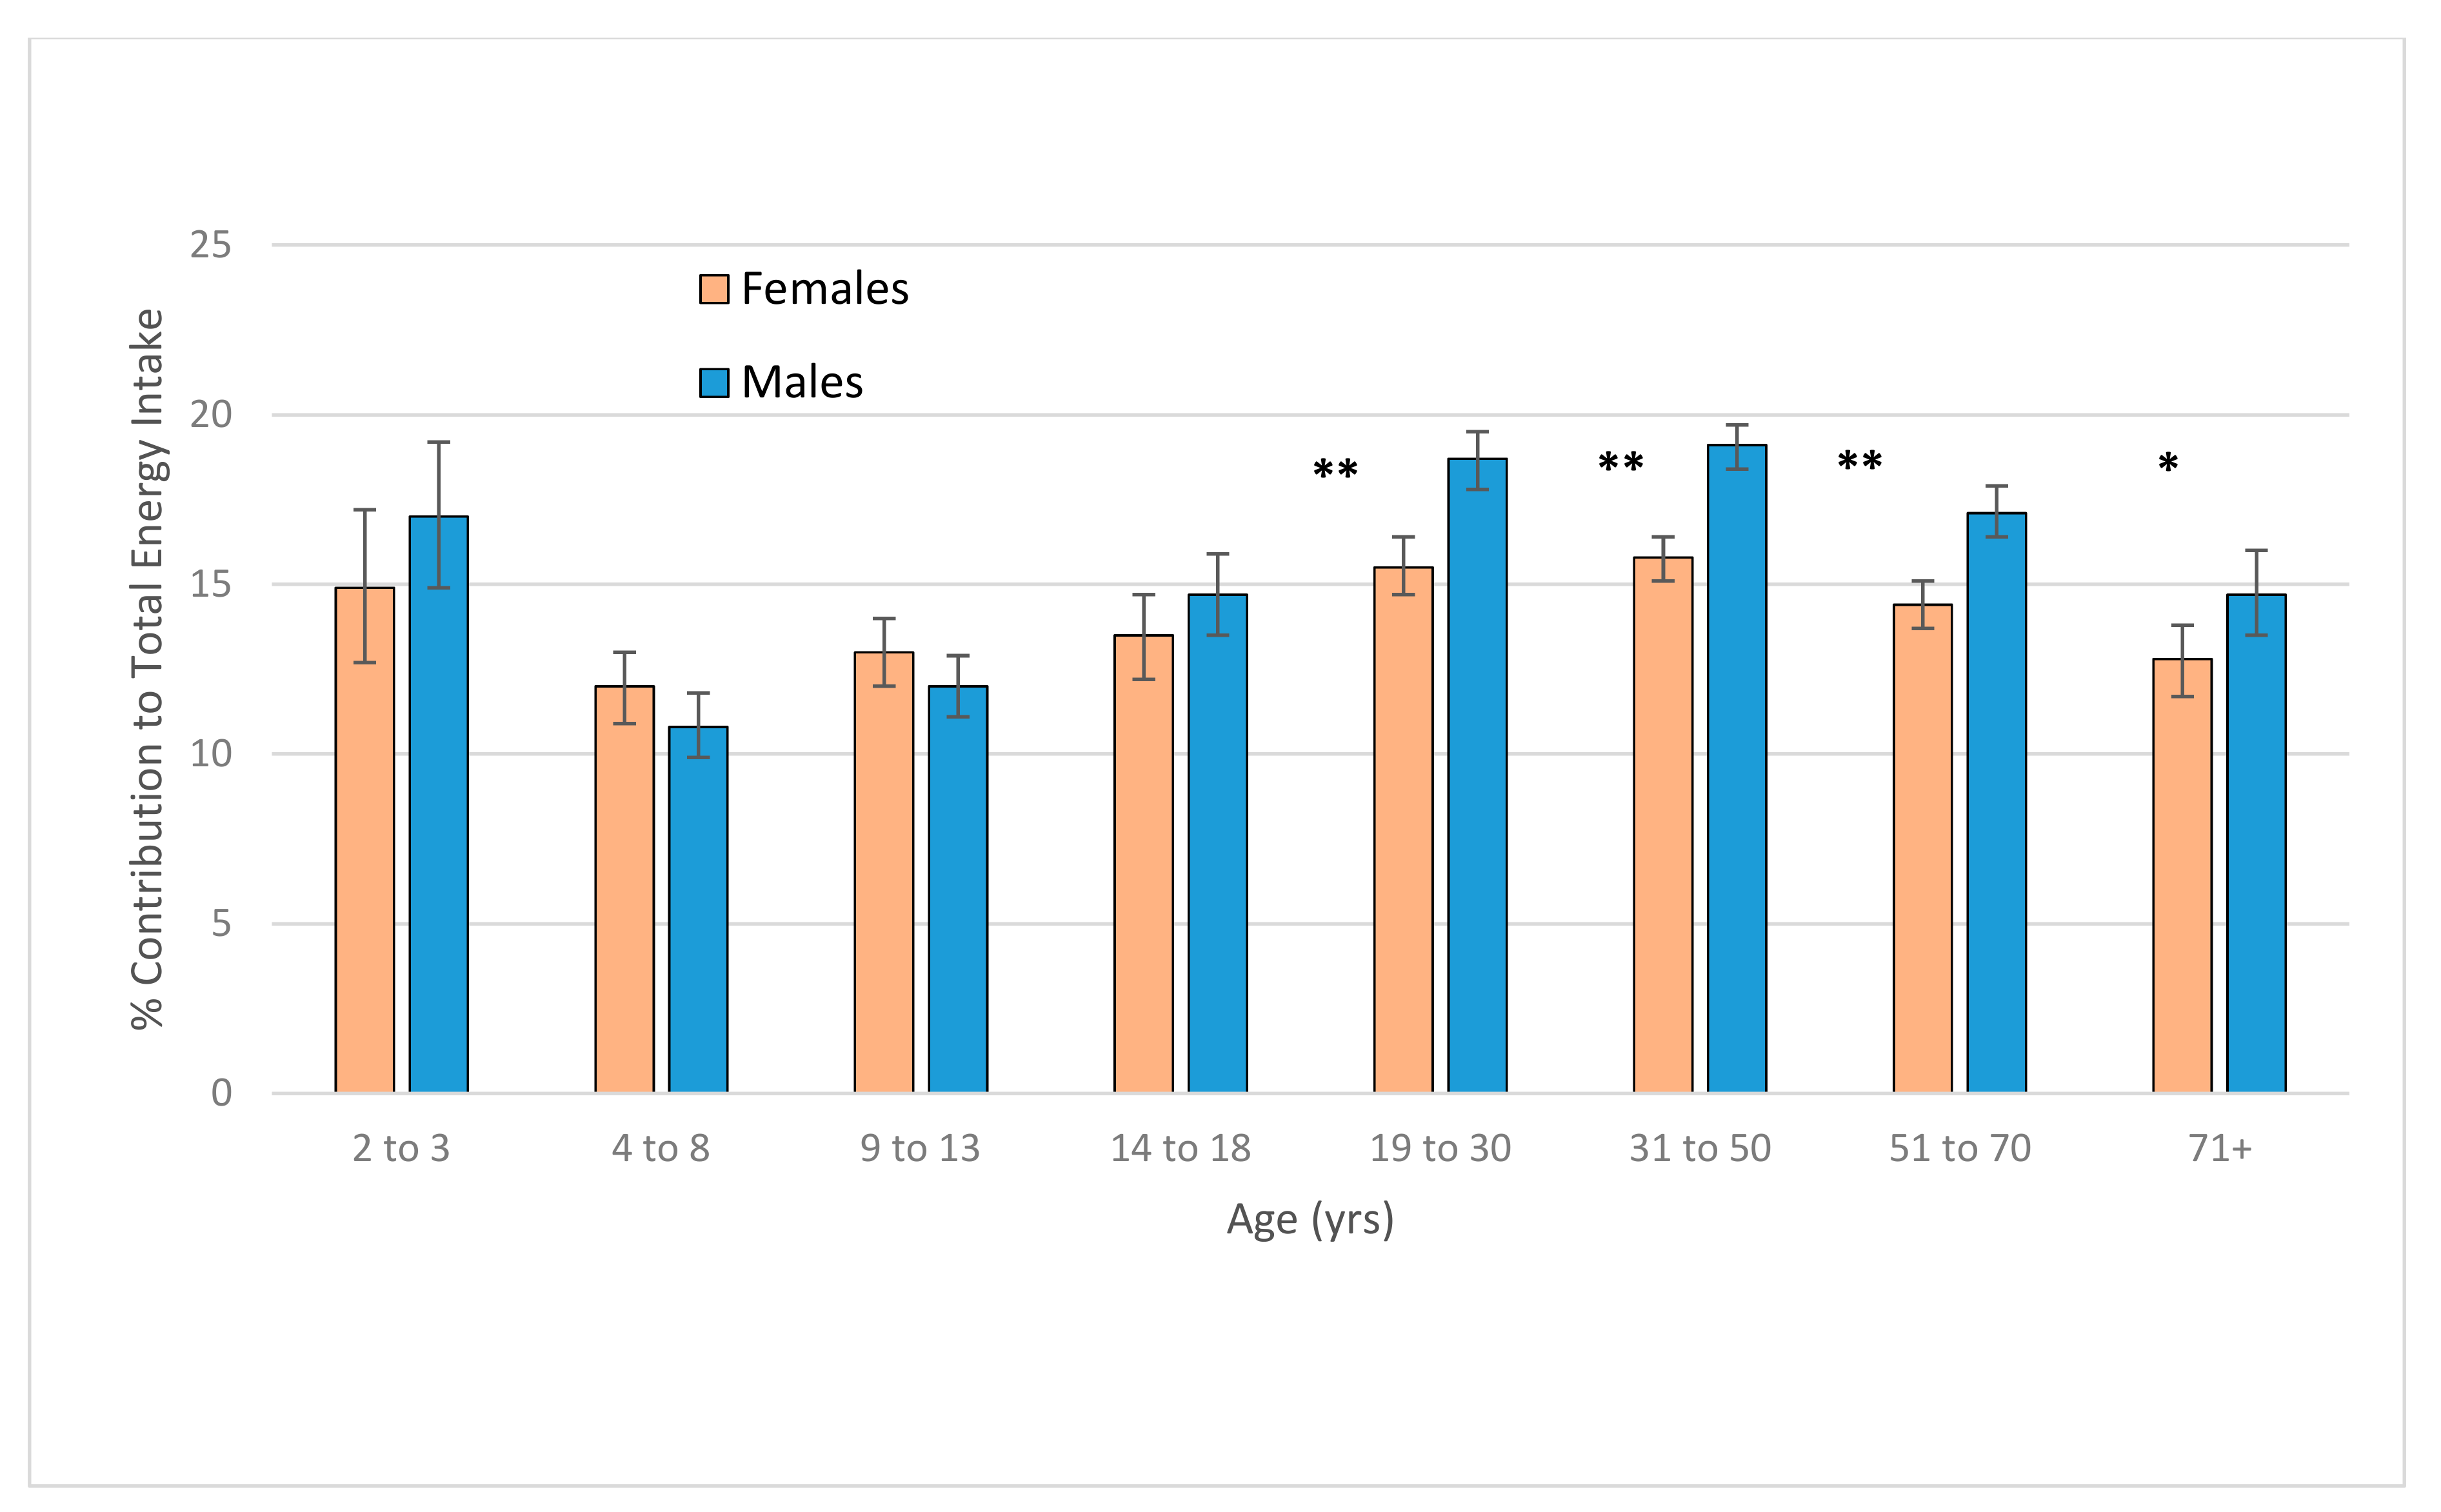
) by the prevalence of consumption on the day of the survey. Only categories contributing 1% or more to the total energy or nutrient intake are shown.
) and adults (19 years and older, ) by the prevalence of consumption on the day of the survey. Only categories contributing 1% or more to the total energy or nutrient intake are shown. ) and adults (19 years and older, ) by the prevalence of consumption on the day of the survey. Only categories contributing 1% or more to the total nutrient intake are shown.
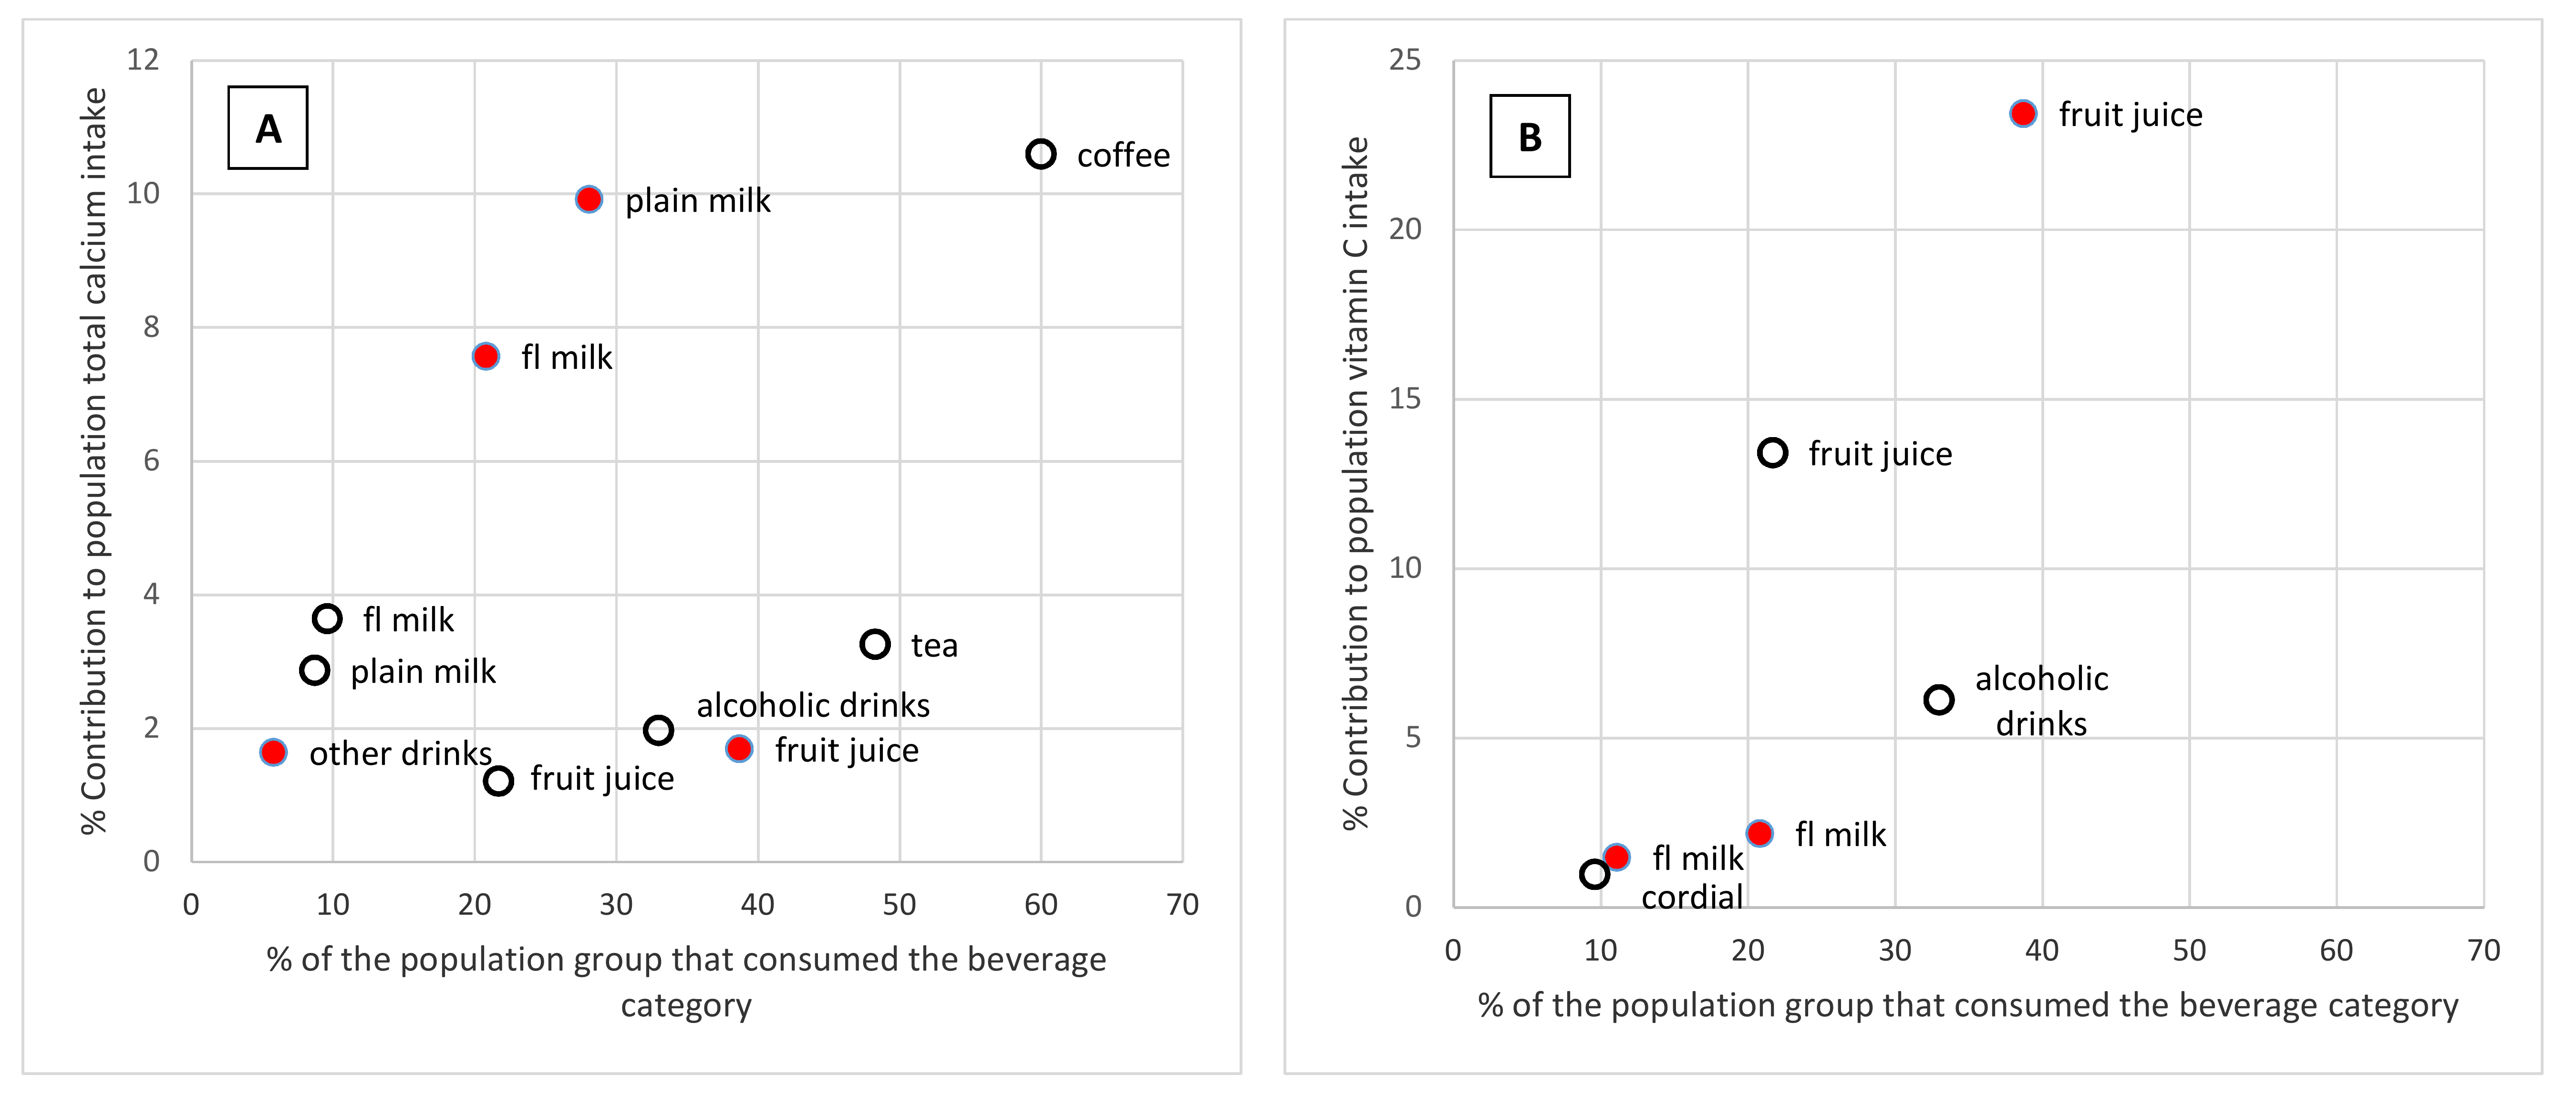
) and adults (19 years and older, ) by the prevalence of consumption on the day of the survey. Only categories contributing 1% or more to the total nutrient intake are shown.
) and adults (19 years and older, ) by the prevalence of consumption on the day of the survey. Only categories contributing 1% or more to the total nutrient intake are shown.

| Beverage Category | Description |
|---|---|
| Alcoholic beverages | All beverages that include any alcohol content. Mixers were included in the category, but any alcoholic beverage used as an ingredient in food was not included. |
| Tea | All home-brewed tea plus all additions (milk, sugar, water) were included. |
| Coffee | Hot coffee plus all additions (milk, sugar) were included. Cold coffee-flavoured milk beverages were categorised as flavoured milks. |
| Soft drink | All flavoured carbonated beverages whether sugar-sweetened or sweetened with other sweetening agents. Energy drinks were not included. |
| Cordial | All flavoured drinks made up with water from a concentrate. |
| Energy drinks | All electrolyte (‘sport’ drinks) and energy drinks. |
| Fruit juices | All fruit and vegetable juices (non-carbonated), regardless of their dilution. Includes infant drinks based on fruit or vegetables. |
| Plain milk | Plain white milk without flavouring or additives, regardless of fat content. Milk used as an ingredient for food is not included; milk as an ingredient of beverages was included in the respective categories. |
| Flavoured milk | All flavoured milk (hot or cold) whether as purchased or produced through adding powdered or liquid flavouring to milk. |
| Milk alternatives | Plain or flavoured dairy milk alternatives such as soy milk and nut milks. Not used in food or as an addition to other beverage category. |
| Other beverages | Powdered flavourings with water, probiotic drinks, breakfast cereal beverages. |
| Water | All water consumed as a drink but not included in any other beverage category. Includes carbonated and still water. |
© 2019 by the authors. Licensee MDPI, Basel, Switzerland. This article is an open access article distributed under the terms and conditions of the Creative Commons Attribution (CC BY) license (http://creativecommons.org/licenses/by/4.0/).
Share and Cite
Riley, M.D.; Hendrie, G.A.; Baird, D.L. Drink Choice is Important: Beverages Make a Substantial Contribution to Energy, Sugar, Calcium and Vitamin C Intake among Australians. Nutrients 2019, 11, 1389. https://0-doi-org.brum.beds.ac.uk/10.3390/nu11061389
Riley MD, Hendrie GA, Baird DL. Drink Choice is Important: Beverages Make a Substantial Contribution to Energy, Sugar, Calcium and Vitamin C Intake among Australians. Nutrients. 2019; 11(6):1389. https://0-doi-org.brum.beds.ac.uk/10.3390/nu11061389
Chicago/Turabian StyleRiley, Malcolm D., Gilly A. Hendrie, and Danielle L. Baird. 2019. "Drink Choice is Important: Beverages Make a Substantial Contribution to Energy, Sugar, Calcium and Vitamin C Intake among Australians" Nutrients 11, no. 6: 1389. https://0-doi-org.brum.beds.ac.uk/10.3390/nu11061389